page 1 of 40 - bossanovatech.com · page 1 of 40 bossa nova technologies tel: (310) 577-8113 11922...
TRANSCRIPT
Page 1 of 40
Bossa Nova Technologies Tel: (310) 577-8113 11922 Jefferson Blvd. Fax: (310) 943-3280 CULVER CITY CA 90230 www.bossanovatech.com USA [email protected]
Page 2 of 40
Bossa Nova Technologies Tel: (310) 577-8113 11922 Jefferson Blvd. Fax: (310) 943-3280 CULVER CITY CA 90230 www.bossanovatech.com USA [email protected]
This Manual describes MAMBO hardware and software. Use this manual as a reference when working with your MAMBO. About MAMBO: MAMBO is a turnkey imaging system dedicated to hair color identification. Application of the MAMBO ranges from claim substantiation and color efficacy testing, to basic analysis of hair coloring and quality control.
Bossa Nova Technologies reserves the right to make changes to this manual and to the items described therein without notice. Bossa Nova has taken considerable effort to ensure that the information in this manual is accurate and complete. However, Bossa Nova Technologies will not be liable for any technical or editorial errors or omissions made herein or for incidental, special or consequential damages of any nature resulting from the furnishing of this manual, or operation and performance of equipment in connection with this manual.
Page 3 of 40
Bossa Nova Technologies Tel: (310) 577-8113 11922 Jefferson Blvd. Fax: (310) 943-3280 CULVER CITY CA 90230 www.bossanovatech.com USA [email protected]
1. QUICK START ...................................................................................... 4
1.1. Unpacking .............................................................................................. 4
1.2. Connecting............................................................................................. 4
1.3. Starting measurement and analysis with MAMBO ................................. 6
1.4. Hardware check-up ................................................................................ 8
2. BOLERO SOFTWARE ............................................................................ 9
2.1. Live image ............................................................................................. 9
2.2. Measurement ...................................................................................... 11
2.2.1. Live Tab ................................................................................................ 12
2.2.2. Statistical Tab ....................................................................................... 13
2.2.3. Options Tab .......................................................................................... 17
2.2.4. Cielab Tab ............................................................................................ 18
2.2.5. Live Only/Statistical button .................................................................. 23
2.3. Analysis ............................................................................................... 24
2.3.1. COLOR ID .............................................................................................. 24
2.3.2. DATABASE ............................................................................................ 27
2.3.3. WORKSHEET ......................................................................................... 33
2.3.4. COLOR CONSISTENCY ............................................................................ 34
3. Technical Background ....................................................................... 37
3.1. Closest color ........................................................................................ 37
3.2. Match .................................................................................................. 37
4. Specifications ................................................................................... 40
Page 4 of 40
Bossa Nova Technologies Tel: (310) 577-8113 11922 Jefferson Blvd. Fax: (310) 943-3280 CULVER CITY CA 90230 www.bossanovatech.com USA [email protected]
1. QUICK START
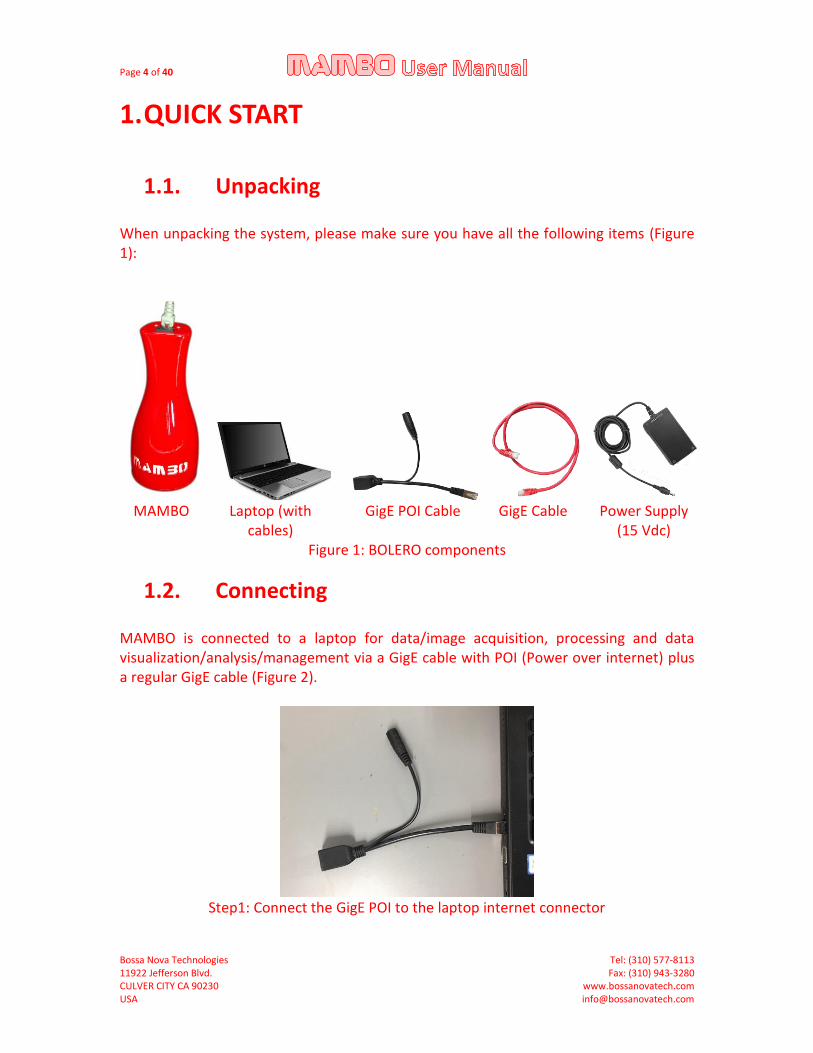
1.1. Unpacking When unpacking the system, please make sure you have all the following items (Figure 1):
MAMBO Laptop (with
cables) GigE POI Cable GigE Cable Power Supply
(15 Vdc) Figure 1: BOLERO components
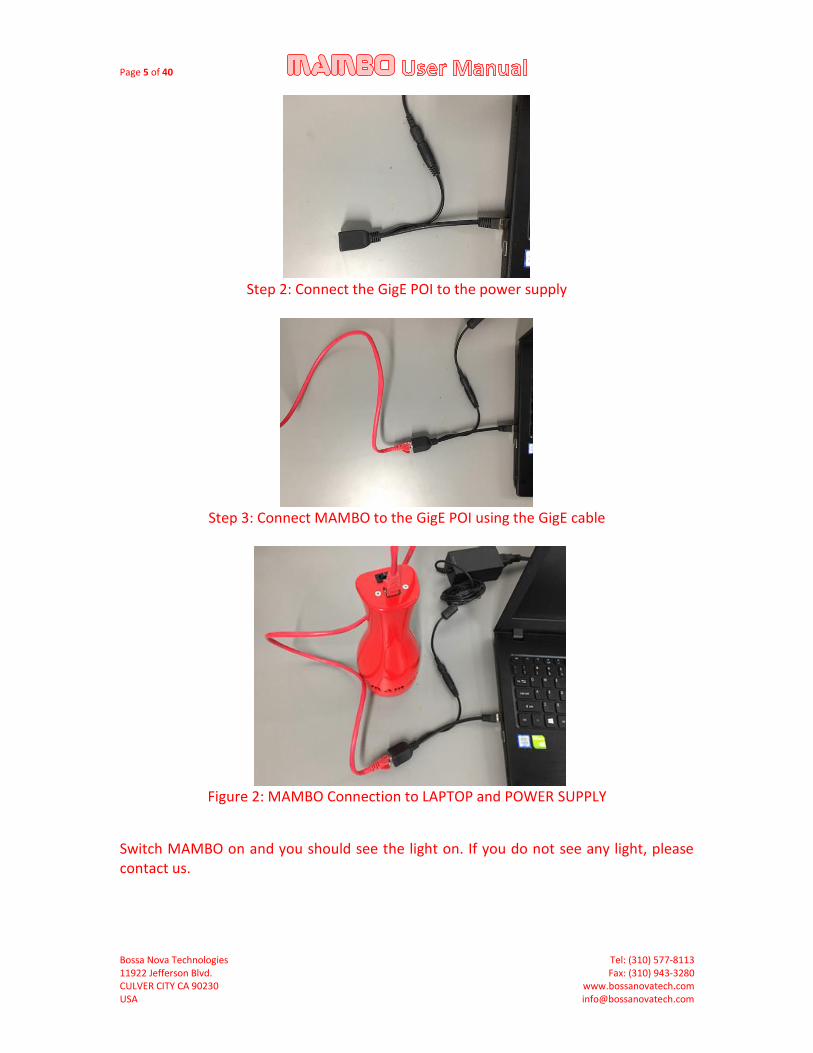
1.2. Connecting MAMBO is connected to a laptop for data/image acquisition, processing and data visualization/analysis/management via a GigE cable with POI (Power over internet) plus a regular GigE cable (Figure 2).
Step1: Connect the GigE POI to the laptop internet connector
Page 5 of 40
Bossa Nova Technologies Tel: (310) 577-8113 11922 Jefferson Blvd. Fax: (310) 943-3280 CULVER CITY CA 90230 www.bossanovatech.com USA [email protected]
Step 2: Connect the GigE POI to the power supply
Step 3: Connect MAMBO to the GigE POI using the GigE cable
Figure 2: MAMBO Connection to LAPTOP and POWER SUPPLY
Switch MAMBO on and you should see the light on. If you do not see any light, please contact us.

Page 6 of 40
Bossa Nova Technologies Tel: (310) 577-8113 11922 Jefferson Blvd. Fax: (310) 943-3280 CULVER CITY CA 90230 www.bossanovatech.com USA [email protected]
1.3. Starting measurement and analysis with MAMBO
Switch MAMBO on and start the laptop. MAMBO icon shortcut is on the desktop Figure 3).
Figure 3: BOLERO shortcut
Click on MAMBO icon. The following window pops-up (Figure 4).
Figure 4: BOLERO pop-up window
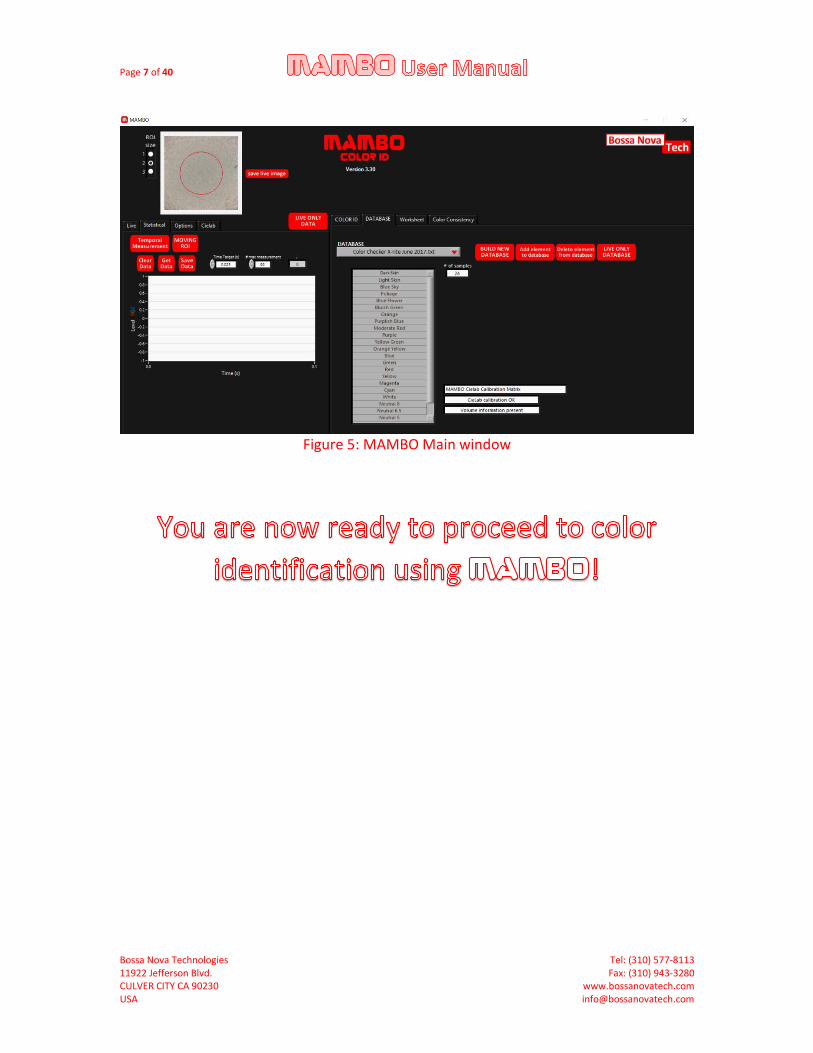
After few seconds of initialization and hardware check-up, MAMBO main window appears (Figure 5).
Page 7 of 40
Bossa Nova Technologies Tel: (310) 577-8113 11922 Jefferson Blvd. Fax: (310) 943-3280 CULVER CITY CA 90230 www.bossanovatech.com USA [email protected]
Figure 5: MAMBO Main window
Page 8 of 40
Bossa Nova Technologies Tel: (310) 577-8113 11922 Jefferson Blvd. Fax: (310) 943-3280 CULVER CITY CA 90230 www.bossanovatech.com USA [email protected]
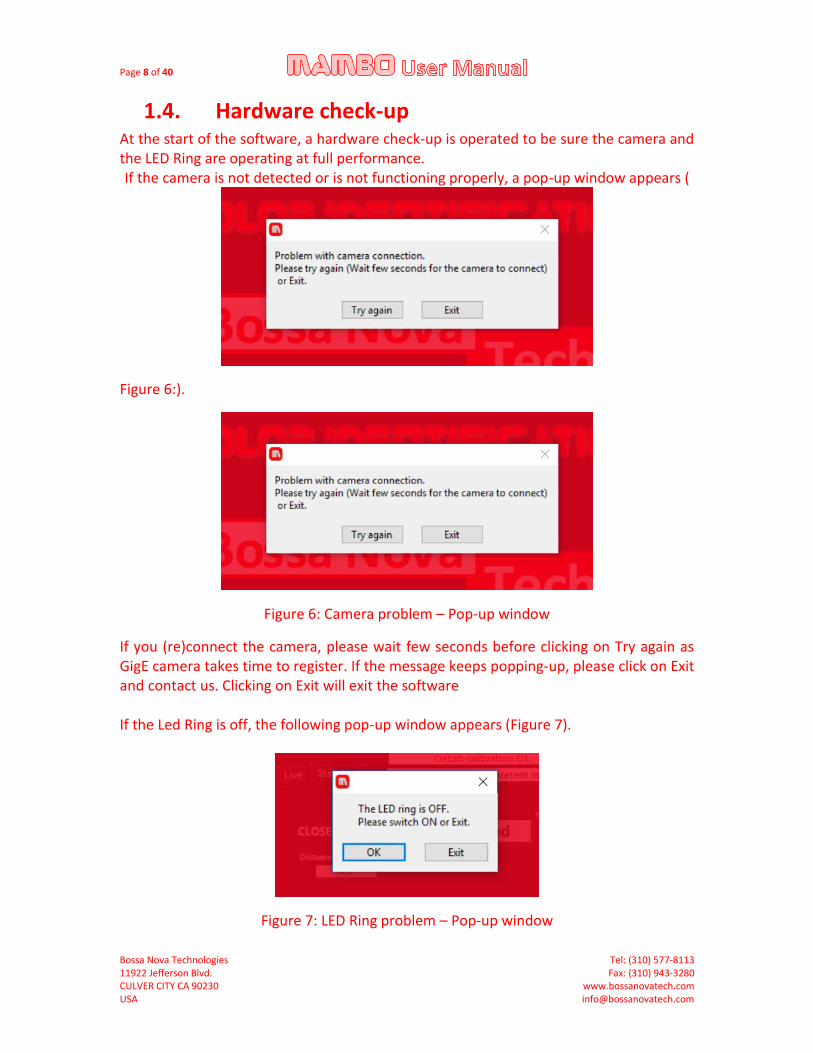
1.4. Hardware check-up At the start of the software, a hardware check-up is operated to be sure the camera and the LED Ring are operating at full performance. If the camera is not detected or is not functioning properly, a pop-up window appears (
Figure 6:).
Figure 6: Camera problem – Pop-up window
If you (re)connect the camera, please wait few seconds before clicking on Try again as GigE camera takes time to register. If the message keeps popping-up, please click on Exit and contact us. Clicking on Exit will exit the software If the Led Ring is off, the following pop-up window appears (Figure 7).
Figure 7: LED Ring problem – Pop-up window
Page 9 of 40
Bossa Nova Technologies Tel: (310) 577-8113 11922 Jefferson Blvd. Fax: (310) 943-3280 CULVER CITY CA 90230 www.bossanovatech.com USA [email protected]
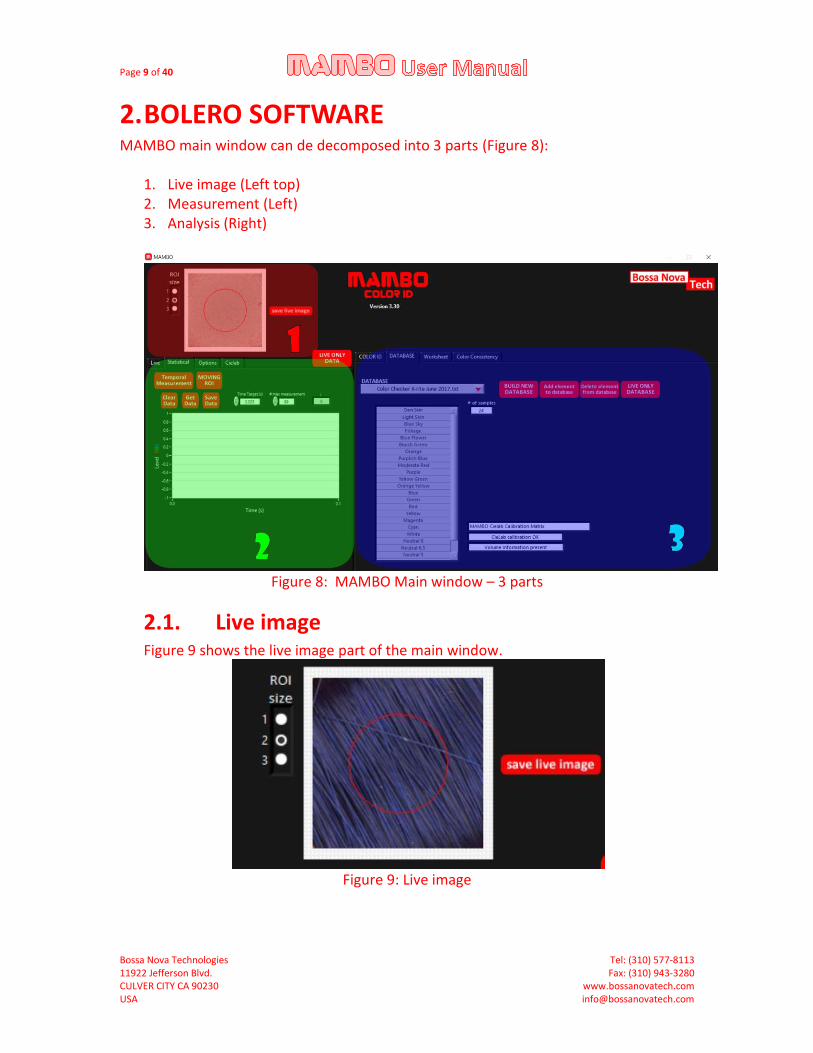
2. BOLERO SOFTWARE MAMBO main window can de decomposed into 3 parts (Figure 8):
1. Live image (Left top) 2. Measurement (Left) 3. Analysis (Right)
Figure 8: MAMBO Main window – 3 parts
2.1. Live image Figure 9 shows the live image part of the main window.
Figure 9: Live image
Page 10 of 40
Bossa Nova Technologies Tel: (310) 577-8113 11922 Jefferson Blvd. Fax: (310) 943-3280 CULVER CITY CA 90230 www.bossanovatech.com USA [email protected]
On the left of the live image is the ROI (Region Of Interest) selection that adjust the size of the measurement area. 3 sizes (1, 2 and 3, from small to large) are selectable. The ROI is circular and is depicted in RED in the live image. The table below summarizes the diameter and area of each ROI size.
ROI Diameter Area
1 4.5 mm (~ 3/16 “) 16 mm2 (0.024 square inch)
2 6.5 mm (~ 1/4”) 33 mm2 (0.05 square inch)
3 10 mm (~ 25/64”) 78 mm2 (0.12 square inch)
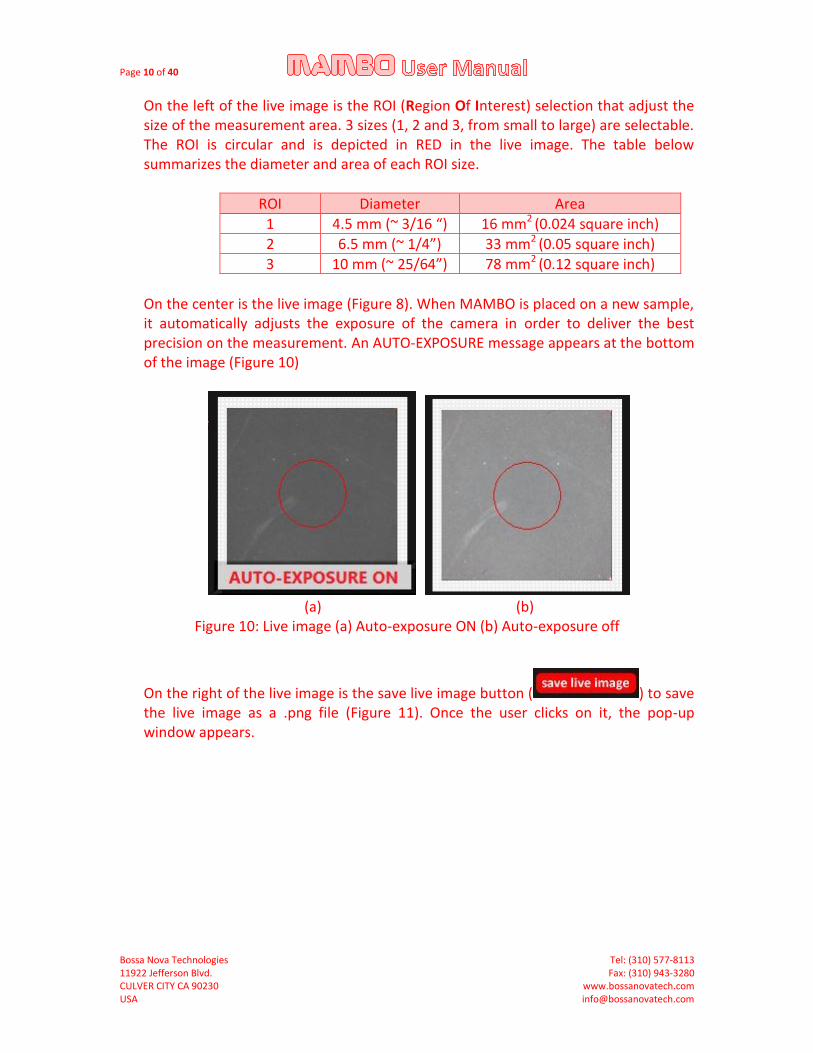
On the center is the live image (Figure 8). When MAMBO is placed on a new sample, it automatically adjusts the exposure of the camera in order to deliver the best precision on the measurement. An AUTO-EXPOSURE message appears at the bottom of the image (Figure 10)
(a) (b)
Figure 10: Live image (a) Auto-exposure ON (b) Auto-exposure off
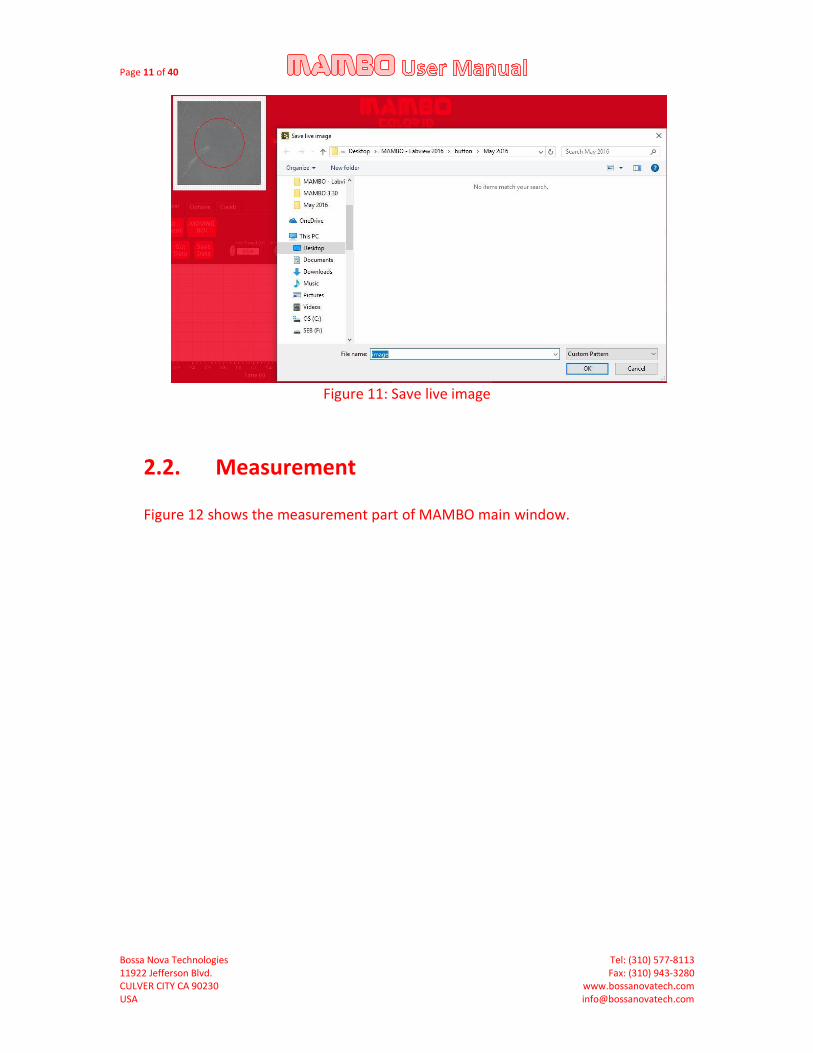
On the right of the live image is the save live image button ( ) to save the live image as a .png file (Figure 11). Once the user clicks on it, the pop-up window appears.
Page 11 of 40
Bossa Nova Technologies Tel: (310) 577-8113 11922 Jefferson Blvd. Fax: (310) 943-3280 CULVER CITY CA 90230 www.bossanovatech.com USA [email protected]
Figure 11: Save live image
2.2. Measurement
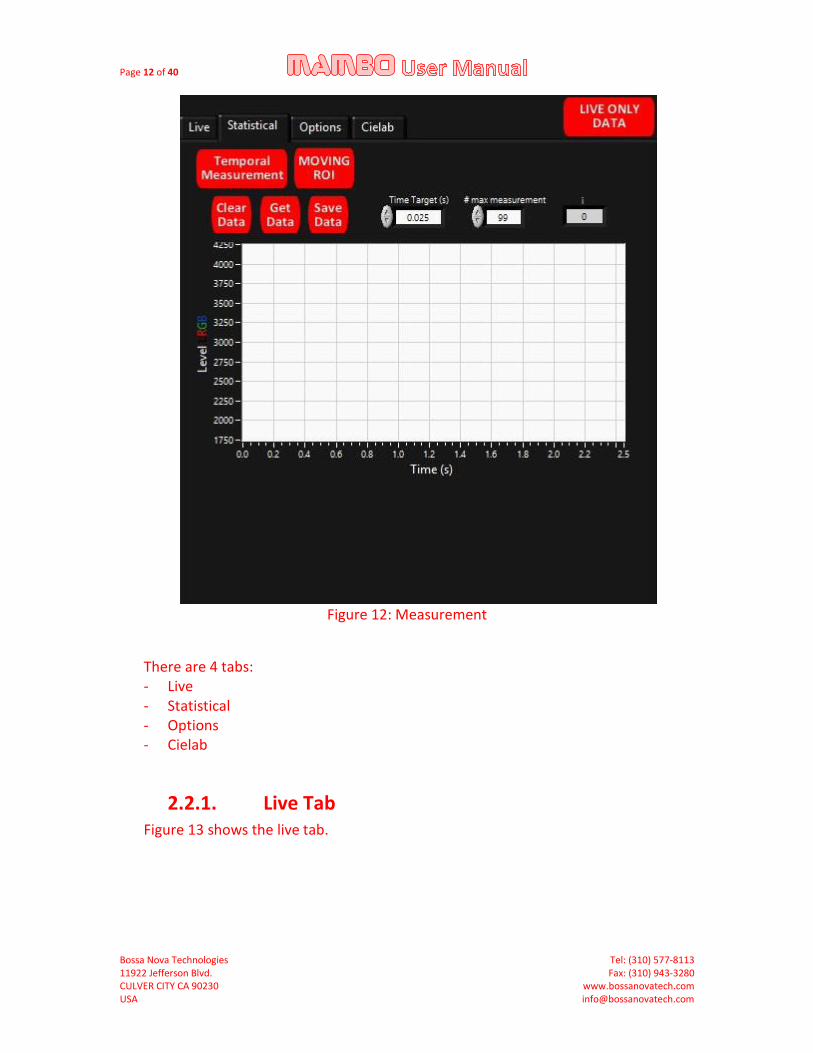
Figure 12 shows the measurement part of MAMBO main window.
Page 12 of 40
Bossa Nova Technologies Tel: (310) 577-8113 11922 Jefferson Blvd. Fax: (310) 943-3280 CULVER CITY CA 90230 www.bossanovatech.com USA [email protected]
Figure 12: Measurement
There are 4 tabs: - Live - Statistical - Options - Cielab
2.2.1. Live Tab Figure 13 shows the live tab.
Page 13 of 40
Bossa Nova Technologies Tel: (310) 577-8113 11922 Jefferson Blvd. Fax: (310) 943-3280 CULVER CITY CA 90230 www.bossanovatech.com USA [email protected]
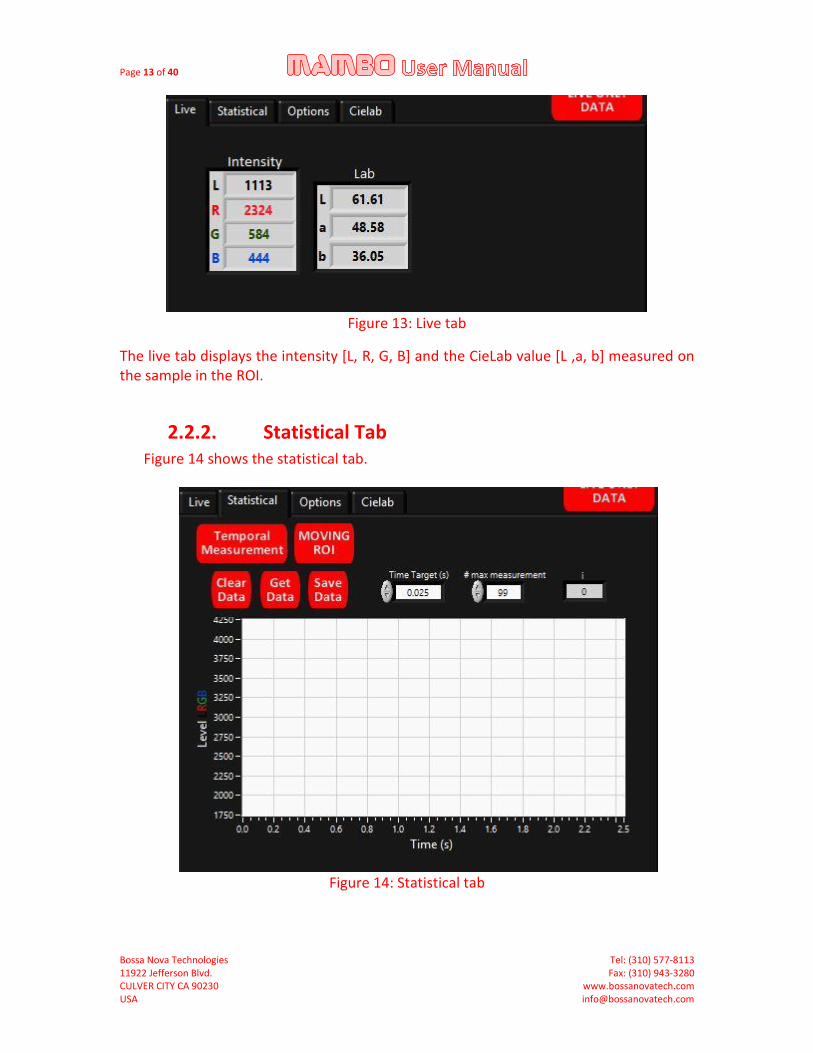
Figure 13: Live tab
The live tab displays the intensity [L, R, G, B] and the CieLab value [L ,a, b] measured on the sample in the ROI.
2.2.2. Statistical Tab Figure 14 shows the statistical tab.
Figure 14: Statistical tab
Page 14 of 40
Bossa Nova Technologies Tel: (310) 577-8113 11922 Jefferson Blvd. Fax: (310) 943-3280 CULVER CITY CA 90230 www.bossanovatech.com USA [email protected]
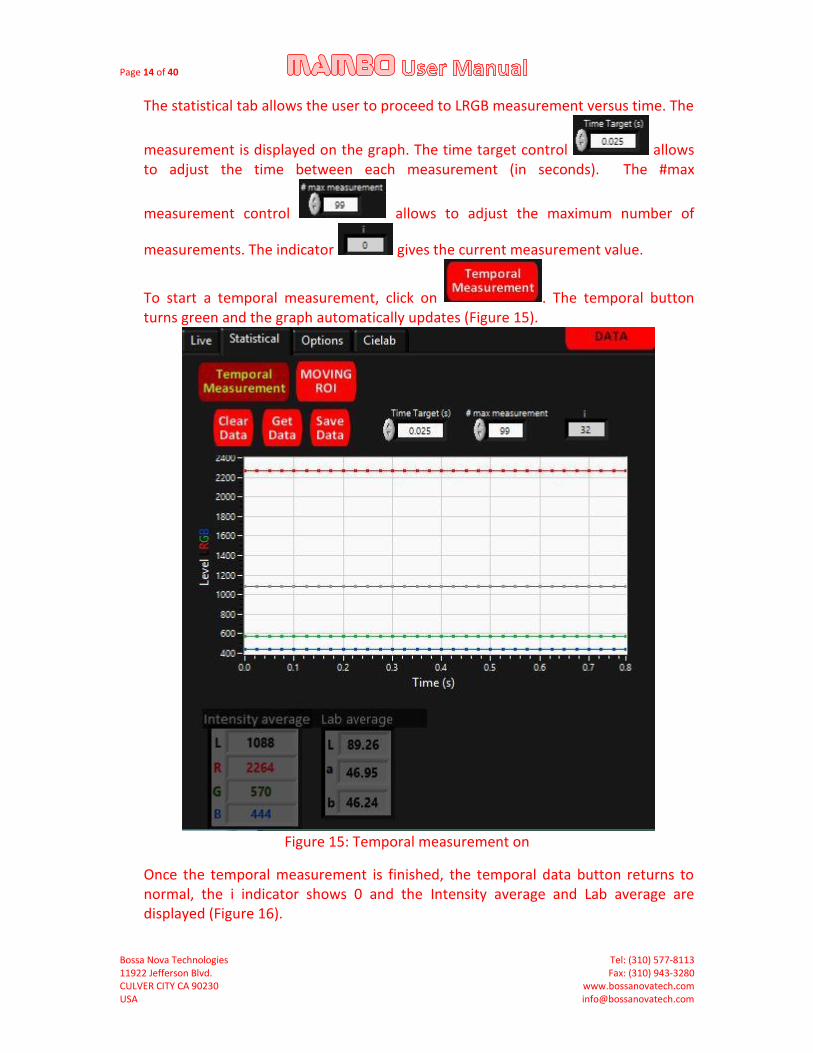
The statistical tab allows the user to proceed to LRGB measurement versus time. The
measurement is displayed on the graph. The time target control allows to adjust the time between each measurement (in seconds). The #max
measurement control allows to adjust the maximum number of
measurements. The indicator gives the current measurement value.
To start a temporal measurement, click on . The temporal button turns green and the graph automatically updates (Figure 15).
Figure 15: Temporal measurement on
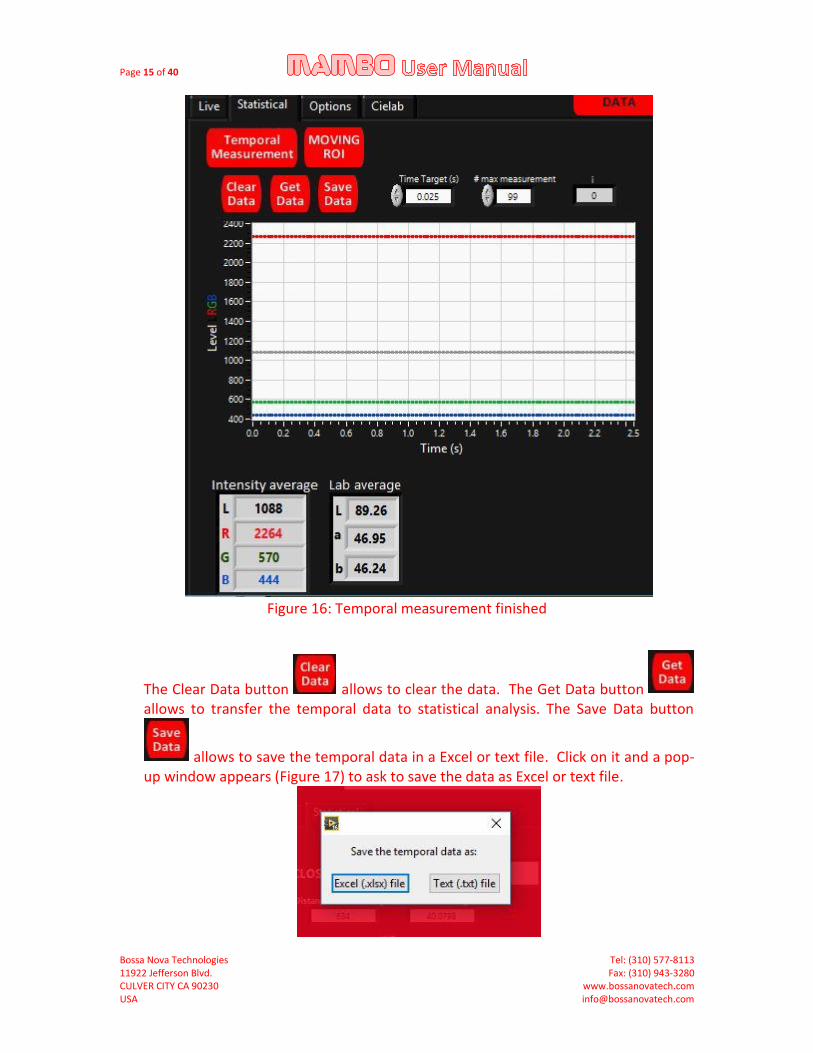
Once the temporal measurement is finished, the temporal data button returns to normal, the i indicator shows 0 and the Intensity average and Lab average are displayed (Figure 16).
Page 15 of 40
Bossa Nova Technologies Tel: (310) 577-8113 11922 Jefferson Blvd. Fax: (310) 943-3280 CULVER CITY CA 90230 www.bossanovatech.com USA [email protected]
Figure 16: Temporal measurement finished
The Clear Data button allows to clear the data. The Get Data button allows to transfer the temporal data to statistical analysis. The Save Data button
allows to save the temporal data in a Excel or text file. Click on it and a pop-up window appears (Figure 17) to ask to save the data as Excel or text file.
Page 16 of 40
Bossa Nova Technologies Tel: (310) 577-8113 11922 Jefferson Blvd. Fax: (310) 943-3280 CULVER CITY CA 90230 www.bossanovatech.com USA [email protected]
Figure 17: Saving the temporal data as Excel or text file
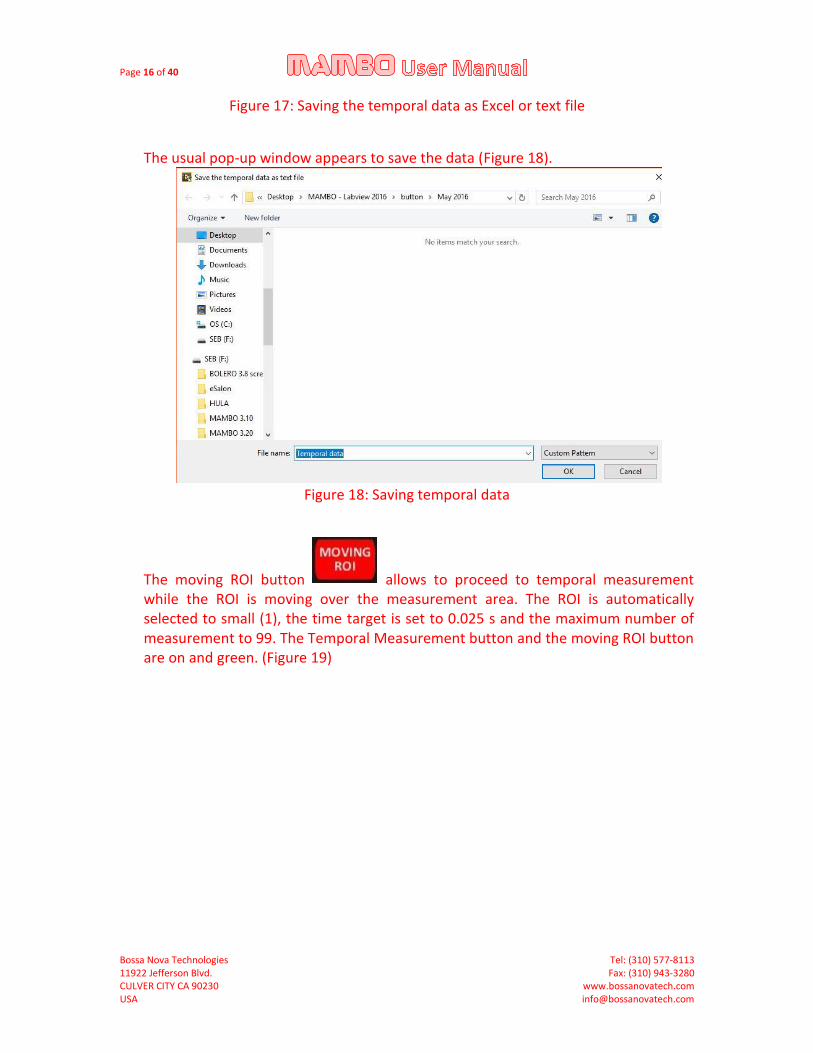
The usual pop-up window appears to save the data (Figure 18).
Figure 18: Saving temporal data
The moving ROI button allows to proceed to temporal measurement while the ROI is moving over the measurement area. The ROI is automatically selected to small (1), the time target is set to 0.025 s and the maximum number of measurement to 99. The Temporal Measurement button and the moving ROI button are on and green. (Figure 19)
Page 17 of 40
Bossa Nova Technologies Tel: (310) 577-8113 11922 Jefferson Blvd. Fax: (310) 943-3280 CULVER CITY CA 90230 www.bossanovatech.com USA [email protected]
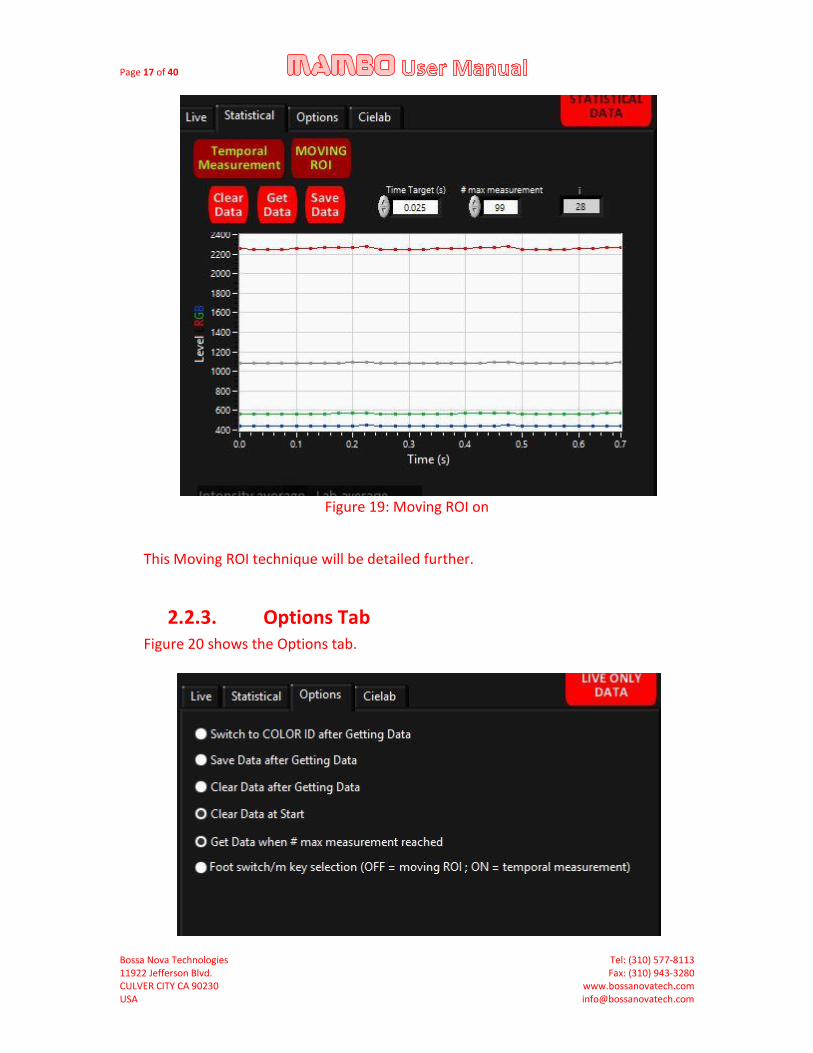
Figure 19: Moving ROI on
This Moving ROI technique will be detailed further.
2.2.3. Options Tab Figure 20 shows the Options tab.
Page 18 of 40
Bossa Nova Technologies Tel: (310) 577-8113 11922 Jefferson Blvd. Fax: (310) 943-3280 CULVER CITY CA 90230 www.bossanovatech.com USA [email protected]
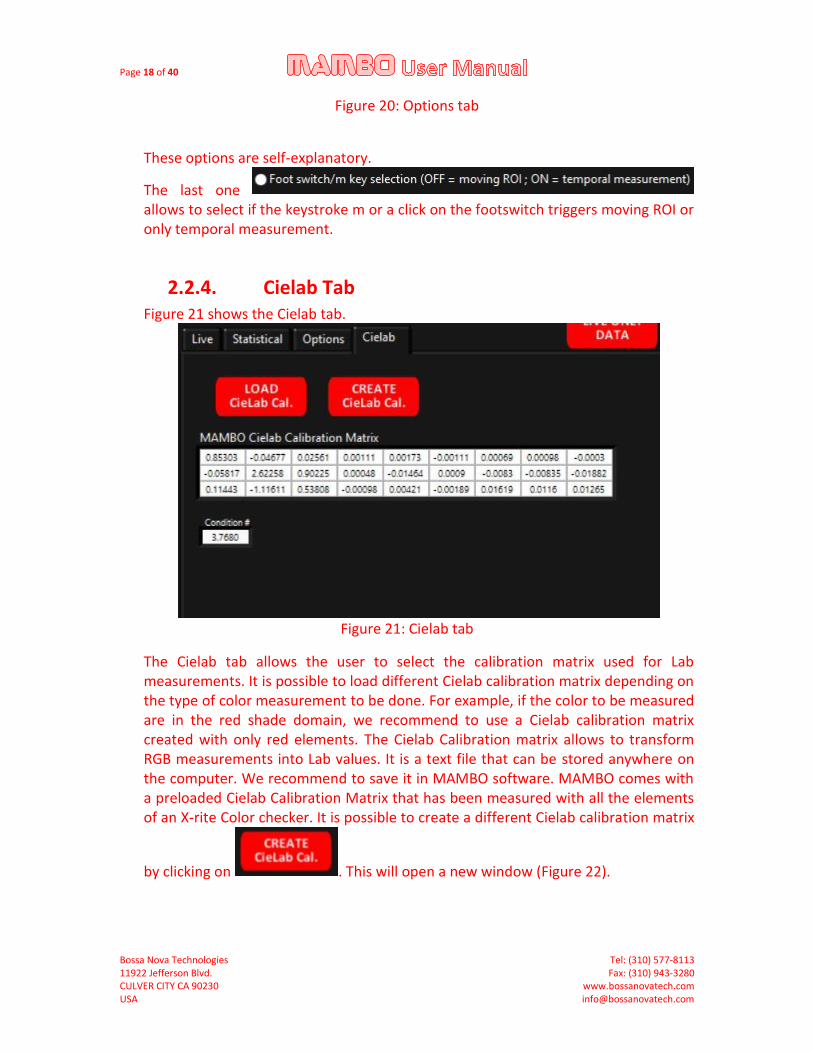
Figure 20: Options tab
These options are self-explanatory.
The last one allows to select if the keystroke m or a click on the footswitch triggers moving ROI or only temporal measurement.
2.2.4. Cielab Tab Figure 21 shows the Cielab tab.
Figure 21: Cielab tab
The Cielab tab allows the user to select the calibration matrix used for Lab measurements. It is possible to load different Cielab calibration matrix depending on the type of color measurement to be done. For example, if the color to be measured are in the red shade domain, we recommend to use a Cielab calibration matrix created with only red elements. The Cielab Calibration matrix allows to transform RGB measurements into Lab values. It is a text file that can be stored anywhere on the computer. We recommend to save it in MAMBO software. MAMBO comes with a preloaded Cielab Calibration Matrix that has been measured with all the elements of an X-rite Color checker. It is possible to create a different Cielab calibration matrix
by clicking on . This will open a new window (Figure 22).
Page 19 of 40
Bossa Nova Technologies Tel: (310) 577-8113 11922 Jefferson Blvd. Fax: (310) 943-3280 CULVER CITY CA 90230 www.bossanovatech.com USA [email protected]
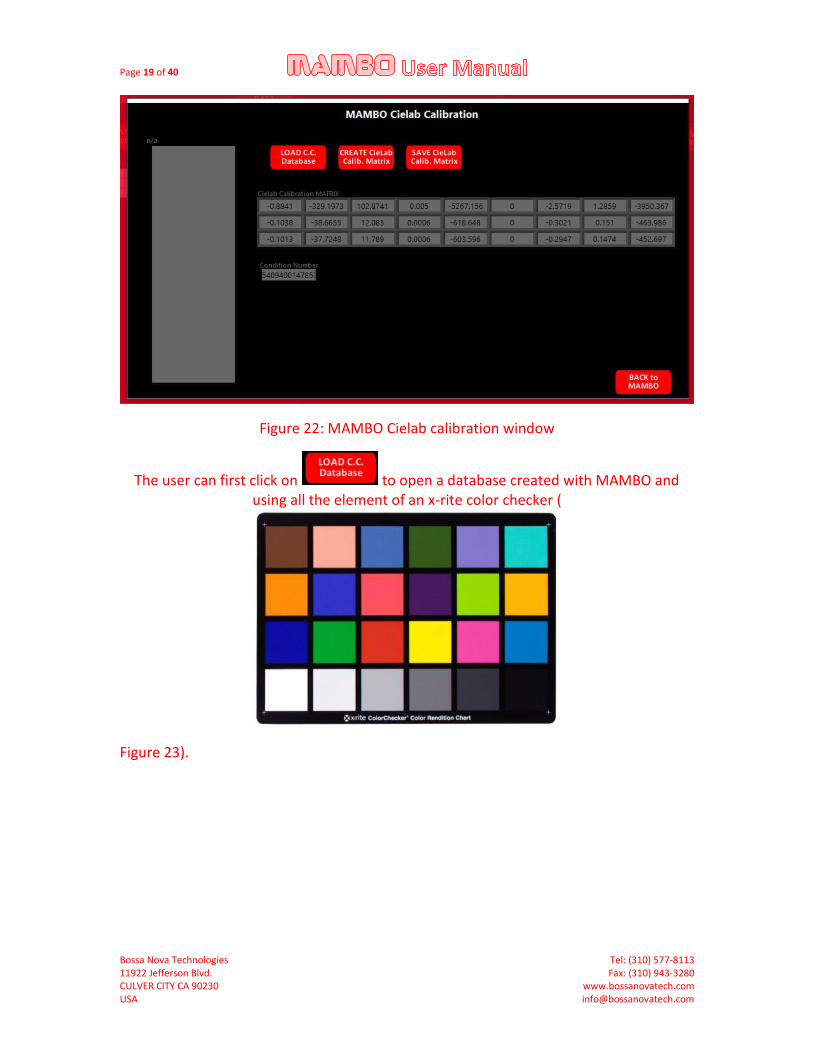
Figure 22: MAMBO Cielab calibration window
The user can first click on to open a database created with MAMBO and using all the element of an x-rite color checker (
Figure 23).
Page 20 of 40
Bossa Nova Technologies Tel: (310) 577-8113 11922 Jefferson Blvd. Fax: (310) 943-3280 CULVER CITY CA 90230 www.bossanovatech.com USA [email protected]
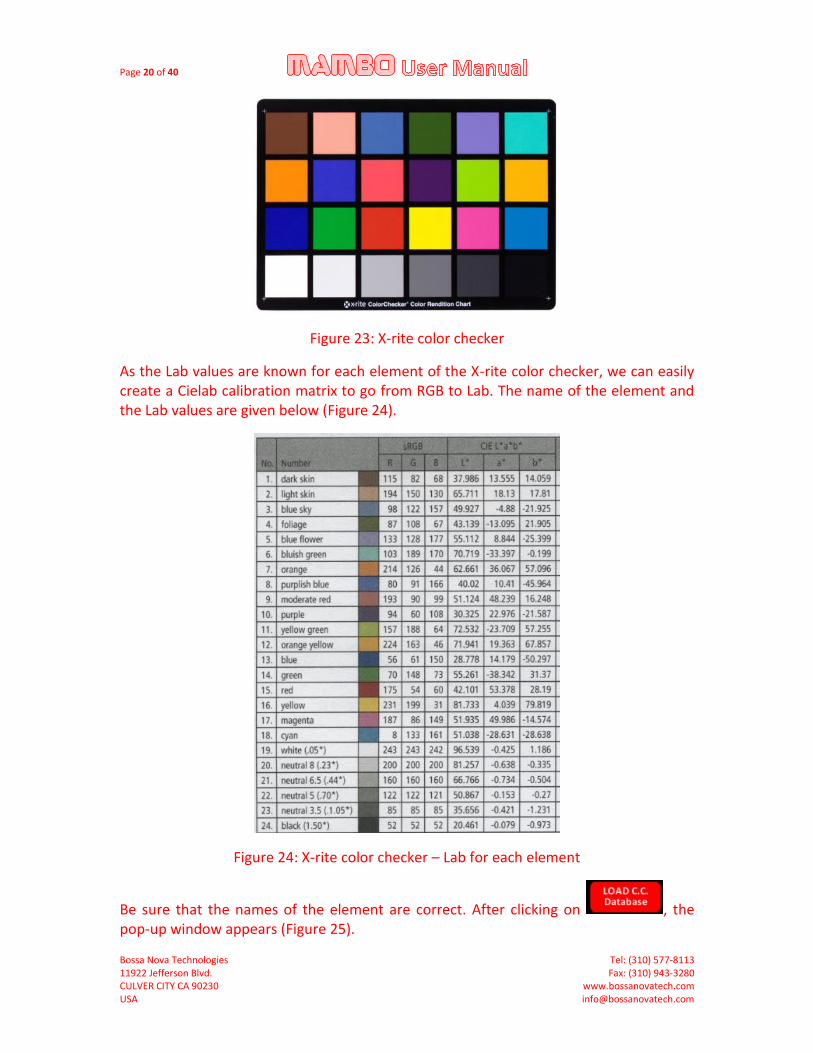
Figure 23: X-rite color checker
As the Lab values are known for each element of the X-rite color checker, we can easily create a Cielab calibration matrix to go from RGB to Lab. The name of the element and the Lab values are given below (Figure 24).
Figure 24: X-rite color checker – Lab for each element
Be sure that the names of the element are correct. After clicking on , the pop-up window appears (Figure 25).
Page 21 of 40
Bossa Nova Technologies Tel: (310) 577-8113 11922 Jefferson Blvd. Fax: (310) 943-3280 CULVER CITY CA 90230 www.bossanovatech.com USA [email protected]
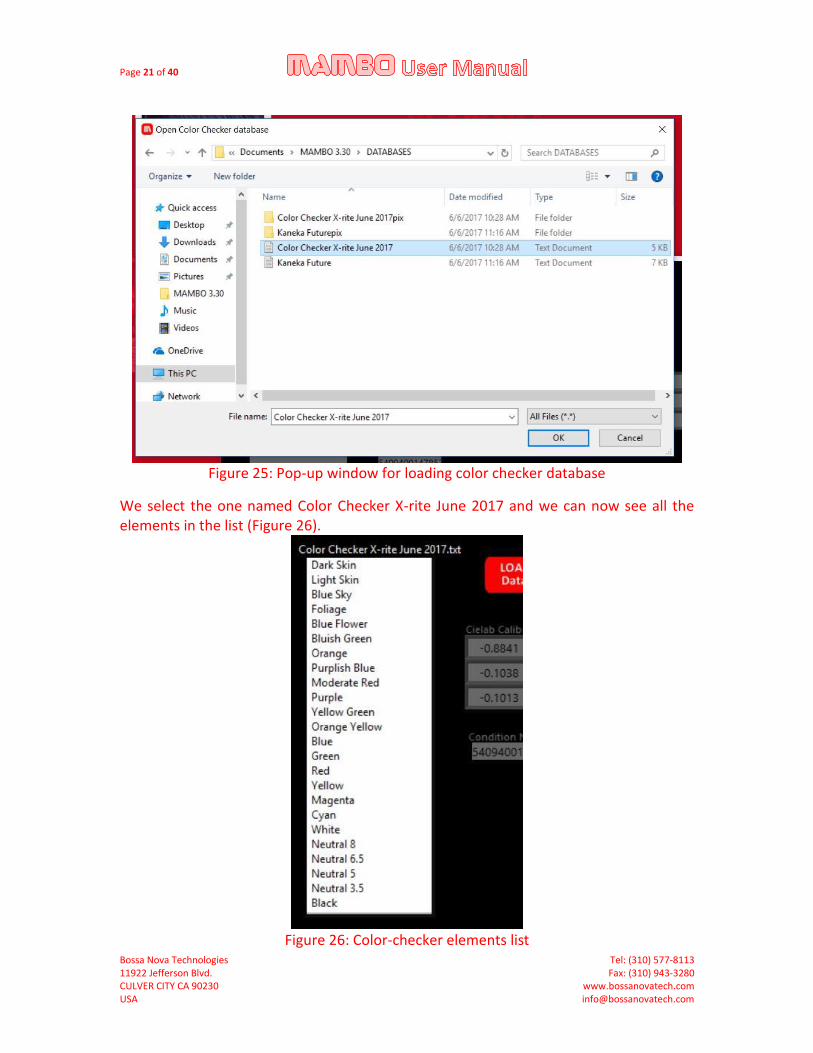
Figure 25: Pop-up window for loading color checker database
We select the one named Color Checker X-rite June 2017 and we can now see all the elements in the list (Figure 26).
Figure 26: Color-checker elements list
Page 22 of 40
Bossa Nova Technologies Tel: (310) 577-8113 11922 Jefferson Blvd. Fax: (310) 943-3280 CULVER CITY CA 90230 www.bossanovatech.com USA [email protected]
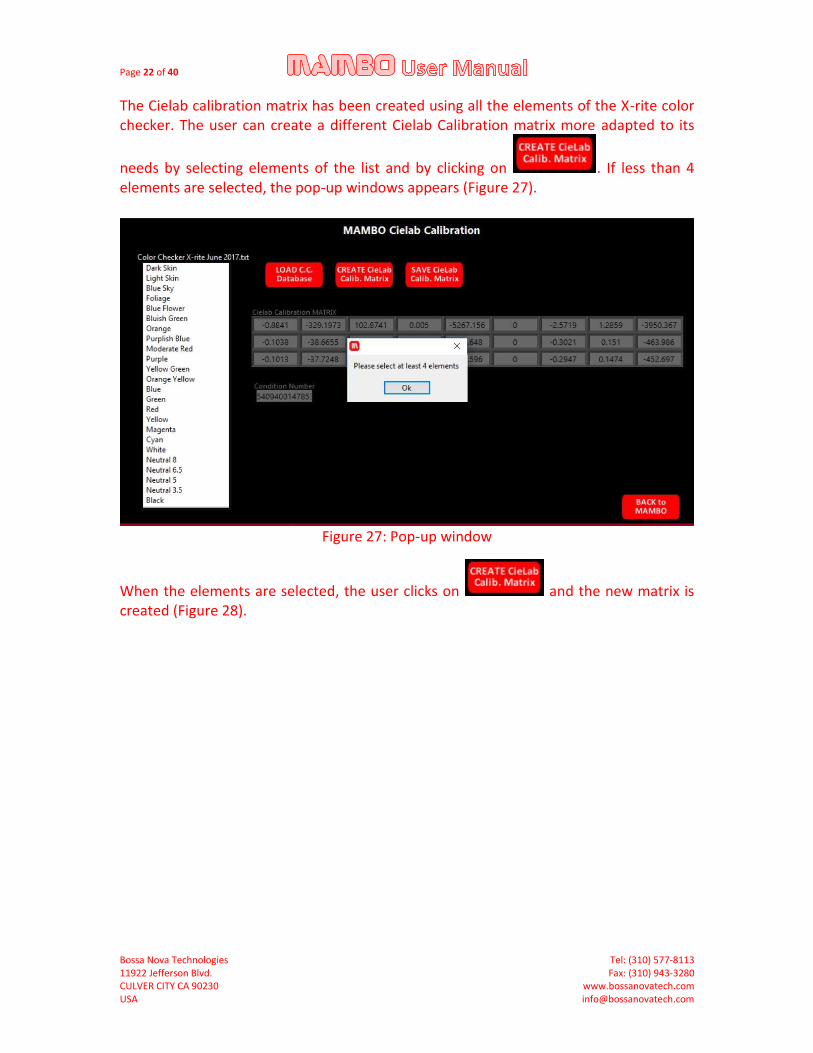
The Cielab calibration matrix has been created using all the elements of the X-rite color checker. The user can create a different Cielab Calibration matrix more adapted to its
needs by selecting elements of the list and by clicking on . If less than 4 elements are selected, the pop-up windows appears (Figure 27).
Figure 27: Pop-up window
When the elements are selected, the user clicks on and the new matrix is created (Figure 28).

Page 23 of 40
Bossa Nova Technologies Tel: (310) 577-8113 11922 Jefferson Blvd. Fax: (310) 943-3280 CULVER CITY CA 90230 www.bossanovatech.com USA [email protected]
Figure 28: New Cielab calibration matrix created
The user can then save the new Cielab calibration matrix as a text file by clicking on
.
2.2.5. Live Only/Statistical button
The live only/statistical button or allows the user to switch between live or statistical data when using worksheet tab or color consistency tab. This will be explained in more detail.
Page 24 of 40
Bossa Nova Technologies Tel: (310) 577-8113 11922 Jefferson Blvd. Fax: (310) 943-3280 CULVER CITY CA 90230 www.bossanovatech.com USA [email protected]
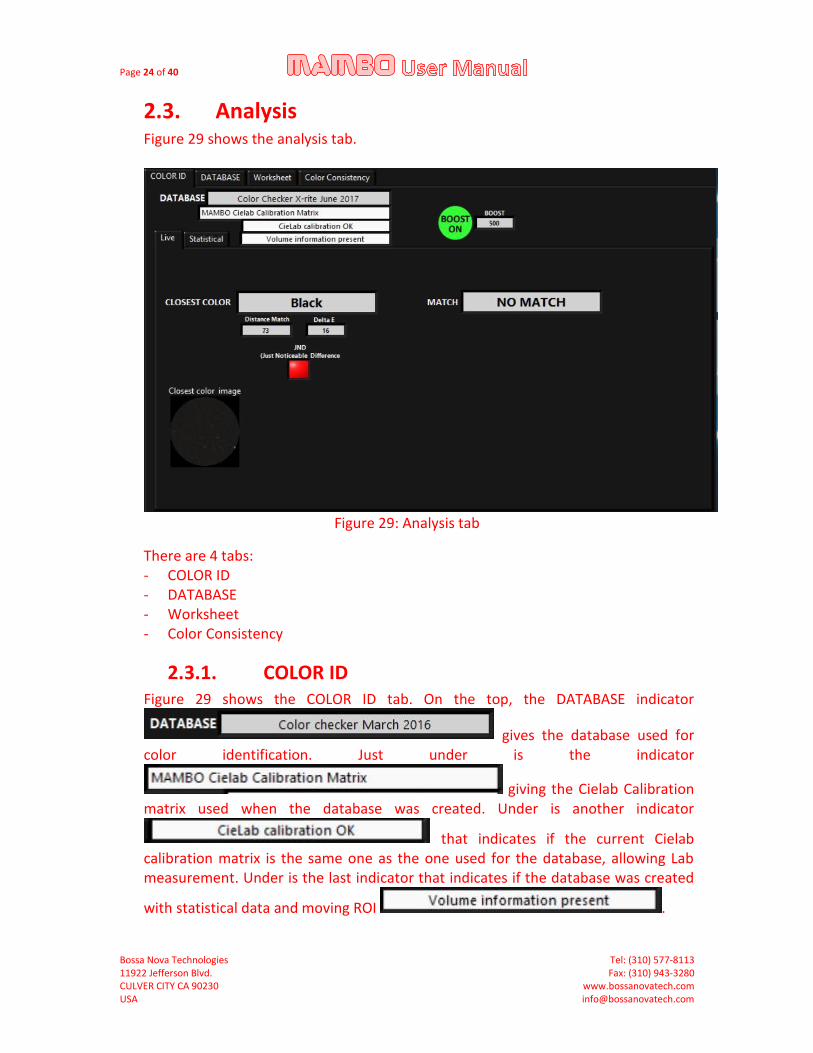
2.3. Analysis Figure 29 shows the analysis tab.
Figure 29: Analysis tab
There are 4 tabs: - COLOR ID - DATABASE - Worksheet - Color Consistency
2.3.1. COLOR ID Figure 29 shows the COLOR ID tab. On the top, the DATABASE indicator
gives the database used for color identification. Just under is the indicator
giving the Cielab Calibration matrix used when the database was created. Under is another indicator
that indicates if the current Cielab calibration matrix is the same one as the one used for the database, allowing Lab measurement. Under is the last indicator that indicates if the database was created
with statistical data and moving ROI .
Page 25 of 40
Bossa Nova Technologies Tel: (310) 577-8113 11922 Jefferson Blvd. Fax: (310) 943-3280 CULVER CITY CA 90230 www.bossanovatech.com USA [email protected]
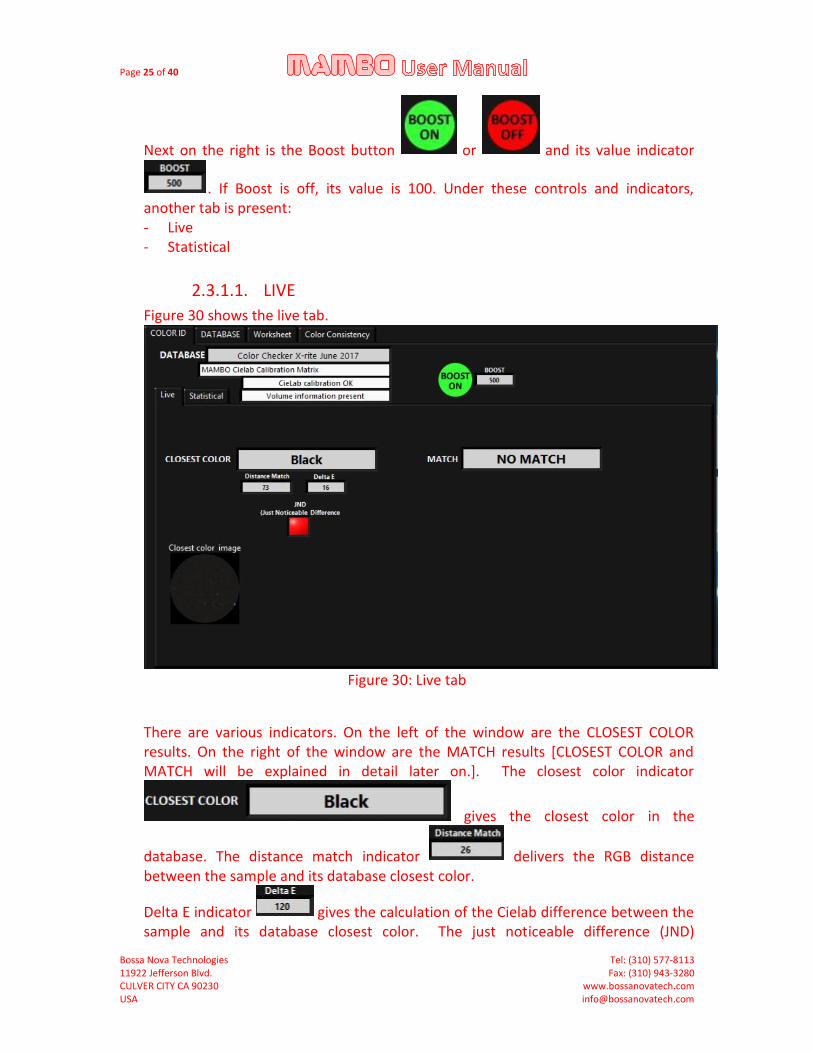
Next on the right is the Boost button or and its value indicator
. If Boost is off, its value is 100. Under these controls and indicators, another tab is present: - Live - Statistical
2.3.1.1. LIVE
Figure 30 shows the live tab.
Figure 30: Live tab
There are various indicators. On the left of the window are the CLOSEST COLOR results. On the right of the window are the MATCH results [CLOSEST COLOR and MATCH will be explained in detail later on.]. The closest color indicator
gives the closest color in the
database. The distance match indicator delivers the RGB distance between the sample and its database closest color.
Delta E indicator gives the calculation of the Cielab difference between the sample and its database closest color. The just noticeable difference (JND)
Page 26 of 40
Bossa Nova Technologies Tel: (310) 577-8113 11922 Jefferson Blvd. Fax: (310) 943-3280 CULVER CITY CA 90230 www.bossanovatech.com USA [email protected]
indicates if delta E is under 2.3 (Green) or over (Red). The closest color image shows the database image corresponding to the closest color.
The match indicator gives the matching
database color or no match .
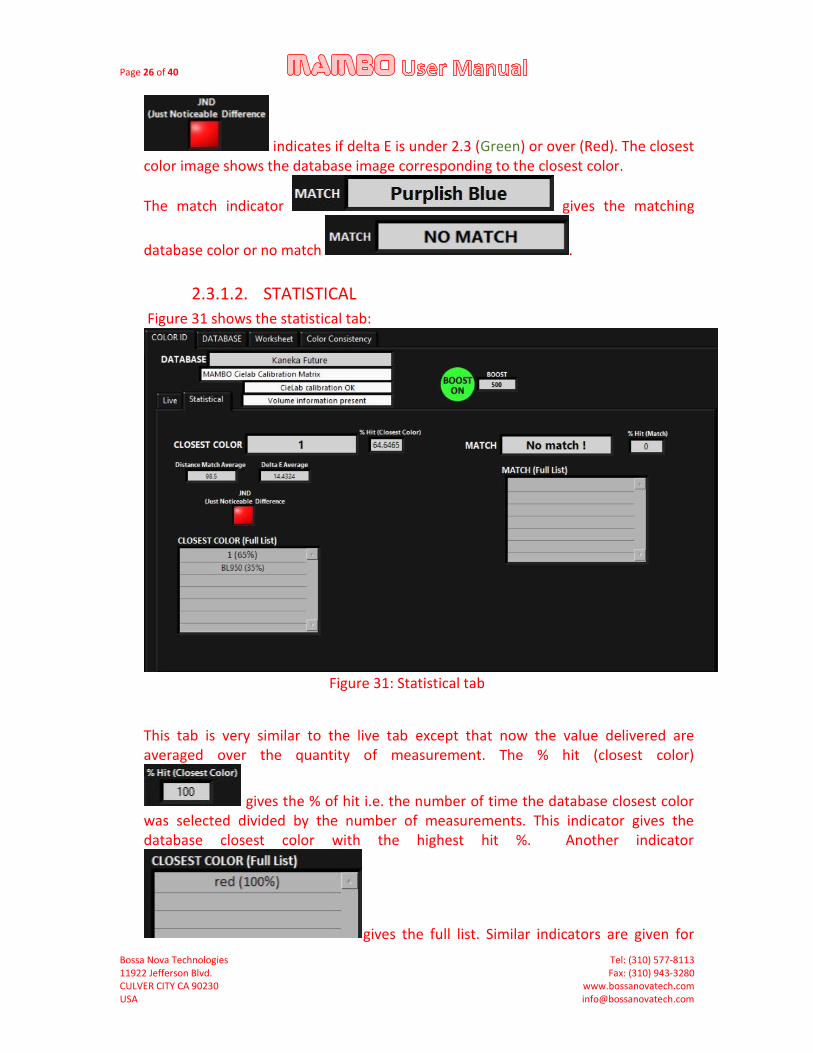
2.3.1.2. STATISTICAL
Figure 31 shows the statistical tab:
Figure 31: Statistical tab
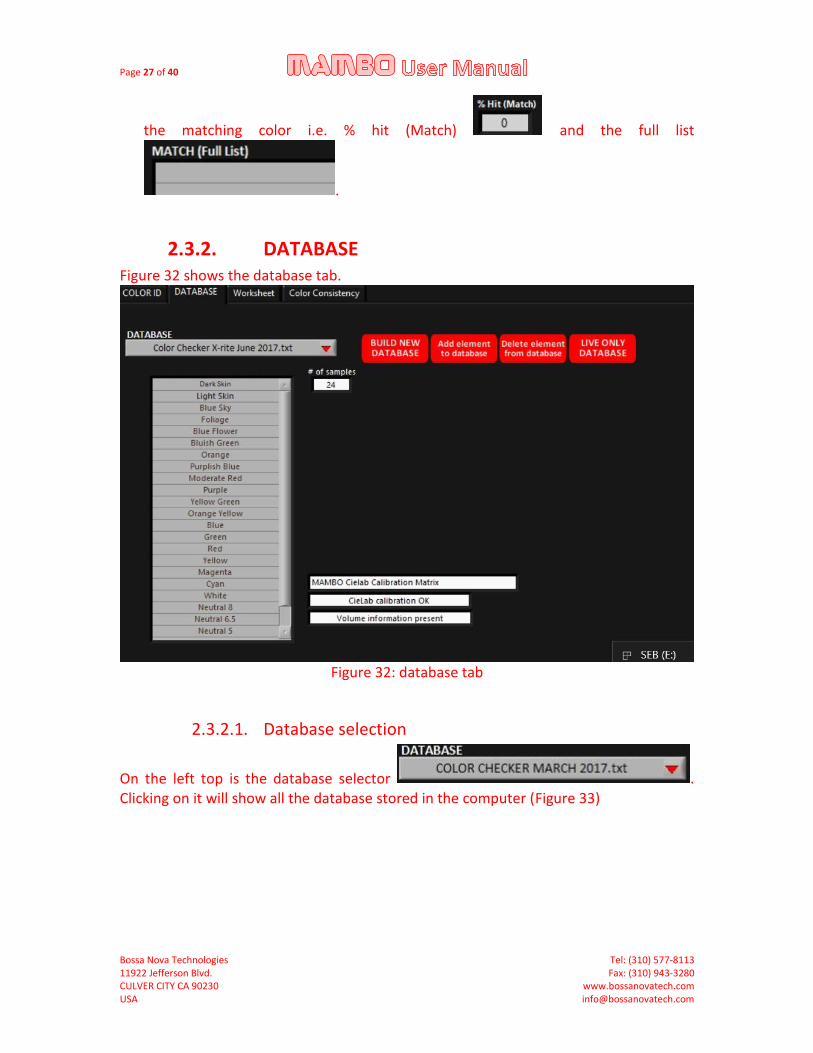
This tab is very similar to the live tab except that now the value delivered are averaged over the quantity of measurement. The % hit (closest color)
gives the % of hit i.e. the number of time the database closest color was selected divided by the number of measurements. This indicator gives the database closest color with the highest hit %. Another indicator
gives the full list. Similar indicators are given for
Page 27 of 40
Bossa Nova Technologies Tel: (310) 577-8113 11922 Jefferson Blvd. Fax: (310) 943-3280 CULVER CITY CA 90230 www.bossanovatech.com USA [email protected]
the matching color i.e. % hit (Match) and the full list
.
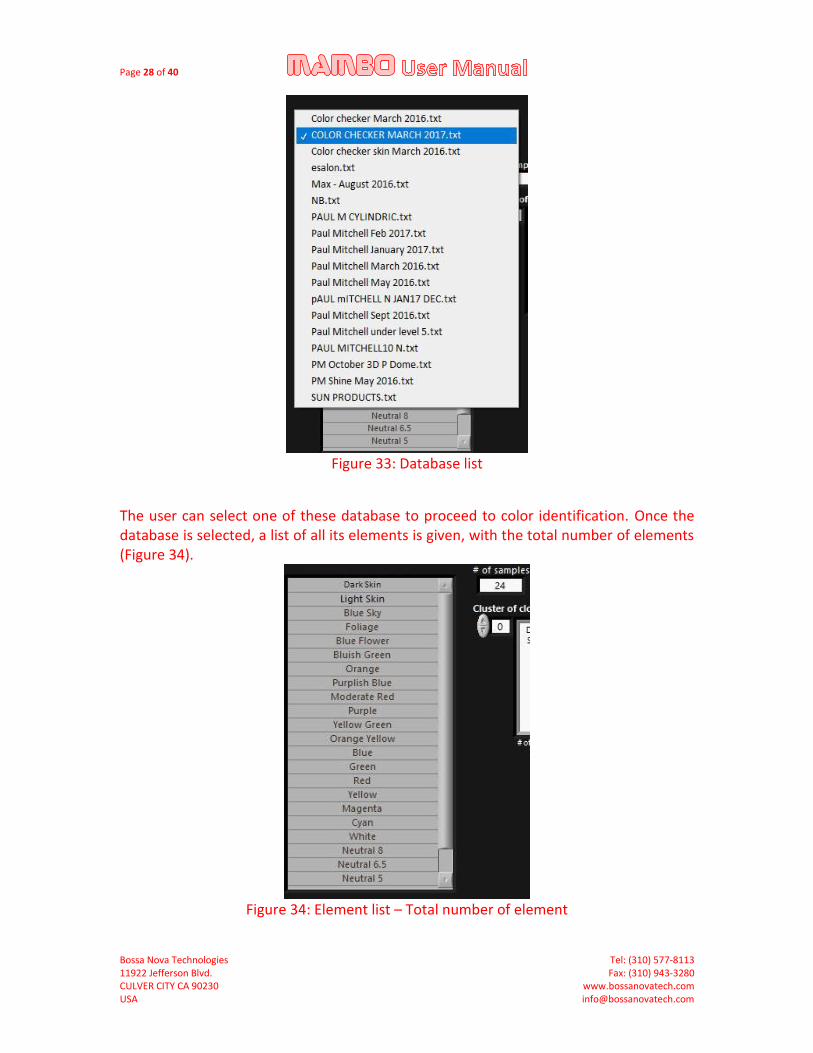
2.3.2. DATABASE Figure 32 shows the database tab.
Figure 32: database tab
2.3.2.1. Database selection
On the left top is the database selector . Clicking on it will show all the database stored in the computer (Figure 33)
Page 28 of 40
Bossa Nova Technologies Tel: (310) 577-8113 11922 Jefferson Blvd. Fax: (310) 943-3280 CULVER CITY CA 90230 www.bossanovatech.com USA [email protected]
Figure 33: Database list
The user can select one of these database to proceed to color identification. Once the database is selected, a list of all its elements is given, with the total number of elements (Figure 34).
Figure 34: Element list – Total number of element
Page 29 of 40
Bossa Nova Technologies Tel: (310) 577-8113 11922 Jefferson Blvd. Fax: (310) 943-3280 CULVER CITY CA 90230 www.bossanovatech.com USA [email protected]
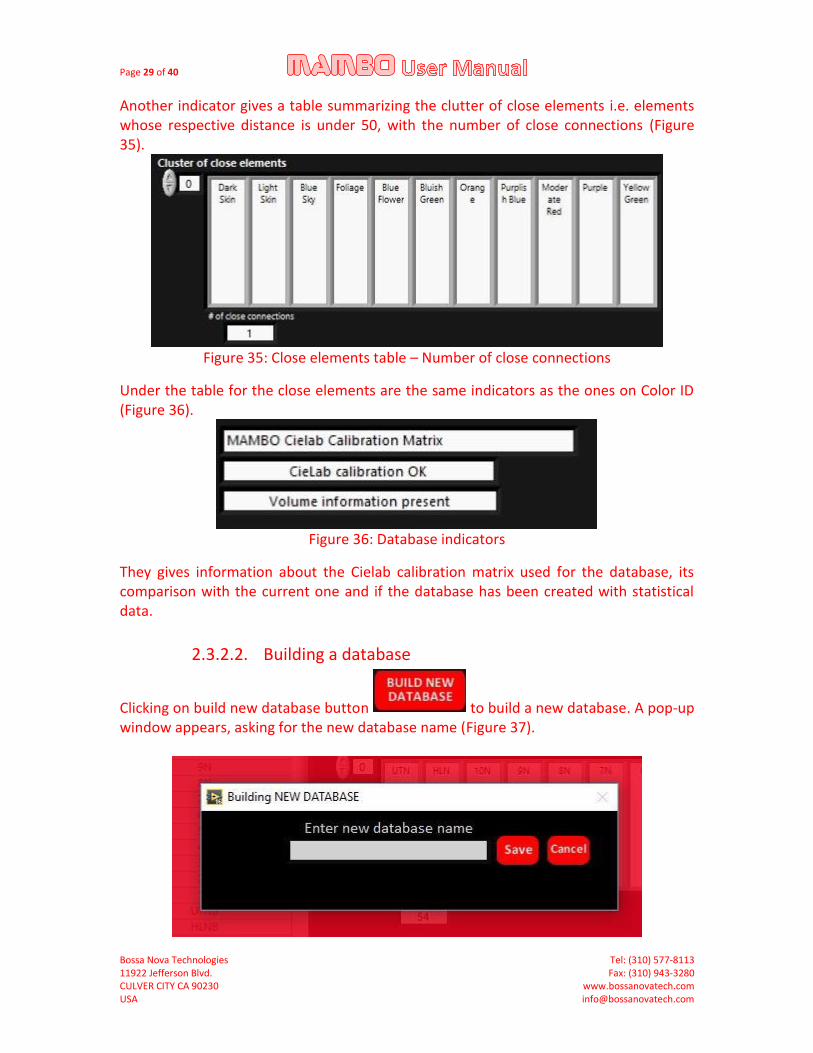
Another indicator gives a table summarizing the clutter of close elements i.e. elements whose respective distance is under 50, with the number of close connections (Figure 35).
Figure 35: Close elements table – Number of close connections
Under the table for the close elements are the same indicators as the ones on Color ID (Figure 36).
Figure 36: Database indicators
They gives information about the Cielab calibration matrix used for the database, its comparison with the current one and if the database has been created with statistical data.
2.3.2.2. Building a database
Clicking on build new database button to build a new database. A pop-up window appears, asking for the new database name (Figure 37).

Page 30 of 40
Bossa Nova Technologies Tel: (310) 577-8113 11922 Jefferson Blvd. Fax: (310) 943-3280 CULVER CITY CA 90230 www.bossanovatech.com USA [email protected]
Figure 37: Pop-up window for new database name
Once the database name is entered, another pop-up window appears (Figure 38).
Figure 38: Live/stat pop-up window
If Statistical database was already selected, this pop-up window does not appear. The user can then switch to statistical database or stay in live only. Remember that live only database will not allow Match color id analysis but only closest color analysis. The following window appear (Figure 39).
Figure 39: Building database – in progress
In the right top corner, the indicator indicates that the DATABASE CREATION is IN
PROGRESS .
Page 31 of 40
Bossa Nova Technologies Tel: (310) 577-8113 11922 Jefferson Blvd. Fax: (310) 943-3280 CULVER CITY CA 90230 www.bossanovatech.com USA [email protected]
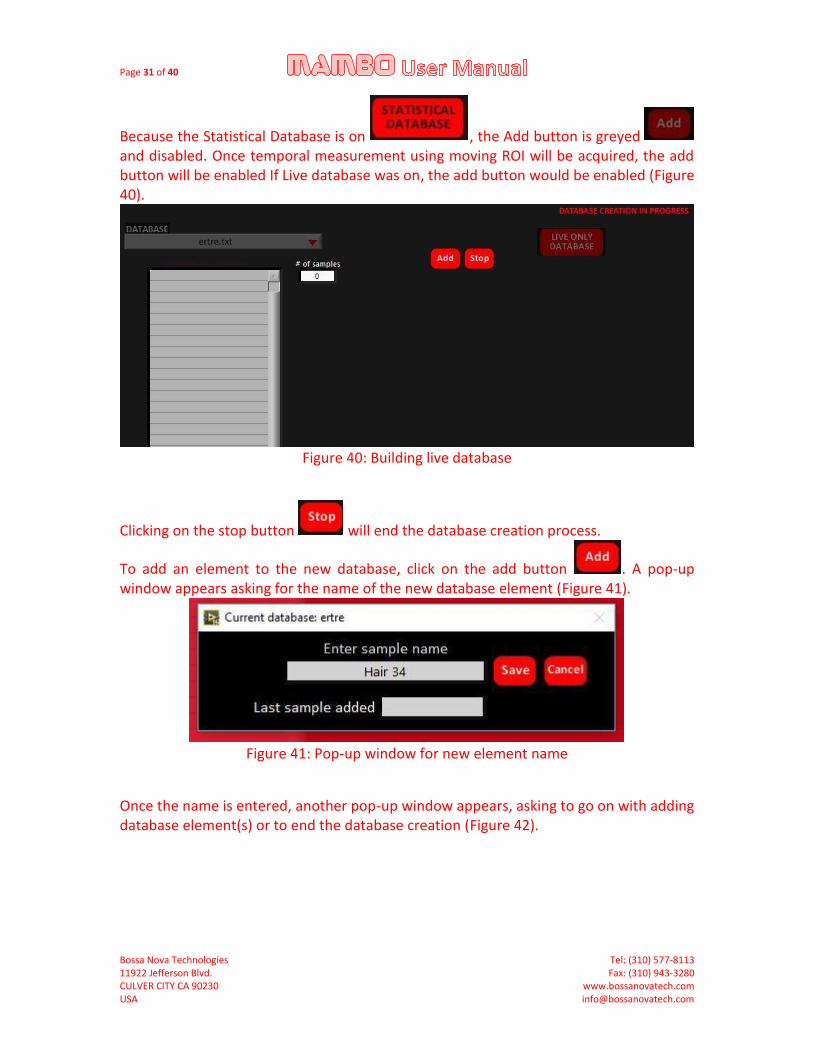
Because the Statistical Database is on , the Add button is greyed and disabled. Once temporal measurement using moving ROI will be acquired, the add button will be enabled If Live database was on, the add button would be enabled (Figure 40).
Figure 40: Building live database
Clicking on the stop button will end the database creation process.
To add an element to the new database, click on the add button . A pop-up window appears asking for the name of the new database element (Figure 41).
Figure 41: Pop-up window for new element name
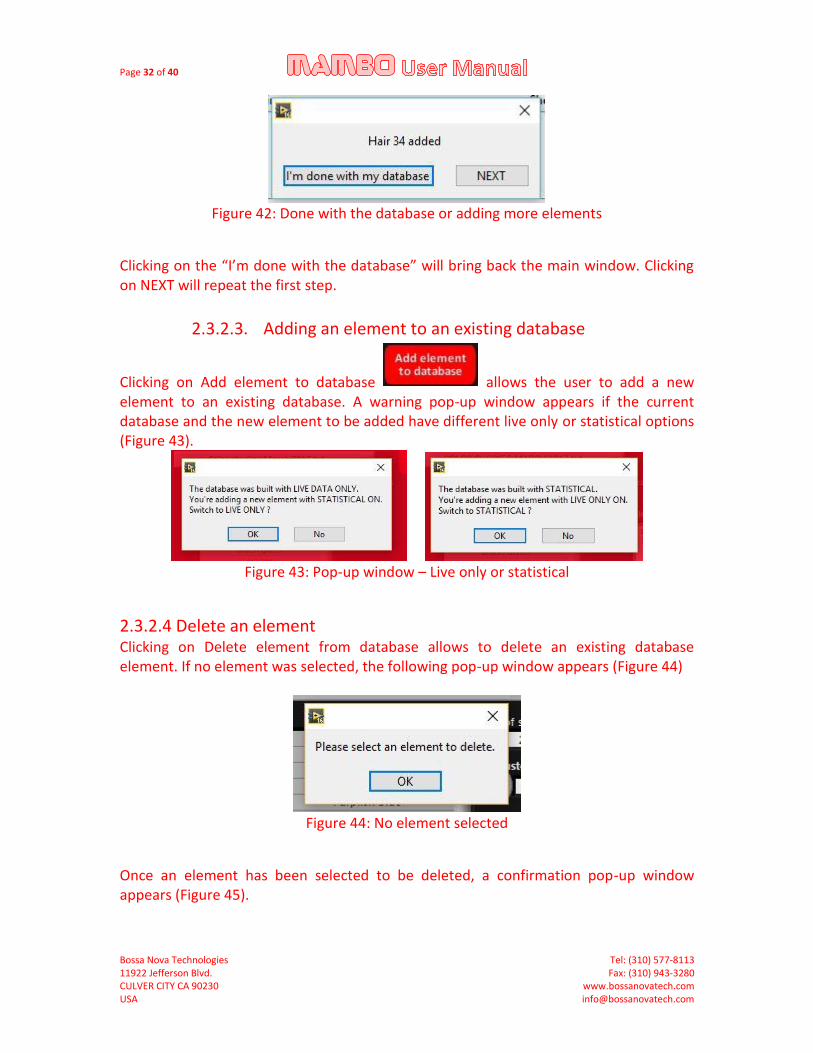
Once the name is entered, another pop-up window appears, asking to go on with adding database element(s) or to end the database creation (Figure 42).
Page 32 of 40
Bossa Nova Technologies Tel: (310) 577-8113 11922 Jefferson Blvd. Fax: (310) 943-3280 CULVER CITY CA 90230 www.bossanovatech.com USA [email protected]
Figure 42: Done with the database or adding more elements
Clicking on the “I’m done with the database” will bring back the main window. Clicking on NEXT will repeat the first step.
2.3.2.3. Adding an element to an existing database
Clicking on Add element to database allows the user to add a new element to an existing database. A warning pop-up window appears if the current database and the new element to be added have different live only or statistical options (Figure 43).
Figure 43: Pop-up window – Live only or statistical
2.3.2.4 Delete an element Clicking on Delete element from database allows to delete an existing database element. If no element was selected, the following pop-up window appears (Figure 44)
Figure 44: No element selected
Once an element has been selected to be deleted, a confirmation pop-up window appears (Figure 45).
Page 33 of 40
Bossa Nova Technologies Tel: (310) 577-8113 11922 Jefferson Blvd. Fax: (310) 943-3280 CULVER CITY CA 90230 www.bossanovatech.com USA [email protected]
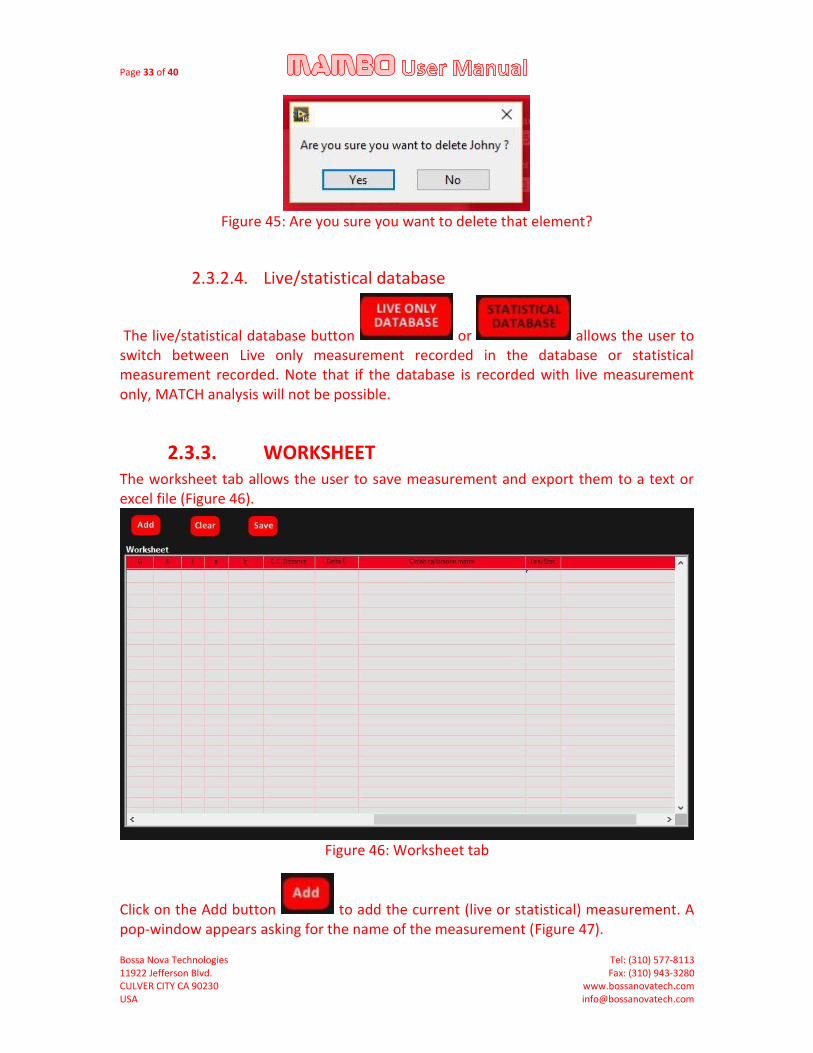
Figure 45: Are you sure you want to delete that element?
2.3.2.4. Live/statistical database
The live/statistical database button or allows the user to switch between Live only measurement recorded in the database or statistical measurement recorded. Note that if the database is recorded with live measurement only, MATCH analysis will not be possible.
2.3.3. WORKSHEET The worksheet tab allows the user to save measurement and export them to a text or excel file (Figure 46).
Figure 46: Worksheet tab
Click on the Add button to add the current (live or statistical) measurement. A pop-window appears asking for the name of the measurement (Figure 47).
Page 34 of 40
Bossa Nova Technologies Tel: (310) 577-8113 11922 Jefferson Blvd. Fax: (310) 943-3280 CULVER CITY CA 90230 www.bossanovatech.com USA [email protected]
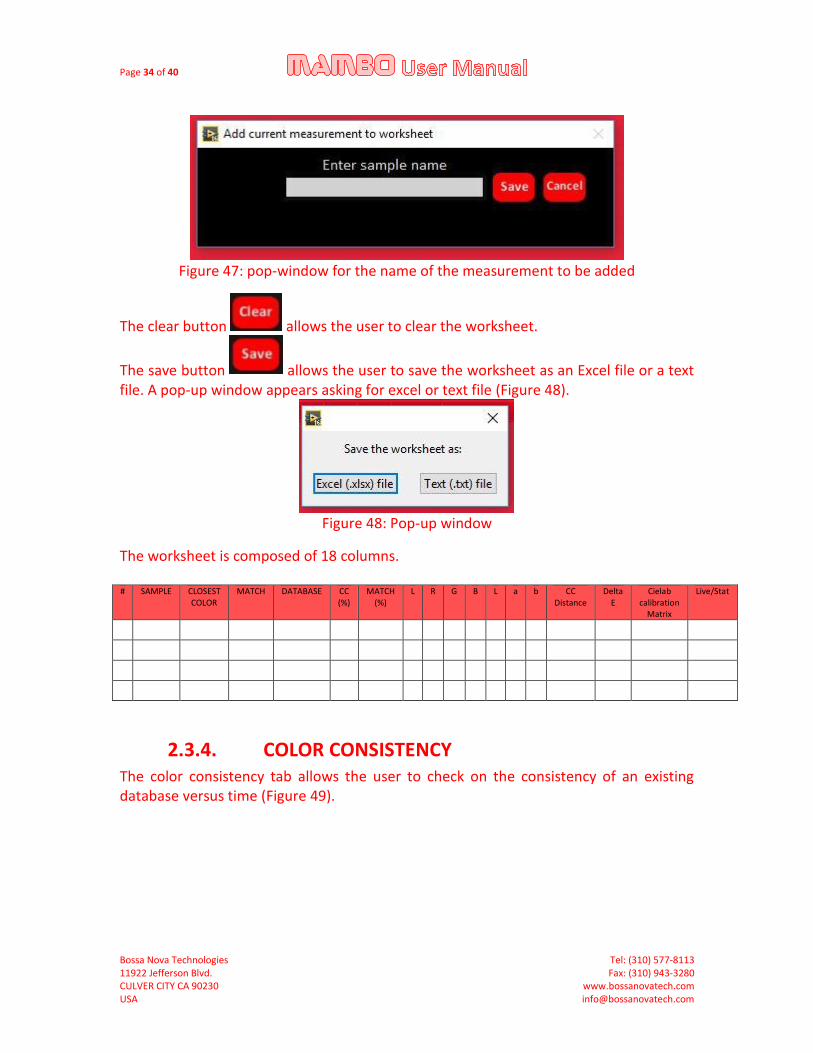
Figure 47: pop-window for the name of the measurement to be added
The clear button allows the user to clear the worksheet.
The save button allows the user to save the worksheet as an Excel file or a text file. A pop-up window appears asking for excel or text file (Figure 48).
Figure 48: Pop-up window
The worksheet is composed of 18 columns. # SAMPLE CLOSEST
COLOR MATCH DATABASE CC
(%) MATCH
(%) L R G B L a b CC
Distance Delta
E Cielab
calibration Matrix
Live/Stat
2.3.4. COLOR CONSISTENCY The color consistency tab allows the user to check on the consistency of an existing database versus time (Figure 49).
Page 35 of 40
Bossa Nova Technologies Tel: (310) 577-8113 11922 Jefferson Blvd. Fax: (310) 943-3280 CULVER CITY CA 90230 www.bossanovatech.com USA [email protected]
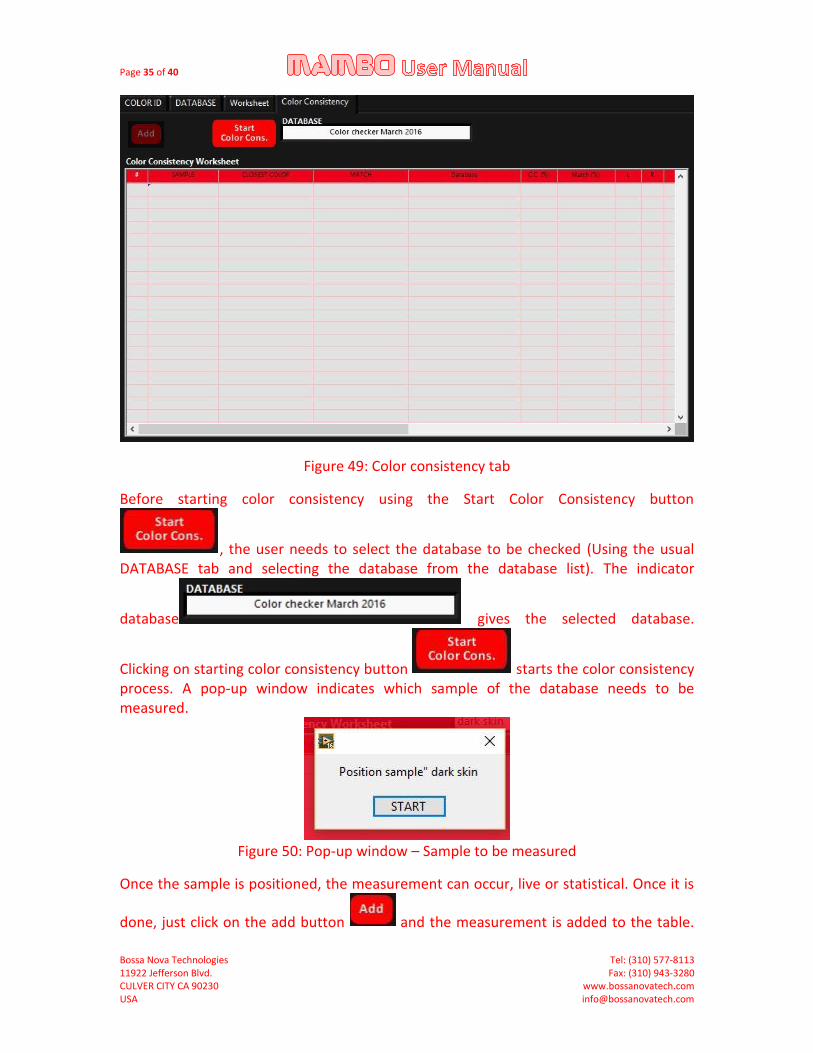
Figure 49: Color consistency tab
Before starting color consistency using the Start Color Consistency button
, the user needs to select the database to be checked (Using the usual DATABASE tab and selecting the database from the database list). The indicator
database gives the selected database.
Clicking on starting color consistency button starts the color consistency process. A pop-up window indicates which sample of the database needs to be measured.
Figure 50: Pop-up window – Sample to be measured
Once the sample is positioned, the measurement can occur, live or statistical. Once it is
done, just click on the add button and the measurement is added to the table.
Page 36 of 40
Bossa Nova Technologies Tel: (310) 577-8113 11922 Jefferson Blvd. Fax: (310) 943-3280 CULVER CITY CA 90230 www.bossanovatech.com USA [email protected]
The process is repeated until the last database sample. Once the last sample is measured, a pop-up window appears.
Figure 51: pop-up window – Color consistency is done
The save button is now enable and the user can save the data as an Excel file or text file.
Page 37 of 40
Bossa Nova Technologies Tel: (310) 577-8113 11922 Jefferson Blvd. Fax: (310) 943-3280 CULVER CITY CA 90230 www.bossanovatech.com USA [email protected]
3. Technical Background COLOR Identification is the process of identifying the color in an existing database. Various concepts exists. MAMBO uses 2 of them in its processing, they are detailed in the following paragraph.
3.1. Closest color One of the simples color id processing is the calculation of the “color distance” of the sample to be identified with all the database sample and the identification of the color being the color that gives the minimum distance. The color distance between the sample to be identified and a database sample is defined by:
𝐶𝑜𝑙𝑜𝑟 𝐷𝑖𝑠𝑡𝑎𝑛𝑐𝑒 = √(𝑅 − 𝑅𝑑𝑎𝑡𝑎𝑏𝑎𝑠𝑒)2 + (𝐺 − 𝐺𝑑𝑎𝑡𝑎𝑏𝑎𝑠𝑒)2 + (𝐵 − 𝐵𝑑𝑎𝑡𝑎𝑏𝑎𝑠𝑒)2 With R,G,B the RGB value of the sample to be identified and Rdatabase,Gdatabase,Bdatabase the
RGB values of the database sample. The minimum color distance identifies the element of the database with the closest color. Note that this technique remains performant when the color to be identified is included in the spectral band covered by the database sample. For example, if a red textile is to be identified using a database composed only of blue tones, a closest color will be delivered, even if it is non representative. That technique always delivers a result.
3.2. Match The match processing is a more restrictive technique. Because of the nature of hair swatches (non-uniform color and strong texture), color measurement by MAMBO present variations. Figure 52 shows the spatial variations of the L, R ,G, B values when the Region of Interest (ROI) is moved over the hair swatch image.

Page 38 of 40
Bossa Nova Technologies Tel: (310) 577-8113 11922 Jefferson Blvd. Fax: (310) 943-3280 CULVER CITY CA 90230 www.bossanovatech.com USA [email protected]
Figure 52: Spatial variation over 10N hair swatch
We can conclude that there’s around 2% variation of the LRGB values over a hair swatch. This is far superior to the variations of the RGB values over time - without moving the sensor - that are around 0.1% (measured over 12 hours) i.e. 20 times less than the variations due to the non-uniformity of the hair swatch color. We believe that this variations are due to the local shades created by the 3D nature of the hair swatch and its fibers. If we visualize the data in a 3D RGB space, we obtain the following point cloud (Figure 53).
Figure 53: Point cloud in RGB space
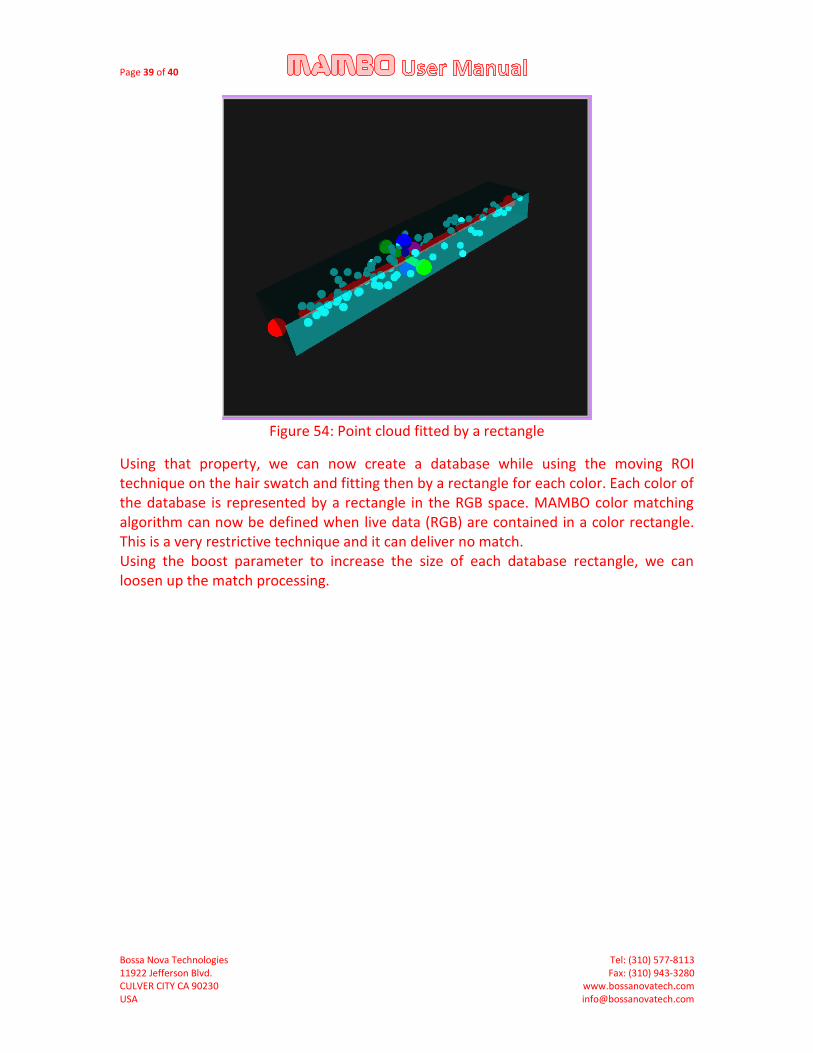
It is interesting to notice that the point cloud is not a sphere but more of a rectangle shape. Figure 54 shows the point cloud fitted by a rectangle.
Page 39 of 40
Bossa Nova Technologies Tel: (310) 577-8113 11922 Jefferson Blvd. Fax: (310) 943-3280 CULVER CITY CA 90230 www.bossanovatech.com USA [email protected]
Figure 54: Point cloud fitted by a rectangle
Using that property, we can now create a database while using the moving ROI technique on the hair swatch and fitting then by a rectangle for each color. Each color of the database is represented by a rectangle in the RGB space. MAMBO color matching algorithm can now be defined when live data (RGB) are contained in a color rectangle. This is a very restrictive technique and it can deliver no match. Using the boost parameter to increase the size of each database rectangle, we can loosen up the match processing.
Page 40 of 40
Bossa Nova Technologies Tel: (310) 577-8113 11922 Jefferson Blvd. Fax: (310) 943-3280 CULVER CITY CA 90230 www.bossanovatech.com USA [email protected]
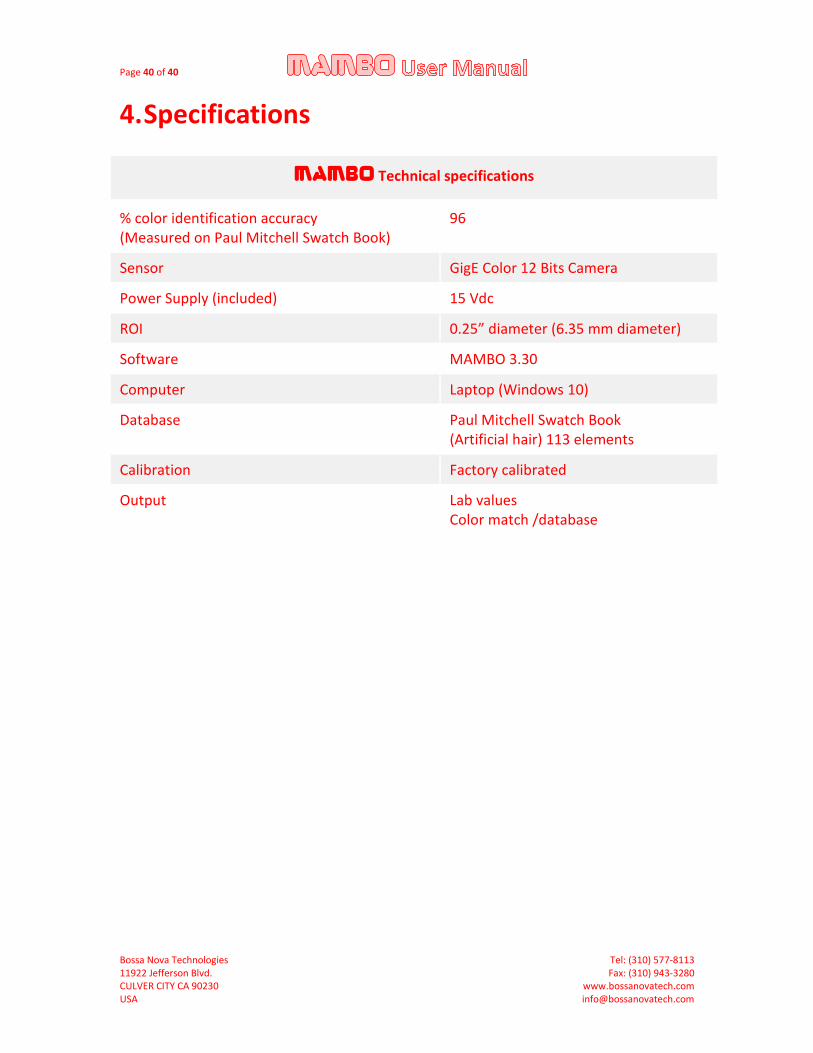
4. Specifications
MAMBO Technical specifications
% color identification accuracy (Measured on Paul Mitchell Swatch Book)
96
Sensor GigE Color 12 Bits Camera
Power Supply (included) 15 Vdc
ROI 0.25” diameter (6.35 mm diameter)
Software MAMBO 3.30
Computer Laptop (Windows 10)
Database Paul Mitchell Swatch Book (Artificial hair) 113 elements
Calibration Factory calibrated
Output Lab values Color match /database