page 1 running head: leaf senescence monitored by nmr
TRANSCRIPT
Page 1
Running Head:
Leaf senescence monitored by NMR Relaxometry.
Corresponding author: Laurent LEPORT
Name, address, telephone number, and e-mail address:
Name : Laurent Leport
Address : INRA UMR 1349 IGEPP-Institut de Génétique Environnement et Protection
des Plantes (UMR INRA – Agrocampus Ouest-Université de Rennes 1), Domaine de
la Motte, 35653 Le Rheu Cedex, France
Telephone : +(33)2 23 23 50 29
E-mail : [email protected]
Journal research area: Cell Biology
Plant Physiology Preview. Published on July 31, 2013, as DOI:10.1104/pp.113.223123
Copyright 2013 by the American Society of Plant Biologists
www.plantphysiol.orgon March 9, 2018 - Published by Downloaded from Copyright © 2013 American Society of Plant Biologists. All rights reserved.

Page 2
Title:
Structural changes in senescing oilseed rape leaves at tissular and sub-cellular levels
monitored by NMR relaxometry through water status.
Authors:
Maja MUSSE (1, 2), Loriane DE FRANCESCHI (1, 2, 3), Mireille CAMBERT (1, 2),
Clément SORIN (1, 2 ,3), Françoise LE CAHEREC (2, 3), Agnès BUREL (2, 4), Alain
BOUCHEREAU (2, 3), François MARIETTE (1, 2), Laurent LEPORT (2, 3)
(1) IRSTEA, Food Process Engineering Research Unit, 17, avenue de Cucillé, F-
35044 Rennes Cedex, France ; (2) Université Européenne de Bretagne
(http://www.ueb.eu/) ; (3) INRA, UMR 1349 IGEPP-Institut de Génétique
Environnement et Protection des Plantes (UMR INRA –Agrocampus Ouest-
Université de Rennes 1), Domaine de la Motte, 35653 Le Rheu Cedex, France ; (4)
MRic (Microscopy – Rennes Imaging Center), Faculté de Médecine, 2 avenue du
Professeur Léon Bernard, CS 34317 Rennes Cedex, France
One-sentence summary
Changes in cell water distribution during leaf senescence were revealed in oilseed
rape plants using NMR Relaxometry combined with micrographs and physiological
characterization.
www.plantphysiol.orgon March 9, 2018 - Published by Downloaded from Copyright © 2013 American Society of Plant Biologists. All rights reserved.

Page 3
Financial source
Corresponding author with e-mail address:
Laurent Leport ; E-mail : [email protected]
Present addresses of authors if different from heading
www.plantphysiol.orgon March 9, 2018 - Published by Downloaded from Copyright © 2013 American Society of Plant Biologists. All rights reserved.

Page 4
Abstract:
Nitrogen use efficiency (NUE) is relatively low in oilseed rape (Brassica napus
L.) due to weak nitrogen remobilization during leaf senescence. Monitoring the
kinetics of water distribution associated with the re-organization of cell structures
would therefore be valuable to improve characterization of nutrient recycling in leaf
tissues and the associated senescence processes.
In this study, NMR Relaxometry was used to describe water distribution and
status at the cellular level in different leaf ranks of well-watered plants. It was shown
to be able to detect slight variations in the evolution of senescence. The NMR results
were linked to physiological characterization of the leaves and to light and electron
micrographs. A relationship between cell hydration and leaf senescence was
revealed and associated with changes in the NMR signal. The relative intensities and
the transverse relaxation times of the NMR signal components associated with
vacuole water were positively correlated with senescence, describing water uptake
and vacuole and cell enlargement. Moreover, the relative intensity of the NMR signal
that we assigned to the chloroplast water decreased during the senescence process,
in agreement with the decrease in relative chloroplast volume estimated from
micrographs. The results are discussed on the basis of water flux occurring at the
cellular level during senescence.
One of the main applications of this study would be for plant phenotyping,
especially for plants under environmental stress such as nitrogen starvation.
www.plantphysiol.orgon March 9, 2018 - Published by Downloaded from Copyright © 2013 American Society of Plant Biologists. All rights reserved.
Page 5
Introduction
The main physiological outcome of leaf senescence is the recycling of organic
resources and provision of nutrients to sink organs such as storage and growing
tissues (Buchanan-Wollaston, 1997; Hikosaka, 2005; Krupinska and Humbeck,
2008). In crop plants, senescence progresses from the lower older leaves to the
younger top leaves. Macromolecular degradation and the mechanism of re-allocation
of breakdown products are mediated by up-regulation of senescence-related genes
(Lee et al., 2001) in close relationship with both developmental and environmental
conditions (Gombert et al., 2006). This leads to remobilization of carbon (C) and
nitrogen (N) compounds mostly from plastidial compartments (Martínez et al., 2008;
Guiboileau et al., 2012), involving proteolytic activity in plasts, vacuole and cytosol
(Adam and Clarke, 2002; Otegui et al., 2005), chlorophyll breakdown
(Hoertensteiner, 2006), galactolipid recycling (Kaup et al., 2002) in the plastoglobules
(Brehelin et al., 2007) and loading of sucrose and amino acids into the phloem
through appropriate transporters (Wingler et al., 2004; Masclaux-Daubresse et al.,
2008). In terms of leaf senescence at the cell level where chloroplasts are degraded
sequentially, relative organelle volume does not seem to be greatly modified, the
vacuole remains intact and in darkness-induced senescence the number of
chloroplasts per cell decreases only slightly (Keech et al., 2007). However, major
changes in metabolic fluxes and cell water relationships are expected during the
senescence program that may be associated with macromolecule catabolism,
organic solute synthesis, transport and remobilization and cell structure
reconfiguration such as chloroplast evolution to gerontoplast (Hoertensteiner, 2006;
Zhang et al., 2010) through the autophagy process (Wada et al., 2009), accumulation
of senescence-associated vacuoles (Otegui et al., 2005) and cell wall degradation
(Mohapatra et al., 2010).
The senescent leaves of oilseed rape (Brassica napus L.), a major oleiferous
crop, generally fall while still maintaining a high N content (about 2.5-3 % (w/w) of the
dry matter) (Malagoli et al., 2005). In addition to the environmental impact of this
leaking of N out of the plant, the low capacity to remobilize foliar N is associated with
a high requirement for N fertilization to meet the potential crop yield (Dreccer et al.,
2000). In order to improve the N use efficiency (NUE), new genotypes are being
selected for their ability to maintain high yields under limited N fertilization, mainly via
www.plantphysiol.orgon March 9, 2018 - Published by Downloaded from Copyright © 2013 American Society of Plant Biologists. All rights reserved.
Page 6
improvement of N uptake efficiency and N mobilization from the senescing leaves
(Hirel et al., 2007). In Arabidopsis and oilseed rape, N can be remobilized from old to
expanding leaves at the vegetative stage during sequential senescence as well as
from leaves to seeds at the reproductive stage during monocarpic senescence
(Malagoli et al., 2005; Diaz et al., 2008; Lemaitre et al., 2008). Senescence can also
be induced by environmental stress such as N starvation (Etienne et al., 2007) or
water deficit (Reviron et al., 1992), and propagated from old to mature leaves and
delayed in young leaves, suggesting finely tuned high regulation of metabolism at the
whole-plant level with consequences for NUE (Desclos et al., 2008). One major
challenge to understanding the efficiency of senescence-induced organic resource
re-allocation and to highlighting major molecular and mechanistic attributes of
nutrient recycling is the monitoring kinetics of the structural re-organization of cell
structures. This re-organization will provide nutrients remobilized thought phloem-
loading. From a technological and phenotyping point of view, measurement of N
remobilization efficiency has already been addressed in crop species and oilseed
rape as it is a reliable trait to screen for genetic variability of NUE (Franzaring et al.,
2012). However, techniques such as stable isotope feeding are time consuming,
destructive and difficult to adapt to large genotype panels. It is therefore important to
develop a technique for following changes in water distribution at the cell level in
order to understand metabolic reconfigurations occurring throughout senescence.
NMR Relaxometry has been used in several studies to investigate plant cell
structure and functioning (Hills and Duce, 1990; Van As, 1992). The 1H-NMR signal
originates almost entirely from water protons because other 1H nuclei in the plant
produce much less intense signals as they correspond to molecules that are at a
much lower concentration than water. The technique allows measurement of
longitudinal (T1) and transverse relaxation times (T2) and proton spin density. Water
proton relaxation times are related to the rotational and translational mobility of water
molecules (Van As, 2007). They are also modified by the mobility and structure of the
surrounding macromolecules (i.e. starch, proteins and polysaccharides) through
proton exchange (chemical exchange). In plant cells, the water in different cell
compartments has different chemical and physical properties, and therefore different
bulk T2 values. Moreover, relaxation times are affected by exchange of molecules
between different compartments that is determined by water diffusion and therefore
by the compartment size and membrane permeability (Van der Weerd et al., 2002).
www.plantphysiol.orgon March 9, 2018 - Published by Downloaded from Copyright © 2013 American Society of Plant Biologists. All rights reserved.

Page 7
The slow diffusion process between compartments results in multi-exponential
behaviour of the relaxation signal. The multi-exponential relaxation reflects water in
cell compartments and can therefore be used to study changes in water distribution
and properties at a sub-cellular level and hence be used for estimation of structural
and volume transformations in cell compartments. The T2 relaxation time is more
sensitive to small variations in water content and chemical exchange processes than
T1, and is therefore usually preferred. Indeed, differences in T1 for the different
compartments are relatively small, resulting in an averaging effect which results in
poor discrimination between water compartments (Van As, 2007).
To date, NMR relaxometry has mainly been used for characterisation of fruit
and vegetable tissues and it has been shown to be effective in providing valuable
information about cell organization (Sibgatullin et al., 2007). However, although a
number of studies have contributed to the interpretation of the NMR results (Snaar
and Van As, 1992; Hills and Nott, 1999; Marigheto et al., 2009), this is still not always
straightforward as the NMR signal depends both on the nature of the plant tissue and
on the NMR measurement protocol. The situation is even more complex in the case
of leaves, because leaves contain different tissue types characterized by different cell
sizes and structures (Teixeira et al., 2005) and only a few studies involving NMR
Relaxometry in leaves have been reported. Changes in T2 in response to high
temperature were investigated in wheat (Maheswari et al., 1999) in order to develop
a method for detection of heat injury. McCain et al. (McCain, 1995) measured the T2
relaxation time of chloroplast and non-chloroplast water in maple leaves by
separating corresponding peaks in an NMR spectrum (McCain, 1995) without taking
into account the compartmentalization of non-chloroplast water. Oshita et al. (Oshita
et al., 2006) investigated cell membrane permeability to water in spinach leaves by
measuring the T1 relaxation time of the leaf protoplasts without consideration of the
subcellular structure. Qiao et al. (Qiao et al., 2005) attempted to associate NMR
signal components with different chive cells using combined transverse relaxation
and restricted diffusion measurements. Finally, Capitani et al. (Capitani et al., 2009)
recently used a portable unilateral NMR instrument to detect the water status of
leaves of herbaceous crops, mesophyllous trees and natural mediterranean
vegetation under field conditions. Further investigations are therefore necessary to
improve leaf characterization by NMR, especially in the attribution of NMR signal
components to the tissular and subcellular compartments. Progress in this field would
www.plantphysiol.orgon March 9, 2018 - Published by Downloaded from Copyright © 2013 American Society of Plant Biologists. All rights reserved.
Page 8
make it possible to use the full potential of non-invasive NMR Relaxometry in plant
research and phenotyping.
Using NMR Relaxometry, we describe here the differences in water status
which occured at tissue and cellular levels through different leaf ranks of well irrigated
oilseed rape plants, from the young leaves at the top of the canopy to the senescing
older leaves at the bottom of the plant. The aim of the study was to show that
changes that occur in the leaves while senescing can be related to changes in water
distribution and cell structure. As these changes are directly linked to the
modifications in cell compartment organization, especially those occurring in the
chloroplast, vacuole and cell wall due to macromolecule degradation and N and C
reallocation processes, this study was designed to contribute to the understanding of
these physiological processes.
Results
Changes in physiological traits during leaf development
The whole group of plants grown under homogeneous conditions in a growth
cabinet displayed a similar developmental pattern in terms of phenological and
physiological status. The different leaf stages (corresponding to leaves of different
ages) were collected from eight-week-old plants rank by rank and analyzed for
physiological status (Fig. 1). All the individual plants used for measurement had a set
of well developed leaves from the youngest green leaves at the top (leaf rank 8) to
the yellowish and most senescent leaves at the bottom (leaf ranks 1 and 2).
Chlorophyll content, stable from leaf ranks 8 to 6, decreased markedly from leaf rank
4 to 1 (Fig. 1A). The highest level of starch content was found at around leaf rank 6,
again with a decrease in senescing leaves from ranks 4 to 1. Used as global
indicators of leaf growth and development, this information ensures the choice of leaf
ranks studied through NMR, i.e. rank 8 for younger fully expanded leaves, rank 6 for
mature leaves and ranks 4 to 1 for senescing leaves.
Fig. 1B depicts dry and fresh weights of leaves and Fig. 1C shows the corresponding
water content and water weight data. Dry weight (expressed per m2 of leaf area)
decreased from leaf rank 6 to leaf rank 1, whereas a considerable increase in fresh
weight and water content was observed from leaf ranks 6 to 1. The senescence
process was clearly associated with hydration (increase in quantity of water per unit
www.plantphysiol.orgon March 9, 2018 - Published by Downloaded from Copyright © 2013 American Society of Plant Biologists. All rights reserved.
Page 9
leaf area) in leaf tissues whereas dry matter was depleted. This phenomenon was
also confirmed in the leaf water status experiment (Fig. 2), in which the increase in
water content from the youngest (leaf rank 8) to the oldest (leaf rank 1) leaves was
less pronounced but statistically significant. The ANOVA test showed also that
differences in leaf water potential and osmotic potential of the youngest (leaf rank 8)
and oldest (leaf rank 1) tissues, associated with increase in fresh weight were
statistically significant. Turgor pressure, relative water content and water deficit did
not change significantly with senescence.
Cab/SAG - molecular milestones of leaf development
The physiological characteristics (chlorophyll content, starch deposition &
water status) provided a general pattern of leaf development along the plant axis.
However, the physiological status of the individual plants studied varied to some
extent in terms of leaf development due to growth conditions and heterogeneity of the
micro-environment (see standard deviations in Fig. 1). In addition, these traits did not
make it possible to detect slight physiological variations as the senescence process
occurred progressively from one leaf rank to another. In order to evaluate this
variability between leaf ranks more precisely, the expression levels of genes
previously used to describe the leaf development status of oilseed rape were
followed (Gombert et al., 2006). Thus the expression pattern of genes known to be
up-regulated (SAG12-1 coding a cysteine protease) or down-regulated (Cab coding a
chlorophyll a/b-binding protein) during leaf senescence was established for five
plants throughout the vegetative axes (Fig. 3A). The concomitant measurement of
SAG12 and Cab gene transcript levels provided accurate monitoring of progression
of leaf senescence and allowed a theoretical leaf rank to be seen as a critical
transition step where the source status took precedence over the sink status (Fig.
3B). For instance, in the example shown, expressions of Cab and SAG12 were
relatively stable from leaf rank 8 to leaf rank 5, while from leaf rank 4 a strong
decrease in Cab expression associated with an increase in SAG12 were observed.
The theoretical leaf rank differed from plant to plant and was identified in leaf ranks 1
to up to 4 (Table 1). It must therefore be emphasized that, although the plants
studied further by NMR displayed homogenous macroscopic phenological traits,
individual differences were observed in terms of physiological status of leaves of the
www.plantphysiol.orgon March 9, 2018 - Published by Downloaded from Copyright © 2013 American Society of Plant Biologists. All rights reserved.
Page 10
same ranks. SAG12/Cab value can be used to target leaves at the same
development status, although it does not make it possible to define this status. For
example, leaf rank 1 of plant P-1 was comparable to leaf rank 2 of plant P-11 and to
leaf rank 3 of plant P-13. In addition, SAG12/Cab results suggested that leaf rank 3
corresponded to a younger leaf in plant P-1 than in plant P-6.
NMR signal evolution during leaf senescence
The relaxation decay in leaf samples corresponding to the separate CPMG
(Carr Purcell Meiboom Gill) data was described by three or four relaxation
components depending on developmental stage of the leaf. A typical example of the
distribution of transverse relaxation times obtained by the maximum entropy method
(MEM) for different development stages is given in Fig. 4, with the peaks centered at
the most probable T2 values and the peak areas representing the intensity of the T2
components. Three components were observed by the MEM method for the
youngest leaf analyzed (Fig. 4A), with the shortest T2-component centered at about 3
ms and representing about 8% of the total signal intensity, the intermediate
component centered at about 25 ms (19% of the signal intensity) and the longest T2-
component at about 100 ms (73% of the signal intensity). For the example shown,
the shortest component remained in the same range of T2 throughout leaf tissue
ageing, until the late senescence stage (leaf rank 1) when it disappeared. The T2 of
the intermediate component was about 20 ms for all measurements, while its relative
signal intensity decreased (from 19% to 13%, for leaf ranks 8 and 1, respectively).
The T2 of the longest T2-component increased from the youngest to the most
senescent leaf, starting progressively to split into two components between leaf ranks
3 and 2. Fig. 4E shows four distinct components measured at leaf rank 2, with the
two longest T2-components centered at about 190 ms and 340 ms, respectively.
Finally, the T2 values of the two longest T2-components were about 220 ms and 450
ms, for the late senescence leaf (Fig 4F). The sum of relative signal intensities of the
two longest T2-components increased from 73% to 87% with senescence (for leaf
ranks 8 and 1, respectively). The T2 distribution shown in Fig. 4 was very similar for
the sixteen plants analyzed (data not shown). However, some differences were
observed between plants with regard to the leaf rank where the split occurred,
www.plantphysiol.orgon March 9, 2018 - Published by Downloaded from Copyright © 2013 American Society of Plant Biologists. All rights reserved.
Page 11
confirming previously suspected physiological heterogeneity within leaf ranks. In
Table 1, the plants are classified according to the leaf rank at which the longest T2-
component split into two components. It can be seen that the critical transition of the
SAG12/Cab ratio (second column) fitted well with the NMR results, for the five plants
studied.
The discrete solutions for the complete decay curve (FID+CPMG) obtained by
the Levenberg-Marquardt algorithm agreed to a great extent with the MEM results of
the separate CMPG curve and in addition provided access to the first component,
relaxing at about a few tens of µs (Table 2). The relative intensity of this component
(I0(comp.1)) decreased during senescence, while its T2(comp.1) seemed to increase only
for the most senescent leaf.
As previously explained, the NMR signal from vegetable tissue can be
attributed mainly to protons from water molecules, characterized by T2 relaxation
times in the range of few ms or more. However, T2-components relaxing at lower
relaxation times (in the range of 10 to 100 µs) in principle correspond to solid matter.
In order to check this assumption, the intensity of the first component of the FID-
CPMG signal at equilibrium state (I0(comp.1)) was correlated with dry matter mass and
the sum of the intensities of the other components (I0(comp.2-5)) to the water mass. Both
relationships (Fig. 5) were linear and positive (r²=0.75 for I0(comp.1) and r²=0.89 for
I0(comp.2-5) ), and demonstrated that the signal from the first component of the FID-
CPMG sequence corresponded to the dry matter and the sum of the signals from the
other components to the water, independently of leaf age. In addition, as already
explained, the results confirmed that the water and dry matter masses depended on
leaf age. The dry matter mass of leaf samples (dry weight per leaf area) and I0(comp.1)
for young leaves were relatively high and decreased for mature and senescing
leaves, while the water mass and I0(comp.2-5) were highest in the most senescent
leaves (ranks 1 and 2) (Fig. 5).
Fig. 6 shows the relative signal intensities and mean values of T2 for the
sixteen plants studied, expressed in leaf water weight (LWW) for all components,
obtained by the Levenberg-Marquardt algorithm. Since the total intensity of
components 2 to 5 (I0(comp.2-5)) was strongly correlated with total water mass for young
to senescent leaves for all plants (Fig. 5B), variations in water mass related to each
component were calculated through leaf development (Fig. 6A). The results showed
that increase in leaf water weight (expressed in water mass per leaf area) of
www.plantphysiol.orgon March 9, 2018 - Published by Downloaded from Copyright © 2013 American Society of Plant Biologists. All rights reserved.

Page 12
senescing leaves was due to the increase in amount of water associated with
components 4 and particularly 5. However, leaf water weight associated with
component 3 slightly decreased (Fig. 6A), while that of component 2 remained
unchanged. Note that LWW increase reflected cumulative effects of both increase in
signal intensity and water mass.
The overall trend for T2 of components was the same as in the example given
in Table 2. The T2 of components 4 and 5 increased markedly (Fig. 6C), which could
be related to the increase in the amount of water associated with these components
(Fig. 6A).
Correlation between NMR signal and physiological traits of leaves
Principal Component Analysis (PCA) was performed in order to draw up a
general framework of all the variables measured. The first principal component (PC1,
72.8% of total variance) appeared to be mainly assigned with leaf development (Fig.
7A). First, young leaves (leaf rank 6) were characterized by high levels of chlorophyll
and starch content and dry matter (right part of PCA – Fig. 7B) whereas the most
senescent leaves (leaf ranks 1 – 2) were characterized by higher water content (left
part of PCA – Fig. 7B). This is in agreement with the phenomenon of dry weight lost
during senescence, associated with chlorophyll and starch breakdown. Moreover, the
results demonstrated that this loss of dry weight was correlated with increase in leaf
water content and therefore hydration of leaf tissues. Secondly, the high intensities of
the second (I0(comp.2)) and third (I0(comp.3)) components of the NMR signal were
associated with the youngest leaves (right part of PCA - Fig. 7B), whereas the high
total intensity of components 4 and 5 (I0(comp.4-5)) and the high value of the
corresponding T2(comp.4-5) were associated with the most senescent leaves (left part of
PCA - Fig. 7B).
The Pearson correlation coefficients of the PCA analysis set out in Fig. 7 A
and B are shown in Table 3.
Relationship between NMR signal and cell structure
www.plantphysiol.orgon March 9, 2018 - Published by Downloaded from Copyright © 2013 American Society of Plant Biologists. All rights reserved.
Page 13
Optical micrographs from young (A-B) and senescent (C-D) leaf tissues are
shown in Fig. 8. Four parallel layers of cells can be observed on the images (upper
and lower epidermis, palisade and spongy layers). As expected, the palisade layer
(PL) was composed of elongated, relatively tightly packed cells arranged in 2 to 3
rows, while the spongy layer (SL) was made up of rounded cells with large
intercellular spaces. Moreover, most of the chloroplasts were stuck to the
plasmalemma, especially in the palisade mesophyll. The upper and lower
monolayered epidermal cells can be easily seen in the images. Both the length and
width of the palisade mesophyll cells increased considerably in senescing tissues,
whereas those of the spongy mesophyll cells seemed to remain almost unchanged.
The number of chloroplasts per cell appeared to remain stable throughout the
senescence process, and consequently their relative volume decreased compared to
the relative volume of the vacuole. The regular shape of chloroplasts was preserved
in most of the senescent leaves studied (Fig. 8 C-D), indicating that the end of the
senescence process had not been reached, even for these leaves. Finally, the area
of palisade cells of senescent leaves was estimated to be about four times greater
than that of the corresponding young leaf tissues.
Variations in the volume of vacuoles, chloroplasts and cell wall (Fig. 9A) were
estimated (see Materials and Methods, Eqs. 7-9). A considerable decrease in the
relative volume of the plastidial compartment was observed as senescence
progressed. In the young leaves the chloroplast volume was roughly estimated to be
about 40% of the cell volume, and it dropped to below 20% in the most senescent
leaves. In contrast, the size of the vacuole increased from about 55% to almost 80%.
Finally, our method did not permit clear detection of variations in cell wall volume,
although the results seemed to indicate a minor volume reduction (Fig. 9 A).
Fig. 9 B depicts the relative intensities of the NMR signal components for
young and senescent leaves that can be considered as an estimation of water
distribution in cell compartments. Similar patterns can be observed in the NMR and
the microscopy results, on comparing Fig. 9 A and B. For young leaves, the vacuole
occupied about 55% of the cell volume, whereas the intensity of components 4+5
was about 65%. The relative vacuole volume for senescing leaves increased to about
80%, and a similar phenomenon was observed for the relative intensity of
components 4+5 (~85%). On the other hand, chloroplast volume in young leaves was
estimated to be about 40%, decreasing to about 20% in senescing leaves, whereas
www.plantphysiol.orgon March 9, 2018 - Published by Downloaded from Copyright © 2013 American Society of Plant Biologists. All rights reserved.

Page 14
the relative intensity of the third component decreased from about 20% to about
10%. Finally, cell wall volume was estimated to be about 5% and 3% for young and
senescing leaves, respectively, and the relative NMR signal intensity of the second
component decreased from 9% to 2% according to leaf maturity.
It should be noted that the variations in the volumes of vacuoles, chloroplasts
and cell wall were estimated roughly, as the spongy layer and the upper and lower
epidermal cells occupying the leaf surface were ignored in the analysis. Additionally,
exchange of protons between different cell compartments over the biological
membranes can affect the relative intensities of different NMR signal components.
DISCUSSION
Senescence induced changes at the cell level
The biochemical markers for identification of leaf senescence used in this
study have already been described in the literature (Masclaux et al., 2000; Desclos et
al., 2008). The decreases in chlorophyll and starch content (Fig. 1) that we observed
in senescent leaves were in accordance with the literature (Diaz et al., 2005; Albert et
al., 2012). However, although these biochemical traits are relevant to providing a
general view of senescence across plant shoots (Gombert et al., 2006), they are not
precise enough to be used for comparisons between leaf ranks from different plants.
Molecular markers such as SAG12/Cab gene expression (Gombert et al., 2006)
provided a more precise description of changes in leaf development (Fig. 3) although
handling them is fairly complex.
The senescence process has been well described in several reviews
(Thomas and Stoddart, 1980; Buchanan-Wollaston et al., 2003; Lim et al., 2007) and,
as far as we are aware, it is commonly accepted that water loss occurs in leaves
during senescence (McIntyre, 1987). Decrease in specific leaf dry weight during
senescence, reflecting the drain of organic constituents from the leaves to other plant
organs has also been described (McIntyre, 1987; Malagoli et al., 2005; Fischer,
2007). In the present study, as expected, a decrease in dry weight was observed for
senescing leaves (Fig. 1B). However, an increase in water content was observed
(Fig. 1C), leading to an increase in total specific leaf water weight. Moreover, the
relatively high increase in cell size associated with tissue hydration of leaves during
natural senescence was observed (Figs. 8 and 9). This increase in cell size has not,
www.plantphysiol.orgon March 9, 2018 - Published by Downloaded from Copyright © 2013 American Society of Plant Biologists. All rights reserved.

Page 15
to our knowledge, been previously reported in the literature. Thomas and Stoddart
(Thomas and Stoddart, 1980) described senescing leaves with increasingly
vacuolated cells and with a diminishing rim of cytoplasm, but they did not report cell
enlargement. Keech et al. (Keech et al., 2007) reported an increase in the perimeter
of mesophyll cells of Arabidopsis leaves during senescence induced by dark
treatment. The cell enlargement process has been reviewed by Cosgrove (Cosgrove,
1993, 1999). It occurs prior to cell growth associated with dry matter production and
depends on the ability of the wall to loosen and to undergo stress relaxation. Cell wall
extensibility is mediated by several protein factors, especially alpha-expansin
expression (Cosgrove, 1999). The consequence of the cell enlargement process is
water uptake. This process has not previously been reported in senescing tissues,
although alpha-expansin expression has been studied during floral development. It
has been linked to an early development stage corresponding to the rapid expansion
associated with cell growth, but was also found in senescing floral tissues (Gookin et
al., 2003). Finally, Reid and Chen (Reid and Chen, 2007) reported that cell wall
loosening also occurred in senescing flower tissues due to degradation of cell wall
macromolecules. The results of the present study, i.e. micrographs (Fig. 8) and
measurements of water status (Fig. 2), clearly demonstrated that a process of cell
enlargement occurred in senescing leaves (especially for palisade cells) and that it
was associated with cell hydration. Considering the trend in cell wall volume
estimated from the leaf tissue micrographs (Fig. 9) and the observations reported for
flower tissues (Reid and Chen, 2007), this process could be explained by
degradation of cell wall macromolecules that induces changes in the fibrillar structure
of the cell wall and consequently causes water uptake from adjacent tissues. In our
study, the slight and consistent increase in water content was associated with a slight
increase in leaf water potential and osmotic potential (Fig. 2), probably reflecting
tissue hydration. We demonstrated that this variation in leaf water content was not
linked to a water stress event as the water deficit remained constant. As the relative
water content (RWC, see Eq. 4, Materials and Methods section) that can be
expressed as RWC=water content/(turgid weight/fresh weight – dry weight/fresh
weight) remained unchanged, water content increase and dry weight decrease,
associated with the fresh weight at full turgor increase, suggested an increase in cell
wall elasticity. The latter is in agreement with the micrograph observations.
www.plantphysiol.orgon March 9, 2018 - Published by Downloaded from Copyright © 2013 American Society of Plant Biologists. All rights reserved.
Page 16
Interpretation of the NMR signal of senescing leaves
The results of previous NMR studies performed on leaves differ from our
results, as the NMR signal depends on leaf tissue type and on the measurement and
signal processing protocols. For instance, T2 measurements in wheat leaves
(Maheswari et al., 1999) were performed by the CPMG method at the same magnetic
field as that used in our study (20 MHz), but with considerably fewer sampling points
(250 instead of 6000) and with longer pulse separation (0.5 ms instead of 0.1 ms
used in our study) at temperatures from 35 to 58°C. They obtained bi-exponential T2
decay, with the longer T2-component of T2=130-180 ms and I0=65-70% attributed to
intracellular water and the shorter component of T2=40-60 ms attributed to
extracellular and hydration water. These two components correspond roughly to the
two longest T2-components measured in our study in relatively young oilseed rape
leaves (Table 2). The T2-component relaxing at 3 ms in oilseed rape leaves was not
observed because of the relatively long pulse space, and the very small number of
points sampled for the CPMG curve. Finally, in the Maheswari’s study, the CPMG
decay curve was acquired over 250 ms which was not long enough for reliable fitting
of the curve since the baseline was not reached (last point < 1.4 x T2-max). On the
other hand, Capitani et al. (Capitani et al., 2009) investigated the leaves of several
species using a portable unilateral NMR apparatus (18.153 MHz) characterised by an
inhomogeneous magnetic field that did not allow measurement of the FID signal and
produced shortening of the T2 values measured. Relaxation decays in the unstressed
leaves were described by two- or three-exponential decays with T2 values of up to 40
ms. This approach has been demonstrated to be promising for application in field
conditions, but was not focused on interpretation of the NMR signal. Any comparison
with our results thus seems difficult. The results of studies on chive tissues (Qiao et
al., 2005) performed at 300 MHz were interpreted at the tissue level; T2/diffusion
peaks were assigned to cells of different tissue types, such as palisade and spongy
layers and xylem vessels. The subcellular level was not considered in their study,
although in green leaf tissues chloroplasts represent a significant level of cell volume.
For instance, in wheat, chloroplasts occupy up to 70% of the surface area of
mesophyll cells and approximately 20% of their volume (Ellis and Leech, 1985). In
addition, they are believed to have distinct relaxation and diffusion properties (Van
As, 2007) due to their small size (about 6 μm in diameter). The results of T2
measurements obtained in maple leaves at 300 MHz using a different approach
www.plantphysiol.orgon March 9, 2018 - Published by Downloaded from Copyright © 2013 American Society of Plant Biologists. All rights reserved.
Page 17
(McCain, 1995) differed considerably from those in chive tissue. Chloroplast water
was discriminated and its T2 was surprisingly estimated to be higher than the T2 of
non-chloroplast water.
Except for the last study mentioned, the longest T2 component is generally
associated with vacuolar water (Van As, 2007), because of its relatively high mobility.
It usually also has the highest relative intensity, as the vacuole encloses the highest
amount of cell water (Teixeira et al., 2005). As explained above, young and mature
leaves (leaf ranks 8-3) were characterized in our study by three water-associated
components (Fig. 4). According to the literature, the highest T2 component could be
attributed to the vacuole, as it represented about 70% of the total water and had a
relatively long T2 (about 100-200 ms) depending on the leaf rank (Table 2). In
senescing leaves, this water fraction was distributed between two NMR components,
still representing three quarters of the total water. This could be explained by tissue
heterogeneity that was emphasized during senescence. In fact, differentiation in cell
morphology between palisade and spongy layers was observed on light micrographs
(Fig. 8) and showed that cell enlargement occurred only for palisade cells. This
heterogeneity of cell size may affect the NMR relaxation times (Van der Weerd et al.,
2002) of the two cell types (Qiao et al., 2005), resulting in the increase in T2 of
enlarged palisade cells. Finally, the relative signal intensity of the two longest T2-
components and its trend during senescence approximately matched the relative
volume of the vacuole estimated from the light micrographs (Fig. 9).
T2 values of these vacuole-associated components increased during
senescence, particularly the T2 of the fifth component (Fig. 6). This can be explained
by increase in vacuole size, according to the sensitivity of T2 to compartment size
(Van der Weerd et al., 2002) and by water influx induced by senescence. On the
other hand, entry of dead-end metabolites of organic component degradation
occurring during the senescence process (Buchanan-Wollaston et al., 2003; Wada et
al., 2009) could shorten T2 values through chemical exchange between protons of
these metabolites and water protons. However, the latter process seemed to be
minor comparing with the effects of water content increase due to rise in water
amount in the vacuolar compartment.
The overall results of this study indicated that the third T2-component could
probably be assigned to the plastidial water. Chloroplast volume and its trend during
senescence estimated from the micrographs matched well the relative intensity of the
www.plantphysiol.orgon March 9, 2018 - Published by Downloaded from Copyright © 2013 American Society of Plant Biologists. All rights reserved.

Page 18
third T2-component (Fig. 9). Covering of the mature cell surface by chloroplasts
varies considerably in higher plants, with a total chloroplast area per unit plan area of
cell greater than 70% in spinach and as low as 25% in Nicotiana glutinosa (Honda et
al., 1971). However, as shown by Ellis and Leech (Ellis and Leech, 1985) the
chloroplast volume is fairly constant in leaf mesophyll tissue for any given species.
Their results demonstrated that chloroplasts represented up to 40% of total cell
volume for mature leaves. As the chloroplast dimensions measured (about 6 µm
diameter and 2 µm thick) were in agreement with the literature (Ellis and Leech,
1985), their volume can be estimated to be about 50 µm3, also in accordance with
the literature (Zellnig et al., 2010). On the other hand, plastids are distributed as a
peripheral monolayer in mesophyll cells (Ellis and Leech, 1985) in the same way as
in cells of equivalent size and shape. Their average number may therefore be
estimated as about 90 chloroplasts per cell (with an estimated volume of less than
12000 µm3) and the relative volume to be about 40%. However, this percentage may
be slightly overestimated as in species such as wheat there are fewer than 70
chloroplast for cells as large as 1400 µm² (Ellis and Leech, 1985). Following the
hypothesis that chloroplast water content is about 50%, based on the ratio of the
relative volumes of well watered stroma and lipid-enriched thylakoids and
plastoglobules (Zellnig et al., 2010) and as the water content increases markedly in
the gerontoplast due to the loss of thylakoid membranes, the estimated volume of
plastidial water weighed by water content fitted even better the amount of water
computed from the NMR signal intensity. The T2 of the third component has only
been reported for maple leaves (McCain, 1995) to our knowledge. Its value in their
study was surprisingly high (about 40 ms) considering that measurements were
performed at a relatively high magnetic field (300 MHz). The plastid T2 obtained in
the present study (Table 2) was in the same range, although it was measured at 20
MHz. However, in view of the differences in size between plastidial and vacuolar
compartments, such plastidial T2 values appeared to be in agreement with the T2
found for vacuoles.
Finally, the low T2 value (Table 2) of the second component (about 3 ms)
should correspond to that of water close to macromolecules or to solid surfaces (Van
As, 2007), and this component represented about 10% of the cell water (Table 2).
Different hypotheses can therefore be proposed for its attribution, such as starch
hydration water or cell wall water. Firstly, the T2 value measured (Mariette et al.,
www.plantphysiol.orgon March 9, 2018 - Published by Downloaded from Copyright © 2013 American Society of Plant Biologists. All rights reserved.

Page 19
1999; Tang et al., 2000) and the fact that component 2 disappeared in the most
senescent leaves at the same time as the starch suggest that it may correspond to
water in starch granules. However, according to Mariette et al. (Mariette et al., 1999),
the mass of water enclosed in starch granules per total starch mass is 0.3829 g/g
and it was estimated to be 0.3% for leaf rank 6. This is far beyond the relative
intensity of component 2. On the other hand, the T2 values measured (Table 2) may
indicate that component 2 corresponds to the water in rapid exchange with cell wall
protons according to the attribution proposed for fruit (Sibgatullin et al., 2007).
Additionally, the relative water volume enclosed in the cell wall could correspond to
the relative NMR signal intensity of component 2 (Fig. 9). The fact that the second
component disappeared in the most senescent leaves could be explained by cell wall
thinning associated with macromolecule degradation.
As demonstrated above, the first component was attributed to dry matter
protons. The analysis performed did not allow going into further details. Indeed, the
sole organic compound quantified was starch and it represented between 1 and 5%
of the dry weight, while dry matter content represented between 20 and 8% of the
total weight, depending on the leaf senescence stage. On the other hand, the
intensity of the first component relaxing at about 30µs was about 5% of the total FID-
CPMG signal.
The PCA analysis (Fig. 7) showed that chlorophyll breakdown and starch
degradation were associated with leaf aging. The NMR signal was shown to be able
to describe this senescence-induced sub-cellular water redistribution. For instance,
the relative intensity of components 4 and 5 (I0(comp.4+5)) and the transverse relaxation
times (T2(comp.4+5)) associated with vacuole water were positively correlated with
senescence, describing water entry and vacuole enlargement. On the other hand, the
relative intensity of the third component (I0(comp.3)) was negatively correlated with
senescence, describing the decrease in the relative volume of the chloroplasts.
CONCLUSION
This study demonstrated that NMR Relaxometry is a powerful technique for
monitoring leaf development, as T2 measurements provide access to the cell
structure through sub-cellular water distribution. Applied to a wide leaf panel, this
technique was shown to be able to detect slight variations in senescence evolution
www.plantphysiol.orgon March 9, 2018 - Published by Downloaded from Copyright © 2013 American Society of Plant Biologists. All rights reserved.
Page 20
accurately. Combining NMR with microscopy and physiological characterization
throughout the senescence process contributed to understanding of the attribution of
NMR signal components. The results represent an important step toward further
studies investigating the biological significance of the signal.
One of the main applications of leaf NMR Relaxometry would be in field
applications, such as leaf tagging and plant phenotyping. It will be necessary first to
investigate the leaf NMR signal in relation to different environmental conditions, such
as water or nitrogen depletion. As field applications require portable NMR devices,
and this will inevitably weaken the quality of the signal, this aspect should be also
evaluated.
One other important application of the proposed technique will be to improve
understanding of plant functioning at cell and tissue levels. Changes in the water
distribution and cell structure during any physiological process or under abiotic or
biotic stress are not directly accessible with currently used techniques and therefore
NMR represents a promising and powerful technique for plant investigations.
MATERIALS AND METHODS
Plant material, experimental design and growth conditions About 100 seeds of oilseed rape Brassica napus L., genotype Tenor, were
individually weighed and the 45 most homogeneously sized seeds selected. Each
working day for 3 weeks, 3 seeds were sown in individual containers filled with a
growing medium (FALIENOR 9226-6F2) containing 65% light peat, 20% dark peat
and 15% perlite. Three-week-old seedlings were individually planted into two-liter
pots filled with the same growing medium and grown in a growth cabinet for 5 weeks.
Plants were watered throughout the growing period, with a fertilizing solution
(Liquoplant bleu) used at 3‰ and irrigation was adjusted to the evaporation-
transpiration rate of the pots. The growth cabinet conditions were 14hr daylight (at
200 µmol photons m-2 s-1) and 10hr dark (relative humidity: 75/90 %; temperature:
20/18 °C).
Sixteen of the forty-five plants (P-1 to P-16) were selected (about 1 out of
every 3 plants analyzed) in order to obtained homogeneous plants with a wide range
www.plantphysiol.orgon March 9, 2018 - Published by Downloaded from Copyright © 2013 American Society of Plant Biologists. All rights reserved.
Page 21
of leaf development status, characterized by non-destructive measurement of
chlorophyll content.
Direct measurements of leaf water status were performed in an additional
experiment on the plants grown in same conditions as described above. For these
measurements, 10 seeds were sown, 6 three-week-old seedlings were individually
planted and thereafter 4 plants were selected (P-17 to P-20).
Sampling For the sixteen plants selected (P-1 to P-16), leaf tissues were collected from
six leaves (four senescing leaves, one mature and one young leaf) for NMR
measurements, and microscopy studies were performed on the same leaves as for
NMR analysis but for only five plants (plants P-1, P-5, P-6, P-10 & P-11). Starch was
quantified for all leaves from all sixteen plants, and molecular analyses were
performed for all leaves from five plants (plants P-1, P-6, P-11, P-12 & P-13).
Six leaf discs of 8 mm in diameter were cut from the limb tissue for the NMR
experiment. In order to obtain homogeneous tissues, discs were taken from each
side of the central vein as close as possible to the vein by avoiding lateral nervures.
Discs were then placed in NMR tubes which were closed with a 2-cm long Teflon cap
to avoid water loss during measurements.
For microscopy studies, 18 leaves from five plants were analyzed. About 30 1-
mm² leaf samples per leaf were taken with a small punch around the discs used for
NMR analysis. The leaf samples were immediately fixed in a solution of 2.5% m/v
glutaraldehyde and 2% m/v paraformaldehyde in 0.1 M phosphate buffer, pH 6.8.
For starch quantification and for gene expression, two sets of 20 leaf discs
(diameter of 8 mm) were collected from all leaves near the location where NMR and
microscopy were performed, then frozen in liquid nitrogen and stored at 80° C.
For the direct measurements of leaf water status, 5 leaves (leaf ranks 1, 2, 4, 6
and 8) were selected from each plant (P-17 to P-20). Prior to leaf water status
measurements, NMR measurements were performed on all selected leaves.
Starch quantification
www.plantphysiol.orgon March 9, 2018 - Published by Downloaded from Copyright © 2013 American Society of Plant Biologists. All rights reserved.
Page 22
Starch was quantified according to the method proposed by Smith (Smith and
Zeeman, 2006). Starch was extracted from 30 mg dry weight of freeze-dried lamina
leaf tissue using 1 mL phosphate buffer (0.2 mol. L-1, pH 6.5) for 20 min at 95°C. The
supernatant was collected after centrifugation at 14,000 x g for 5 min at 4°C. The
extraction step was repeated twice and the supernatants were pooled. Starch
quantification was performed following the manufacturer’s recommendations (Sigma,
# STA20) after hydrolysis by α-amylase and amyloglucosidase. Starch content was
expressed in glucose equivalent after subtraction of free glucose content.
CAB/SAG molecular markers
RNA extraction Total RNA was extracted from 500 mg fresh weight of frozen lamina leaf
tissue. The RNA isolation protocol based on phenol extraction and lithium chloride
precipitation was applied as described by Verwoerd et al. (1989). The quantity and
quality of RNA samples were assessed by spectrophotometry with a NanoDrop ND
1000.
RT-PCR analysis Total RNA (2 µg) treated with RNase-free DNase I (Fermentas, Thermo Fisher
Scientific Inc., Waltham, MA, USA) was reverse transcribed with Moloney murine
leukemia virus reverse transcriptase (M-MLV RTase) (Q-BIOgene, MP Biomedicals,
Illkirch, France) following the manufacturer’s recommendations. PCR reactions were
performed using specific primers for Brassica napus Cab gene LHCII type I
(AY288914) (forward primer 5’-GGCAGCCCATGGTACGGATC-3’ and reverse
primer 5’-CCT CCITCGCTGAAGATCTGT-3’), primers shared by SAG12-1
(AF089848) (forward primer 5’-GTTTTGTTTAGCCAAAGTCAAACA-3’ and reverse
primer 5’-CGGCGGAAGATTGGCT-3’) and primers designed from Arabidopsis
thaliana EF1α (X16430) (forward primer 5’-GTTTTGTTTAGCCAAAGTCAAACA-3’
and reverse primer 5’-CGGCGGAAGATTGGCT-3’). All the PCRs were performed
with Q biogen Taq polymerase for 35 cycles for EF1α , 27, 29 and 31 cycles for
SAG12-1 and 22, 24 and 26 cycles for Cab. After 5 min at 95°C, RT-PCRs were
performed by cycles including 15s at 95°C, 40s at 60°C and 72°C for 1 min, and one
www.plantphysiol.orgon March 9, 2018 - Published by Downloaded from Copyright © 2013 American Society of Plant Biologists. All rights reserved.
Page 23
cycle at 72°C for 10 min. Products of 183 bp, 587 bp and 290 bp were amplified from
BnEF1α, BnSAG12-1 and BnCab gene cDNAs, respectively, as verified by
sequencing. RT-PCR products were separated by agarose gel electrophoresis. Each
PCR product was quantified using image J software and normalized using the
intensity of the EF1α RNA signal. For all RT-PCR reactions, EF1α RNA was used as
a cDNA synthesis and amplification control. Relative expressions of Cab and SAG12-
1 were determined with reference to the maximum and represented the mean of PCR
products obtained after different PCRs with various numbers of cycles.
NMR Relaxometry NMR Relaxometry measurements were performed on a 20 MHz spectrometer
(Minispec PC-120, Bruker, Karlsruhe, Germany) equipped with a thermostatted
probe. The temperature was set at 18°C. T2 was measured using the combined FID-
CPMG sequence. The FID is known to be affected by the heterogeneity of the
magnetic field B0. The FID relaxation rate (1/T2FID) can be described as a sum of the
intrinsic relaxation rate (1/T2intrinsic) and the relaxation related to B0 inhomogeneities
(1/T2inhomogeneity). In the experimental condition used (0.47 T and very short sampling
time, see below) the T2inhomogeneity was equal to 1.7 ms. Then for T2 less than 100 µs
its effect was negligible and the T2 measured from the FID was equal to T2intrinsic. The
CPMG sequence was used for measurements of T2 longer than 500 µs because this
sequence is not corrupted by B0 inhomogeneity effects. The FID signal was acquired
from 11 µs to 70 µs at a sampling decay of 0.4 µs. For the CPMG measurements, the
90°-180° pulse spacing was 0.1 ms and the signal of a single point at the echo
maximum was acquired. Data were averaged over 64 acquisitions. The number of
successive echoes recorded was adjusted for each sample according to its T2. The
recycle delay for each sample was adjusted after measurement of the T1 with a fast-
saturation-recovery sequence. The total time of acquisition of data for T2 (including
spectrometer adjustments and T1 measurement) was about 10 min per sample.
Fitting was performed in two steps: first T2 relaxation curves from the CPMG
data only (after removing the FID signal from the combined FID-CPMG signal) were
fitted by Scilab software according to the MEM (Mariette et al., 1996), which provides
a continuous distribution of relaxation components without any assumption
concerning their number. In this representation, the peaks of the distribution are
www.plantphysiol.orgon March 9, 2018 - Published by Downloaded from Copyright © 2013 American Society of Plant Biologists. All rights reserved.
Page 24
centered at the corresponding most probable T2 values, while peak areas correspond
to the intensity of the T2 components. Then, T2 relaxation curves obtained by the
combined FID-CPMG sequence were also analyzed using the Levenberg-Marquardt
algorithm which allows a discrete solution for the complete fitting curve according to
the equation:
offsetTtITtItI ii
i +−+−= ∑=
)/exp()²/exp()( 22
0121 Eq. 1
where I0i is the intensity of the ith exponential at the equilibrium state and T2i
the characteristic transverse relaxation time for the ith exponential. The number of
terms that best described the relaxation curve was determined by examining the
residual plots and the values of the coefficient of determination.
Water relations The water relations were studied for all leaf samples examined by NMR. Leaf
samples were weighed within the NMR tubes before (fresh weight) and after each
NMR experiment in order to check possible water loss during the measurements. At
the end of the NMR experiments, samples were transferred to laboratory cups and
dried in an oven at 103°C for 24 h and weighed (dry weight). The water content (WC)
was expressed as percentage of fresh weight :
WC = (fresh weight – dry weight)/fresh weight Eq. 2
Dry matter, fresh matter and water masses were calculated on the basis of leaf
area of the six leaf discs used. Specific leaf water weight per component (LWWi) was
computed according to the equation :
A
mxILWW wi
i0=
Eq. 3
where mw corresponds to water mass of the NMR sample made of six leaf discs in g,
A to the area of the discs in m2 and I0i to the relative intensity of the ith NMR signal
component as %.
www.plantphysiol.orgon March 9, 2018 - Published by Downloaded from Copyright © 2013 American Society of Plant Biologists. All rights reserved.

Page 25
Relative water content (RWC) was measured as described by Turner et al.
(Turner et al., 2007). Leaf samples were placed in a vial, weighed and then floated
for 2h on freshly distilled water at 4°C. The turgid weight was then determined. The
sample was then oven-dried at 70°C for 48h and weighed. The RWC is then :
RWC = (fresh weight – dry weight)/(turgid weight-dry weight) Eq. 4
Leaf water potential (Ψl) and leaf osmotic potential at that RWC (πRWC) were
measured as described previously (Leport et al., 1999).
The turgor pressure (T) was calculated as:
T = Ψl – πRWC
Eq. 5
The water deficit (WD) was calculated as:
WD = 1-RWC.
Eq. 6
Electron and light microscopy
Sample preparation and micrograph acquisition
After sampling, the fixative solution (2% (w/v) paraformaldehyde, 2.5% (w/v)
glutaraldehyde) was infiltrated into the leaf tissues using 5 cycles of depressurization
with a vacuum pump (15 min of low pressure in each cycle). Samples were replaced
in the same fixative solution for 24 h at 4°C. After extensive washing in 0.2 mol. L-1
phosphate buffer (PB, pH 6.8), samples were incubated for 60 min in 2% (w/v) tannic
acid solution in PB, washed in PB and post-fixed for 90 min with 2% (w/v) osmium
tetroxide. Samples were then washed in PB and dehydrated in a graded series of
increasing concentrations of ethanol (50, 70, 90 and 100% v/v). Pure ethanol was
then replaced by propylene oxide and samples were gradually infiltrated with
increasing concentrations (30, 50, 70 and 100% v/v) of epoxy resin (mixed with
propylene oxide) for a minimum of 3 h per step. Samples were left overnight in epoxy
resin. Infiltration with DMP30-epoxy resin was continued the next day for 3 h.
Samples were finally embedded in a new mix of DMP30-epoxy resin and polymerized
at 60°C for 24 h.
www.plantphysiol.orgon March 9, 2018 - Published by Downloaded from Copyright © 2013 American Society of Plant Biologists. All rights reserved.

Page 26
For photonic microscopy, thin sections (500 nm) were cut with a UCT LEICA
ultramicrotome and stained with toluidine blue before they were observed with a
NIKON Eclipse 80i microscope. For transmission electron microscopy analysis
(TEM), ultra thin sections (80 nm) were then cut with a UCT LEICA ultramicrotome,
placed on grids post-stained for 60 min with uranyl acetate and then for 20 min with
lead citrate and viewed with a JEOL 1400 TEM supplied with a GATAN Orius
camera.
Model A simplified model similar to that employed by McCain et al (McCain, 1995)
was used to interpret microscope images. Our model took into account only the
palisade layer and assumed it to be an ordered arrangement of water-filled cells with
an ellipsoidal shape. It was also assumed that cell width was equal to cell depth, wall
thickness was uniform over the cell and that chloroplasts covered all the inner
surface of cell walls while the hyaloplasma contained a negligible water fraction of the
cell. As the focus was on the layer that was most affected by senescence, where
most of the chloroplasts can be found, the spongy layer was not taken into
consideration.
An example of the optical microscope images used for estimation of cell and
vacuole dimensions is shown in Fig. 10A. The optical microscope images were also
used to measure the perimeter of the cell wall, and its thickness was estimated from
MET images (Fig. 10B).
The vacuole (VVACUOLE), chloroplast (VCHLOROPLAST) and wall (VWALL) volumes
were estimated using the model according to following equations:
VVACUOLE = 3/4π x 1/8 x [Wv² x LV] Eq. 7
VCHLOROPLAST = 3/4π x 1/8 x [(WC² x LC)-(WV² x LV)] Eq. 8
VWALL = 3/4π x 1/8 x [((WC + 2WW)² x (LC + 2WW))-(WC² x LC)] Eq. 9
where WC is cell width, LC cell length, WV vacuole width, LV vacuole length, LW wall
length and WW wall thickness. WC and LC do not include the cell wall.
Microscopy images were analyzed using ImageJ software. The images were
first manually segmented and quantitative data related to cell structure were then
www.plantphysiol.orgon March 9, 2018 - Published by Downloaded from Copyright © 2013 American Society of Plant Biologists. All rights reserved.

Page 27
extracted from the two youngest and the two most senescent leaves analyzed. Data
were expressed as percentage of the total cell volume in order to compare the
evolution of the relative volume of the different compartments with that of the intensity
of the different NMR signal components.
Data analyses
Correlation (PCA)
Principal component analysis (PCA), defined as an unsupervised descriptive
multivariate statistics tool, was performed with R software, package FactomineR, on
the 50 data sets from 11 plants (P-1, P-3, P-4, P-6, P-7, P-8, P-9, P-11, P-13, P-14
and P-15,), consisting of the changes in 10 multivariate data of the six leaves at
different leaf ranks (6 to 1). The multivariate data were: chlorophyll, starch and water
content, dry matter, T2(comp.1), T2(comp.3), T2(comp.4+5) (weighted average of T2(comp.4) and
T2(comp.5)), and I0(comp.2), I0(comp.3) and I0(comp. 4+5) corrected for the receiver gain and the
sample weight.
Analysis of variance
Analysis of variance was performed using the software package Statgraphics
Plus (Centurion) to detect significant differences (P<0.01) between measurements on
different leaf ranks. The one-factor ANOVA test was applied to the different leaf water
status measurements. The multiple range Fisher LSD (Least Significant Difference)
test was used to detect significant differences between groups.
Acknowledgments
The authors thank Dominique Poulain* for help with the statistical analyses. We also
thank the Greenhouse team, particularly Laurent Charlon**, Loic Daniel** and Patrick
Rolland**. Finally, we thank Sophie Rolland** for starch analysis, Anne-Marie
Gouraud** for molecular analysis and Françoise Leprince** and Patrick Leconte** for
sample processing.
* UMR SAS (INRA- AGROCAMPUS OUEST)
www.plantphysiol.orgon March 9, 2018 - Published by Downloaded from Copyright © 2013 American Society of Plant Biologists. All rights reserved.

Page 28
** IGEPP
REFERENCES:
Adam Z, Clarke AK (2002) Cutting edge of chloroplast proteolysis. Trends in Plant Science 7: 451-456
Albert B, Le Caherec F, Niogret M-F, Faes P, Avice J-C, Leport L, Bouchereau A (2012) Nitrogen availability impacts oilseed rape (Brassica napus L.) plant water status and proline production efficiency under water-limited conditions. Planta 236: 659-676
Brehelin C, Kessler F, van Wijk KJ (2007) Plastoglobules: versatile lipoprotein particles in plastids. Trends in Plant Science 12: 260-266
Buchanan-Wollaston V (1997) The molecular biology of leaf senescence. Journal of Experimental Botany 48: 181-199
Buchanan-Wollaston V, Earl S, Harrison E, Mathas E, Navabpour S, Page T, Pink D (2003) The molecular analysis of leaf senescence - a genomics approach. Plant Biotechnology Journal 1: 3-22
Capitani D, Brilli F, Mannina L, Proietti N, Loreto F (2009) In Situ Investigation of Leaf Water Status by Portable Unilateral Nuclear Magnetic Resonance. Plant Physiology 149: 1638-1647
Cosgrove DJ (1993) Wall extensibility: its nature, measurement and relationship to plant cell growth New Phytologist 124: 1-23
Cosgrove DJ (1999) Enzymes and other agents that enhance cell wall extensibility. Annual Review of Plant Physiology and Plant Molecular Biology 50: 391-417
Desclos M, Dubousset L, Etienne P, Le Caherec F, Satoh H, Bonnefoy J, Ourry A, Avice J-C (2008) A proteomic profiling approach to reveal a novel role of Brassica napus drought 22 kD/water-soluble chlorophyll-binding protein in young leaves during nitrogen remobilization induced by stressful conditions. Plant Physiology 147: 1830-1844
Diaz C, Lemaitre T, Christ A, Azzopardi M, Kato Y, Sato F, Morot-Gaudry J-F, Le Dily F, Masclaux-Daubresse C (2008) Nitrogen recycling and remobilization are differentially controlled by leaf senescence and development stage in Arabidopsis under low nitrogen nutrition. Plant Physiology 147: 1437-1449
Diaz C, Purdy S, Christ A, Morot-Gaudry JF, Wingler A, Masclaux-Daubresse CL (2005) Characterization of markers to determine the extent and variability of leaf senescence in Arabidopsis. A metabolic profiling approach. Plant Physiology 138: 898-908
Dreccer MF, Schapendonk A, Slafer GA, Rabbinge R (2000) Comparative response of wheat and oilseed rape to nitrogen supply: absorption and utilisation efficiency of radiation and nitrogen during the reproductive stages determining yield. Plant and Soil 220: 189-205
Ellis JR, Leech RM (1985) Cell-size and chloroplast size in relation to chloroplast replication in light-grown wheat leaves. Planta 165: 120-125
Etienne P, Desclos M, Le Goua L, Gombert J, Bonnefoy J, Maurel K, Le Dily F, Ourry A, Avice J-C (2007) N-protein mobilisation associated with the leaf senescence process in oilseed rape is concomitant with the disappearance of trypsin inhibitor activity. Functional Plant Biology 34: 895-906
Fischer AM (2007) Nutrient remobilization during leaf senescence In S Gan, ed, Senescence Processes in Plants, Annual Plant Reviews Vol 26. Blackwell Publishing New York pp 87-107
www.plantphysiol.orgon March 9, 2018 - Published by Downloaded from Copyright © 2013 American Society of Plant Biologists. All rights reserved.
Page 29
Franzaring J, Gensheimer G, Weller S, Schmid I, Fangmeier A (2012) Allocation and remobilisation of nitrogen in spring oilseed rape (Brassica napus L. cv. Mozart) as affected by N supply and elevated CO2. Environmental and Experimental Botany 83: 12-22
Gombert J, Etienne P, Ourry A, Le Dily F (2006) The expression patterns of SAG12/Cab genes reveal the spatial and temporal progression of leaf senescence in Brassica napus L. with sensitivity to the environment. Journal of Experimental Botany 57: 1949-1956
Gookin TE, Hunter DA, Reid MS (2003) Temporal analysis of alpha and beta-expansin expression during floral opening and senescence. Plant Science 164: 769-781
Guiboileau A, Yoshimoto K, Soulay F, Bataille M-P, Avice J-C, Masclaux-Daubresse C (2012) Autophagy machinery controls nitrogen remobilization at the whole-plant level under both limiting and ample nitrate conditions in Arabidopsis. New Phytologist 194: 732-740
Hikosaka K (2005) Leaf canopy as a dynamic system: Ecophysiology and optimality in leaf turnover. Annals of Botany 95: 521-533
Hills BP, Duce SL (1990) The influence of chemical and diffusive exchange on water proton transverse relaxation in plant tissues. Magnetic Resonance Imaging 8: 321-331
Hills BP, Nott KP (1999) NMR studies of water compartmentation in carrot parenchyma tissue during drying and freezing. Appl Magn Reson 17: 521-535
Hirel B, Le Gouis J, Ney B, Gallais A (2007) The challenge of improving nitrogen use efficiency in crop plants: towards a more central role for genetic variability and quantitative genetics within integrated approaches. Journal of Experimental Botany 58: 2369-2387
Hoertensteiner S (2006) Chlorophyll degradation during senescence. In Annual Review of Plant Biology, Vol 57, pp 55-77
Honda SI, Hongladarom-Honda T, Kwanyuen P, Wildman SG (1971) Interpretations on chloroplast reproduction derived from correlations between cells and chloroplasts. Planta 97: 1-15
Kaup MT, Froese CD, Thompson JE (2002) A role for diacylglycerol acyltransferase during leaf senescence. Plant Physiology 129: 1616-1626
Keech O, Pesquet E, Ahad A, Askne A, Nordvall D, Vodnala SM, Tuominen H, Hurry V, Dizengremel P, Gardestroem P (2007) The different fates of mitochondria and chloroplasts during dark-induced senescence in Arabidopsis leaves. Plant Cell and Environment 30: 1523-1534
Krupinska K, Humbeck K (2008) Senescence processes and their regulation. Plant Biology 10: 1-3
Lee RH, Wang CH, Huang LT, Chen SCG (2001) Leaf senescence in rice plants: cloning and characterization of senescence up-regulated genes. Journal of Experimental Botany 52: 1117-1121
Lemaitre T, Gaufichon L, Boutet-Mercey S, Christ A, Masclaux-Daubresse C (2008) Enzymatic and metabolic diagnostic of nitrogen deficiency in Arabidopsis thaliana Wassileskija accession. Plant and Cell Physiology 49: 1056-1065
Leport L, Turner NC, French RJ, Barr MD, Duda R, Daves SL, Tennant D, Siddique KHM (1999) Physiological responses of chickpea genotypes to terminal drought in a Mediterranean-type environment. European Journal of Agronomy 11: 279-291
Lim PO, Kim HJ, Nam HG (2007) Leaf senescence. In Annual Review of Plant Biology, Vol 58, pp 115-136
Maheswari M, Joshi DK, Saha R, Nagarajan S, Gambhir PN (1999) Transverse relaxation time of leaf water protons and membrane injury in wheat (Triticum aestivum L.) in response to high temperature. Annals of Botany 84: 741-745
www.plantphysiol.orgon March 9, 2018 - Published by Downloaded from Copyright © 2013 American Society of Plant Biologists. All rights reserved.
Page 30
Malagoli P, Laine P, Rossato L, Ourry A (2005) Dynamics of nitrogen uptake and mobilization in field-grown winter oilseed rape (Brassica napus) from stem extension to harvest - I. Global N flows between vegetative and reproductive tissues in relation to leaf fall and their residual N. Annals of Botany 95: 853-861
Mariette F, Brannelec C, Vitrac O, Bohuon P (1999) Effet du procédé de friture sur la répartition et l'état de l'eau mesurée par RMN et IRM. In Les produits alimentaires et l'eau, Agoral 99. Edition Tec & Doc, Nantes, pp 411-416
Mariette F, Guillement JP, Tellier C, Marchal P (1996) Continuous relaxation time distribution decomposition by MEM. In DN Rutledge, ed, Signal Treatment and Signal Analysis in NMR. Elsevier, Paris, pp 218-234
Marigheto NA, Moates GK, Furfaro ME, Waldron KW, Hills BP (2009) Characterisation of Ripening and Pressure-Induced Changes in Tomato Pericarp Using NMR Relaxometry. Appl Magn Reson 36: 35-47
Martínez DE, Costa ML, Guiamet JJ (2008) Senescence-associated degradation of chloroplast proteins inside and outside the organelle. Plant Biology 10: 15-22
Masclaux-Daubresse C, Reisdorf-Cren M, Orsel M (2008) Leaf nitrogen remobilisation for plant development and grain filling. Plant Biology 10: 23-36
Masclaux C, Valadier MH, Brugiere N, Morot-Gaudry JF, Hirel B (2000) Characterization of the sink/source transition in tobacco (Nicotiana tabacum L.) shoots in relation to nitrogen management and leaf senescence. Planta 211: 510-518
McCain DC (1995) Nuclear-Magnetic-Resonance Study of Spin Relaxation and Magnetic-Field Gradients in Maple Leaves. Biophysical Journal 69: 1111-1116
McIntyre GI (1987) THE ROLE OF WATER IN THE REGULATION OF PLANT DEVELOPMENT. Canadian Journal of Botany-Revue Canadienne De Botanique 65: 1287-1298
Mohapatra PK, Patro L, Raval MK, Ramaswamy NK, Biswal UC, Biswal B (2010) Senescence-induced loss in photosynthesis enhances cell wall beta-glucosidase activity. Physiologia plantarum 138: 346-355
Oshita S, Maeda A, Kawagoe Y, Tsuchiya H, Kuroki S, Seo Y, Makino Y (2006) Change in diffusional water permeability of spinach leaf cell membrane determined by nuclear magnetic resonance relaxation time. Biosystems Engineering 95: 397-403
Otegui MS, Noh YS, Martinez DE, Vila Petroff MG, Andrew Staehelin L, Amasino RM, Guiamet JJ (2005) Senescence-associated vacuoles with intense proteolytic activity develop in leaves of Arabidopsis and soybean. Plant Journal 41: 831-844
Qiao Y, Galvosas P, Callaghan PT (2005) Diffusion correlation NMR spectroscopic study of anisotropic diffusion of water in plant tissues. Biophysical Journal 89: 2899-2905
Reid MS, Chen JC (2007) Flower senescence In S Gan, ed, Senescence Processes in Plants, Annual Plant Reviews Vol 26. Blackwell Publishing New York pp 256-277
Reviron MP, Vartanian N, Sallantin M, Huet JC, Pernollet JC, Devienne D (1992) Characterization of a novel protein-induced by progressive or rapid drought and salinity in brassica-napus leaves. Plant Physiology 100: 1486-1493
Sibgatullin TA, Anisimov AV, de Jager PA, Vergeldt FJ, Gerkema E, Van As H (2007) Analysis of diffusion and relaxation behavior of water in apple parenchymal cells. Biofizika 52: 268-276
Smith AM, Zeeman SC (2006) Quantification of starch in plant tissues. Nature Protocols 1: 1342-1345
Snaar JEM, Van As H (1992) Probing water compartements and membrane permeability in plant cells by H NMR relaxation measurements. Biophys. J. 63: 1654-1658
Tang HR, Godward J, Hills B (2000) The distribution of water in native starch granules - a multinuclear NMR study. Carbohydrate Polymers 43: 375-387
www.plantphysiol.orgon March 9, 2018 - Published by Downloaded from Copyright © 2013 American Society of Plant Biologists. All rights reserved.

Page 31
Teixeira RT, Knorpp C, Glimelius K (2005) Modified sucrose, starch, and ATP levels in two alloplasmic male-sterile lines of B-napus. Journal of Experimental Botany 56: 1245-1253
Thomas H, Stoddart JL (1980) LEAF SENESCENCE. Annual Review of Plant Physiology and Plant Molecular Biology 31: 83-111
Turner NC, Abbo S, Berger JD, Chaturvedi SK, French RJ, Ludwig C, Mannur DM, Singh SJ, Yadava HS (2007) Osmotic adjustment in chickpea (Cicer arietinum L.) results in no yield benefit under terminal drought. Journal of Experimental Botany 58: 187-194
Van As H (1992) NMR in horticulture: in situ plant water balance studies with NMR. In Acta Horticulturae, pp 103-112
Van As H (2007) Intact plant MRI for the study of cell water relations, membrane permeability, cell-to-cell and long distance water transport. J. Exp. Bot. 58: 743-756
Van der Weerd L, Claessens M, Efde C, Van As H (2002) Nuclear magnetic resonance imaging of membrane permeability changes in plants during osmotic stress. Plant Cell and Environment 25: 1539-1549
Wada S, Ishida H, Izumi M, Yoshimoto K, Ohsumi Y, Mae T, Makino A (2009) Autophagy Plays a Role in Chloroplast Degradation during Senescence in Individually Darkened Leaves. Plant Physiology 149: 885-893
Wingler A, Mares M, Pourtau N (2004) Spatial patterns and metabolic regulation of photosynthetic parameters during leaf senescence. New Phytologist 161: 781-789
Zellnig G, Perktold A, Zechmann B (2010) Fine structural quantification of drought-stressed Picea abies (L.) organelles based on 3D reconstructions. Protoplasma 243: 129-136
Zhang M-P, Zhang C-J, Yu G-H, Jiang Y-Z, Strasser RJ, Yuan Z-Y, Yang X-S, Chen G-X (2010) Changes in chloroplast ultrastructure, fatty acid components of thylakoid membrane and chlorophyll a fluorescence transient in flag leaves of a super-high-yield hybrid rice and its parents during the reproductive stage. Journal of plant physiology 167: 277-285
www.plantphysiol.orgon March 9, 2018 - Published by Downloaded from Copyright © 2013 American Society of Plant Biologists. All rights reserved.

Page 32
FIGURE CAPTIONS:
Figure 1 – A) Changes in chlorophyll and starch content, B) fresh and dry weight per
leaf area and C) water weight per leaf area and water content in fresh weight ratio in
oilseed rape leaves during senescence. Values are means ± standard deviation of
sixteen individual plants (P-1 to P-16).
Figure 2 – A) Changes in water content in fresh weight ratio, relative water content
(RWC) and water deficit and B) leaf water potential (Ψl), leaf osmotic potential (πRWC)
and turgor pressure in oilseed rape leaves during senescence. Values are means ±
standard deviation of four individual plants (P-17 to P-20).
Figure 3 - Characterization of leaf status in terms of the expression of SAG12 and
Cab (data from P-13) in oilseed rape leaves during senescence. A) RT-PCR of
SAG12-1 and Cab gene expression. EF1α was used as a CDNA synthesis and
amplification control. B) Determination of the theoretical sink source transition. Cab
and SAG12-1 RNA are expressed in percentages related to the maximum (leaf # 8
for Cab and leaf # 1 for SAG12-1).
Figure 4 - Transverse relaxation time distribution (MEM) calculated from the CPMG
signal for oilseed rape leaves of 6 different leaf ranks (L). Data shown correspond to
P-5.
Figure 5 – A) Correlations between the intensity of the first components of the FID-
CPMG signal assumed to correspond to the solid proton fraction (I0(comp.1)) and dry
matter mass per leaf area and B) between the sum of the intensity of other
components of the FID-CPMG signal assumed to correspond to the water proton
fraction (I0(comps.2-5) and water mass per leaf area for young (ranks 6 and 8), median
(ranks 3 - 5) and senescing (ranks 1 and 2) oilseed rape leaves. Signal intensity was
corrected for the receiver gain. Values correspond to sixteen individual plants (P-1 to
P-16).
www.plantphysiol.orgon March 9, 2018 - Published by Downloaded from Copyright © 2013 American Society of Plant Biologists. All rights reserved.
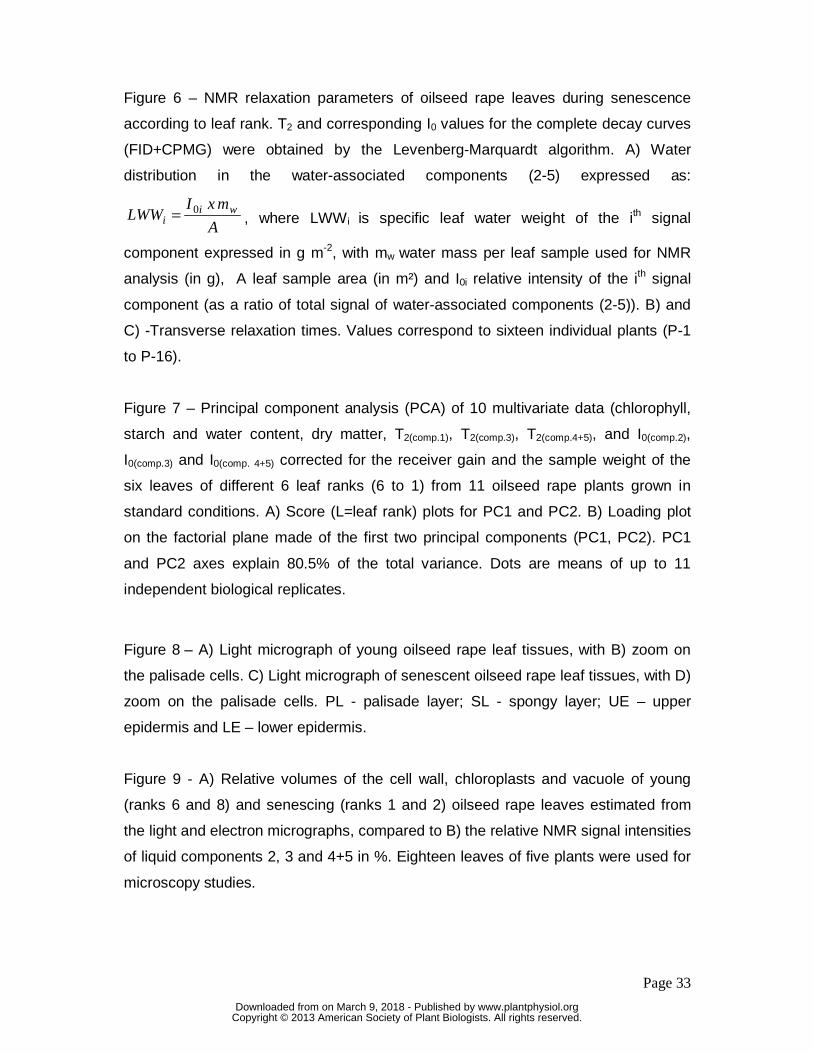
Page 33
Figure 6 – NMR relaxation parameters of oilseed rape leaves during senescence
according to leaf rank. T2 and corresponding I0 values for the complete decay curves
(FID+CPMG) were obtained by the Levenberg-Marquardt algorithm. A) Water
distribution in the water-associated components (2-5) expressed as:
A
mxILWW wi
i0= , where LWWi is specific leaf water weight of the ith signal
component expressed in g m-2, with mw water mass per leaf sample used for NMR
analysis (in g), A leaf sample area (in m²) and I0i relative intensity of the ith signal
component (as a ratio of total signal of water-associated components (2-5)). B) and
C) -Transverse relaxation times. Values correspond to sixteen individual plants (P-1
to P-16).
Figure 7 – Principal component analysis (PCA) of 10 multivariate data (chlorophyll,
starch and water content, dry matter, T2(comp.1), T2(comp.3), T2(comp.4+5), and I0(comp.2),
I0(comp.3) and I0(comp. 4+5) corrected for the receiver gain and the sample weight of the
six leaves of different 6 leaf ranks (6 to 1) from 11 oilseed rape plants grown in
standard conditions. A) Score (L=leaf rank) plots for PC1 and PC2. B) Loading plot
on the factorial plane made of the first two principal components (PC1, PC2). PC1
and PC2 axes explain 80.5% of the total variance. Dots are means of up to 11
independent biological replicates.
Figure 8 – A) Light micrograph of young oilseed rape leaf tissues, with B) zoom on
the palisade cells. C) Light micrograph of senescent oilseed rape leaf tissues, with D)
zoom on the palisade cells. PL - palisade layer; SL - spongy layer; UE – upper
epidermis and LE – lower epidermis.
Figure 9 - A) Relative volumes of the cell wall, chloroplasts and vacuole of young
(ranks 6 and 8) and senescing (ranks 1 and 2) oilseed rape leaves estimated from
the light and electron micrographs, compared to B) the relative NMR signal intensities
of liquid components 2, 3 and 4+5 in %. Eighteen leaves of five plants were used for
microscopy studies.
www.plantphysiol.orgon March 9, 2018 - Published by Downloaded from Copyright © 2013 American Society of Plant Biologists. All rights reserved.

Page 34
Figure 10 - Light (A) and electron (B) micrographs of oilseed rape leaf cell. WC - cell
width, LC - cell length, WV - vacuole width, LV - vacuole length and WW - wall
thickness.
Table 1 – Parameters of leaf water status and senescence and comparison of leaf
ranks of different plants of oilseed rape. The five plants for which critical transition of
the SAG12/Cab ratio occurred are listed in the second column. Classification of the
plants (P-1 to P-16) for which the longest T2-component splitted into two components
is given in the third column.
Table 2 - T2 and corresponding relative intensities for the complete decay curves
(FID+CPMG) obtained by Levenberg-Marquardt algorithm for 6 oilseed rape leaves
presented in Fig. 4 (P-5).
Table 3 - Pearson correlation coefficients of the data presented in Fig. 7 with CC-
chlorophyll content, DM – dry matter, SC – starch content, WC -water content.
www.plantphysiol.orgon March 9, 2018 - Published by Downloaded from Copyright © 2013 American Society of Plant Biologists. All rights reserved.
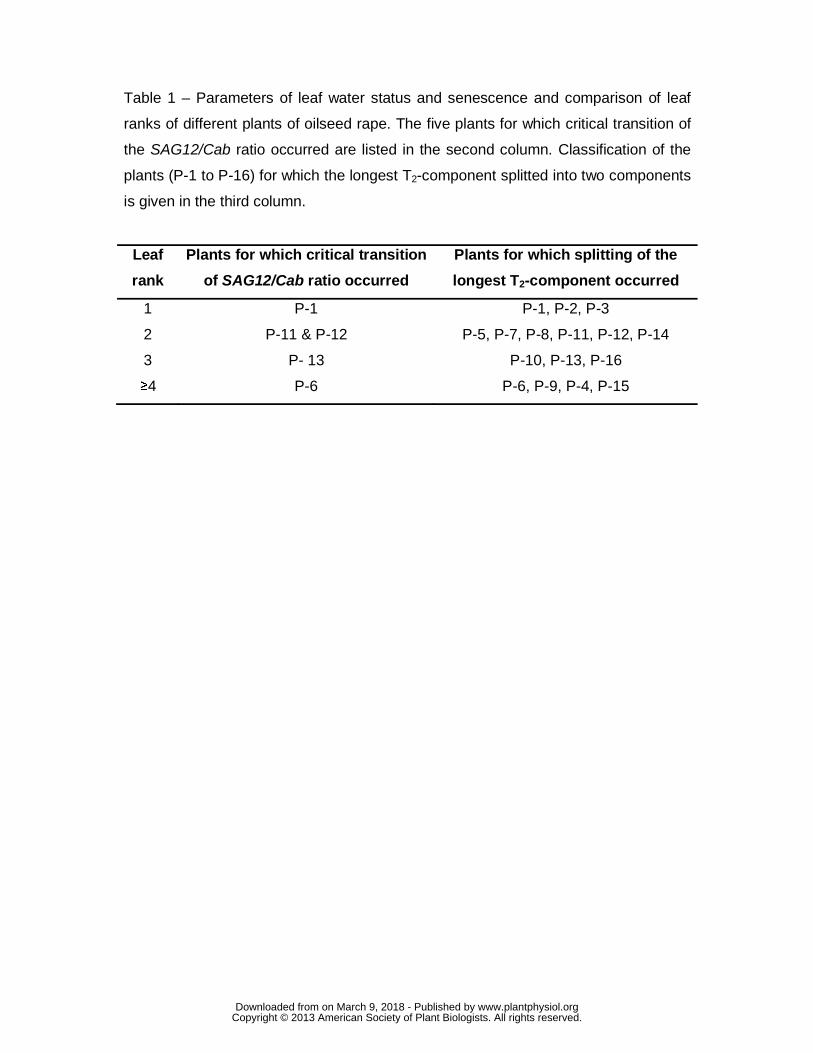
Table 1 – Parameters of leaf water status and senescence and comparison of leaf
ranks of different plants of oilseed rape. The five plants for which critical transition of
the SAG12/Cab ratio occurred are listed in the second column. Classification of the
plants (P-1 to P-16) for which the longest T2-component splitted into two components
is given in the third column.
Leaf
rank
Plants for which critical transition
of SAG12/Cab ratio occurred
Plants for which splitting of the
longest T2-component occurred
1 P-1 P-1, P-2, P-3
2 P-11 & P-12 P-5, P-7, P-8, P-11, P-12, P-14
3 P- 13 P-10, P-13, P-16
≥4 P-6 P-6, P-9, P-4, P-15
www.plantphysiol.orgon March 9, 2018 - Published by Downloaded from Copyright © 2013 American Society of Plant Biologists. All rights reserved.

Table 2 - T2 and corresponding relative intensities for the complete decay curves
(FID+CPMG) obtained by Levenberg-Marquardt algorithm for 6 oilseed rape leaves
presented in Fig. 4 (P-5).
Leaf rank Component 1 Component 2 Component 3 Component 4 Component 5 I0[%] T2[ms] I0[%] T2[ms] I0[%] T2[ms] I0[%] T2[ms] I0[%] T2[ms]
8 5 0.03 9 2 19 27 66 103 --- --- 6 6 0.03 10 3 18 27 66 132 --- --- 4 4 0.03 7 2 18 27 71 166 --- --- 3 3 0.03 7 3 18 36 72 195 --- --- 2 3 0.03 4 1 14 23 32 196 47 341 1 3 0.07 --- --- 12 21 36 222 48 448
www.plantphysiol.orgon March 9, 2018 - Published by Downloaded from Copyright © 2013 American Society of Plant Biologists. All rights reserved.
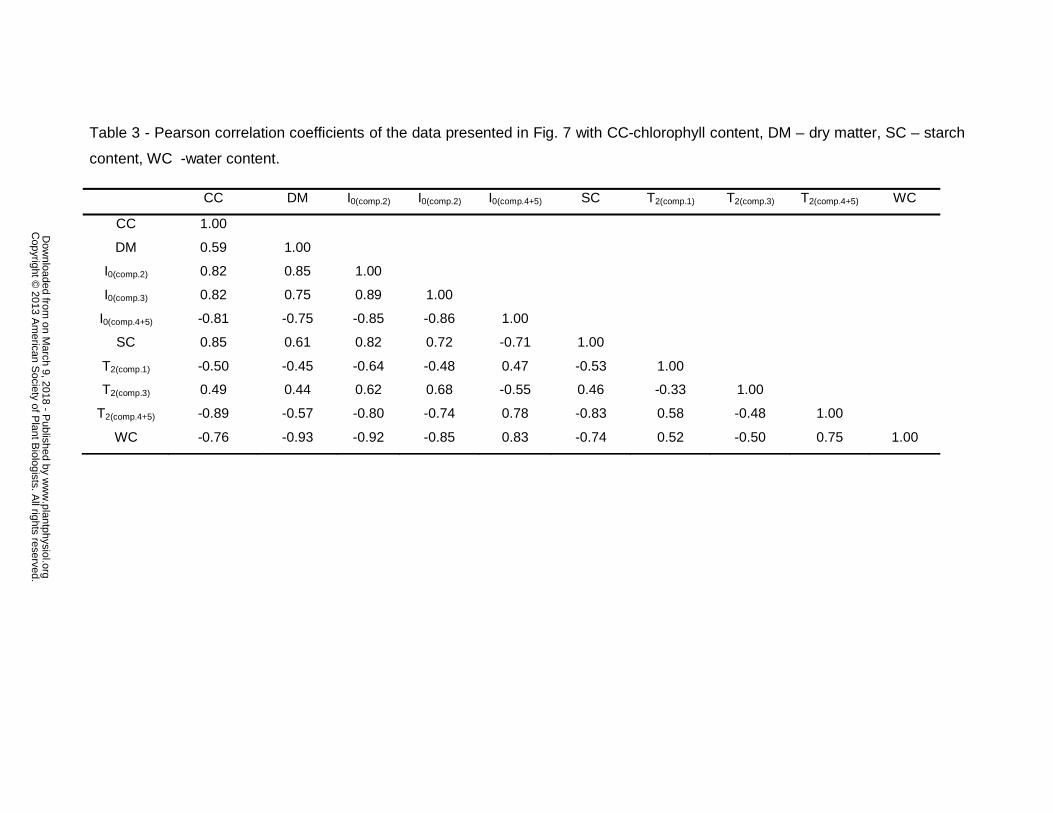
Table 3 - Pearson correlation coefficients of the data presented in Fig. 7 with CC-chlorophyll content, DM – dry matter, SC – starch
content, WC -water content.
CC DM I0(comp.2) I0(comp.2) I0(comp.4+5) SC T2(comp.1) T2(comp.3) T2(comp.4+5) WC
CC 1.00
DM 0.59 1.00
I0(comp.2) 0.82 0.85 1.00
I0(comp.3) 0.82 0.75 0.89 1.00
I0(comp.4+5) -0.81 -0.75 -0.85 -0.86 1.00
SC 0.85 0.61 0.82 0.72 -0.71 1.00
T2(comp.1) -0.50 -0.45 -0.64 -0.48 0.47 -0.53 1.00
T2(comp.3) 0.49 0.44 0.62 0.68 -0.55 0.46 -0.33 1.00
T2(comp.4+5) -0.89 -0.57 -0.80 -0.74 0.78 -0.83 0.58 -0.48 1.00
WC -0.76 -0.93 -0.92 -0.85 0.83 -0.74 0.52 -0.50 0.75 1.00
w
ww
.plantphysiol.orgon M
arch 9, 2018 - Published by
Dow
nloaded from
Copyright ©
2013 Am
erican Society of P
lant Biologists. A
ll rights reserved.
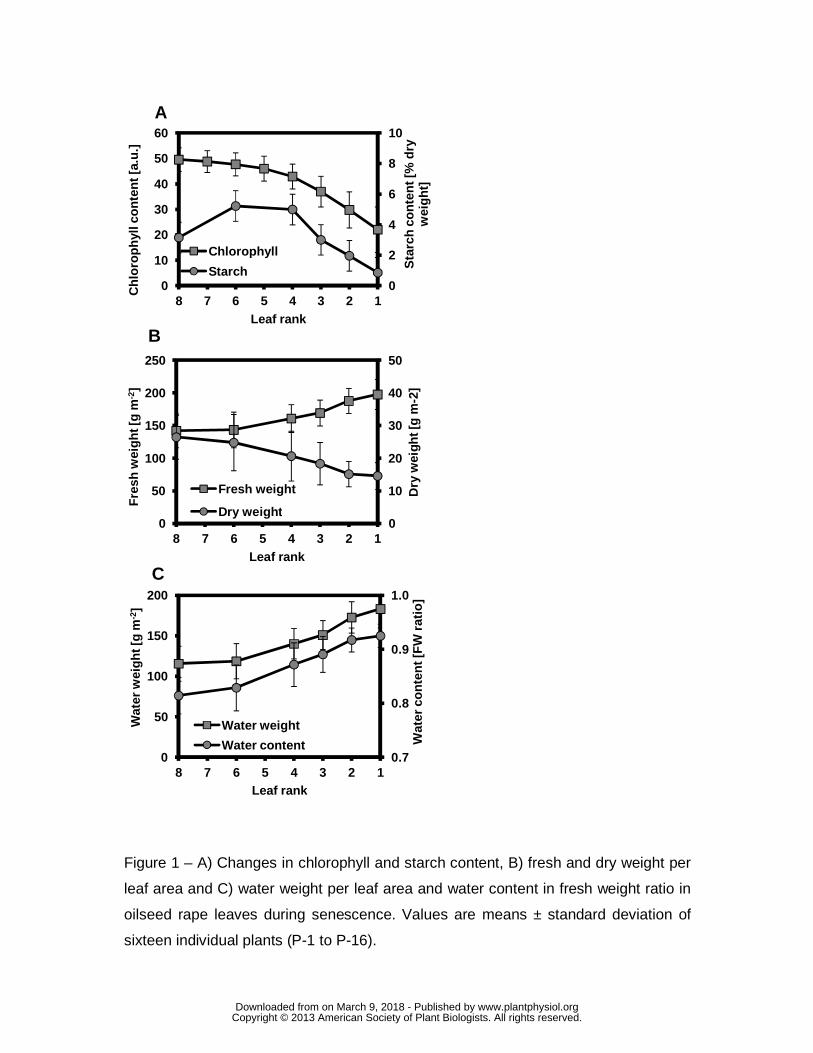
Figure 1 – A) Changes in chlorophyll and starch content, B) fresh and dry weight per
leaf area and C) water weight per leaf area and water content in fresh weight ratio in
oilseed rape leaves during senescence. Values are means ± standard deviation of
sixteen individual plants (P-1 to P-16).
0
2
4
6
8
10
0
10
20
30
40
50
60
12345678
Ch
loro
ph
yll c
on
ten
t [a.
u.]
Sta
rch
co
nte
nt [
% d
ry
wei
gh
t]
Leaf rank
Chlorophyll
Starch
0
10
20
30
40
50
0
50
100
150
200
250
12345678
Dry
wei
ght [
g m
-2]
Fre
sh w
eig
ht [
g m
-2]
Leaf rank
Fresh weight
Dry weight
0.7
0.8
0.9
1.0
0
50
100
150
200
12345678
Wat
er c
on
ten
t [F
W r
atio
]
Wat
er w
eig
ht [
g m
-2]
Leaf rank
Water weight
Water content
A
B
C
www.plantphysiol.orgon March 9, 2018 - Published by Downloaded from Copyright © 2013 American Society of Plant Biologists. All rights reserved.
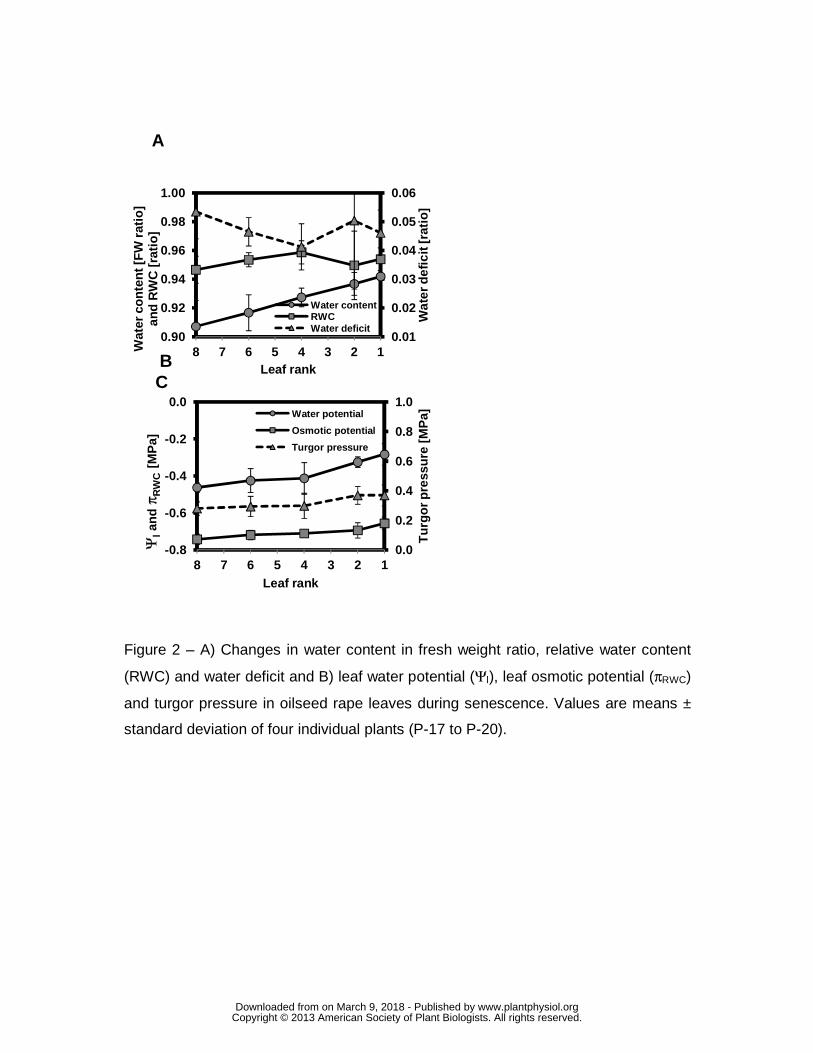
Figure 2 – A) Changes in water content in fresh weight ratio, relative water content
(RWC) and water deficit and B) leaf water potential (Ψl), leaf osmotic potential (πRWC)
and turgor pressure in oilseed rape leaves during senescence. Values are means ±
standard deviation of four individual plants (P-17 to P-20).
0.01
0.02
0.03
0.04
0.05
0.06
0.90
0.92
0.94
0.96
0.98
1.00
12345678
Wat
er d
efic
it [r
atio
]
Wat
er c
on
ten
t [F
W r
atio
] an
d R
WC
[ra
tio
]
Leaf rank
Water contentRWCWater deficit
0.0
0.2
0.4
0.6
0.8
1.0
-0.8
-0.6
-0.4
-0.2
0.0
12345678
Tu
rgo
r p
ress
ure
[M
Pa]
Ψlan
dπ R
WC
[MP
a]
Leaf rank
Water potential
Osmotic potential
Turgor pressure
B
A
C
www.plantphysiol.orgon March 9, 2018 - Published by Downloaded from Copyright © 2013 American Society of Plant Biologists. All rights reserved.

Figure 3 - Characterization of leaf status in terms of the expression of SAG12 and
Cab (data from P-13) in oilseed rape leaves during senescence. A) RT-PCR of
SAG12-1 and Cab gene expression. EF1α was used as a CDNA synthesis and
amplification control. B) Determination of the theoretical sink source transition. Cab
and SAG12-1 RNA are expressed in percentages related to the maximum (leaf # 8
for Cab and leaf # 1 for SAG12-1).
0
20
40
60
80
100
123456789
Gen
e ex
pre
ssio
n [%
/ m
ax]
Leaf rank
Cab
SAG12
B
EF1α
SAG 12-1
Cab
A 9
Leaf rank
8 7 6 5 4 3 2 1
www.plantphysiol.orgon March 9, 2018 - Published by Downloaded from Copyright © 2013 American Society of Plant Biologists. All rights reserved.
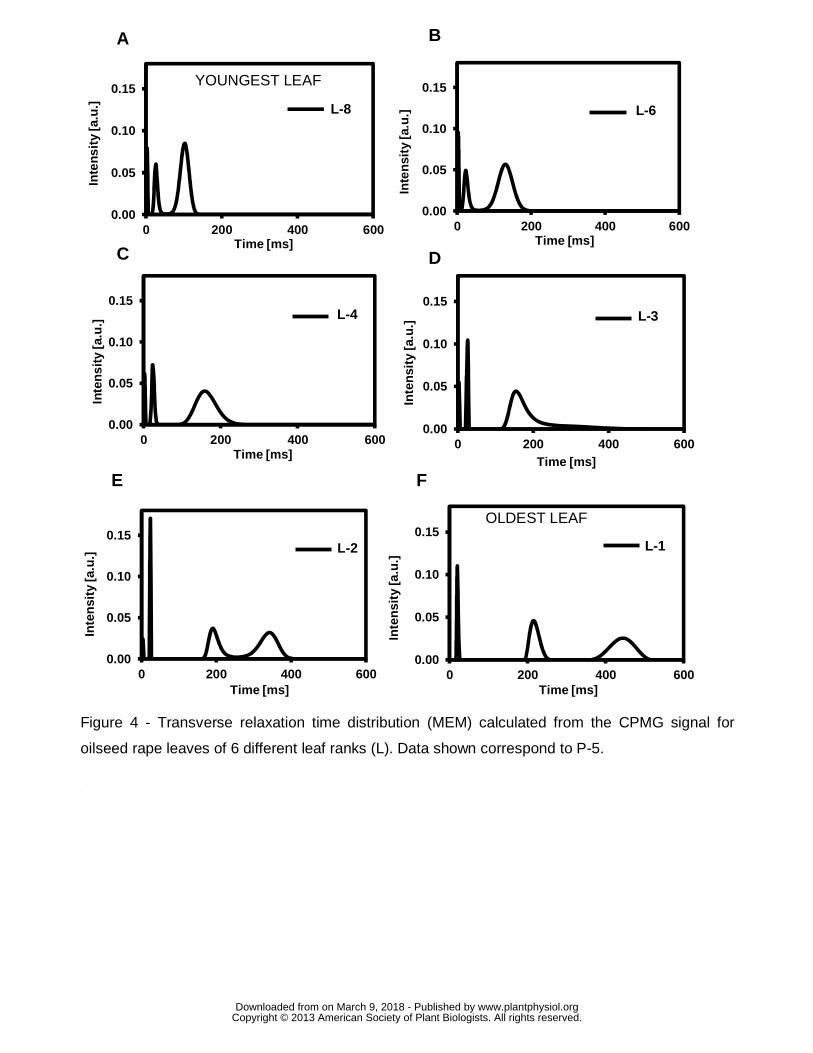
Figure 4 - Transverse relaxation time distribution (MEM) calculated from the CPMG signal for
oilseed rape leaves of 6 different leaf ranks (L). Data shown correspond to P-5.
0.00
0.05
0.10
0.15
0 200 400 600
Inte
nsit
y [a
.u.]
Time [ms]
0.00
0.05
0.10
0.15
0 200 400 600
Inte
nsi
ty [a
.u.]
Time [ms]
0.00
0.05
0.10
0.15
0 200 400 600
Inte
nsi
ty [a
.u.]
Time [ms]
0.00
0.05
0.10
0.15
0 200 400 600
Inte
nsi
ty [a
.u.]
Time [ms]
0.00
0.05
0.10
0.15
0 200 400 600
Inte
nsi
ty [a
.u.]
Time [ms]
0.00
0.05
0.10
0.15
0 200 400 600
Inte
nsi
ty [a
.u.]
Time [ms]
A
C D
E F
OLDEST LEAF
YOUNGEST LEAF
B
L-8
L-4 L-3
L-2
L-6
L-1
www.plantphysiol.orgon March 9, 2018 - Published by Downloaded from Copyright © 2013 American Society of Plant Biologists. All rights reserved.
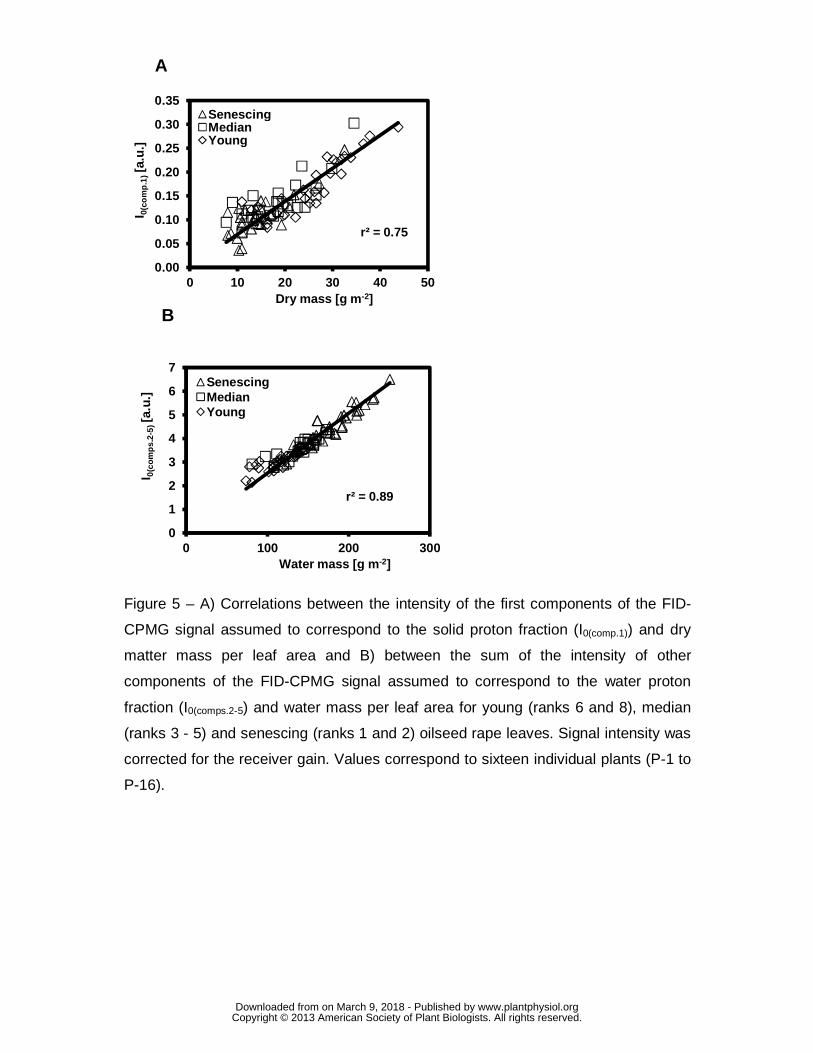
Figure 5 – A) Correlations between the intensity of the first components of the FID-
CPMG signal assumed to correspond to the solid proton fraction (I0(comp.1)) and dry
matter mass per leaf area and B) between the sum of the intensity of other
components of the FID-CPMG signal assumed to correspond to the water proton
fraction (I0(comps.2-5) and water mass per leaf area for young (ranks 6 and 8), median
(ranks 3 - 5) and senescing (ranks 1 and 2) oilseed rape leaves. Signal intensity was
corrected for the receiver gain. Values correspond to sixteen individual plants (P-1 to
P-16).
r² = 0.75
0.00
0.05
0.10
0.15
0.20
0.25
0.30
0.35
0 10 20 30 40 50
I 0(c
om
p.1
)[a
.u.]
Dry mass [g m-2]
SenescingMedianYoung
r² = 0.89
0
1
2
3
4
5
6
7
0 100 200 300
I 0(c
om
ps.
2-5)
[a.u
.]
Water mass [g m-2]
SenescingMedianYoung
A
B
www.plantphysiol.orgon March 9, 2018 - Published by Downloaded from Copyright © 2013 American Society of Plant Biologists. All rights reserved.

Figure 6 – NMR relaxation parameters of oilseed rape leaves during senescence according to leaf
rank. T2 and corresponding I0 values for the complete decay curves (FID+CPMG) were obtained
by the Levenberg-Marquardt algorithm. A) Water distribution in the water-associated components
(2-5) expressed as: A
mxILWW wi
i0= , where LWWi is specific leaf water weight of the ith signal
component expressed in g m-2, with mw water mass per leaf sample used for NMR analysis (in g),
A leaf sample area (in m²) and I0i relative intensity of the ith signal component (as a ratio of total
signal of water-associated components (2-5)). B) and C) -Transverse relaxation times. Values
correspond to sixteen individual plants (P-1 to P-16).
0
50
100
150
200
250
300
12345678
LW
W [g
/m²]
Leaf rank
Components (2-5)Component 2Component 3Component 4+5Component 4Component 5
0
1
2
3
4
5
6
0.00
0.02
0.04
0.06
0.08
0.10
12345678
T2(
com
p.2
) val
ue
[ms]
T2(
com
p.1
) val
ue
[ms]
Leaf rank
T2(comp.1)
T2(comp.2)
0
100
200
300
400
500
600
700
0
10
20
30
40
50
12345678
T2(
com
p.4
& 5
) val
ue
[ms]
T2(
com
p.3)
val
ue
[ms]
Leaf rank
T2(comp.3)T2(comp.4)T2(comp.5)
A
B
C
www.plantphysiol.orgon March 9, 2018 - Published by Downloaded from Copyright © 2013 American Society of Plant Biologists. All rights reserved.

-1.0 -0.5 0.0 0.5 1.0
-1.0
-0.5
0.0
0.5
1.0
Variables factor map (PCA)
Dim 1 (72.78%)
Dim
2 (
7.74
%)
Figure 7 – Principal component analysis (PCA) of 10 multivariate data (chlorophyll, starch a
water content, dry matter, T2(comp.1), T2(comp.3), T2(comp.4+5), and I0(comp.2), I0(comp.3) and I0(comp.
corrected for the receiver gain and the sample weight of the six leaves of different 6 leaf ranks
to 1) from 11 oilseed rape plants grown in standard conditions. A) Score (L=leaf rank) plots
PC1 and PC2. B) Loading plot on the factorial plane made of the first two principal compone
(PC1, PC2). PC1 and PC2 axes explain 80.5% of the total variance. Dots are means of up to
independent biological replicates.
A P
C2
(7.7
%)
-1
1 0
0,5
- 0,
5
0 1 -1 -0.5 0.5 PC1 (72.8%)
I0(comp.3)
B
Chlorophyll content Water content
T2(comp.1) T2(comp.3)
T2(comp.4+5)
I0(comp.4+5)
Starch content
Dry matter
L-1
L-2
L-3 L-4
L-5
L-6
1 -1
0
0 4 -4 -2 2
PC
2 (7
.7%
)
2
PC1 (72.8%)
I0(comp.2)
h and
p. 4+5)
nks (6
ts for
nents
to 11
www.plantphysiol.orgon March 9, 2018 - Published by Downloaded from Copyright © 2013 American Society of Plant Biologists. All rights reserved.
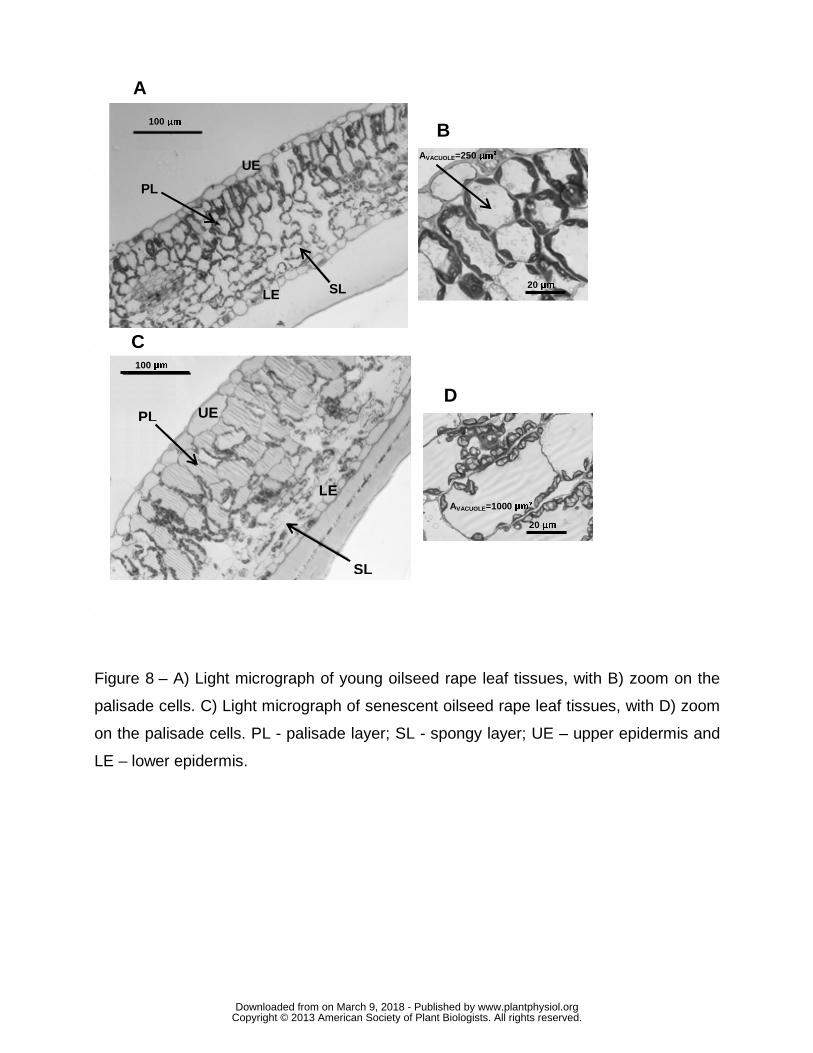
Figure 8 – A) Light micrograph of young oilseed rape leaf tissues, with B) zoom on the
palisade cells. C) Light micrograph of senescent oilseed rape leaf tissues, with D) zoom
on the palisade cells. PL - palisade layer; SL - spongy layer; UE – upper epidermis and
LE – lower epidermis.
A
B
100 µm
SL
LE
UE PL
C
20 µm
AVACUOLE=1000 µm²
AVACUOLE=250 µm²
20 µm
D
100 µm
SL
PL
UE
LE
www.plantphysiol.orgon March 9, 2018 - Published by Downloaded from Copyright © 2013 American Society of Plant Biologists. All rights reserved.
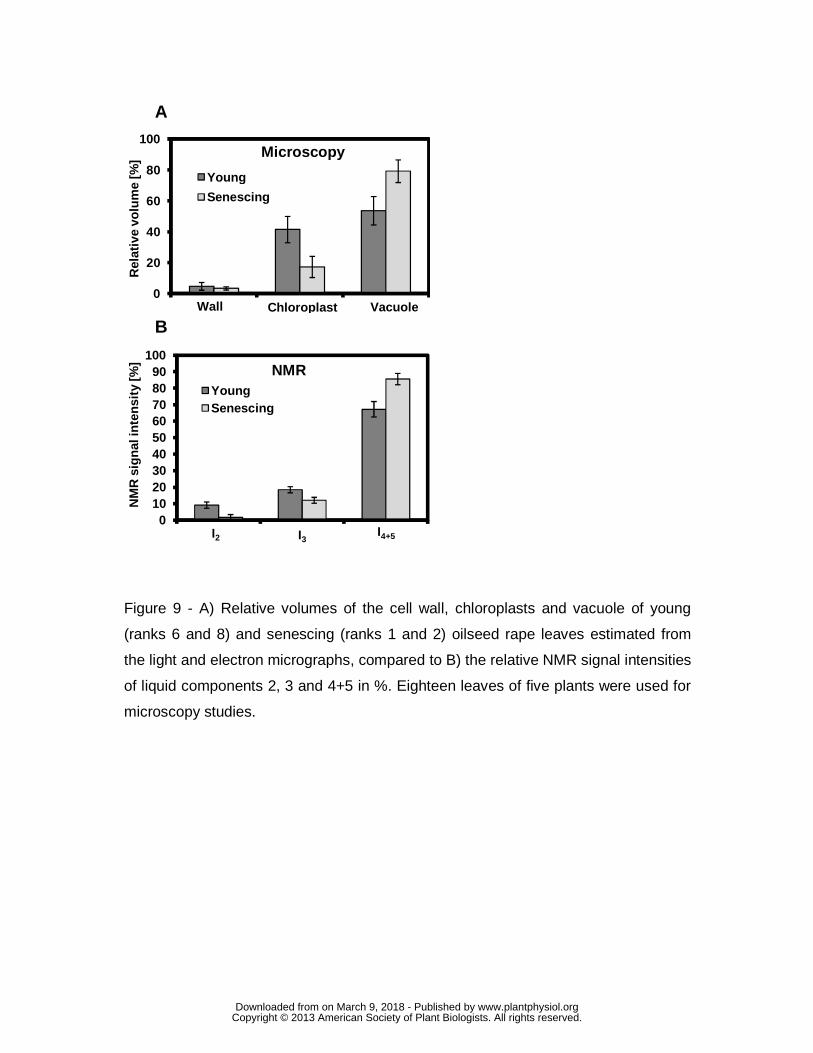
Figure 9 - A) Relative volumes of the cell wall, chloroplasts and vacuole of young
(ranks 6 and 8) and senescing (ranks 1 and 2) oilseed rape leaves estimated from
the light and electron micrographs, compared to B) the relative NMR signal intensities
of liquid components 2, 3 and 4+5 in %. Eighteen leaves of five plants were used for
microscopy studies.
0
20
40
60
80
100R
elat
ive
volu
me
[%]
Young
Senescing
Wall Chloroplast Vacuole
Microscopy
0102030405060708090
100
NM
R s
ign
al in
ten
sity
[%]
YoungSenescing
I2 I3 I4+5
NMR
B
A
www.plantphysiol.orgon March 9, 2018 - Published by Downloaded from Copyright © 2013 American Society of Plant Biologists. All rights reserved.
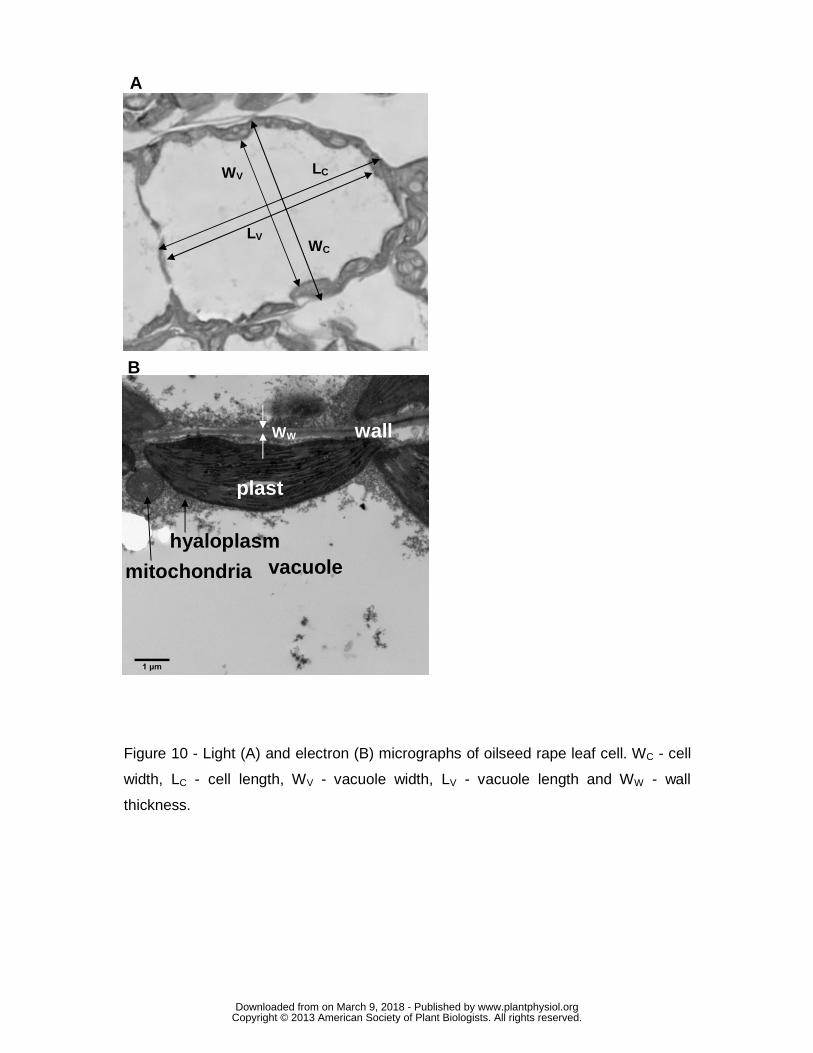
Figure 10 - Light (A) and electron (B) micrographs of oilseed rape leaf cell. WC - cell
width, LC - cell length, WV - vacuole width, LV - vacuole length and WW - wall
thickness.
WC
WV LC
LV
A
B
WW
plast
vacuole hyaloplasm
mitochondria
wall
www.plantphysiol.orgon March 9, 2018 - Published by Downloaded from Copyright © 2013 American Society of Plant Biologists. All rights reserved.