page 2 – herb kuhn - office of inspector general | u.s...
TRANSCRIPT


Page 2 – Herb Kuhn
BACKGROUND
Medicare Coverage and Payment of Services for Nursing Home Residents In general, Medicare Part A covers inpatient hospitalizations and skilled nursing care for eligible beneficiaries, while Medicare Part B covers physician and outpatient services. Services provided under Part A are subject to different payment rules than services provided under Part B.
Medicare Part A. Medicare Part A covers skilled care in a skilled nursing facility for up to 100 days for residents who meet certain conditions, such as a prior hospitalization.2
For residents receiving skilled care, Part A covers almost all of the services provided to that resident, as well as room and board. When Medicare Part A is covering a resident’s care, the resident is considered to be in a Medicare Part A covered stay.
Most services provided to residents who are in a Medicare Part A covered stay are consolidated into a single bill, a process known as consolidated billing. The Balanced Budget Act of 1997 (BBA) originally required consolidated billing for all nursing home residents receiving Medicare services in a skilled nursing facility.3 The Medicare, Medicaid and SCHIP Benefits Improvement and Protection Act of 2000 (BIPA)4 limited the consolidated billing requirement to residents in a Part A covered stay. Consolidated billing was intended to enhance oversight by making a single entity responsible for coordinating services and submitting bills.
Medicare Part B. Medicare Part B covers many medical services provided to Medicare beneficiaries, including those residing in nursing homes. These services include, but are not limited to, diagnostic laboratory tests, x rays, hospital outpatient services, ambulance services, rehabilitation services, the purchase and rental of durable medical equipment, orthotic/prosthetic devices, and surgical dressings.
Most Part B services provided to nursing home residents who are not in a Part A covered stay are not subject to consolidated billing requirements.5 Rather, each service provider may submit a separate claim to Medicare for each service rendered. Medicare pays for these Part B services using a fee schedule, which varies by locality.
Medicare Part B Payment Vulnerabilities for Nursing Home Residents In the 1990s, OIG identified problems with Part B payments for services provided to nursing home residents. OIG found that the nursing home environment provides a unique
2 42 U.S.C. § 1395d(a)(2). 3 Pub. L. No. 105-33 § 4432. Exceptions to the consolidated billing requirement include physician services and certain drugs. 4 Pub. L. No. 106-554 § 313. 5 Pursuant to 42 U.S.C. §§ 1395u(b)(6)(E) and 1395yy(e)(2)(A)(ii), physical, occupational, or speech therapy services are an exception because these services are subject to consolidated billing requirements for all skilled nursing facility residents, including residents not in a Medicare Part A-covered stay.

Page 3 – Herb Kuhn
opportunity for fraudulent or excessive billing due to the high volume of services and supplies nursing home residents receive in conjunction with the fact that multiple providers could submit bills to Medicare. For example, a 1994 OIG study found that Medicare was paying for incontinence supplies for nursing home residents that were never used.6 In addition, a 1996 OIG study found questionable physician/supplier billing practices.7
The consolidated billing requirement, as modified by BIPA, became effective January 1, 2001. The BIPA limited the consolidated billing requirement to Medicare services for nursing home residents who are not in a Part A covered stay. To guard against excessive or duplicative payments, Congress required OIG to monitor Medicare Part B payments for skilled nursing facility residents not in a Part A covered stay.8
METHODOLOGY
Scope This study describes Medicare Part B services and allowed payments for nursing home residents not in a Medicare Part A covered stay during CY 2002, regardless of whether the nursing home is a skilled nursing facility or a nursing facility. We chose to use CY 2002 data because they represent the first full year of claims data received after consolidated billing requirements became effective. Only fee-for-service Medicare claims were included in the analysis. This study does not include any analysis of Medicaid room and board payments. Further, this study does not determine whether Medicare Part B services and allowed payments were appropriate.
Data Collection No centralized data source provides information about Part B services received by nursing home residents. To identify all CY 2002 nursing home residents and to extract data for their services allowed under Part B, we matched information from the Long Term Care Minimum Data Set (MDS), the Medicare Enrollment Database (EDB), and National Claims History (NCH) files.
First, we used the MDS9 to identify nursing home residents in CY 2002. Using information from the MDS assessment records, we created one “stay” record for each resident identifying the dates he or she resided in the nursing home. Each stay record contains a unique identifier. Second, using the unique identifier for each resident, we matched the stay records from the MDS to the EDB10 to identify the Health Insurance
6 OIG. “Marketing of Incontinence Supplies,” OEI-03-94-00770. December 1994. 7 OIG. “Part B Services in Nursing Homes: An Overview,” OEI-06-92-000865. March 1996. 8 Pub. L. No. 106-554 § 313 (d).9 The MDS contains assessment records that provide a variety of information about a resident, including demographic information and dates of stay. 10 Medicare’s EDB contains information on all individuals entitled to Medicare, including enrollment dates and the unique Health Insurance Claim Number assigned to each resident.

Page 4 – Herb Kuhn
Claim Number (HICN) for each resident.11 Third, using all identified HICNs, we extracted claims for Part B services for each stay record from the NCH files.12 Using the dates on the stay record, only services that occurred while the beneficiary resided in a nursing home were included in the analysis.
Data from the following files containing Part B claims were extracted from the NCH for analysis: (1) the physician/supplier file, which contains claims for services such as office visits, laboratory, and imaging; (2) the Durable Medical Equipment file, which contains claims for services such as enteral nutrition, wheelchairs, and prosthetic devices; and (3) the hospital outpatient file, which contains claims from hospital outpatient departments.
Finally, the Skilled Nursing Facility (SNF) NCH file13 was used to identify and exclude from the analysis those nursing home residents who were in a Medicare Part A covered stay. Information from the SNF NCH file was merged with the claims information for nursing home residents to exclude claims for Part B services that occurred during a Medicare Part A covered stay.
In total, we identified more than 124 million line items for Part B services provided to 1.8 million nursing home residents from over 16,000 nursing homes.
Data Analysis This population of Medicare Part B claims data for nursing home residents were analyzed to determine the total payments, the total number of nursing home residents receiving services, the types of services they received, and the allowed payments and services per resident per State.
Allowed payment refers to the amount Medicare authorized for reimbursement for the service. The allowed payment (hereafter referred to as payment) includes both the Medicare payment and any contribution from the nursing home resident in the form of copayment or deductible. Part B services that were not allowed were excluded from the analysis.
To describe the types of services provided to nursing home residents, we classified the data into categories of service and calculated the total payment for each category. Our classification of the data was based on the Berenson-Eggers Type of Service (BETOS) system. The BETOS system classifies all Healthcare Common Procedure Coding System
11 For some records, we lacked a common variable on which to match the stay record to the EDB, whichmay cause a slight underreporting of claims for Part B services. 12 The NCH files contain billing and utilization information for Medicare beneficiaries. Each line itemcontains the HICN, procedure codes, dates of services, and the allowed amount. The NCH claims used inthis analysis represent final action data in which all adjustments have been resolved. 13 The SNF NCH file contains information about demographics, diagnosis, length of stay, and provider.

Page 5 – Herb Kuhn
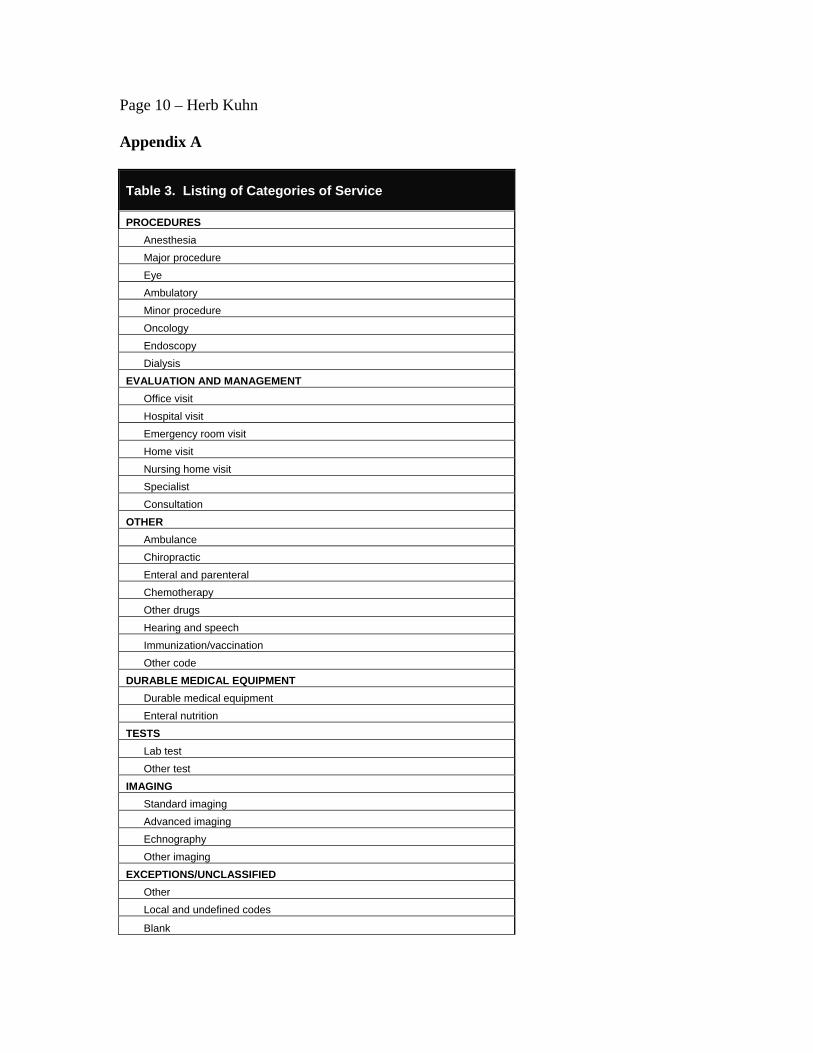
(HCPCS) codes used by CMS into 1 of 106 categories. Each of the approximately 124 million line items contains a HCPCS code describing the service provided. Using the HCPCS codes, we applied the BETOS coding system to the data. Then, to facilitate analysis of this high volume of claims, we combined like BETOS categories.14 In total, we created 34 categories of service. We then calculated the total payment for each category of service. See Appendix A for a listing of the 34 categories of service.
As part of the analysis of total Part B payments per resident, we created a map of the United States showing five categories of median payment per resident. The five categories were derived using the Jenks natural breaks classification. The Jenks natural breaks classification uses a statistical technique to determine the best arrangement of values into classes.
The data were also analyzed by nursing home resident, both overall and by category of service. This analysis by resident was done at the State level. For each State,15 we calculated the total payments for Part B services for each resident. We also disaggregated this overall total into payments by category of service. Finally, we determined the State median payment per resident for each category of service and for all Part B services.
Limitations While this review identified Part B claims for the majority of nursing home residents, a lack of common variables on which to identify the HICN for each resident may cause underreporting of Part B services provided to nursing home residents.
Due to complications in the way services are billed, this review was not able to determine the quantity of services provided. For some services, it is difficult to match the components of the service to obtain a definitive count of services provided. For example, imaging may be split into two components, a technical component and a professional component, each provided by different providers. While the resident received a single service, each provider may have legitimately billed a different date of service and service code for its component, thus making it difficult to match the components.
14 For example, the BETOS system has 17 categories of major procedures. We combined these into a single category of major procedures. 15 Claims for residents in all 50 States, the District of Columbia, Puerto Rico, and the U.S. Virgin Islands were included in this study. Hereafter, the District of Columbia, Puerto Rico, and the U.S. Virgin Islands are referred to as States.

Page 6 – Herb Kuhn
RESULTS
Medicare Allowed $5.3 Billion for Part B Services Provided to Nursing Home Residents in CY 2002 Medicare allowed $5.3 billion for Part B services provided to 1.8 million nursing home residents who were not in a Part A covered stay in CY 2002. The $5.3 billion represents 5 percent of the total amount that Medicare allowed for all Part B services during CY 2002.
Ten categories of service accounted for 79 percent of payments for Part B services for nursing home residents. The top 10 categories of service accounted for $4.1 billion in Part B payments for nursing home residents during CY 2002. Table 1 shows the top 10 categories of service based on total payments. See Appendix B for a listing of payments for all 34 categories of service.
Table 1. Top 10 Categories of Service: Payments for Nursing Home Residents and Number of Nursing Home Residents Receiving Service
Category of Service
Minor procedure
Payments for Nursing Home
Residents
$1,001,135,901
Percentage of Part B
Payments for Nursing
Home Residents*
19%
Number of Nursing Home Residents
Receiving Service
1,061,574
Percentage of Nursing Home Residents with
Part B services*
60%
Nursing home visit $624,697,477 12% 1,441,150 82%
Ambulance $516,677,629 10% 697,491 40%
Lab test $393,179,098 8% 1,430,645 81%
Specialist $351,417,319 7% 922,557 53%
Enteral nutrition $333,895,544 6% 80,175 5%
Dialysis $267,515,557 5% 40,950 2%
Durable medical equipment $210,140,166 4% 381,923 22%
Standard imaging $203,744,389 4% 1,098,806 63%
Hospital visit $202,318,468 4% 616,830 35%
Total $4,104,721,548 79%
Source: OIG analysis of 2002 Medicare claims data, 2006.
*Population is 1.8 million nursing home residents who received Part B services.

Page 7 – Herb Kuhn
As seen in Table 1, minor procedure, nursing home visit,16 and ambulance accounted for 41 percent of payments for Part B services. Medicare allowed more than $2.1 billion for nursing home residents in CY 2002 for these services.
Payments Varied by State for Each of the Top 10 Categories The median payments per resident varied by State within the top 10 categories of service. Table 2 shows the range of State median payments per resident within each of the categories of service. The national median payment per resident is included as a point of reference.
Table 2. Top 10 Categories of Service: Range of State Median Payments per Nursing Home Resident
Lowest State Median per Nursing Home Highest State Median per National Median per
Category of Service Resident Nursing Home Resident Nursing Home Resident
Minor procedure $64 $588 $269
Nursing home visit $29 $544 $329
Ambulance $158 $634 $429
Lab test $39 $233 $142
Specialist $98 $199 $152
Enteral nutrition $519 $5,855 $3,911
Dialysis $604 $6,212 $2,910
Durable medical equipment $122 $542 $205
Standard imaging $24 $191 $119
Hospital visit $115 $245 $167
Source: OIG analysis of 2002 Medicare Claims data, 2006.
For example, as seen in Table 2, the median payment per resident for enteral nutrition ranged from $519 in one State to $5,855 in another State. See Appendix C for a listing of median payments per resident for each of the 10 categories by State.
In addition to varying by category, overall State median payments per resident varied as well. The State median payments per resident for all Part B services ranged from $366 to
16 A nursing home visit is a physician’s visit to a nursing home resident for evaluation and management.
Page 8 – Herb Kuhn
$2,349 across States. See Appendix D for a map of the United States showing the median payments per resident.
Both overall and within categories, variation was broadly distributed among States. State median payments per resident were not attributed to clustering of States at the high or low end.
DISCUSSION
This analysis found variation in State median payments per resident among the top 10 categories of service. Variation across States may reflect differences in populations or differences in care provided, or may be an indication of inappropriate services. Following is a general framework for understanding variation that may help inform future analysis to determine if potentially excessive or duplicative billing patterns exist for particular services or in particular States or nursing homes.
Variation across States is the result of differences in the allowed amount, type, and quantity of service billed. Within a particular service, some variation across States in allowed reimbursement may be explained by geographic variation in the Medicare fee schedule. For example, in 2002, Medicare allowed $38 for a nursing home visit in one State compared to $50 in another.
Variation across States due to differences in the type and quantity of service billed may reflect differences in the residents’ needs. For example, the health status of nursing home residents may vary by State, requiring different services at different levels of intensity. In addition, practice patterns of physicians may also vary by State, resulting in different mixes of services provided.
In contrast, variation in the type and quantity of services billed across States may be due to inappropriate billing practices. Some providers may bill for more intensive services than were actually rendered. Instead of billing for cleaning a wound, which is reimbursed at a rate of $26, some providers may inappropriately bill for repairing a wound, which is reimbursed at a rate of $262. In addition, providers may bill for a higher quantity of service than was actually provided or needed. As previously noted, past OIG studies have identified suppliers’ billing for incontinence supplies for nursing home residents that were never used.
As a baseline review, this analysis did not determine whether variation was due to differences in care provided or due to inappropriate billing practices. Making such a determination would require further, more in-depth review.

Page 9 – Herb Kuhn
If you have any questions about this memorandum report, please do not hesitate to contact me, or one of your staff may contact Claire Barnard, Director, External Affairs, at (202) 619-1665 or through e-mail [[email protected]]. To facilitate identification, please refer to memorandum report number OEI-05-06-00240 in all correspondence.
Page 10 – Herb Kuhn
Appendix A
Table 3. Listing of Categories of Service
PROCEDURES Anesthesia Major procedure Eye Ambulatory Minor procedure Oncology Endoscopy Dialysis
EVALUATION AND MANAGEMENT Office visit Hospital visit Emergency room visit Home visit Nursing home visit Specialist Consultation
OTHER Ambulance Chiropractic Enteral and parenteral Chemotherapy Other drugs Hearing and speech Immunization/vaccination Other code
DURABLE MEDICAL EQUIPMENT Durable medical equipment Enteral nutrition
TESTS Lab test Other test
IMAGING Standard imaging Advanced imaging Echnography Other imaging
EXCEPTIONS/UNCLASSIFIED Other Local and undefined codes
Blank

Page 11 – Herb Kuhn
Appendix B
Table 4. Payments for Medicare Part B Services for Nursing Home Residents, by Category of Service
Category of Service Payment % of Total Payment PROCEDURES
Anesthesia $23,369,213 0% Major procedure $129,266,897 2% Eye $61,444,162 1% Ambulatory $85,662,566 2% Minor procedure $1,001,135,901 19% Oncology $21,648,308 0% Endoscopy $42,031,117 1% Dialysis $267,515,557 5% TOTAL PROCEDURES $1,632,073,720 31%
EVALUATION AND MANAGEMENT Office visit $108,105,067 2% Hospital visit $202,318,468 4% Emergency room visit $157,044,647 3% Home visit $1,446,498 0% Nursing home visit $624,697,477 12% Specialist $351,417,319 7% Consultation $103,678,412 2% TOTAL EVALUATION AND MANAGEMENT $1,548,707,889 29%
OTHER Ambulance $516,677,629 10% Chiropractic $1,353,210 0% Enteral and parenteral $28,049 0% Chemotherapy $42,194,423 1% Other drugs $84,053,248 2% Hearing and speech $351,104 0% Immunization/vaccination $7,361,207 0% Other Code $1,649,668 0% TOTAL OTHER $653,668,538 12%
DURABLE MEDICAL EQUIPMENT Durable medical equipment $210,140,166 4% Enteral nutrition $333,895,544 6% TOTAL DURABLE MEDICAL EQUIPMENT $544,035,710 10%
TESTS Lab test $393,179,098 8% Other test $41,587,130 1% TOTAL TESTS $434,766,228 9%
IMAGING Standard imaging $203,744,389 4% Advanced imaging $82,380,067 2% Echnography $46,239,292 1% Other imaging $12,064,703 0% TOTAL IMAGING
EXCEPTIONS/UNCLASSIFIED Other
$344,428,451
$61,822,543
7%
1% Local and undefined codes $33,243,458 1% Blank $185 0% TOTAL EXCEPTIONS/UNCLASSIFIED $95,066,186 2%
TOTAL ALLOWED PAYMENTS $5,252,746,722 100% Figures are rounded to the nearest whole dollar. Source: OIG analysis of 2002 Medicare claims data, 2006.

Page 12 – Herb Kuhn
Appendix C
Table 5. Minor Procedure: Total Payments and Median, Minimum, and Maximum Allowed Payment per Resident by State
State Total Payments Median Minimum Maximum Alabama $14,289,601 $247 $3 $29,605 Alaska $210,126 $230 $10 $12,085 Arizona $5,212,257 $220 $4 $27,844 Arkansas $9,881,728 $206 $3 $21,810 California $58,613,762 $188 $0 $46,810 Colorado $9,480,498 $410 $2 $24,556 Connecticut $18,221,361 $423 $2 $25,969 Delaware $2,219,088 $221 $7 $23,553 District of Columbia $1,689,655 $214 $5 $20,491 Florida $71,794,437 $443 $1 $40,923 Georgia $18,031,994 $200 $4 $29,607 Hawaii $906,667 $183 $4 $16,372 Idaho $4,200,058 $494 $3 $15,955 Illinois $43,870,914 $216 $1 $35,949 Indiana $45,087,057 $438 $3 $36,657 Iowa $12,853,619 $211 $1 $41,171 Kansas $13,412,467 $278 $3 $21,062 Kentucky $22,160,560 $343 $3 $42,449 Louisiana $31,299,523 $588 $0 $32,129 Maine $2,272,122 $144 $1 $13,296 Maryland $13,851,116 $238 $1 $26,339 Massachusetts $22,900,198 $317 $4 $42,301 Michigan $32,606,707 $226 $3 $44,130 Minnesota $16,148,084 $315 $0 $26,742 Mississippi $19,914,321 $586 $3 $38,054 Missouri $29,317,415 $295 $3 $30,181 Montana $2,503,870 $206 $3 $22,385 Nebraska $6,540,657 $205 $3 $18,452 Nevada $2,758,392 $225 $4 $57,037 New Hampshire $4,102,915 $289 $3 $18,600 New Jersey $29,187,995 $213 $4 $29,340 New Mexico $4,547,870 $298 $7 $27,060 New York $52,825,301 $154 $1 $55,420 North Carolina $27,876,713 $402 $2 $42,883 North Dakota $1,726,584 $186 $3 $28,225 Ohio $80,913,775 $400 $2 $51,058 Oklahoma $13,304,256 $326 $0 $41,290 Oregon $3,243,274 $283 $4 $19,371 Pennsylvania $66,940,750 $360 $1 $32,650 Puerto Rico $4,114 $76 $3 $973 Rhode Island $2,809,653 $293 $3 $20,960 South Carolina $9,566,187 $174 $3 $25,463 South Dakota $2,264,793 $214 $3 $19,279 Tennessee $24,053,409 $336 $3 $31,785 Texas $69,495,527 $246 $3 $38,236 Utah $4,017,774 $197 $4 $30,733 Vermont $1,630,081 $281 $4 $17,179 Virgin Islands $349 $64 $44 $178 Virginia $24,695,035 $446 $4 $32,877 Washington $11,317,664 $287 $2 $22,008 West Virginia $9,594,955 $277 $4 $34,529 Wisconsin $23,310,843 $277 $4 $42,895 Wyoming $1,457,833 $291 $7 $15,524 National Total $1,001,135,901 $269 $0 $57,037
Figures are rounded to the nearest whole dollar. Source: OIG analysis of 2002 Medicare claims data, 2006.

Page 13 – Herb Kuhn
Table 6. Nursing Home Visit: Total Payments and Median, Minimum, and Maximum Allowed Payment per Resident by State
State Total Payments Median Minimum Maximum Alabama $10,061,650 $350 $24 $3,819 Alaska $128,651 $176 $31 $4,421 Arizona $3,618,410 $269 $25 $8,063 Arkansas $5,418,009 $256 $11 $4,800 California $49,892,141 $434 $13 $19,252 Colorado $4,657,855 $267 $25 $4,006 Connecticut $10,716,836 $347 $24 $3,919 Delaware $2,436,068 $398 $26 $5,572 District of Columbia $1,607,634 $493 $27 $3,578 Florida $41,721,313 $409 $22 $10,351 Georgia $13,184,038 $336 $3 $7,932 Hawaii $843,620 $267 $26 $2,068 Idaho $957,066 $186 $24 $1,479 Illinois $32,176,741 $317 $0 $7,075 Indiana $14,511,187 $267 $24 $7,236 Iowa $5,974,316 $201 $6 $2,801 Kansas $4,798,000 $214 $24 $5,294 Kentucky $9,627,772 $287 $24 $6,136 Louisiana $8,814,582 $288 $15 $10,208 Maine $2,480,054 $258 $24 $2,920 Maryland $13,314,847 $431 $16 $11,581 Massachusetts $18,046,711 $344 $24 $6,429 Michigan $28,103,183 $458 $25 $7,666 Minnesota $7,515,530 $217 $21 $2,085 Mississippi $5,726,869 $313 $24 $2,478 Missouri $12,971,539 $302 $20 $3,160 Montana $1,427,464 $185 $24 $1,752 Nebraska $3,149,886 $202 $22 $2,613 Nevada $2,422,730 $436 $26 $7,149 New Hampshire $3,256,688 $360 $25 $3,014 New Jersey $30,287,187 $544 $16 $9,148 New Mexico $2,052,929 $282 $24 $2,439 New York $72,475,733 $470 $9 $14,307 North Carolina $13,337,821 $279 $24 $4,631 North Dakota $1,178,256 $178 $24 $2,618 Ohio $36,936,806 $374 $20 $9,952 Oklahoma $5,527,571 $221 $6 $3,448 Oregon $1,482,544 $182 $24 $1,512 Pennsylvania $42,593,532 $407 $25 $10,219 Puerto Rico $23,035 $165 $25 $2,229 Rhode Island $3,010,070 $320 $26 $2,190 South Carolina $5,715,132 $311 $24 $5,855 South Dakota $1,192,540 $182 $23 $1,761 Tennessee $15,829,528 $335 $24 $4,437 Texas $39,423,648 $332 $18 $15,398 Utah $1,333,023 $230 $25 $1,869 Vermont $1,006,009 $224 $25 $2,599 Virgin Islands $29 $29 $29 $29 Virginia $10,251,557 $288 $23 $4,404 Washington $6,000,678 $233 $25 $3,632 West Virginia $3,453,774 $324 $23 $2,605 Wisconsin $11,476,576 $243 $20 $7,139 Wyoming $548,112 $209 $24 $1,841 National Total $624,697,477 $329 $0 $19,252
Source: OIG analysis of 2002 Medicare claims data, 2006.

Page 14 – Herb Kuhn
Table 7. Ambulance: Total Payments and Median, Minimum, and Maximum Allowed Payment per Resident by State
State Total Payments Median Minimum Maximum Alabama $8,696,449 $360 $3 $106,638 Alaska $148,652 $501 $241 $22,017 Arizona $2,665,308 $404 $5 $32,468 Arkansas $7,746,224 $447 $3 $31,988 California $43,053,857 $579 $8 $136,156 Colorado $2,653,773 $410 $5 $15,585 Connecticut $12,518,596 $559 $5 $124,801 Delaware $1,572,516 $348 $66 $58,292 District of Columbia $585,266 $331 $116 $44,377 Florida $18,263,934 $331 $2 $57,037 Georgia $11,759,207 $368 $3 $72,524 Hawaii $310,015 $370 $7 $5,892 Idaho $425,080 $236 $3 $11,312 Illinois $27,735,671 $382 $3 $72,404 Indiana $13,391,496 $370 $3 $67,966 Iowa $5,637,138 $374 $3 $12,032 Kansas $3,726,200 $370 $4 $28,056 Kentucky $11,314,984 $409 $4 $76,093 Louisiana $18,089,430 $609 $4 $97,392 Maine $2,621,534 $409 $11 $51,767 Maryland $5,080,514 $336 $4 $59,160 Massachusetts $27,580,300 $634 $8 $189,198 Michigan $13,312,640 $424 $4 $101,834 Minnesota $5,501,355 $447 $0 $33,230 Mississippi $6,842,754 $438 $4 $79,272 Missouri $10,670,715 $403 $2 $76,380 Montana $637,843 $321 $4 $10,923 Nebraska $1,456,325 $316 $4 $11,180 Nevada $915,624 $448 $6 $6,318 New Hampshire $2,123,114 $419 $14 $95,479 New Jersey $22,426,923 $441 $1 $111,531 New Mexico $1,000,684 $309 $3 $8,710 New York $37,211,618 $503 $5 $91,001 North Carolina $12,193,903 $282 $2 $88,516 North Dakota $541,861 $336 $4 $5,526 Ohio $34,727,521 $488 $3 $111,018 Oklahoma $8,785,235 $458 $3 $79,881 Oregon $2,007,356 $561 $5 $28,137 Pennsylvania $30,054,618 $448 $4 $83,355 Puerto Rico $4,001 $158 $19 $358 Rhode Island $3,730,289 $451 $5 $84,137 South Carolina $8,225,365 $354 $1 $78,625 South Dakota $598,146 $266 $8 $8,628 Tennessee $17,549,287 $392 $4 $101,424 Texas $41,943,492 $439 $1 $93,535 Utah $966,708 $512 $104 $8,667 Vermont $1,112,188 $379 $6 $88,677 Virgin Islands $3,242 $260 $175 $521 Virginia $7,187,234 $299 $4 $77,190 Washington $6,767,722 $511 $5 $154,164 West Virginia $5,010,659 $394 $3 $61,894 Wisconsin $7,213,508 $390 $0 $68,931 Wyoming $379,556 $334 $5 $5,419 National Total $516,677,629 $429 $0 $189,198
Source: OIG analysis of 2002 Medicare claims data, 2006.

Page 15 – Herb Kuhn
Table 8. Lab Test: Total Payments and Median, Minimum, and Maximum Allowed Payment per Resident by State
State Total Payments Median Minimum Maximum Alabama $8,288,668 $158 $3 $8,608 Alaska $234,396 $233 $5 $6,832 Arizona $2,084,639 $112 $3 $8,638 Arkansas $5,036,405 $129 $2 $71,192 California $31,763,032 $146 $1 $18,374 Colorado $3,162,253 $120 $3 $5,408 Connecticut $5,651,638 $125 $2 $25,252 Delaware $1,067,150 $147 $3 $5,555 District of Columbia $800,912 $142 $3 $10,093 Florida $19,696,006 $143 $1 $8,106 Georgia $10,256,592 $140 $2 $9,723 Hawaii $580,992 $112 $2 $7,784 Idaho $1,367,168 $117 $3 $6,528 Illinois $17,997,382 $136 $1 $13,621 Indiana $12,786,283 $152 $0 $20,996 Iowa $7,166,439 $119 $3 $17,351 Kansas $6,015,828 $143 $3 $11,343 Kentucky $7,250,219 $148 $2 $12,082 Louisiana $9,591,632 $166 $2 $8,636 Maine $1,986,180 $124 $3 $5,730 Maryland $6,857,644 $160 $0 $24,301 Massachusetts $12,426,519 $172 $0 $12,545 Michigan $10,368,336 $141 $2 $15,677 Minnesota $7,652,744 $109 $3 $16,894 Mississippi $4,420,163 $124 $1 $9,492 Missouri $9,524,258 $139 $3 $14,092 Montana $1,767,588 $126 $3 $16,797 Nebraska $4,835,699 $143 $3 $6,800 Nevada $850,093 $112 $3 $4,684 New Hampshire $1,923,219 $136 $3 $5,717 New Jersey $11,420,346 $147 $3 $11,462 New Mexico $1,506,715 $123 $3 $5,004 New York $25,233,048 $146 $0 $11,186 North Carolina $9,992,029 $123 $0 $59,415 North Dakota $1,314,370 $113 $3 $10,897 Ohio $20,992,042 $150 $1 $12,826 Oklahoma $5,414,963 $128 $0 $9,043 Oregon $1,540,792 $98 $3 $14,833 Pennsylvania $25,249,010 $166 $0 $23,386 Puerto Rico $4,308 $49 $3 $597 Rhode Island $2,321,505 $172 $3 $8,238 South Carolina $3,638,933 $112 $2 $6,897 South Dakota $1,783,580 $119 $3 $15,671 Tennessee $9,666,120 $134 $0 $10,404 Texas $29,678,067 $174 $1 $28,680 Utah $1,591,459 $109 $0 $10,578 Vermont $670,713 $98 $2 $5,785 Virgin Islands $186 $39 $24 $84 Virginia $8,240,545 $137 $1 $40,466 Washington $5,557,119 $124 $3 $18,173 West Virginia $2,861,683 $145 $3 $15,831 Wisconsin $10,531,427 $127 $3 $34,809 Wyoming $560,060 $114 $3 $4,396 National Total $393,179,098 $142 $0 $71,192
Source: OIG analysis of 2002 Medicare claims data, 2006.

Page 16 – Herb Kuhn
Table 9. Specialist: Total Payments and Median, Minimum, and Maximum Allowed Payment per Resident by State
State Total Payments Median Minimum Maximum Alabama $3,654,461 $125 $3 $12,947 Alaska $48,121 $122 $10 $1,293 Arizona $1,048,587 $124 $4 $14,178 Arkansas $2,150,973 $121 $4 $10,799 California $21,482,021 $161 $1 $45,767 Colorado $6,022,634 $161 $4 $11,314 Connecticut $6,518,005 $179 $5 $33,528 Delaware $701,750 $143 $8 $5,022 District of Columbia $573,346 $157 $11 $5,522 Florida $21,344,341 $169 $5 $31,341 Georgia $3,250,680 $106 $4 $17,370 Hawaii $642,091 $138 $5 $10,385 Idaho $950,788 $123 $5 $5,546 Illinois $25,564,539 $159 $0 $36,393 Indiana $12,791,533 $173 $4 $29,356 Iowa $4,080,268 $126 $4 $31,219 Kansas $4,738,425 $152 $4 $29,682 Kentucky $4,310,379 $132 $4 $34,534 Louisiana $8,396,204 $131 $3 $38,119 Maine $872,593 $103 $4 $9,347 Maryland $6,250,199 $175 $5 $25,736 Massachusetts $11,981,622 $199 $5 $18,356 Michigan $7,534,954 $145 $5 $10,940 Minnesota $4,775,551 $133 $4 $15,170 Mississippi $4,183,796 $168 $4 $9,492 Missouri $5,819,599 $124 $3 $45,204 Montana $599,587 $101 $4 $9,597 Nebraska $2,058,366 $120 $4 $7,881 Nevada $996,173 $170 $5 $11,133 New Hampshire $1,860,141 $170 $5 $18,947 New Jersey $12,324,609 $192 $5 $24,727 New Mexico $2,201,247 $176 $7 $19,097 New York $30,586,387 $181 $3 $21,372 North Carolina $7,497,952 $134 $0 $14,331 North Dakota $922,306 $129 $10 $2,761 Ohio $19,936,372 $175 $4 $16,741 Oklahoma $2,879,861 $106 $4 $21,552 Oregon $760,945 $116 $4 $5,159 Pennsylvania $20,504,160 $172 $1 $16,818 Puerto Rico $4,437 $98 $5 $558 Rhode Island $1,502,059 $174 $5 $4,338 South Carolina $1,607,283 $112 $4 $9,804 South Dakota $791,941 $121 $4 $4,860 Tennessee $12,254,310 $189 $4 $14,894 Texas $43,157,718 $195 $4 $53,738 Utah $1,322,172 $130 $11 $31,061 Vermont $354,580 $109 $2 $6,193 Virginia $5,464,997 $140 $4 $14,185 Washington $4,251,691 $123 $5 $11,339 West Virginia $1,402,659 $129 $5 $13,440 Wisconsin $5,988,574 $133 $0 $9,360 Wyoming $499,330 $130 $4 $4,908 National Total $351,417,319 $152 $0 $53,738
Source: OIG analysis of 2002 Medicare claims data, 2006.

Page 17 – Herb Kuhn
Table 10. Enteral Nutrition: Total Payments and Median, Minimum, and Maximum Allowed Payment per Resident by State
State Total Payments Median Minimum Maximum Alabama $12,462,442 $4,627 $6 $16,224 Alaska $52,138 $5,855 $1,087 $8,536 Arizona $886,864 $2,792 $11 $12,137 Arkansas $5,017,544 $4,070 $24 $18,789 California $35,690,268 $3,778 $5 $15,762 Colorado $744,201 $3,176 $6 $13,973 Connecticut $3,575,034 $3,640 $13 $12,728 Delaware $1,156,020 $4,369 $40 $14,919 District of Columbia $1,109,554 $3,974 $15 $12,506 Florida $19,248,716 $3,594 $13 $22,124 Georgia $10,441,416 $4,095 $16 $18,929 Hawaii $1,297,346 $4,068 $39 $9,205 Idaho $238,273 $2,243 $51 $8,886 Illinois $12,650,897 $3,138 $11 $16,765 Indiana $6,676,856 $3,625 $12 $14,383 Iowa $1,348,648 $2,974 $22 $9,360 Kansas $1,332,905 $3,392 $30 $11,641 Kentucky $9,551,478 $4,419 $19 $17,945 Louisiana $12,644,840 $3,798 $17 $16,953 Maine $450,704 $3,903 $69 $10,133 Maryland $5,904,307 $3,693 $25 $12,707 Massachusetts $4,248,019 $3,871 $24 $13,275 Michigan $6,283,765 $3,310 $7 $15,050 Minnesota $1,624,921 $3,895 $6 $11,537 Mississippi $8,399,582 $4,244 $15 $14,946 Missouri $4,459,523 $3,131 $19 $18,093 Montana $284,705 $3,509 $11 $8,717 Nebraska $1,254,267 $4,088 $16 $11,543 Nevada $815,408 $3,321 $20 $11,682 New Hampshire $308,859 $2,690 $20 $12,291 New Jersey $11,746,447 $3,987 $12 $16,315 New Mexico $591,749 $4,496 $109 $15,326 New York $33,906,662 $4,132 $1 $18,311 North Carolina $14,536,707 $4,578 $8 $16,142 North Dakota $460,898 $5,360 $20 $9,005 Ohio $16,906,791 $3,754 $4 $16,771 Oklahoma $5,180,740 $3,303 $14 $20,116 Oregon $835,120 $4,590 $17 $9,431 Pennsylvania $16,509,851 $4,181 $7 $26,033 Puerto Rico $2,548 $519 $132 $1,379 Rhode Island $998,323 $4,061 $50 $10,271 South Carolina $7,263,696 $4,628 $2 $15,538 South Dakota $548,365 $4,847 $109 $10,255 Tennessee $12,749,541 $4,494 $18 $19,021 Texas $26,064,392 $3,830 $11 $17,018 Utah $196,636 $2,712 $146 $10,233 Vermont $168,984 $3,928 $283 $8,298 Virginia $6,923,740 $3,570 $16 $15,626 Washington $2,987,803 $4,271 $15 $12,445 West Virginia $1,619,915 $3,153 $15 $14,882 Wisconsin $3,469,632 $4,017 $19 $13,890 Wyoming $67,505 $4,658 $1,095 $8,497 National Total $333,895,544 $3,911 $1 $26,033
Source: OIG analysis of 2002 Medicare claims data, 2006.
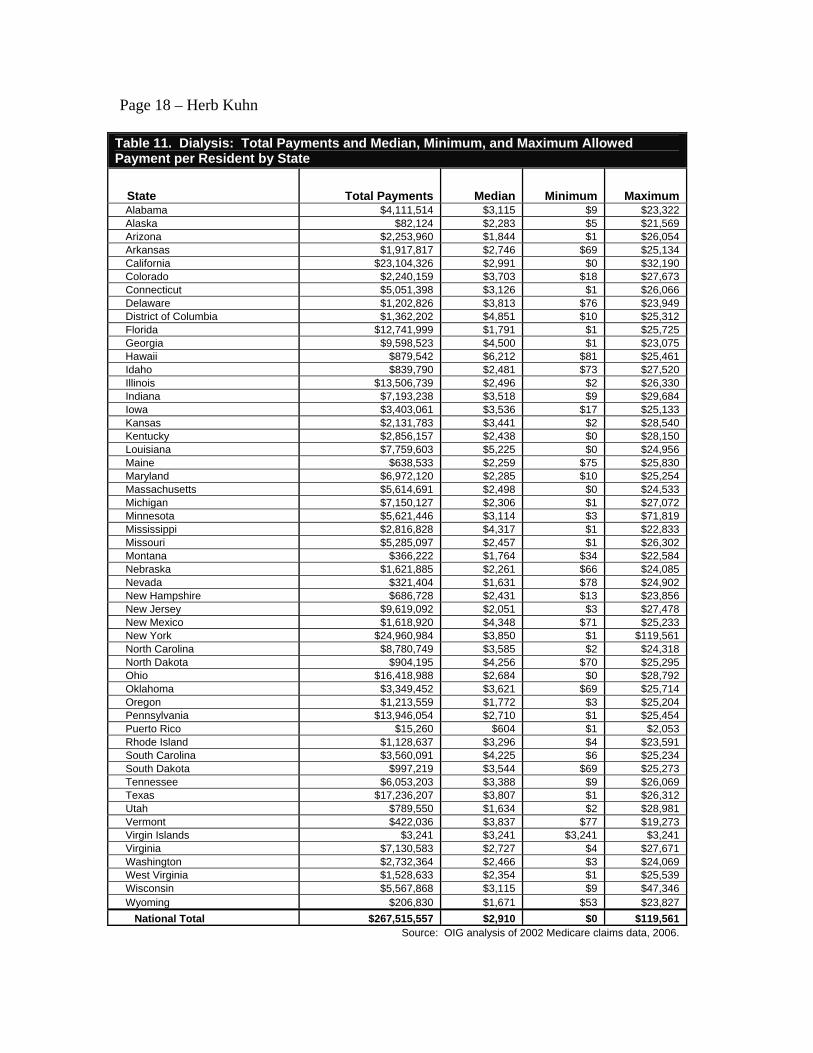
Page 18 – Herb Kuhn
Table 11. Dialysis: Total Payments and Median, Minimum, and Maximum Allowed Payment per Resident by State
State Total Payments Median Minimum Maximum Alabama $4,111,514 $3,115 $9 $23,322 Alaska $82,124 $2,283 $5 $21,569 Arizona $2,253,960 $1,844 $1 $26,054 Arkansas $1,917,817 $2,746 $69 $25,134 California $23,104,326 $2,991 $0 $32,190 Colorado $2,240,159 $3,703 $18 $27,673 Connecticut $5,051,398 $3,126 $1 $26,066 Delaware $1,202,826 $3,813 $76 $23,949 District of Columbia $1,362,202 $4,851 $10 $25,312 Florida $12,741,999 $1,791 $1 $25,725 Georgia $9,598,523 $4,500 $1 $23,075 Hawaii $879,542 $6,212 $81 $25,461 Idaho $839,790 $2,481 $73 $27,520 Illinois $13,506,739 $2,496 $2 $26,330 Indiana $7,193,238 $3,518 $9 $29,684 Iowa $3,403,061 $3,536 $17 $25,133 Kansas $2,131,783 $3,441 $2 $28,540 Kentucky $2,856,157 $2,438 $0 $28,150 Louisiana $7,759,603 $5,225 $0 $24,956 Maine $638,533 $2,259 $75 $25,830 Maryland $6,972,120 $2,285 $10 $25,254 Massachusetts $5,614,691 $2,498 $0 $24,533 Michigan $7,150,127 $2,306 $1 $27,072 Minnesota $5,621,446 $3,114 $3 $71,819 Mississippi $2,816,828 $4,317 $1 $22,833 Missouri $5,285,097 $2,457 $1 $26,302 Montana $366,222 $1,764 $34 $22,584 Nebraska $1,621,885 $2,261 $66 $24,085 Nevada $321,404 $1,631 $78 $24,902 New Hampshire $686,728 $2,431 $13 $23,856 New Jersey $9,619,092 $2,051 $3 $27,478 New Mexico $1,618,920 $4,348 $71 $25,233 New York $24,960,984 $3,850 $1 $119,561 North Carolina $8,780,749 $3,585 $2 $24,318 North Dakota $904,195 $4,256 $70 $25,295 Ohio $16,418,988 $2,684 $0 $28,792 Oklahoma $3,349,452 $3,621 $69 $25,714 Oregon $1,213,559 $1,772 $3 $25,204 Pennsylvania $13,946,054 $2,710 $1 $25,454 Puerto Rico $15,260 $604 $1 $2,053 Rhode Island $1,128,637 $3,296 $4 $23,591 South Carolina $3,560,091 $4,225 $6 $25,234 South Dakota $997,219 $3,544 $69 $25,273 Tennessee $6,053,203 $3,388 $9 $26,069 Texas $17,236,207 $3,807 $1 $26,312 Utah $789,550 $1,634 $2 $28,981 Vermont $422,036 $3,837 $77 $19,273 Virgin Islands $3,241 $3,241 $3,241 $3,241 Virginia $7,130,583 $2,727 $4 $27,671 Washington $2,732,364 $2,466 $3 $24,069 West Virginia $1,528,633 $2,354 $1 $25,539 Wisconsin $5,567,868 $3,115 $9 $47,346 Wyoming $206,830 $1,671 $53 $23,827 National Total $267,515,557 $2,910 $0 $119,561
Source: OIG analysis of 2002 Medicare claims data, 2006.

Page 19 – Herb Kuhn
Table 12. Durable Medical Equipment (DME): Total Payments and Median, Minimum, and Maximum Allowed Payment per Resident by State
State Total Payments Median Minimum Maximum Alabama $3,241,319 $188 $0 $101,589 Alaska $70,824 $260 $12 $11,576 Arizona $1,651,713 $185 $0 $32,539 Arkansas $2,760,844 $201 $0 $42,554 California $23,440,732 $230 $0 $44,567 Colorado $1,802,973 $230 $0 $20,911 Connecticut $2,977,175 $207 $0 $27,943 Delaware $423,644 $188 $0 $16,969 District of Columbia $372,916 $261 $0 $11,449 Florida $12,766,283 $214 $0 $94,183 Georgia $3,903,720 $182 $0 $35,815 Hawaii $188,174 $139 $1 $12,486 Idaho $638,537 $138 $0 $17,236 Illinois $9,408,205 $200 $0 $37,984 Indiana $6,518,023 $181 $0 $85,784 Iowa $2,877,255 $163 $0 $51,115 Kansas $2,322,844 $174 $0 $37,614 Kentucky $3,178,494 $157 $0 $33,244 Louisiana $6,061,930 $248 $0 $28,625 Maine $637,921 $138 $0 $9,544 Maryland $2,631,071 $189 $0 $26,716 Massachusetts $4,755,487 $224 $0 $19,613 Michigan $6,384,977 $243 $0 $47,633 Minnesota $2,791,318 $145 $0 $94,173 Mississippi $2,514,494 $231 $0 $46,453 Missouri $4,667,595 $213 $0 $120,501 Montana $710,425 $125 $0 $21,781 Nebraska $1,577,091 $152 $0 $32,574 Nevada $668,718 $205 $0 $65,637 New Hampshire $743,724 $203 $0 $11,177 New Jersey $6,922,168 $266 $0 $22,413 New Mexico $1,063,956 $242 $1 $16,834 New York $14,585,356 $240 $0 $58,475 North Carolina $6,116,289 $183 $0 $25,387 North Dakota $453,632 $143 $0 $9,608 Ohio $12,288,510 $210 $0 $47,909 Oklahoma $4,995,347 $269 $0 $27,955 Oregon $1,109,501 $179 $0 $16,945 Pennsylvania $10,322,429 $198 $0 $81,709 Puerto Rico $36,430 $221 $12 $6,687 Rhode Island $847,012 $215 $0 $14,683 South Carolina $2,524,440 $193 $0 $26,634 South Dakota $451,927 $138 $0 $12,005 Tennessee $4,814,894 $184 $0 $46,417 Texas $17,959,431 $225 $0 $90,610 Utah $889,810 $122 $0 $15,653 Vermont $265,536 $137 $0 $12,342 Virgin Islands $9,794 $542 $82 $4,985 Virginia $3,880,106 $206 $0 $19,200 Washington $2,732,357 $157 $0 $122,009 West Virginia $1,251,991 $230 $0 $19,626 Wisconsin $3,595,259 $142 $0 $18,481 Wyoming $335,566 $128 $0 $18,705 National Total $210,140,166 $205 $0 $122,009
Source: OIG analysis of 2002 Medicare claims data, 2006.

Page 20 – Herb Kuhn
Table 13. Standard Imaging: Total Payments and Median, Minimum, and Maximum Allowed Payment per Resident by State
State Total Payments Median Minimum Maximum Alabama $3,374,007 $134 $6 $2,140 Alaska $46,633 $61 $9 $960 Arizona $1,592,605 $145 $4 $9,267 Arkansas $1,963,056 $87 $7 $1,718 California $12,336,465 $116 $1 $5,799 Colorado $1,599,183 $100 $7 $3,245 Connecticut $4,612,282 $191 $7 $3,382 Delaware $874,974 $174 $7 $2,001 District of Columbia $460,352 $140 $8 $3,868 Florida $12,755,252 $131 $7 $5,012 Georgia $3,910,394 $99 $7 $2,785 Hawaii $144,122 $56 $9 $1,503 Idaho $419,863 $82 $7 $1,678 Illinois $9,037,209 $105 $7 $5,191 Indiana $5,537,328 $100 $1 $5,209 Iowa $2,661,054 $83 $7 $4,067 Kansas $2,474,767 $94 $6 $2,386 Kentucky $3,275,516 $99 $6 $2,799 Louisiana $4,684,486 $146 $7 $3,745 Maine $620,961 $84 $6 $1,767 Maryland $3,829,170 $138 $7 $10,299 Massachusetts $6,725,791 $151 $7 $14,833 Michigan $8,156,749 $171 $7 $3,611 Minnesota $3,598,176 $100 $1 $8,314 Mississippi $1,549,683 $74 $7 $2,508 Missouri $4,636,137 $109 $1 $2,449 Montana $492,737 $78 $8 $2,794 Nebraska $1,306,972 $76 $1 $2,888 Nevada $736,436 $150 $7 $2,452 New Hampshire $642,773 $94 $7 $1,542 New Jersey $8,186,097 $155 $4 $3,808 New Mexico $655,072 $97 $7 $2,861 New York $18,747,957 $153 $5 $6,842 North Carolina $3,946,275 $88 $6 $2,237 North Dakota $460,973 $69 $6 $1,512 Ohio $13,669,679 $134 $1 $3,036 Oklahoma $3,464,897 $134 $4 $4,335 Oregon $804,759 $99 $7 $3,157 Pennsylvania $13,914,336 $148 $0 $4,301 Puerto Rico $3,687 $24 $7 $823 Rhode Island $774,084 $86 $8 $2,368 South Carolina $1,768,404 $96 $6 $2,074 South Dakota $541,608 $72 $6 $4,325 Tennessee $4,067,278 $103 $6 $4,165 Texas $16,073,096 $137 $1 $5,544 Utah $489,524 $97 $7 $1,539 Vermont $147,165 $49 $8 $1,024 Virgin Islands $1,198 $128 $11 $309 Virginia $3,038,102 $92 $3 $3,684 Washington $2,765,400 $144 $4 $2,503 West Virginia $1,533,764 $112 $7 $3,799 Wisconsin $4,436,021 $106 $7 $4,144 Wyoming $199,880 $74 $7 $2,372 National Total $203,744,389 $119 $0 $14,833
Source: OIG analysis of 2002 Medicare claims data, 2006.

Page 21– Herb Kuhn
Table 14. Hospital Visit: Total Payments and Median, Minimum, and Maximum Allowed Payment per Resident by State
State Total Payments Median Minimum Maximum Alabama $2,640,003 $143 $11 $23,688 Alaska $57,144 $179 $36 $3,273 Arizona $1,344,385 $150 $27 $10,209 Arkansas $3,421,399 $198 $7 $11,086 California $20,921,446 $207 $2 $45,486 Colorado $1,242,998 $148 $30 $17,191 Connecticut $2,125,289 $162 $3 $10,300 Delaware $557,664 $177 $31 $9,102 District of Columbia $557,404 $245 $23 $8,862 Florida $13,809,683 $179 $13 $21,509 Georgia $4,655,649 $175 $1 $11,640 Hawaii $200,064 $155 $33 $6,009 Idaho $374,016 $140 $26 $5,896 Illinois $13,911,988 $175 $2 $33,098 Indiana $4,967,884 $144 $11 $9,106 Iowa $2,743,467 $142 $5 $8,260 Kansas $2,635,856 $164 $19 $10,152 Kentucky $3,438,850 $163 $26 $14,724 Louisiana $5,683,839 $205 $15 $14,114 Maine $529,576 $147 $1 $2,410 Maryland $4,283,904 $197 $15 $34,613 Massachusetts $4,863,165 $172 $8 $9,763 Michigan $4,933,971 $163 $3 $15,452 Minnesota $2,469,156 $147 $14 $7,055 Mississippi $2,337,473 $161 $4 $5,916 Missouri $5,068,547 $153 $5 $20,138 Montana $460,967 $140 $11 $3,481 Nebraska $1,582,515 $148 $14 $9,041 Nevada $459,283 $154 $28 $15,365 New Hampshire $499,017 $150 $3 $5,882 New Jersey $11,601,770 $227 $16 $31,628 New Mexico $594,810 $164 $11 $5,140 New York $14,047,267 $172 $6 $30,538 North Carolina $4,230,750 $155 $1 $13,765 North Dakota $542,822 $140 $26 $4,697 Ohio $9,129,881 $158 $6 $17,808 Oklahoma $3,563,789 $178 $15 $6,278 Oregon $623,076 $142 $12 $4,469 Pennsylvania $9,900,786 $169 $2 $15,477 Puerto Rico $19,128 $115 $27 $1,591 Rhode Island $726,606 $155 $14 $10,577 South Carolina $2,093,072 $164 $4 $10,104 South Dakota $483,835 $137 $8 $6,824 Tennessee $5,266,894 $186 $2 $13,901 Texas $17,383,964 $205 $7 $22,683 Utah $359,488 $145 $27 $4,071 Vermont $198,735 $146 $32 $1,795 Virgin Islands $2,315 $213 $141 $1,235 Virginia $3,092,749 $163 $3 $20,282 Washington $1,559,819 $147 $15 $8,982 West Virginia $1,265,440 $158 $26 $11,156 Wisconsin $2,678,898 $146 $5 $15,311 Wyoming $175,973 $143 $25 $2,558 National Total $202,318,468 $167 $1 $45,486
Source: OIG analysis of 2002 Medicare claims data, 2006.

Page 22 – Herb Kuhn
Appendix D
Below is a map of the United States showing the median payments per resident for Part B services in each State.