jec549.fm page 367 tuesday, may 15, 2001 1:34 pm …research.amnh.org/~rfr/hbp/chang.pdfrelationship...
TRANSCRIPT
Journal of Ecology
2001
89
, 367–384
© 2001 British Ecological Society
367
Blackwell Science, Ltd
Relationship between vegetation and soil seed banks in an arctic coastal marsh
E. R. CHANG*, R. L. JEFFERIES* and T. J. CARLETON*†
*
Department of Botany, University of Toronto, 25 Willcocks St., Toronto, Ontario, M5S 3B2, Canada;
†
Faculty of Forestry, University of Toronto, 33 Willcocks St., Toronto, Ontario, M5S 3B3, Canada
Summary
1
The effects of habitat degradation on the soil seed bank at La Pérouse Bay, Manitobaare described. Foraging by lesser snow geese leads to loss of vegetation, coupled withchanges in soil abiotic conditions and an increase in salinity.
2
The density of seeds and the relative abundance in the seed bank of species charac-teristic of undisturbed sites decrease following degradation, while the relative abundanceof invasive species increases. Vegetation loss had the greatest impact on seed banks ofstress-tolerant species and the least impact on species with many widely dispersed seeds.
3
The above-ground vegetation and below-ground seed bank were less similar in un
-
damaged plots than in disturbed plots. In spite of the low degree of similarity, redundancyanalysis of the data indicated that approximately half of the variation in the soil seedbank could be explained by the vegetation data and vice versa.
4
More recently degraded soils had richer soil seed banks than those from older dis-turbances. Site-specific factors not only influenced the species present but also the timelag between loss of vegetation and loss of the seed bank. Seed banks in these impactedand fragmented sites do not recover quickly.
5
Seed banks in sandy beach-ridges were less affected by degradation due to the greaterproportion of ruderals present in the original vegetation and the absence of the high soilsalinities that are characteristic of degraded salt-marsh soils.
Key-words
: beach-ridges, disturbance, lesser snow geese, redundancy analysis, salt-marsh,seed bank, stress
Journal of Ecology
(2001)
89
, 367–384
Introduction
Regeneration strategies of plants (Grubb 1977) areshaped by patterns of disturbance and stress, which actas selection forces over evolutionary time and can cor-respond approximately to the ruderal, stress-toleratorand competitor strategies in Grime’s life history-basedclassification (1977, 1979). Seeds frequently persist insoil as a ‘memory’ of former vegetation (Bakker
et al
.1996a), as they are often more tolerant of adverse con-ditions than their adult counterparts and, once buriedin soil, they may escape from agents of disturbance, dis-ease and predation. The presence of seeds in disturbedhabitats (Grime 1979) is determined by the relationshipsbetween the original plant assemblages, propaguleproduction and seed reserves in the soil. All will beaffected by disturbance and stress, and the soil seedbank will decline as a function of the time that haslapsed since the vegetation was destroyed (Bakker
et al
.1996a).
The highest similarity in species composition betweenvegetation and the soil seed bank is predicted whenrecruitment is tightly coupled with disturbance, andsecondary succession follows the initial colonization(Pierce & Cowling 1991) as seen in early, frequentlydisturbed, successional communities in both coastaldunes (Pierce & Cowling 1991) and an alpine herb field(Chambers 1993). In later stages, the vegetation was com-posed of mostly long-lived species, while the seed bankwas dominated by short-lived species (Chambers 1993).
In some northern and alpine habitats such as MontJacques-Cartier in Quebec (Morin & Payette 1988),vegetation and seed bank are correlated, but they areonly loosely coupled in other arctic, subarctic and sub-alpine communities (Whipple 1978; Diemer & Prock1993; Ingersoll & Wilson 1993; Staniforth
et al
. 1998).In wetlands similar correlations were found in freshwatermarshes (Leck & Graveline 1979; Parker & Leck 1985;Leck & Simpson 1987), coastal salt-marshes (Hopkins& Parker 1984) and inland marshes (van der Valk &Davis 1978; Pederson 1981), but not in an Appalachiansphagnum bog (McGraw 1987), salt pans (Ungar &
Correspondence: R. L. Jefferies (e-mail: [email protected])
JEC549.fm Page 367 Tuesday, May 15, 2001 1:34 PM
368
E. R. Chang, R. L. Jefferies & T. J. Carleton
© 2001 British Ecological Society,
Journal of Ecology
,
89
, 367–384
Riehl 1980) or over 10 years in a tidal freshwater marshon the Delaware River (Leck & Simpson 1995).
Methods used to determine the similarity betweenspecies composition of standing vegetation and seedsburied in the soil include qualitative assessment basedon the presence and absence of species (Morin & Payette1988), percentage similarity (Ingersoll & Wilson 1993;Ungar & Woodell 1996), comparisons of frequencies(Leck & Simpson 1987; Diemer & Prock 1993; Leck &Simpson 1995), Sörensen’s similarity index (van derValk & Davis 1976; Grandin & Rydin 1998), correlationcoefficients (Spearman’s correlation coefficient in Leck& Simpson 1995; Grandin & Rydin 1998; Staniforth
et al
. 1998; Kendall’s rank correlation coefficient in Pierce& Cowling 1991; community coefficient in Pierce &Cowling 1991), the
χ
2
goodness of fit test (Rydgren &Hestmark 1997) and the Mantel test (Jutila 1998).More recently, multivariate statistics have been usedto summarize and assess the relationship (Bray &Curtis ordination, Jutila 1998; [detrended] correspond-ence analysis, Pierce & Cowling 1991; Looney & Gibson1995; Rydgren & Hestmark 1997; Grandin & Rydin1998; unweighted pair group mean cluster analysis,Ungar & Woodell 1996). The difficulties that arisedue to the different scales used in measuring vegetation(frequency and cover estimates) and the seed bank(density per unit area) can be circumvented by com-paring separate ordinations of the vegetation and theseed bank (Pierce & Cowling 1991; Looney & Gibson1995), or by converting data to the presence orabsence of species (Rydgren & Hestmark 1997).Grandin & Rydin (1998) simply noted the differenceof scale in their ordinations and made comparisonsbased on the axes rather than absolute similarity values.Many other studies have used multiple methods.
Redundancy analysis (RDA) (van den Wollenberg1977), a method largely neglected by ecologists (Jongman
et al
. 1987), is in appropriate alternative where spatialenvironmental gradients are short, as in this study, andlinear responses of species are expected (ter Braak1994). A form of reduced rank regression, RDA can beviewed as a constrained version of principal componentanalysis (PCA) (ter Braak 1994; Skinner
et al
. 1998).Canonical correlation analysis (CANCOR) mayseem to be a more logical choice, as it would producecorrelations and regressions for the degree of sim-ilarity between vegetation and seed bank, and viceversa, in one ordination (Skinner
et al
. 1998). However,its stringent requirements regarding the ratio of samplesto species are fulfilled by few ecological data sets(Jongman
et al
. 1987). Two reciprocal RDA ordina-tions can, however, be viewed as equivalent to CAN-COR and used to assess the effects of gradients ofdisturbance, stress on plants and other potentiallyimportant environmental variables that affect therelationships.
A study of the seed and vegetation dynamics wasundertaken in both undamaged and degraded areas ofan arctic coastal marsh where herbivory by lesser snow
geese (
Anser caerulescens caerulescens
L.) has led to agradient of loss of vegetation and habitat degradation.The questions posed were as follows: (1) What is theeffect of loss of vegetation on the soil seed bank? (2) Towhat extent can the below-ground seed bank be predictedfrom the above-ground vegetation and vice versa?
Methods
La Pérouse Bay (58
°
44
′
N, 94
°
28
′
W) is located 32 kmeast of Churchill, Manitoba, on the coast of theHudson Bay lowlands. Permafrost, which is continuousin the Churchill region (Rouse
et al
. 1997), is found atdepths of 25–30 cm below the surface of coastal salt-marshes in mid-summer (Wilson & Jefferies 1996). Thesoils of intertidal and supratidal marshes are regosolicstatic cryosols (Agriculture Canada Expert Committeeon Soil Survey 1987) characterized by a gley mineralhorizon (Cg) and a surface Ah horizon that is veryshallow close to the coast (Wilson & Jefferies 1996).Surface soils of the beach-ridges where
Leymus mollis
grows, consist of undifferentiated sand and fine gravel(< 2 mm) with the presence of organic matter in theupper 15 cm.
Due to impeded drainage and the low salinity of tidalwaters, an inverse salinity gradient exists with highestsoil salinities recorded inland from the sea coast in theupper intertidal marsh or in the supratidal marsh (< twotidal inundations every 3 years) (Jefferies
et al
. 1979).The salinity gradient is further modified by the
foraging activities of a breeding colony of lesser snowgeese, that has been increasing exponentially at a rate ofabout 7% per annum from an estimated 1300 breedingpairs in 1968 to 44 500 pairs in 1997 (Cooke
et al
. 1995;K.F. Abraham, K. Ross & R.F. Rockwell, unpublishedaerial survey). Removal of live marsh vegetation and theinsulating layer of litter by geese leads to increased soilsurface temperatures and rates of evapotranspirationand hypersaline conditions, and substantially increasedrates of soil erosion result (Srivastava & Jefferies 1996).Similar changes have accompanied pulling of lyme grass(
L. mollis
) shoots by geese on a nearby beach-ridge,which extends along the western coast of La PérouseBay for 3 km.
Undamaged intertidal flats are covered with agraminoid sward consisting of
Puccinellia phryganodes
and
Carex subspathacea
(all nomenclature follows Cody[1996] unless indicated) with associated dicotyledonousspecies including
Potentilla egedii
,
Plantago maritima
,
Ranunculus cymbalaria
and
Stellaria humifusa
.
Salicorniaborealis
(Wolff & Jefferies 1987a,b) and
Senecio congestus
invade
Puccinellia
–
Carex
swards as degraded areasbecome increasingly saline.
Salicornia borealis
alsocolonizes degraded areas of the supratidal marsh wherethe vegetation previously consisted of low shrubs,
Salixbrachycarpa
and
Salix myrtillifolia
, and two caespitosegrasses,
Calamagrostis deschampsioides
and
Festuca
JEC549.fm Page 368 Tuesday, May 15, 2001 1:34 PM
369
Vegetation and seed bank similarity
© 2001 British Ecological Society,
Journal of Ecology
,
89
, 367–384
rubra
. On the beach-ridges, extensive stands of
L. mollis
have been replaced by ruderal species, such as
Matricariaambigua
. General descriptions and locations of thesecommunities, together with maps, are given in Jefferies
et al
. (1979) and Jano
et al
. (1998).
The soil seed bank and vegetation were sampled in inter-tidal, supratidal and inland salt-marshes, and on thebeach-ridge. Sampling areas were chosen
a priori
basedon the presence of selected indicator species for eachtype of community (e.g.
S. borealis
is characteristic ofdegraded, highly saline soils and
P. egedii
is restrictedto undamaged salt-marsh vegetation). On the beach-ridge, closed swards of
L. mollis
were characteristic ofundamaged plots and abundant
M. ambigua
indicatedloss of lyme grass. Samples were collected from two long-term exclosures (exclosed since 1982), and 10 plots whereloss of vegetation and soil degradation had occurred(degraded plots) on the intertidal marsh in the westernsection of La Pérouse Bay. Where large patches (> 9 m
2
)of intact vegetation remained, cores were taken fromfive undamaged and five degraded paired plots in theeastern area. Twenty undamaged and 20 degraded plotsblocked into two sites of 10 plots each were sampled inthe supratidal marsh, and samples were also taken fromtwo long-term exclosures (exclosed since 1984) and twopaired degraded plots in an inland salt-marsh 3 kmfrom the coast. Lastly, 10 undamaged and 10 degradedpaired plots were sampled on the beach-ridge. Eachset of paired plots, as well as each of the 10 degradedplots on the western intertidal flats and each set of 20paired undamaged and degraded vegetation plots inthe supratidal marsh, were separated by at least 25 m.
The soil seed bank was sampled from supratidal areasafter spring melt in June 1997 and from other areas atthe same time of year in 1998. At each plot, 10 soil cores(diameter, 6.7 cm; depth, 6 cm) were taken randomly alonga 1-m transect, separated into two layers and pooled withinlayers to give two samples of approximately 1 L of soil foreach plot. The distribution of seeds in the soil profile canbe used as an indicator of seed longevity of individualspecies (Thompson
et al
. 1997) and, where an organichorizon was visible usually 2–3 cm in depth, cores wereseparated into an upper organic and a lower minerallayer: otherwise the mineral horizon was separatedinto two equal portions. Seed banks were assessed usinga modified seedling emergence technique (ter Heerdt
et al
. 1996). The seeds were concentrated by washingsoils through a series of sieves (2 mm, 220
µ
m) using aHonda water pump before being spread out in trays(27 cm
×
53 cm) on top of sterile silica sand, coveredwith ventilated cloches, and placed in a common gardenat La Pérouse Bay Field Station. Trays were monitoredand watered, usually twice a day, and shaded from brightsunlight. Seedlings were removed as soon as they couldbe identified, or transplanted into small flower pots
(10 cm in diameter), filled with a peat-marl mixture andgrown until (except in a few cases) identification waspossible. After approximately 6 weeks, soils in trays weredried, crumbled, and then watered and monitored for anadditional 6 weeks before a subsample of soil from eachtray (10% by mass) was checked under a dissectionmicroscope for apparently viable seeds that had failedto germinate. However, very few intact seeds were found.
Percentage cover values were estimated for above-ground vegetation in late July and early August 1998in the same plots where soil seed bank samples werecollected. Vegetation abundance was estimated byselecting only a randomly chosen subset of the sameplots used to sample the seed bank in the supratidalmarsh (
n
= 15 for undamaged plots and
n
= 10 plotsfor degraded areas) and on the beach-ridge (
n
= 6 plotseach for undamaged and degraded areas). At eachsampled plot a grid (1 m
×
2 m separated into 10 cm
×
10 cm cells) was used to estimate cover values. Apin was lowered at a random point within each10 cm
×
10 cm square (
n
= 200 points per plot) and allspecies touching the pin were recorded.
Soil samples were collected in August 1998 and 1999 inorder to determine the distribution of particle sizes andsalinity as these environmental variables are known toaffect the distribution and growth of plants (Jefferies
et al
. 1979; Srivastava & Jefferies 1995b). Three plotswere picked randomly from each of the undamaged anddegraded sites sampled in the intertidal and supratidalsalt-marsh, and on the beach-ridge. Where only twoplots were available, such as exclosures in the westernintertidal marsh, both were sampled.
Proportions of sand, silt and clay in mineral soils weredetermined using the hydrometer method to measureparticle-size distribution (Sheldrick & Wang 1993). Thismeasure was inappropriate for soils of the inland marshthat were rich in organic matter. Data for soils from theeastern intertidal salt-marsh were taken from Handa(1998).
Each year the soils were very dry in late July andearly August. Due to the difficulty of extracting porewater, a known volume of water was added to a knownmass of soil and the sodium concentration present inthe water of amended soil (g Na per g dry soil) was usedas an index of salinity (Srivastava & Jefferies 1995a).Sodium content of the extract was measured using aPerkin-Elmer atomic absorption spectrophotometer(model 3110) in flame-emission mode.
The relationship between the soil seed bank and above-ground vegetation was examined using RDA (Rao 1964;van den Wollenberg 1977). For the vegetation RDA, acentred and normed PCA was used initially to sum-marize the soil seed bank and environmental data in order
JEC549.fm Page 369 Tuesday, May 15, 2001 1:34 PM

370
E. R. Chang, R. L. Jefferies & T. J. Carleton
© 2001 British Ecological Society,
Journal of Ecology
,
89
, 367–384
to increase the sample-to-predictor variable ratio. PCAwas used rather than detrended correspondenceanalysis (DCA) or non-centred components analysisusing varimax rotation as it resulted in an analysis withhigher explanatory power. All variables were convertedto a standardized scale as relative frequency out of100%. The resulting first eight postnormalized PCA axeswere then used to constrain the vegetation ordination.The biplot scores for the species in the seed bank dataand the three environmental variables (percentagesilt and sand in the particle-size distribution, sodiumconcentration) were projected onto the vegetationordination using matrix multiplication where:
S
=
P
×
R
where
S
represents a matrix with the species in theseed bank and the soil variables as its rows and thefour RDA axes as columns,
R
represents eight principlecomponent axes (rows) (four RDA axes (columns)),and
P
represents the species in the seed bank and thesoil variables as predictors of species in the vegetation(rows) (eight principle component axes (columns)).
Resulting scores were postnormalized. Althoughpercentage silt and sand are correlated, both soil vari-ables were used because when a RDA was executed usingthe original variables rather than the summarized PCAaxes, these two variables had inflation factors between5 and 7 indicating that both contribute useful informa-tion independent of each other. An inflation factor of30 indicates complete redundancy. For species foundin both the vegetation and the seed bank, a Euclideandistance among the first four RDA axes was calculatedbetween the position of the species in the vegetationordination and the position of the endpoint for the biplotarrow. This represented the same species as a constrain-ing variable in the seed bank based on the equation:
ED = [ (
v
1
–
s
1
)
2
+ (
v
2
–
s
2
)
2
+ (
v
3
–
s
3
)
2
+ (
v
4
–
s
4
)
2
]
1/2
where ED is the Euclidean distance,
v
is the speciesscores in the vegetation species ordination,
s
is thespecies score in the constraining seed bank variablesand subscripts 1–4 denote the RDA axes.
The same procedure was followed to predict seedbank data from vegetation and soil data. Comparisonof the results of the RDA to random expectation basedon Monte Carlo simulation (1000 permutations) was usedto test for significance based on the
F
-statistic (ter Braak1986). The statistical program used for these analyseswas
Version 4 (ter Braak & Smilauer 1998).
Results
The vegetation consisted of 33 species that were sub-jectively assigned to the plant species assemblage typewith which they had the closest association (Jefferies
et al
. 1979), based on long-term observations of the vegeta-tion at La Pérouse Bay and elsewhere in the HudsonBay lowlands (Table 1). Vegetation of undamagedsalt-marshes included both a lower lying graminoidsward, and islands of willow-grassland each associatedwith characteristic dicotyledonous species (Table 1).
Salicornia borealis
invasion of devegetated hypersalinemudflats was accompanied by
Spergularia marina
and
Atriplex patula
whereas unconsolidated sediments inbrackish ponds and streams within the delta of the MastRiver and Wawao Creek were colonized by
Hippuristetraphylla
. The ‘weedy’ assemblage consisted of ruderalspecies that were not tolerant of high soil salinity whilethe beach-ridge vegetation was dominated by
L. mollis
.Loss of vegetation and degradation of habitat resulted
in a substantially lower vegetation cover for all plots(Table 1) and shifts in relative abundance of salt-marsh orbeach-ridge assemblages to more ruderal species (Fig. 1).In intertidal, supratidal and inland salt-marshes,vegetation changed from graminoid swards with relat-ively high dicotyledonous species diversity to plots withlow plant biomass that were invaded by weedy species,such as
S. congestus
(Table 1).Eventually, the only vegetation that persisted in
damaged marsh sites was a monoculture of
S. borealis
.Among undamaged sites, the eastern intertidal plotshad a high cumulative vegetation cover (100.2%), butextremely low dicotyledonous species diversity (Table 1).Disturbance of beach-ridges led to replacement ofthe dominant
L. mollis
, a tall grass, by short vegetativecover composed mostly of
M. ambigua
.
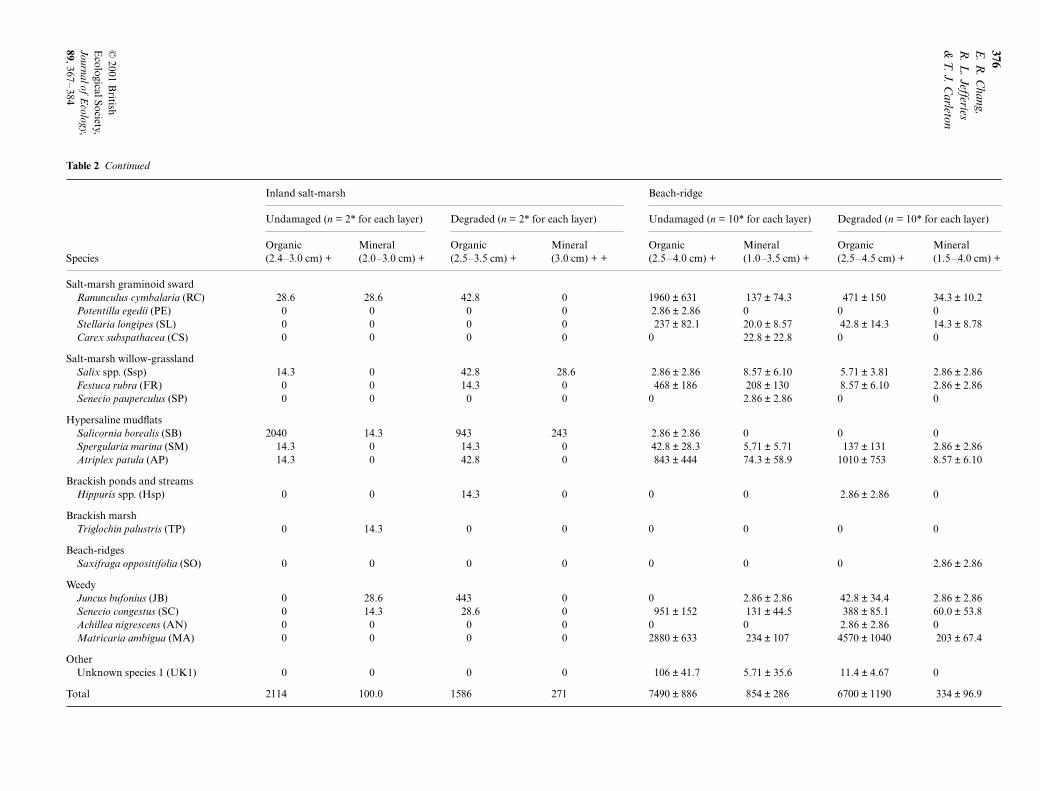
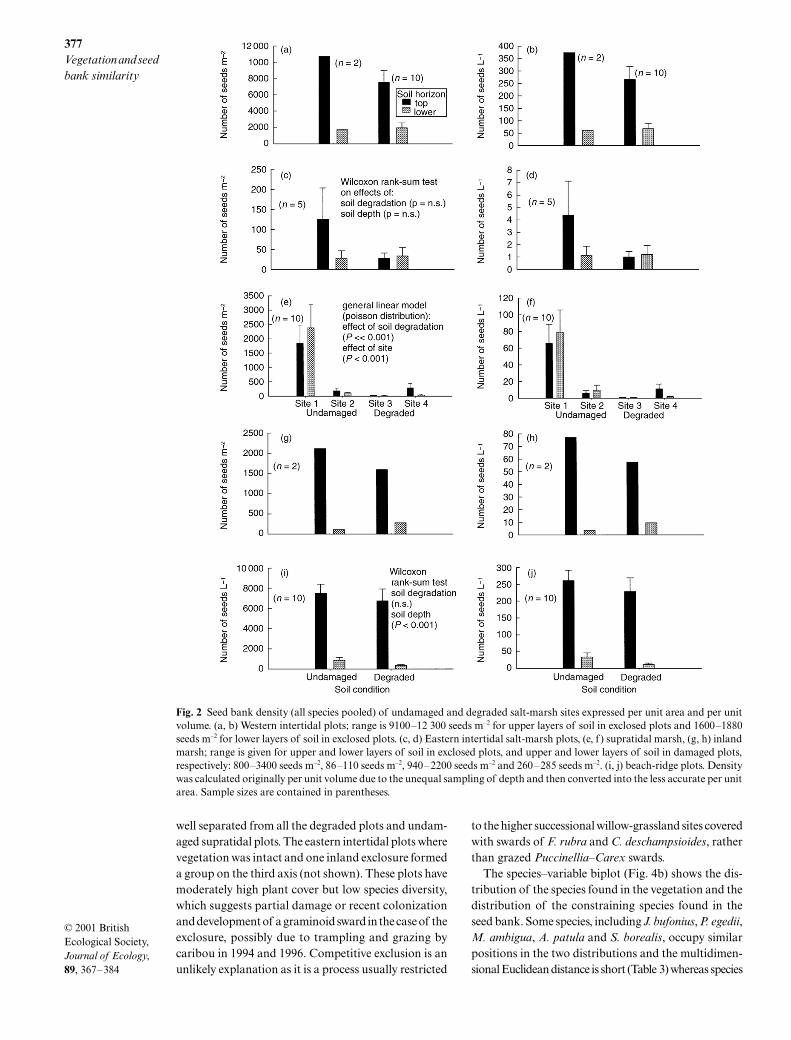
In general, total soil seed bank densities were highest inplots in the western intertidal marsh and the beach-ridgefollowed by plots in the supratidal, inland and easternintertidal marshes (Table 2). Loss of vegetation and soildegradation did not significantly affect seed densityin soils within each marsh, except for the supratidalmarsh (Fig. 2e, Wilcoxon rank-sum test, but n.s. for allother cases). In addition, in this marsh there werealso significant differences in seed abundance amongsites.
However, there were clear differences in seed abund-ance with soil depth in the western intertidal marshand the beach-ridge where seed densities were three to10 times more abundant in the upper soil sections. Incontrast, differences between upper and lower sectionsin seed density were non-significant in the easternintertidal marsh.
Overall, 23 species, of which very few were mono-cotyledonous, were found in the seed banks and eachwas assigned to the assemblage group with which it wasmost closely associated in the above-ground vegetation(Table 2). The small achenes (around 1.2 mm in length)of
R. cymbalaria
were abundant in soil under intertidalsalt-marsh graminoid swards whereas seeds of
S. borealis
,an annual tolerant of high salinity, were an indicator of
JEC549.fm Page 370 Tuesday, May 15, 2001 1:34 PM

371
Vegetation and seed
bank similarity
© 2001 B
ritish E
cological Society,
Journal of Ecology
,
89
, 367–384
Table 1
Percentage cover (
±
standard error) of species in vegetation of undamaged and degraded plots. The undamaged plots in the western intertidal marsh and inland salt-marsh have been exclosed from goosegrazing since 1982 and 1985, respectively. Species abbreviations are given in parentheses
Western intertidal salt-marsh Eastern intertidal salt-marsh Inland salt-marsh
SpeciesUndamaged sites (
n
= 2)Degraded sites (
n
= 10)Undamaged sites (
n
= 5)Degraded sites (
n
= 5)Undamaged sites (
n
= 2)Degraded sites (
n
= 2)
Salt-marsh graminoid sward
Carex subspathacea
(CS) 82.50 9.55
±
3.48 1.00
±
0.88 0.90
±
0.78 46.25 0
Potentilla egedii
(PE) 82.00 0.20
±
0.20 1.60
±
0.40 0.10
±
0.10 20.75 0
Puccinellia phryganodes
(PP) 26.75 7.05
±
4.29 92.30
±
2.50 9.20
±
3.97 55.50 1.00
Stellaria longipes
(SL) 26.00 0.20
±
0.11 0 0 0 0
Puccinellia nuttaliana
(PN) 10.50 0 0 0 8.75 0
Ranunculus cymbalaria
(RC) 6.75 1.50
±
0.40 0.80
±
0.12 0 5.25 0
Plantago maritima
(PM) 0 0 3.90
±
3.31 1.00
±
1.00 1.00 0
Stellaria humifusa
(SH) 2.00 0 0.10
±
0.10 0 1.00 0Salt-marsh willow-grassland
Festuca rubra (FR) 53.75 0.05 ± 0.05 0 0 11.75 0Calamagrostis deschampsioides (CD) 4.75 2.10 ± 0.62 0 0 0 0Salix brachycarpa (SaB) 0 1.00 ± 1.00 0 0 0 0Salix sp. (Ssp) 0.25 0 0 0 0 0Parnassia palustris (PaP) 0 0.05 ± 0.05 0 0 0.25 0Lomatagonium rotatum (LR) 0 0.05 ± 0.05 0 0 4.25 0
Hypersaline mudflatsSalicornia borealis (SB) 0.25 0 0.10 ± 0.10 0 0.75 32.50Spergularia marina (SM) 0 0 0.10 ± 0.10 0 0 0.75
Brackish marshSalix candida (SaC) 0 0 0 0 1.25 0Euphrasia arctica (EA) 0 0 0 0 1.00 0Salix planifolia (SaP) 0 0 0 0 0.75 0Triglochin palustris (TP) 0.25 5.85 ± 2.86 0.30 ± 0.20 0 0 0
Brackish ponds and streamsHippuris tetraphylla (HT) 0 0.05 ± 0.05 0 0 0 0
WeedySenecio congestus (SC) 0.25 10.25 ± 3.85 0 0 1.00 0Juncus bufonius (JB) 0 0.10 ± 0.10 0 0 0 0Achillea nigrescens (AN) 0 0 0 0 0.75 0
OtherUnknown species 1 (UK1) 0 0.05 ± 0.05 0 0 2.75 0
Total 296.00 38.05 100.20 11.20 163.00 34.25
JEC
549.fm P
age 371 Tuesday, M
ay 15, 2001 1:34 PM

372E
. R. C
hang, R
. L. Jefferies
& T. J. C
arleton
© 2001 B
ritish E
cological Society, Journal of E
cology, 89, 367–
384 Supratidal salt-marsh Beach-ridge
Undamaged sites Degraded sites Undamaged sites Degraded sites
Species Site 1 (n = 5) Site 2 (n = 10) Site 1 (n = 5) Site 2 (n = 5) (n = 2) (n = 2)
Salt-marsh graminoid swardCarex subspathacea (CS) 37.00 ± 5.9 53.45 ± 5.30 0.30 ± 0.20 2.20 ± 0.84 0 0.08 ± 0.08Potentilla egedii (PE) 10.20 ± 4.0 7.35 ± 1.06 0.10 ± 0.10 0 0 0Puccinellia phryganodes (PP) 11.60 ± 0.8 9.95 ± 1.82 7.40 ± 3.93 6.90 ± 2.85 0.08 ± 0.08 1.25 ± 0.81Stellaria longipes (SL) 0 0 0 0 27.50 ± 4.87 6.00 ± 2.21Puccinellia nuttaliana (PN) 0 0 0 0 0 0.08 ± 0.08Ranunculus cymbalaria (RC) 0.30 ± 0.2 0.45 ± 0.16 0 0 7.08 ± 1.80 5.92 ± 1.55Plantago maritima (PM) 2.50 ± 1.0 0.15 ± 0.08 0 0 0 0Dupontia fisheri (DF) 0 0.80 ± 0.45 0 0 0 0.42 ± 0.27Koenigia islandica (KI) 0 0 0 0 0 0.17 ± 0.17Stellaria humifusa (SH) 0 0 0 0 0 0.17 ± 0.17
Salt-marsh willow-grasslandFestuca rubra (FR) 8.00 ± 2.4 13.25 ± 3.93 0.20 ± 0.20 0 0.50 ± 0.26 0.42 ± 0.20Calamagrostis deschampsioides (CD) 0.10 ± 0.1 1.30 ± 0.35 0 0 11.91 ± 4.86 3.42 ± 1.92Salix brachycarpa (SaB) 0.40 ± 0.2 0 0 0 0.08 ± 0.08 0.25 ± 0.17Salix sp. (Ssp) 0.40 ± 0.4 1.25 ± 0.37 0 0 1.92 ± 0.44 0.08 ± 0.08Parnassia palustris (PaP) 0 0.25 ± 0.20 0 0 0 0Lomatogonium rotatum (LR) 0 0.20 ± 0.08 0 0 1.92 ± 0.98 0.17 ± 0.17Senecio pauperculus (SP) 0 0 0 0 0.42 ± 0.33 0.08 ± 0.08Rhinanthus minor (RB) 0 0 0 0 0.17 ± 0.17 0Hypersaline MudflatsSalicornia borealis (SB) 0.40 ± 0.5 0 0.10 ± 0.10 0.10 ± 0.10 0 0Spergularia marina (SM) 0.10 ± 0.1 0 0 0 0.08 ± 0.08 0Atriplex patula (AP) 0 0 0 0 0.67 ± 0.21 5.08 ± 3.40
Brackish marshEuphrasia arctica (EA) 0 0.05 ± 0.05 0 0 0.17 ± 0.17 0Triglochin palustris (TP) 0 0.20 ± 0.13 0 0 0.08 ± 0.08 0
Beach-ridgeLeymus mollis (LM) 0 0 0 0 72.58 ± 9.76 0Potentilla norvegica (PoN) 0 0 0 0 3.33 ± 1.74 0.50 ± 0.41Minuartia rubella (MR) 0 0 0 0 1.25 ± 1.25 1.50 ± 0.60Hordeum jubatum (HJ) 0 0 0 0 0.42 ± 0.42 0.17 ± 0.17
WeedySenecio congestus (SC) 0 0 0 0 4.08 ± 1.12 0.92 ± 0.40Juncus bufonius (JB) 0.30 ± 0.2 0 0 0 0 0Matricaria ambigua (MA) 0.10 ± 0.1 0 0 0 23.50 ± 5.36 68.67 ± 5.62Rumex occidentalis (RO) 0 0.10 ± 0.07 0 0 0.33 ± 0.25 0.08 ± 0.08Achillea nigrescens (AN) 0 0 0 0 0.25 ± 0.17 0
OtherUnknown species 1 (UK1) 0 0 0 0 0.25 ± 0.17 1.34 ± 0.95
Total 71.40 88.75 8.10 9.20 158.58 96.8
Table 1 Continued
JEC
549.fm P
age 372 Tuesday, M
ay 15, 2001 1:34 PM

373Vegetation and seed bank similarity
© 2001 British Ecological Society, Journal of Ecology, 89, 367–384
hypersaline mudflat sediments. Species characteristic ofbrackish marsh, brackish ponds and streams, and fresh-water ponds and streams, which occur geographicallyclose to the sampled salt-marsh plots, were also found inthe seed bank, suggesting that some seeds that dispersedto the plots were incorporated into the seed bank(Table 2). The weedy assemblage that consisted of mostlyruderal species that colonize disturbed soils, but arenot highly salt tolerant, was mainly represented inthe seed bank by Juncus bufonius, a widely distributedannual species with many records of a persistent seedbank (Thompson et al. 1997). Only four species foundhere appeared to be members of long-term persistentseed banks, i.e. R. cymbalaria, Hippuris spp., J. bufoniusand an unidentified member of Rosaceae that is notfound in the La Pérouse Bay flora at present (Table 2).It should be noted that the seed banks all of the dom-inant species (P. phryganodes and C. subspathacea in thesalt-marsh, L. mollis on the beach-ridge) are extremelysmall or absent because of irregular flowering and fruitset, grazing and sterility.
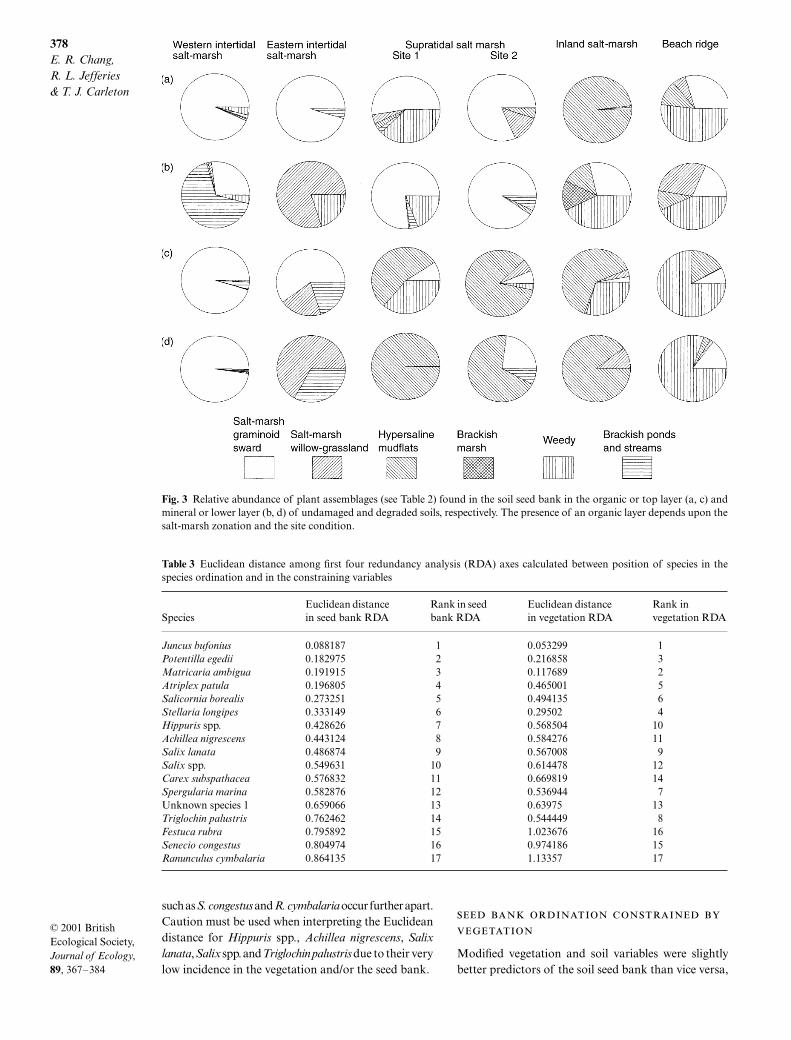
Soil degradation caused seed banks in the supratidalmarsh and, to a lesser extent on the beach-ridge, toshow shifts in relative abundance of seeds of differentassemblages towards more ruderal species (Fig. 3); thatis comparable with changes in the vegetation (Fig. 1).
The seed bank in other habitats showed little change(Fig. 3). The western intertidal marsh was dominatedby seeds typical of the graminoid sward (Table 2), exceptin the lower layers of the soil in undamaged plots wherean assemblage, typical of brackish ponds and streams,and consisting mostly of Hippuris spp., formed 67%of the seed bank. Seeds representative of plants fromhypersaline mudflats, the vegetation typical of degradedsalt-marshes, had the greatest relative abundance inplots in the inland salt-marsh. They made up most of
the seed bank where soil was degraded (60% and 90%at this location), as well as that in the upper organiclayers of undamaged plots (97%). In contrast, the weedyassemblage formed a significant proportion of the seedbank in the mineral layers of plots where vegetationwas undamaged and in the organic layers where soilwas degraded (Table 2).
The soil seed density was so low in the easternintertidal sites that it was difficult to determine theaffinities of seeds to current plant assemblages. The onlyspecies to have a density of at least 100 seeds m–2 wasR. cymbalaria, which was found in the top soil layer ofundamaged plots.
Overall, the eight seed bank variables (PCA axes one toeight) and the three soil variables (salinity, silt and sandpercentages) explained 49.5% (P < 0.005) of the vari-ation in the species data. The first two axes collectivelycontained 39.5% and the first three axes accountedfor 45.9% of the variability. Tests on both the first axis(F-ratio = 19.21, P = 0.001) and the total configuration(F-ratio = 6.14, P = 0.001) showed a high level of sig-nificance. For the eight modified seed bank and environ-mental variables, the first eight PCA axes explained99.7% of the variance with 73.7% contained withinthe first two axes. The first RDA axis separated themore silty salt-marsh plots from the sandier beach-ridge(Fig. 4a). The second RDA axis represented a distur-bance gradient with salinity (sodium concentration)showing the highest correlation, although proportionof sand was also important. The placement of plotsalong the disturbance gradient corresponded well witha priori assignment with three of the long-term exclosures
Fig. 1 Relative abundance of assemblages of plant species (see Table 1 for composition) found in the above-ground vegetation.(a) Undamaged plots, (b) degraded plots.
JEC549.fm Page 373 Tuesday, May 15, 2001 1:34 PM

374E
. R. C
hang, R
. L. Jefferies
& T. J. C
arleton
© 2001 B
ritish E
cological Society, Journal of E
cology, 89, 367–
384
Table 2 Density of species found in seed bank (seeds m–2 ± SE). Each sample (*) contains 10 pooled soil cores. Samples of varying thickness (+); all samples of same thickness (+ +)
Western intertidal salt-marsh Eastern intertidal salt-marsh
Undamaged (n = 2* for each layer)
Degraded (n = 10* for each layer)
Undamaged (n = 5* for each layer)
Degraded (n = 5* for each layer)
SpeciesTop layer (3 cm) + +
Lower layer (2.5–3 cm) +
Top layer (2.2–3.0 cm) +
Lower layer (2.5–3.0 cm) +
Top layer (3.0 cm) + +
Lower layer (2.0–3.0 cm) +
Top layer (3.0 cm) + +
Lower layer (2.5–3.0 cm) +
Salt-marsh graminoid swardRanunculus cymbalaria (RC) 9380 471 7100 ± 1500 1900 ± 594 120 ± 80.0 0 17.1 ± 11.4 0Potentilla egedii (PE) 257 0 5.71 ± 5.71 2.86 ± 2.86 0 0 0 0Carex subspathacea (CS) 343 0 2.86 ± 2.86 0 0 0 0 0Stellaria longipes (SL) 71.4 0 2.86 ± 2.86 0 0 0 0 0
Salt-marsh willow-grasslandSalix spp. (Ssp) 14.3 28.6 11.4 ± 6.32 8.57 ± 7.18 0 17.1 ± 11.4 5.71 ± 5.71 22.8 ± 16.6Festuca rubra (FR) 85.7 0 5.71 ± 2.81 5.71 ± 3.81 0 5.71 ± 5.71 0 0
Hypersaline mudflatsSalicornia borealis (SB) 28.6 0 0 2.86 ± 2.86 0 0 0 0Spergularia marina (SM) 14.3 0 0 0 0 0 0 0Atriplex patula (AP) 0 14.3 0 0 0 0 0 0
Brackish ponds and streamsHippuris spp. (Hsp) 171 1160 266 ± 83.5 22.8 ± 14.0 5.71 ± 5.71 0 5.71 ± 5.71 11.4 ± 7.00
WeedyJuncus bufonius (JB) 0 0 51.4 ± 38.3 0 0 0 0 0Senecio congestus (SC) 314 71.4 5.71 ± 3.81 0 0 5.71 ± 5.71 0 0Achillea nigrescens (AN) 0 0 2.86 ± 2.86 0 0 0 0 0Matricaria ambigua (MA) 14.3 0 0 2.86 ± 2.86 0 0 0 0
OtherUnknown species 1 (UK1) 0 0 68.6 ± 53.06 14.3 ± 7.68 0 0 0 0
Total 10700 1740 7520 ± 1480 1960 ± 607 126 ± 78.0 28.6 ± 18.1 28.6 ± 12.8 34.3 ± 21.0
JEC
549.fm P
age 374 Tuesday, M
ay 15, 2001 1:34 PM

375V
egetation and seed bank sim
ilarity
© 2001 B
ritish E
cological Society, Journal of E
cology, 89, 367–
384
Supratidal salt-marsh
Undamaged (n = 10* for each layer) Degraded (n = 10* for each layer)
Site 1 Site 2 Site 3 Site 4
SpeciesOrganic (2.1–3.5 cm) +
Mineral (2.0–3.5 cm) +
Organic (2.3–3.7 cm) +
Mineral (2.0–3.5 cm) +
Top layer (2.0–4.5 cm) +
Lower layer (1.5–4.6 cm) +
Top layer (1.6–3.7 cm) +
Lower layer (1.6–3.4 cm) +
Salt-marsh graminoid swardRanunculus cymbalaria (RC) 948 ± 425 1820 ± 772 134 ± 89.2 97.1 ± 24.5 0 0 11.42 ± 6.32 8.57 ± 4.36Potentilla egedii (PE) 17.1 ± 6.32 0 2.86 ± 2.86 11.43 ± 8.73 0 0 0 0Stellaria longipes (SL) 0 5.71 ± 3.81 2.86 ± 2.86 0 1.43 ± 1.43 0 5.71 ± 3.81 0
Salt-marsh willow-grasslandSalix spp. (Ssp) 68.6 ± 17.1 5.71 ± 3.81 14.3 ± 7.68 0 0 0 17.1 ± 12.2 0Festuca rubra (FR) 14.3 ± 7.68 8.57 ± 6.10 5.71 ± 5.71 0 0 0 0 0Primula spp. (Psp) 0 0 2.86 ± 2.86 0 0 0 0 0
Hypersaline mudflatsSalicornia borealis (SB) 54.3 ± 20.6 0 8.57 ± 4.36 2.86 ± 2.86 8.57 ± 6.10 11.4 ± 11.4 234 ± 139 22.86 ± 22.86Spergularia marina (SM) 0 0 0 0 0 0 2.86 ± 2.86 2.86 ± 2.86
Brackish ponds and streamsHippuris spp. (Hsp) 37.1 ± 17.1 91.4 ± 53.0 0 8.57 ± 6.10 0 0 0 2.86 ± 2.86Ranunculus gmelinii ssp. purshii (RG) 0 2.86 ± 2.02 0 0 0 0 0 0
Freshwater ponds and streamsCarex aquatilis (CA) 0 0 5.71 ± 3.81 0 0 0 0 0
WeedyJuncus bufonius (JB) 694 ± 534 434 ± 369 0 0 0 0 0 0Senecio congestus (SC) 8.57 ± 4.36 17.1 ± 11.4 0 0 2.86 ± 2.86 0 0 0Achillea nigrescens (AN) 0 0 0 0 0 0 8.57 ± 8.57 0Matricaria ambigua (MA) 0 0 0 0 2.86 ± 2.86 0 0 0
OtherRosaceae (ROS) 0 5.71 ± 5.71 8.57 ± 6.10 0 7.14 ± 3.84 0 0 0Unknown species 1 (UK1) 0 0 0 0 1.43 ± 1.43 0 0 0
Total 1843 ± 637 2390 ± 810 186 ± 90 120.0 ± 25.5 24.28 ± 6.04 11.4 ± 11.4 280 ± 157 37.14 ± 25.22
Table 2 Continued
JEC
549.fm P
age 375 Tuesday, M
ay 15, 2001 1:34 PM
376E
. R. C
hang, R
. L. Jefferies
& T. J. C
arleton
© 2001 B
ritish E
cological Society, Journal of E
cology, 89, 367–
384
Inland salt-marsh Beach-ridge
Undamaged (n = 2* for each layer) Degraded (n = 2* for each layer) Undamaged (n = 10* for each layer) Degraded (n = 10* for each layer)
SpeciesOrganic (2.4–3.0 cm) +
Mineral (2.0–3.0 cm) +
Organic (2.5–3.5 cm) +
Mineral (3.0 cm) + +
Organic (2.5–4.0 cm) +
Mineral (1.0–3.5 cm) +
Organic (2.5–4.5 cm) +
Mineral (1.5–4.0 cm) +
Salt-marsh graminoid swardRanunculus cymbalaria (RC) 28.6 28.6 42.8 0 1960 ± 631 137 ± 74.3 471 ± 150 34.3 ± 10.2Potentilla egedii (PE) 0 0 0 0 2.86 ± 2.86 0 0 0Stellaria longipes (SL) 0 0 0 0 237 ± 82.1 20.0 ± 8.57 42.8 ± 14.3 14.3 ± 8.78Carex subspathacea (CS) 0 0 0 0 0 22.8 ± 22.8 0 0
Salt-marsh willow-grasslandSalix spp. (Ssp) 14.3 0 42.8 28.6 2.86 ± 2.86 8.57 ± 6.10 5.71 ± 3.81 2.86 ± 2.86Festuca rubra (FR) 0 0 14.3 0 468 ± 186 208 ± 130 8.57 ± 6.10 2.86 ± 2.86Senecio pauperculus (SP) 0 0 0 0 0 2.86 ± 2.86 0 0
Hypersaline mudflatsSalicornia borealis (SB) 2040 14.3 943 243 2.86 ± 2.86 0 0 0Spergularia marina (SM) 14.3 0 14.3 0 42.8 ± 28.3 5.71 ± 5.71 137 ± 131 2.86 ± 2.86Atriplex patula (AP) 14.3 0 42.8 0 843 ± 444 74.3 ± 58.9 1010 ± 753 8.57 ± 6.10
Brackish ponds and streamsHippuris spp. (Hsp) 0 0 14.3 0 0 0 2.86 ± 2.86 0
Brackish marshTriglochin palustris (TP) 0 14.3 0 0 0 0 0 0
Beach-ridgesSaxifraga oppositifolia (SO) 0 0 0 0 0 0 0 2.86 ± 2.86
WeedyJuncus bufonius (JB) 0 28.6 443 0 0 2.86 ± 2.86 42.8 ± 34.4 2.86 ± 2.86Senecio congestus (SC) 0 14.3 28.6 0 951 ± 152 131 ± 44.5 388 ± 85.1 60.0 ± 53.8Achillea nigrescens (AN) 0 0 0 0 0 0 2.86 ± 2.86 0Matricaria ambigua (MA) 0 0 0 0 2880 ± 633 234 ± 107 4570 ± 1040 203 ± 67.4
OtherUnknown species 1 (UK1) 0 0 0 0 106 ± 41.7 5.71 ± 35.6 11.4 ± 4.67 0
Total 2114 100.0 1586 271 7490 ± 886 854 ± 286 6700 ± 1190 334 ± 96.9
Table 2 Continued
JEC
549.fm P
age 376 Tuesday, M
ay 15, 2001 1:34 PM
377Vegetation and seed bank similarity
© 2001 British Ecological Society, Journal of Ecology, 89, 367–384
well separated from all the degraded plots and undam-aged supratidal plots. The eastern intertidal plots wherevegetation was intact and one inland exclosure formeda group on the third axis (not shown). These plots havemoderately high plant cover but low species diversity,which suggests partial damage or recent colonizationand development of a graminoid sward in the case of theexclosure, possibly due to trampling and grazing bycaribou in 1994 and 1996. Competitive exclusion is anunlikely explanation as it is a process usually restricted
to the higher successional willow-grassland sites coveredwith swards of F. rubra and C. deschampsioides, ratherthan grazed Puccinellia–Carex swards.
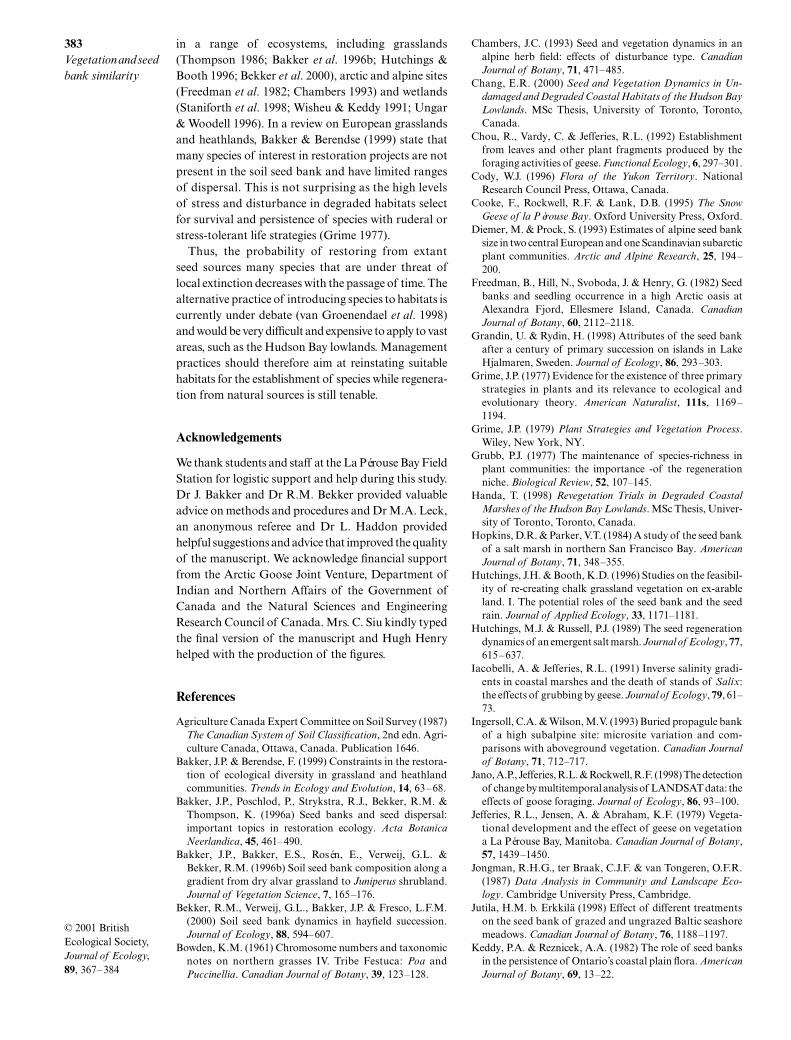
The species–variable biplot (Fig. 4b) shows the dis-tribution of the species found in the vegetation and thedistribution of the constraining species found in theseed bank. Some species, including J. bufonius, P. egedii,M. ambigua, A. patula and S. borealis, occupy similarpositions in the two distributions and the multidimen-sional Euclidean distance is short (Table 3) whereas species
Fig. 2 Seed bank density (all species pooled) of undamaged and degraded salt-marsh sites expressed per unit area and per unitvolume. (a, b) Western intertidal plots; range is 9100–12 300 seeds m–2 for upper layers of soil in exclosed plots and 1600–1880seeds m–2 for lower layers of soil in exclosed plots. (c, d) Eastern intertidal salt-marsh plots, (e, f ) supratidal marsh, (g, h) inlandmarsh; range is given for upper and lower layers of soil in exclosed plots, and upper and lower layers of soil in damaged plots,respectively: 800–3400 seeds m–2, 86–110 seeds m–2, 940–2200 seeds m–2 and 260–285 seeds m–2. (i, j) beach-ridge plots. Densitywas calculated originally per unit volume due to the unequal sampling of depth and then converted into the less accurate per unitarea. Sample sizes are contained in parentheses.
JEC549.fm Page 377 Tuesday, May 15, 2001 1:34 PM
378E. R. Chang, R. L. Jefferies & T. J. Carleton
© 2001 British Ecological Society, Journal of Ecology, 89, 367–384
such as S. congestus and R. cymbalaria occur further apart.Caution must be used when interpreting the Euclideandistance for Hippuris spp., Achillea nigrescens, Salixlanata, Salix spp. and Triglochin palustris due to their verylow incidence in the vegetation and/or the seed bank.
Modified vegetation and soil variables were slightlybetter predictors of the soil seed bank than vice versa,
Fig. 3 Relative abundance of plant assemblages (see Table 2) found in the soil seed bank in the organic or top layer (a, c) andmineral or lower layer (b, d) of undamaged and degraded soils, respectively. The presence of an organic layer depends upon thesalt-marsh zonation and the site condition.
Table 3 Euclidean distance among first four redundancy analysis (RDA) axes calculated between position of species in thespecies ordination and in the constraining variables
SpeciesEuclidean distance in seed bank RDA
Rank in seed bank RDA
Euclidean distance in vegetation RDA
Rank in vegetation RDA
Juncus bufonius 0.088187 1 0.053299 1Potentilla egedii 0.182975 2 0.216858 3Matricaria ambigua 0.191915 3 0.117689 2Atriplex patula 0.196805 4 0.465001 5Salicornia borealis 0.273251 5 0.494135 6Stellaria longipes 0.333149 6 0.29502 4Hippuris spp. 0.428626 7 0.568504 10Achillea nigrescens 0.443124 8 0.584276 11Salix lanata 0.486874 9 0.567008 9Salix spp. 0.549631 10 0.614478 12Carex subspathacea 0.576832 11 0.669819 14Spergularia marina 0.582876 12 0.536944 7Unknown species 1 0.659066 13 0.63975 13Triglochin palustris 0.762462 14 0.544449 8Festuca rubra 0.795892 15 1.023676 16Senecio congestus 0.804974 16 0.974186 15Ranunculus cymbalaria 0.864135 17 1.13357 17
JEC549.fm Page 378 Tuesday, May 15, 2001 1:34 PM

379Vegetation and seed bank similarity
© 2001 British Ecological Society, Journal of Ecology, 89, 367–384
explaining 54.4% of the species variation (P = 0.001).The first two axes collectively accounted for 52.8%of the variability. The first eight PCA axes of thevegetation and environmental variables explained
99.1% of the variance. The first RDA axis representeda disturbance gradient (Fig. 5a) whereas the secondseparated the salt-marsh samples from the beach-ridge samples (i.e. the reverse of the vegetation
Fig. 4 Redundancy analysis (RDA) based on percentage cover of species in the vegetation constrained by density of species in thesoil seed bank and three soil variables (sand, silt and salinity, Na+). Soil seed bank and soil factors were summarized using aprinciple component analysis (PCA) and the resulting first eight PCA axes were used as constraining variables. The positions ofspecies in the soil bank and soil variables were projected back through matrix multiplication. (a) Sample-variable biplot; (b)species-variable biplot. Seed bank species are shown in small upper case letters and species present in vegetation in large uppercase letters explained in the inset legend. See Tables 1 & 2 for abbreviations.
JEC549.fm Page 379 Tuesday, May 15, 2001 1:34 PM

380E. R. Chang, R. L. Jefferies & T. J. Carleton
© 2001 British Ecological Society, Journal of Ecology, 89, 367–384
ordination). Other major differences were that theseed banks of the degraded western intertidal plotscontained species characteristic of undamagedvegetation, while the two exclosures in the inland
marsh had seed banks typical of degraded soils. Theranking of Euclidean distance was similar in the twoordinations (Table 3), with greater consistency at theextremes (Fig. 5b).
Fig. 5 Redundancy analysis (RDA) based on density of species in the soil seed bank constrained by percentage cover of speciesin the vegetation and three soil variables (sand, silt and salinity, Na+). Vegetation and soil factors were summarized usinga principle component analysis (PCA) and the resulting first eight PCA axes were used as constraining variables. Thepositions of species in the vegetation and soil variables were projected back through matrix multiplication. (a) Sample-variable biplot; (b) species ordination. Species in the vegetation are shown in small upper case letters and are not representedby biplot arrows for the sake of clarity. Species present in the seed bank are shown in large upper case letters. See Tables 1& 2 for abbreviations.
JEC549.fm Page 380 Tuesday, May 15, 2001 1:34 PM

381Vegetation and seed bank similarity
© 2001 British Ecological Society, Journal of Ecology, 89, 367–384
Discussion
The combination of disturbance and physical stress onplants has a major effect on vegetation, as predicted byGrime (1979). The RDA vegetation ordination (Fig. 4)clearly delineated undamaged areas from areas wheresoil was degraded. As expected, salinity stress waspositively correlated with disturbance, and disturbedsalt-marsh plots were appreciably more saline thanbeach-ridge plots.
Loss of vegetation led to a decline in the density ofthe soil seed bank. While total seed number was not sig-nificantly different in the western intertidal and inlandsalt-marshes, and on the beach-ridge where vegetationis relatively intact, density decreased when spatial andtemporal scales of degradation were greater (Fig. 2),and the soils of the more degraded inland and easternintertidal salt-marshes thus contain fewer seeds. Thispattern was not always apparent on a smaller scale asthe loss of seeds from the soil following vegetationdamage was non-linear and exhibited a thresholdassociated with soil erosion. Vegetation loss also led todecreasing relative abundance of seeds of speciescharacteristic of intact vegetation and an increase ininvasive species (weedy species or annuals typical ofhypersaline mudflats). Even species with long-termpersistent seed banks are vulnerable to local extinctiondue to erosion, and our plots reflect different stagesin this process. Most soil degradation in the westernintertidal marsh and the supratidal marsh occurred atabout the same time (1988–90), and the former nowhas low values for vegetation cover while still retainingthis relatively rich seed bank. Processes appear tohave been slower in the latter, possibly because there isorganic matter in the soil that is less easy to erode. Inthe supratidal salt-marsh, site differences in the seedbank were apparent where the vegetation was un-damaged, but were not apparent in degraded areas.
The inland exclosures also have undamaged vege-tation but seed banks here are very poor and arecomposed mostly of S. borealis, an indicator of dis-turbance and high salinity. Degradation which wasalready apparent during the late 1970s and rapidrun-off of melt water may have strongly affectedseed accumulation, despite its continuing production.Although S. borealis is present at low frequencies inexclosed plots, it is the dominant species in the surround-ing degraded soils, and, hence, may have dispersed highnumbers of seeds there.
Most of the degradation on the beach-ridge occurredbetween 1973 and 1984 (remote-sensing data, Jano et al.1998), and loss of vegetation was associated with loss ofsoil. However, the reduced effect of vegetation loss onthe seed banks here may be due to the greater numberof free seeding ruderal species and the lack of hypersa-line conditions (Srivastava & Jefferies 1996).
The effect of loss of vegetation on the soil seed bankis influenced by the regeneration strategies of plants(Grubb 1977). Stress-tolerant species are often long-livedclonal plants (Grime 1979). The undamaged salt-marshis composed mostly of perennial vegetation and the specieswith the highest cover frequencies, C. subspathacea,P. phryganodes, P. egedii and S. humifusa (Table 1) areall salt-tolerant plants. They are capable of extensivestoloniferous orrhizomatous growth and P. phryganodesand C. subspathacea can also disperse and establish fromplant fragments, including individual leaves, shootsystems and tillers (Chou et al. 1992).
The most common species in the soil seed bank whenthe vegetation is undamaged are R. cymbalaria, Hippurisspp. and P. egedii (Table 2). Seeds of J. bufonius, anannual rush, are sometimes present in high densitiesbut their distribution is patchy. Of these species, onlyP. egedii is common in salt-marsh vegetation, but theonly seeds that are present in substantial densities in allzones and at all soil depths are those of R. cymbalaria(up to 9380 seeds m–2) and Hippuris spp. (up to 1160seeds m–2). Species characteristic of the undamagedsalt-marsh tend to spread clonally and do not thereforecontribute to the soil seed bank apart from R. cymbalaria,which is a minor component of the vegetation.
Staniforth et al. (1998) found very high numbers ofseeds of J. bufonius and S. marina in salt-marsh sedi-ments at Churchill. These two species formed 92% ofthe total seed bank, which had a mean of 39 204 seedsm–2, possibly because the soils are sandier and of lowersalinity (average of 10 g of solute per litre of soil solu-tion; Staniforth et al. 1998) than at La Pérouse Bay.
Salinity and desiccation may limit seed viability andability to germinate, despite large annual production.Colonizers can be categorized as stress-tolerators (sensuGrime 1977) because of the build up of salinity andthe drying out of soils away from drainage channels insummer. Patches of bare sediment appear as geese grubfor roots and rhizomes, and these are invaded by weedyspecies that invest heavily in seed production, such asS. borealis. Due to the extremely high soil salinity (upto 120 g of solute per litre) (Iacobelli & Jefferies 1991)in all marsh zones late in the growing season and thehigh rates of soil erosion, salt-tolerant plants dominateboth the above-ground vegetation and the soil seed bank(Tables 1 & 2). Salicornia borealis is at the limit of itsdistribution in northern coastal sites in Canada (Wolff& Jefferies 1987a,b) and, as an annual plant with anannual non-overlapping seed bank (Chang 2000), it maybe at risk. The seed bank in a heavily grazed salt-marshin South Wales dominated by Puccinellia maritima wassimilarly composed of only two salt-tolerant ruderalspecies, in this case Salicornia europaea and Suaedamaritima (Ungar & Woodell 1996).
Beach-ridge sites have a distinct vegetation, composed,with the exception of L. mollis, of ruderals. This may be
JEC549.fm Page 381 Tuesday, May 15, 2001 1:34 PM

382E. R. Chang, R. L. Jefferies & T. J. Carleton
© 2001 British Ecological Society, Journal of Ecology, 89, 367–384
due to the greater physical abrasion from wind, waveand ice action combined with the less stable, sandysubstrate producing a habitat that was more disturbedthan that of the salt-marsh until the establishment ofthe lesser snow goose colony in the mid-1950s (Cookeet al. 1995). Species common to both the vegetationand the seed bank are M. ambigua, Stellaria longipes,R. cymbalaria, A. patula and S. marina.
Seeds of the biennial composite S. congestus possessa pappus and are widely dispersed. Although thisspecies can tolerate only low levels of salinity, its seedsare widely distributed and entrapped at the soil surface.Although it was found most frequently in degradedintertidal sites, its highest density was under undamagedvegetation on the western intertidal and beach-ridgeplots where the vegetation and the larger particle size ofsandy soils, respectively, help to retain larger seeds.
The Euclidean distances given in Table 3 can beinterpreted as a measure of the degree of coupling ofspecies between vegetation and the seed bank. Of thewell-coupled species, only P. egedii was found inundamaged salt-marshes and production of largenumbers of both stolons and seeds may reinforce thelink between the seed bank and mature plants. Theothers are all weedy species typical either of degradedareas (M. ambigua, A. patula and S. borealis ) or of areasthat are disturbed but still retain intact soil (J. bufoniusand S. longipes) whose seeds may be dispersed close tothe parent plant or transported over long distances. Incontrast, seeds of S. congestus and R. cymbalaria wereoften found where they were absent from the vegetation.Seeds of species with persistent seed banks may beexpected to be found far from parent plants, althoughthey may be lost during disturbance. Juncus bufonius,which has many records of a large, persistent seed bank(Thompson et al. 1997), might have been expected toshow a large Euclidean distance. In fact, the distancewas short because of depletion of the seed bank dueto disturbance, thereby confirming the difficulty ofregeneration of species in degraded areas from apersistent seed bank.
Similar responses to disturbance of shifts in speciescomposition from long-lived, stress-tolerant species thatpropagate through vegetative mechanisms to short-lived,ruderal species that form seed banks have been recordedin salt-marshes (Hopkins & Parker 1984; Ungar &Woodell 1996), subarctic coastal habitats (Staniforthet al. 1998) and arctic and alpine systems (Freedmanet al. 1982; Chambers 1993).
The degree of similarity between the species composi-tion of vegetation and the soil seed bank is predictedto increase with disturbance due to greater relativeabundance of annuals in the vegetation (Hutchings &Russell 1989; Chambers 1993; Ungar & Woodell 1996),and to decrease with ‘stress’ due to lower seed production
and greater investment in clonal growth in perennialspecies (Diemer & Prock 1993). The degree of similaritywas indeed less in plots where the vegetation wasundamaged (compare positions in Figs 4 & 5). Muchof this reflects the poor contribution of the dominantspecies to the seed bank (cf. Ungar & Woodell 1996). Ofthese, P. phryganodes is a sterile triploid that has neverbeen known to set viable seed in North America(Bowden 1961; Sadul 1987) and C. subspathacea onlysets seed where it is protected from grazing, althoughboth species spread by clonal propagation (Chou et al.1992).
Other species were over-represented in the soil seedbank compared with their abundance in the vegetation.Soil seed banks that were similarly dominated by a fewspecies have been shown in other studies, including apolar desert in the High Arctic (Freedman et al. 1982),a salt-marsh near Churchill (Staniforth et al. 1998), ahigh subalpine site in the Oregon Cascade Mountains(Ingersoll & Wilson 1993), a salt-marsh in California(Hopkins & Parker 1984), a shoreline in Nova Scotia(Wisheu & Keddy 1991) and dune vegetation in SouthAfrica (Pierce & Cowling 1991). Some species werefound in the seed bank but were absent in the present-day vegetation, possibly due to lack of suitable ‘safe’sites for germination and establishment (van der Valk& Davis 1976, 1978, 1979; Keddy & Reznicek 1982;Smith & Kadlec 1983). Despite the low similarity,roughly half of the seed bank data could nevertheless bepredicted from the vegetation data and vice versa,although these values are slightly inflated (sample tovariable ratio is below the ideal, 6 : 1 vs. 10 : 1).
Handa’s (1998) study of revegetation potential ifgoose populations at La Pérouse Bay were controlledconcluded that restoration of the dominant graminoids,followed by other species, was possible in younger,intertidal marshes (i.e. while a source of propagulesremained), but would be extremely difficult in oldermarshes where vegetation had been absent for a numberof years.
The loss of vegetation and soil degradation in theinland marshes has occurred on such a large scale andover a long period of time that even exclosed areas, withapparently high seed production, only accumulate seedsof the opportunists S. borealis and J. bufonius. TheS. borealis assemblage represents a ‘lost sere’, as thisannual has roots less than 1 cm in length and all litter isblown or washed away, exposing the mineral substrateand preventing accumulation of organic material.Revegetation is thus unlikely.
Revegetation from natural seed sources may belimited by the dominance of ‘weedy’ species in the seedbank of disturbed environments, as well as the transientor only short-term persistence of seeds of target species(i.e. those in communities present before disturbance)
JEC549.fm Page 382 Tuesday, May 15, 2001 1:34 PM
383Vegetation and seed bank similarity
© 2001 British Ecological Society, Journal of Ecology, 89, 367–384
in a range of ecosystems, including grasslands(Thompson 1986; Bakker et al. 1996b; Hutchings &Booth 1996; Bekker et al. 2000), arctic and alpine sites(Freedman et al. 1982; Chambers 1993) and wetlands(Staniforth et al. 1998; Wisheu & Keddy 1991; Ungar& Woodell 1996). In a review on European grasslandsand heathlands, Bakker & Berendse (1999) state thatmany species of interest in restoration projects are notpresent in the soil seed bank and have limited rangesof dispersal. This is not surprising as the high levelsof stress and disturbance in degraded habitats selectfor survival and persistence of species with ruderal orstress-tolerant life strategies (Grime 1977).
Thus, the probability of restoring from extantseed sources many species that are under threat oflocal extinction decreases with the passage of time. Thealternative practice of introducing species to habitats iscurrently under debate (van Groenendael et al. 1998)and would be very difficult and expensive to apply to vastareas, such as the Hudson Bay lowlands. Managementpractices should therefore aim at reinstating suitablehabitats for the establishment of species while regenera-tion from natural sources is still tenable.
Acknowledgements
We thank students and staff at the La Pérouse Bay FieldStation for logistic support and help during this study.Dr J. Bakker and Dr R.M. Bekker provided valuableadvice on methods and procedures and Dr M.A. Leck,an anonymous referee and Dr L. Haddon providedhelpful suggestions and advice that improved the qualityof the manuscript. We acknowledge financial supportfrom the Arctic Goose Joint Venture, Department ofIndian and Northern Affairs of the Government ofCanada and the Natural Sciences and EngineeringResearch Council of Canada. Mrs. C. Siu kindly typedthe final version of the manuscript and Hugh Henryhelped with the production of the figures.
References
Agriculture Canada Expert Committee on Soil Survey (1987)The Canadian System of Soil Classification, 2nd edn. Agri-culture Canada, Ottawa, Canada. Publication 1646.
Bakker, J.P. & Berendse, F. (1999) Constraints in the restora-tion of ecological diversity in grassland and heathlandcommunities. Trends in Ecology and Evolution, 14, 63–68.
Bakker, J.P., Poschlod, P., Strykstra, R.J., Bekker, R.M. &Thompson, K. (1996a) Seed banks and seed dispersal:important topics in restoration ecology. Acta BotanicaNeerlandica, 45, 461–490.
Bakker, J.P., Bakker, E.S., Rosén, E., Verweij, G.L. &Bekker, R.M. (1996b) Soil seed bank composition along agradient from dry alvar grassland to Juniperus shrubland.Journal of Vegetation Science, 7, 165–176.
Bekker, R.M., Verweij, G.L., Bakker, J.P. & Fresco, L.F.M.(2000) Soil seed bank dynamics in hayfield succession.Journal of Ecology, 88, 594–607.
Bowden, K.M. (1961) Chromosome numbers and taxonomicnotes on northern grasses IV. Tribe Festuca: Poa andPuccinellia. Canadian Journal of Botany, 39, 123–128.
Chambers, J.C. (1993) Seed and vegetation dynamics in analpine herb field: effects of disturbance type. CanadianJournal of Botany, 71, 471–485.
Chang, E.R. (2000) Seed and Vegetation Dynamics in Un-damaged and Degraded Coastal Habitats of the Hudson BayLowlands. MSc Thesis, University of Toronto, Toronto,Canada.
Chou, R., Vardy, C. & Jefferies, R.L. (1992) Establishmentfrom leaves and other plant fragments produced by theforaging activities of geese. Functional Ecology, 6, 297–301.
Cody, W.J. (1996) Flora of the Yukon Territory. NationalResearch Council Press, Ottawa, Canada.
Cooke, F., Rockwell, R.F. & Lank, D.B. (1995) The SnowGeese of la Pérouse Bay. Oxford University Press, Oxford.
Diemer, M. & Prock, S. (1993) Estimates of alpine seed banksize in two central European and one Scandinavian subarcticplant communities. Arctic and Alpine Research, 25, 194–200.
Freedman, B., Hill, N., Svoboda, J. & Henry, G. (1982) Seedbanks and seedling occurrence in a high Arctic oasis atAlexandra Fjord, Ellesmere Island, Canada. CanadianJournal of Botany, 60, 2112–2118.
Grandin, U. & Rydin, H. (1998) Attributes of the seed bankafter a century of primary succession on islands in LakeHjalmaren, Sweden. Journal of Ecology, 86, 293–303.
Grime, J.P. (1977) Evidence for the existence of three primarystrategies in plants and its relevance to ecological andevolutionary theory. American Naturalist, 111s, 1169–1194.
Grime, J.P. (1979) Plant Strategies and Vegetation Process.Wiley, New York, NY.
Grubb, P.J. (1977) The maintenance of species-richness inplant communities: the importance -of the regenerationniche. Biological Review, 52, 107–145.
Handa, T. (1998) Revegetation Trials in Degraded CoastalMarshes of the Hudson Bay Lowlands. MSc Thesis, Univer-sity of Toronto, Toronto, Canada.
Hopkins, D.R. & Parker, V.T. (1984) A study of the seed bankof a salt marsh in northern San Francisco Bay. AmericanJournal of Botany, 71, 348–355.
Hutchings, J.H. & Booth, K.D. (1996) Studies on the feasibil-ity of re-creating chalk grassland vegetation on ex-arableland. I. The potential roles of the seed bank and the seedrain. Journal of Applied Ecology, 33, 1171–1181.
Hutchings, M.J. & Russell, P.J. (1989) The seed regenerationdynamics of an emergent salt marsh. Journal of Ecology, 77,615–637.
Iacobelli, A. & Jefferies, R.L. (1991) Inverse salinity gradi-ents in coastal marshes and the death of stands of Salix:the effects of grubbing by geese. Journal of Ecology, 79, 61–73.
Ingersoll, C.A. & Wilson, M.V. (1993) Buried propagule bankof a high subalpine site: microsite variation and com-parisons with aboveground vegetation. Canadian Journalof Botany, 71, 712–717.
Jano, A.P., Jefferies, R.L. & Rockwell, R.F. (1998) The detectionof change by multitemporal analysis of LANDSAT data: theeffects of goose foraging. Journal of Ecology, 86, 93–100.
Jefferies, R.L., Jensen, A. & Abraham, K.F. (1979) Vegeta-tional development and the effect of geese on vegetationa La Pérouse Bay, Manitoba. Canadian Journal of Botany,57, 1439–1450.
Jongman, R.H.G., ter Braak, C.J.F. & van Tongeren, O.F.R.(1987) Data Analysis in Community and Landscape Eco-logy. Cambridge University Press, Cambridge.
Jutila, H.M. b. Erkkilä (1998) Effect of different treatmentson the seed bank of grazed and ungrazed Baltic seashoremeadows. Canadian Journal of Botany, 76, 1188–1197.
Keddy, P.A. & Reznicek, A.A. (1982) The role of seed banksin the persistence of Ontario’s coastal plain flora. AmericanJournal of Botany, 69, 13–22.
JEC549.fm Page 383 Tuesday, May 15, 2001 1:34 PM

384E. R. Chang, R. L. Jefferies & T. J. Carleton
© 2001 British Ecological Society, Journal of Ecology, 89, 367–384
Leck, M.A. & Graveline, K.J. (1979) The seed bank of afreshwater tidal marsh. American Journal of Botany, 66,1006–1015.
Leck, M.A. & Simpson, R.L. (1987) Seed bank of a freshwatertidal wetland: Turnover and relationship to vegetationchange. American Journal of Botany, 74, 360–370.
Leck, M.A. & Simpson, R.L. (1995) Ten-year seed bank andvegetation dynamics of a tidal freshwater marsh. AmericanJournal of Botany, 82, 1547–1557.
Looney, P.B. & Gibson, D.J. (1995) The relationship betweenthe soil seed bank and above-ground vegetation of a coastalbarrier island. Journal of Vegetation Science, 6, 825–836.
McGraw, J.B. (1987) Seed bank properties of an Appalachiansphagnum bog and a model of the depth distribution ofviable seeds. Canadian Journal of Botany, 65, 2028–2035.
Morin, H. & Payette, S. (1988) Buried seed populations in themontane, subalpine, and alpine belts of Mont Jacques-Cartier, Quebec. Canadian Journal of Botany, 66, 101–107.
Parker, V.T. & Leck, M.A. (1985) Relationships of seed banksto plant distribution patterns in a freshwater tidal wetland.American Journal of Botany, 72, 161–174.
Pederson, R.L. (1981) Seed bank characteristics of the DeltaMarsh, Manitoba: Applications for wetland management.Selected Proceedings of the Midwest Conference on WetlandValues and Management (ed. B. Richardson), pp. 61–69.Freshwater Society, Navarre, MN.
Pierce, S.M. & Cowling, R.M. (1991) Disturbance regimesas determinants of seed banks in coastal dune vegetationof the southeastern Cape. Journal of Vegetation Science, 2,403–412.
Rao, C.R. (1964) The use and interpretation of principalcomponent analysis in applied research. Sankhya A, 26,329–358.
Rouse, W.R., Bello, R.L. & Lafleur, P.M. (1997) The lowarctic and subarctic. The Surface Climates of Canada(eds W.G. Bailey, T.R. Oke & W.R. Rouse), pp. 198–221.McGill-Queen’s University Press, Montréal.
Rydgren, K. & Hestmark, G. (1997) The soil propagule bankin a boreal old-growth spruce forest: changes with depth andrelationship to aboveground vegetation. Canadian Journalof Botany, 75, 121–128.
Sadul, H.A. (1987) The Effects of Lesser Snow Goose Grazingon Sub-Arctic Coastal Plant Populations. MSc Thesis, Uni-versity of Toronto, Toronto Canada.
Sheldrick, B.H. & Wang, C. (1993) Particle size distribution.Soil Sampling and Methods of Analysis (ed. M.R. Carter),pp. 499–511. Lewis Publishers, London.
Skinner, W.R., Jefferies, R.L., Carleton, T.J., Rockwell, R.F.& Abraham, K.R. (1998) Prediction of reproductive successand failure in lesser snow geese based on early season climaticvariables. Global Change Biology, 4, 3–16.
Smith, L.M. & Kadlec, J.A. (1983) Seed banks and their roleduring drawdown of a North American marsh. Journal ofApplied Ecology, 20, 673–684.
Srivastava, D.S. & Jefferies, R.L. (1995a) Mosaics of vegeta-tion and soil salinity: a consequence of goose foraging inan arctic salt-marsh. Canadian Journal of Botany, 74,75–83.
Srivastava, D.S. & Jefferies, R.L. (1995b) The effects of salin-ity on the leaf and shoot demography of two arctic foragespecies. Journal of Ecology, 83, 421–430.
Srivastava, D.S. & Jefferies, R.L. (1996) A positive feedback:herbivory, plant growth, salinity, and the desertification ofan Arctic salt-marsh. Journal of Ecology, 84, 31–42.
Staniforth, R.J., Griller, N. & Lajzerowicz, C. (1998) Soil seedbanks from coastal subarctic ecosystems of Bird Cove,Hudson Bay. Écoscience, 5, 241–249.
ter Braak, C.J.F. (1986) Canonical correspondence analysis: anew eigenvector technique for multivariate direct gradientanalysis. Ecology, 67, 1167–1179.
ter Braak, C.J.F. (1994) Biplots in reduced rank regression.Biometry Journal, 36, 983–1003.
ter Braak, C.J.F. & Smilauer, P. (1998) Canoco ReferenceManual and User’s Guide to Canoco for Windows: Softwarefor Canonical Community Ordination (Version 4). Micro-computer Power, Ithaca, NY.
ter Heerdt, G.N.J., Verweij, G.L., Bekker, R.M. & Bakker, J.P.(1996) An improved method for seed-bank analysis: seedlingemergence after removing the soil by sieving. FunctionalEcology, 10, 144–151.
Thompson, K. (1986) Small-scale heterogeneity in the seedbank of an acidic grassland. Journal of Ecology, 74, 733–738.
Thompson, K., Bakker, J. & Bekker, R. (1997) The Soil SeedBanks of North West Europe: Methodology, Density andLongevity. Cambridge University Press, Cambridge.
Ungar, I.A. & Riehl, T.E. (1980) The effect of seed reserveson species composition in zonal halophyte communities.Botanical Gazette, 141, 447–454.
Ungar, I.A. & Woodell, S.R.J. (1996) Similarity of seed banksto aboveground vegetation in grazed and ungrazed saltmarsh communities on the Gower Peninsula, South Wales.International Journal of Plant Science, 157, 746–749.
van den Wollenberg, A.L. (1977) Redundancy analysis. Analternative for canonical correlation. Psychometrika, 42,207–219.
van der Valk, A.G. & Davis, C.B. (1976) The seed banks ofprairie glacial marshes. Canadian Journal of Botany, 54,1832–1838.
van der Valk, A.G. & Davis, C.B. (1978) The role of seedbanks in the vegetation dynamics of prairie glacial marshes.Ecology, 59, 322–335.
van der Valk, A.G. & Davis, C.B. (1979) The role of seedsbanks in the vegetation dynamics of prairie glacial marshes.Ecology, 59, 322–335.
van Groenendael, J.M., Ouborg, N.J. & Hendriks, R.J.J.(1998) Criteria for the introduction of plant species. ActaBotanica Neerlandica, 47, 3–13.
Whipple, S.A. (1978) The relationship of buried, germinatingseeds to vegetation in an old-growth Colorado subalpineforest. Canadian Journal of Botany, 56, 1505–1509.
Wilson, D.J. & Jefferies, R.L. (1996) Nitrogen mineralization,plant growth and goose herbivory in an Arctic coastal eco-system. Journal of Ecology, 84, 841–851.
Wisheu, I.C. & Keddy, P.A. (1991) Seed banks of a rarewetland plant community: distribution patterns and effectsof human-induced disturbance. Journal of VegetationScience, 2, 181–188.
Wolff, S.L. & Jefferies, R.L. (1987a) Morphological andisozyme variation in Salicornia europaea (s.l.) (Cheno-podiaceae) in northeastern North America. CanadianJournal of Botany, 65, 1410–1419.
Wolff, S.L. & Jefferies, R.L. (1987b) Taxonomic status ofdiploid Salicornia europaea (s.l.) (Chenopodiaceae) innortheastern North America. Canadian Journal of Botany,65, 1420–1426.
Received 11 April 2000 revision accepted 26 September 2000
JEC549.fm Page 384 Tuesday, May 15, 2001 1:34 PM