paid and unpaid work in australian households: trends...
TRANSCRIPT
89AUTHORS
Title
Paid and Unpaid Work in AustralianHouseholds: Trends in the Gender Divisionof Labour, 1986-2005
Jenny Chesters, Janeen Baxter and Mark Western,The University of Queensland
AbstractChanges in labour force participation rates of men and women over the last threedecades raise questions about how men and women manage the combinedresponsibilities of paid and unpaid work. In the majority of couple families both partnersare now engaged in paid employment highlighting the necessity to consider both paidand unpaid work when examining household divisions of labour. In this study, we usedata collected in three national Australian surveys in 1986, 1993 and 2005 to examinethe combined paid and unpaid workloads of men and women in dual-earner families.We find that the gender gap in men’s and women’s combined workloads has narrowedwith men and women having similar loads when both are employed full-time. But thispattern does not hold for households with dependent children. We conclude thatparenthood is a constraint on equality in the division of labour within Australianhouseholds.
1. IntroductionThe prevalence of the ‘traditional’ male breadwinner family with a single male earnerand a non-employed female partner has steadily declined due to an increase in thelabour force participation rate of married women. The labour force participation rateof married women in Australia increased from 35 per cent to 56 per cent between 1972and 2004 (ABS, 1976, p. 43; and ABS, 2006, p. 124). Consequently, the proportion ofcouple families with both partners employed has increased. The proportion of Australianfamilies with dependent children where both parents are in paid employment increasedfrom 46 per cent in 1985 to 60 per cent in 2007 (ABS, 1996; and ABS, 2008a).
Given these trends it is timely to consider the workloads of Australian menand women in couple families to assess whether gender specialisation in paid and
Address for correspondence: Jenny Chesters, School of Social Science and Institute for SocialScience Research, The University of Queensland, St Lucia 4072 Australia. Email:[email protected]: The 1986 and 1993 Social Structure of Australia Project surveys were fundedby Australian Research Council Large Grants and the Neoliberalism, Inequality and Politics Projectwas supported under the Australian Research Council’s Discovery Projects funding scheme(DP0449516). © The Centre for Labour Market Research, 2009
89AUSTRALIAN JOURNAL OF LABOUR ECONOMICS
Volume 12 • Number 1 • 2009 • pp 89 - 107
90AUSTRALIAN JOURNAL OF LABOUR ECONOMICSVOLUME 12 • NUMBER 1 • 2009
unpaid work has declined and whether there is any evidence of increasing genderequality in overall work time. Earlier research has reported mixed evidence aboutthese trends. On the one hand, Baxter (2002) reported that although women had reducedtheir hours of domestic labour over time, there was little evidence of a marked changein men’s involvement in domestic work. On the other hand, research conducted in theUS has found that men are doing more in the home than in the past suggesting thatoverall workloads have become more equal (Bianchi et al., 2006; and Sayer, 2005).
Although there has been a great deal of research examining the division oflabour within couple families, there is continuing debate regarding the salience ofdifferent explanations of why women spend more time on housework than men. Thevarious theories developed to explain the allocation of labour within households havebeen well-canvassed in previous literature and it is not necessary to review thesearguments in detail here (see, for example, Baxter, 1993). Briefly, however, someresearchers argue that time spent on housework is inversely related to time spent onpaid work with the partner spending the least time in paid employment spending themost time on housework (Blood and Wolfe, 1960). Becker (1981) argued that thedivision of labour into paid work for men and unpaid work for women was a rationalchoice based on sound economic principles. According to Becker’s argument, menhad a comparative advantage in the labour market due to their higher levels of humancapital and women had a comparative advantage in the home due to their biology.Therefore, the gender division of labour was the most efficient way to utilise theresources of both partners. However, now that women are increasingly likely to remainemployed throughout their child bearing and child rearing years, this specialisation oflabour is no longer so widespread (Brynin and Ermisch, 2009). According to Bryninand Ermisch (2009, p. 17) due to women’s increased education and earning power, thereturns of work exceed the marginal value of home production making it less efficientfor women to withdraw from the labour market to specialise in care and housework.Thus men’s comparative advantage in the labour market is weakened and the allocationof domestic labour must be negotiated rather than assigned on the basis of gender.
A variant of the economic approach popular in sociological accounts of thedomestic division of labour is bargaining theory. This approach also takes intoconsideration the comparative resources of both partners and can be applied to thedivision of labour within dual-earner families. According to bargaining theory, higherlevels of economic resources translate into increased bargaining power. The partnermaking the largest contribution to household income is thus able to delegate houseworkto the other partner. Although some researchers have found an inverse relationshipbetween relative income and housework hours (Baxter, 1993; Baxter et al., 2005; andBianchi et al., 2000), they conclude that this effect is not gender neutral. Overall,researchers have found that economic exchange theories can explain why men do lesshousework but not why women do more housework (Baxter, 2002; Bianchi et al., 2000;Bittman et al., 2003; and Greenstein, 2000). For a more detailed discussion of the varioustheories about the allocation of unpaid work within households see Baxter (1993).
In this paper, we examine the combined workloads of men and women livingin dual-earner families in Australia in 1986, 1993 and 2005 to determine whetherthere has been any change over time in the allocation of time to paid work andhousework. Rather than examine within couple variations, we examine within gendervariations. In other words, we are interested in whether the allocation of time between
91JENNY CHESTERS, JANEEN BAXTER AND MARK WESTERN
Paid and Unpaid Work in Australian Households: Trends in the Gender Division of Labour, 1986-2005
paid work and housework of men in 2005 differed from that of men in 1986 andwhether the allocation of time between paid work and housework of women in 2005differed from that of women in 1986.
2. Men’s and Women’s Combined WorkloadsThere has been little research conducted in Australia to examine whether women’sincreased labour force participation has had any effect on the total workloads of menand women in couple families. In the one study examining change over time, Bittman(2004, p. 157) used time use diary data collected in 1987, 1992 and 1997 to examinethe total household workloads of Australian families. Bittman included the paid andunpaid work hours of both partners in his analyses finding that the total workloads forco-breadwinner couples (both partners employed full-time) averaged 137 hours perweek in 1987 and increased marginally to 138 hours per week in 1997. The averagetotal workload for new traditional couples (those in which men are employed full-time and women employed part-time) increased from 128 hours per week in 1987 to134 hours per week in 1997. Bittman did not examine the total work hours of eachpartner within the couple, so although it seems that the total workloads of dual-earnercouples have become more similar over time, there is no indication of whether thetotal workloads of men and women in dual-earner couples have become more similar.
Bittman and Wajcman (2004, p. 179) examined the total workloads of menand women in ten countries at one time point finding that in Australia, in 1992, thetotal workload for full-time employed women averaged 59.5 hours per week while thetotal workload for full-time employed men averaged 57.3 hours per week. In theircross national comparison, full-time employed married women in Canada, Finland,Norway and the UK also recorded higher total workloads than full-time employedmarried men. The total workloads of married men and women in Denmark, theNetherlands, the US and Sweden were similar. Bittman and Wajcman also estimatedwomen’s share of unpaid work time finding that Australian women employed full-time and living with partners contributed, on average, 73 per cent of their household’stotal unpaid work. This was six percentage points higher than that of their counterpartsin Sweden who contributed 67 per cent and four percentage points lower than that oftheir counterparts in the Netherlands who contributed 77 per cent.
Researchers in the US have generally found that women’s total workloads arehigher than men’s total workloads (Greenstein, 2000; and Sayer, 2005). For example,Greenstein (2000) analysed data from the 1987-88 US National Survey of Familiesand Households (NSFH) estimating that women’s total workloads averaged around71 hours per week compared to men’s total workloads of around 62 hours per week.Apart from routine housework tasks, Greenstein also included time spent paying billsand driving others to work and school in his estimation of unpaid work.
Examining change over time in the US, Sayer (2005, p. 291) found that theaverage total work hours of women increased from 56 hours per week in 1965 to 59hours per week in 1998 whereas the average total work hours for men decreased from57 hours in 1965 to 56 hours in 1998. According to Sayer, the increase in women’saverage total work hours was the result of the increase in the proportion of women inpaid employment rather than an increase in the average workloads of individual womenand the decrease in men’s average total work hours was related to the decline in thelabour force participation rate of men.
92AUSTRALIAN JOURNAL OF LABOUR ECONOMICSVOLUME 12 • NUMBER 1 • 2009
3. Gender SpecialisationThere has been a considerable amount of research examining the extent of genderspecialisation, that is, the proportion of total work time allocated to paid work andunpaid work by men and women in couple families. For example, Gershuny, Godwinand Jones (1994, p. 185) found that although the workloads of men and women whowere employed on a full-time basis had become more equal, the ‘mix between paidand unpaid work activities’ was skewed towards housework for women and paid workfor men, suggesting that gender specialisation remains embedded in the division oflabour within households. Greenstein (2000, p. 328) came to a similar conclusion.Looking at the proportion of total work hours spent doing unpaid work, he found thatwives spent 63.5 per cent of their total work time doing housework and husbandsspent 30 per cent of their total work time doing housework.
Researchers using US time use diary data to investigate change in workloads(i.e. paid and unpaid work) of partners within couple families have found evidencethat total workloads have become more similar with men spending more time doingunpaid work and women spending more time doing paid work (Bianchi et al., 2006;and Sayer, 2005, p. 296). Sayer (2005, p. 291) estimated that in 1965, women spentthree and a half times as many hours doing unpaid work as men and one third as manyhours as men doing paid work. In 1998, women spent one and a half times as manyhours doing unpaid work and 0.8 times as many hours doing paid work as men. Inother words, women’s allocation of time between paid work and unpaid work hasbecome more similar over time.
Australian researchers have also found evidence of gender specialisation. Usingdata from the third wave of the Household, Income and Labour Dynamics in Australia(HILDA) survey collected in 2003, Headey, Warren and Harding (2006) examined thetotal workloads of men and women in co-breadwinner families. Their estimate of totalwork included time spent commuting to and from the workplace, paid work hours anda range of indoor and outdoor housework tasks and household errands. Headey et al.(2006, p. 36) found that the total workloads of co-breadwinner men and women wererelatively equal with men averaging 61.5 hours and women averaging 60.6 hours.However, the mix between paid work and unpaid work differed for men and womenwith men spending more time doing paid work related activities and women spendingmore time doing housework. Men averaged 50 hours per week on employment relatedactivities, eight hours per week on core housework tasks and four and a half hours perweek on outdoor tasks whereas women averaged 44.3 hours per week on employmentrelated activities, 14.6 hours per week on core housework and two and a half hours onoutdoor tasks. Therefore, research generally shows that there is still a degree ofinequality in the composition of workloads with women continuing to specialise inunpaid work and men continuing to specialise in paid work.
4. Parenthood and SpecialisationWith the majority of couple families with dependent children now supplying twoworkers to the labour market, researchers have shown an increasing interest in theeffect that increased paid work hours has had on the workloads of families with children.There is evidence that the employment status of mothers is associated with the age ofthe youngest child (Chalmers et al., 2005; and de Vaus, 2004). For example, according

93JENNY CHESTERS, JANEEN BAXTER AND MARK WESTERN
Paid and Unpaid Work in Australian Households: Trends in the Gender Division of Labour, 1986-2005
to Chalmers, Campbell and Charlesworth (2005, p. 45), in 2004, 14 per cent of motherswith a youngest child under five years of age, 25 per cent of mothers with a youngestchild aged five to nine years and 35 per cent of mothers with a youngest child aged tento fourteen years were employed on a full-time basis. The percentage of mothersemployed on a part-time basis also varied according to the age of the youngest child.Thirty-one per cent of mothers with a youngest child under five years of age, 39 percent of mothers with a youngest child aged five to nine years and 36 per cent of motherswith a youngest child aged ten to fourteen years were employed on a part-time basis.
There is no evidence that the presence of dependent children has a similareffect on the employment status of fathers. In 2003, 85 per cent of men in couplefamilies with dependent children were employed on a full-time basis (ABS, 2003, p.27). According to Chalmers, Campbell and Charlesworth (2005, p. 44) although 36per cent of women employed on a part-time basis cited caring responsibilities as theirreason for choosing part-time employment, only four per cent of men employed part-time cited this reason.
The results of research conducted on data sourced from both panel surveysusing summary measures and diary based time use surveys show that parenthoodincreases gender specialisation. For example, Baxter, Hewitt and Haynes’ (2008)analysis of data collected over two waves of the Negotiating the Life Course: Gender,Mobility and Career Trajectories, found that the birth of a child increased mothers’housework hours by six hours per week but had no effect on fathers’ housework hours.Baxter et al. concluded that ‘becoming a father does not appear to result in significantchanges in men’s time in either housework or paid work’ (2008, p. 270). The presenceof children increased the gender gap in time spent doing housework as the increasedburden was carried by the mother rather than being shared by both parents.
Drago, Tseng and Wooden’s (2004, p. 10) analysis of data from wave one ofthe HILDA survey shows that the gender gap in paid work hours for parents withdependent children was larger than the gender gap for partners in couple familieswithout dependent children. Within couple families, employed mothers spent threehours less in paid employment than other employed women and employed fathersspent one and a half hours more in paid employment than other employed men.
Researchers using data collected by time-use diaries have also found that thepresence of dependent children has a greater effect on mothers’ workloads compared tofathers’ workloads. Craig and Bittman (2008) examined data from the 1997 AustralianTime Use Survey and found that the increased time demands resulting from the presenceof dependent children were largely met by mothers. The difference between the workloadsof mothers and childless women was greater than the difference between the workloadsof fathers and childless men. The average workload of mothers with a child aged lessthan two years was six hours more per week than for childless women. The averageworkload of fathers with a child aged less than two years was two hours per week morethan for childless men. There was also a noticeable difference in the composition of theworkloads leading Craig and Bittman to conclude that ‘gender inequities are exacerbatedby parenthood’ (2008, p. 84; see also Craig, 2005; and Craig, 2006).
According to the ABS (1998), in 1997, full-time employed women devoted36 per cent of their total work hours to unpaid work (housework and childcare) whereas,full-time employed mothers devoted half of their total work hours to unpaid work. Formen, parenthood was also associated with an increase in the proportion of total work
94AUSTRALIAN JOURNAL OF LABOUR ECONOMICSVOLUME 12 • NUMBER 1 • 2009
devoted to unpaid work. Full-time employed men devoted 23 per cent of their totalwork hours to unpaid work whereas men with dependent children spent 29 per cent oftheir total work hours doing unpaid work. These aggregate figures include all men andwomen irrespective of their marital status and age.
The most recent national time use survey was conducted in 2006, ABS (2008b)and shows that, the total workloads of all full-time employed women with dependentchildren averaged 9.7 hours per day, 50 per cent of which was devoted to houseworkand childcare. The total workload of full-time employed women (with and withoutdependent children) averaged 8.3 hours per day and of that 31 per cent was allocatedto unpaid work. In other words, the average full-time employed mother with dependentchildren devoted a larger proportion of her total work hours to unpaid work than theaverage full-time employed woman. Full-time employed men devoted 20 per cent oftheir total workloads (averaging around 8.7 hours per day) to unpaid work whereasfull-time employed men with dependent children devoted 27 per cent of their totalworkloads (averaging nine hours per day) to housework and childcare.
These figures indicate that there has been a slight decline in the proportion oftotal work hours allocated to unpaid work during the period 1997 to 2006 for all full-time employed men and for full-time employed fathers. For women change over time inthe allocation of total work hours between paid work and unpaid work varied accordingto whether or not there were dependent children in the home. There was no change overtime in the proportion of total work hours allocated to unpaid work for mothers (50 percent in both years) but there was a five percentage point decline in the proportion thatall full-time employed women devoted to unpaid work (36 per cent to 31 per cent).
Researchers in the US have also found evidence that the presence of dependentchildren leads to an increase in gender specialisation in the workloads of men andwomen in couple families (Bianchi et al., 2006; Jacobs and Gerson, 2001; and Sayer,2005). Bianchi, Robinson and Milkie (2006, p. 54) found that even when the totalworkloads of parents were similar there was evidence of specialisation in paid workfor fathers and unpaid work for mothers. In 2000, the total workloads of married fathersaveraged 64 hours per week and the total workloads of married mothers averaged 65hours per week. Married mothers’ averaged 80 per cent as much time as married fathersin paid work and married fathers spent half as much time doing housework as marriedmothers. Comparing these results with those of 1965, it is clear that although genderspecialisation persists it has lessened somewhat over time. In 1965, married fathersaveraged eight times as many hours in paid work as married mothers and one fifth asmany hours doing housework.
Jacobs and Gerson (2001, p. 58) found that fathers spent more hours in paidwork than other men and mothers spent fewer hours in paid work than other womencreating a larger gender gap in paid work hours for couples with dependent childrencompared to couples without dependent children. These gender differences in theconsequences of parenthood persisted despite the trend towards dual-earner families.
Although the broad trends are consistent, it is important to note that comparingfindings across studies is not straightforward. Research into total workloads is a complexand contested issue due to differences in the definition of total work, the methods usedto collect data and the context in which data are collected. Although there is someagreement that total work includes time spent doing both paid and unpaid work, thereare various definitions of unpaid work. Researchers may define unpaid work as
95JENNY CHESTERS, JANEEN BAXTER AND MARK WESTERN
Paid and Unpaid Work in Australian Households: Trends in the Gender Division of Labour, 1986-2005
housework, time spent managing the household, planning meals, paying bills,coordinating diaries, childcare, elder care and emotional labour or they may includeonly some of these elements. Paid work is more straightforward, and is usually definedas hours spent in paid employment. However, some researchers include time spentcommuting to and from the workplace, whereas others do not.
The ABS (2008b) has endeavoured to clarify the categories of time use referringto time allocated to employment related activities including paid work, education andcommuting, as contracted time. Time spent doing activities such as housework,childcare, elder care, voluntary work and purchasing is defined as committed time,while time allocated to sleeping, eating and personal hygiene is termed necessarytime. Any time left over from these three categories is regarded as free time that canbe spent doing leisure activities. In this paper, however, we use the terms paid andunpaid labour as we do not have data on time devoted to education, commuting,voluntary work or elder care. Moreover, as we are using survey estimates of time use,rather than data collected via time use diaries as employed by the ABS we feel it ismore appropriate to refer to paid and unpaid labour since these terms more accuratelyreflect our measures.
In this paper, we examine trends over time in divisions of paid and unpaidlabour across families with differing levels of involvement in paid employment andfamilies with and without dependent children. We ask three main questions:
1. Is there evidence of increasing gender equality in the combined paid and unpaidworkloads of Australian men and women?
2. Is there any evidence of a decline in gender specialisation in dual-earner familiesor are men continuing to specialise in paid work and women continuing to specialisein housework to the same degree as in the past?
3. Does the presence of dependent children increase the level of gender specialisationwithin dual-earner families as in the past?
5. MethodThe data analysed in this paper were collected by three national surveys, the 1986Social Structure of Australia Project, the 1993 Social Structure of Australia Projectand the 2005 Neoliberalism, Inequality and Politics Project. The 1986 Social Structureof Australia Project was designed to be nationally representative of the employedpopulation and was therefore restricted to male respondents working at least 30 hoursper week and female respondents working at least 15 hours per week (N=1195) (Westernet al., 2005). All respondents were aged 18 years or over and the data were collectedvia face-to-face interviews and a self-complete questionnaire. The 1993 Social Structureof Australia Project was a national survey with 2,780 respondents aged 18 years orover. The data were collected via a self-complete mail-out questionnaire (Western etal., 1993). The Neoliberalism, Inequality and Politics Project collected data from anational random sample of 1,623 individuals aged 18 years or over in 2005. Data werecollected via computer assisted telephone interviews (Western et al., 2005; and Westernet al., 2007). For reasons of comparability across the various project samples we restrictour analytical sample to married or cohabiting male respondents employed 30 or morehours per week and married or cohabiting female respondents employed 15 or morehours per week. Although this limits the generalisability of our findings, these surveys

96AUSTRALIAN JOURNAL OF LABOUR ECONOMICSVOLUME 12 • NUMBER 1 • 2009
provide the only Australian data on time spent doing housework spanning three decades,predating the first national time use diary survey conducted in 1992.
Only one individual per household was interviewed in each survey, but proxydata on other household members was collected, including the hours of paid workundertaken by spouses. However, since we do not know the hours of unpaid work ofspouses we confine our analyses here to change over time in men’s and women’shousework hours, rather than change over time in the allocation of paid and unpaidwork within couples.
Given our focus on the combined paid and unpaid work hours of men andwomen living in dual-earner families, we restrict our analyses to respondents agedbetween 18 and 64 years engaged in paid employment living with partners who werealso engaged in paid employment.
VariablesThere are four dependent variables: paid work hours, housework hours, combinedwork hours and proportion of combined work hours devoted to housework. We usethe term ‘combined work hours’ rather than total work hours as total work implies amore inclusive measure including activities such as childcare, elder care and volunteerwork. Time devoted to elder care and volunteer work is not included because thesurveys did not include questions related to time spent doing these activities.
Although some researchers also include time spent travelling to and from paidemployment in their estimation of employment related activities we are unable to doso in this study. Respondents were asked about the number of hours each week thatthey usually spent in paid work but not about their time spent travelling to and fromtheir workplace, therefore, we do not include time spent commuting.
The housework hours variable is derived from the number of hours or minutesrespondents spent each week doing ten specific housework tasks. Respondents in eachsurvey were asked how many hours/minutes per week they usually spent: preparingmeals, cleaning up after meals, shopping, cleaning the house, washing, ironing, takingout the rubbish, mowing the lawn, gardening, and doing home repairs and maintenance.Although this list is not exhaustive, it does include the commonly measured houseworktasks that are the routine everyday activities required in all households regardless offamily type.
Note that, unlike the data collected in ABS time use diaries, we are unable todifferentiate between main and secondary activities. We no not know whetherrespondents are completing more than one task at a time. Multi-tasking is common inunpaid labour, especially when performing childcare (Craig, 2007) and it is quitepossible that while spending time cleaning the house or preparing meals for example,other activities such as childcare may be performed simultaneously. This is one reasonadvanced in the literature to explain why survey estimates such as those used herecommonly find larger estimates of time spent on activities compared to those reportedin time use diaries. It has been suggested that respondents in survey estimates includeboth main and secondary activities when reporting time spent on activities, whereasrespondents of time use diaries report only time on each specific activity.
We do not include childcare for a number of reasons. First childcare is lesseasy to quantify since any time spent alone with young children, regardless of whetherone is performing specific childcare tasks, may be classified as childcare. For example,

97JENNY CHESTERS, JANEEN BAXTER AND MARK WESTERN
Paid and Unpaid Work in Australian Households: Trends in the Gender Division of Labour, 1986-2005
even if children are asleep, time spent in the household may be defined as child minding.Whilst the presence of sleeping children does constrain the activities parents canundertake it does not prevent them from engaging in other activities within thehousehold including unpaid work and leisure activities such as reading or watchingtelevision. Second, childcare tasks vary widely depending on the age of children. Forexample, the caring tasks associated with infants and pre-school children are verydifferent to those associated with caring for older children. In order to make relevantcomparisons we would need to confine the samples from each survey in very specificways. For example, we would need to compare samples of those with a child underthree, samples of those with a primary school aged child and samples of those with ateenage child under 15. Our samples are not large enough in each of these categoriesto enable reliable comparisons over time. Third, the data on childcare time collectedin each of the surveys used here primarily asked about the activities associated withvery young children and thus we are unable to provide information on activities withschool-aged and teenage children. For analyses of change over time in the genderdivision of childcare see Baxter (2002).
To construct the combined work hours variable we take the sum of houseworkhours and paid work hours per week for each respondent. The housework proportionof combined work hours is constructed by dividing the respondent’s housework hoursby the respondent’s combined work hours. For example, if the respondent’s combinedwork hours equaled 50 hours per week, and their housework hours equaled 20 hoursper week, their value on the housework proportion of combined work variable wouldbe 0.4 (20/50).
Examination of paid work hours and housework hours separately allows us toexamine whether changes in workloads are due to changes in housework or paid workor both. We are also able to determine whether the proportion of combined work hoursdevoted to housework has changed due to changes in paid work hours or changes inhousework hours. For example, if men, on average, allocate 20 per cent of theircombined work hours to housework in 1986 and 30 per cent of their combined workhours to housework in 2005, we will be able to identify whether this has occurredbecause average paid work hours have decreased or average housework hours haveincreased.
We include two control variables in our analyses: family type and presence ofdependent children. The presence of dependent children variable is coded 1 = childaged less than 15 years living in the household. The family type variable is constructedfrom the data pertaining to the employment status of the respondents and their partner.Respondents are divided into two categories: part-time paid employment (15-34 hours);full-time paid employment (35 hours or more). Partners are divided into three categoriesaccording to their hours of employment: no paid employment; part-time paidemployment (1-34 hours); and full-time paid employment (35 hours or more). Only72 respondents (16 from 1986, 35 from 1993 and 37 from 2005) were living in couplefamilies in which the male partner worked part-time. These respondents were droppedfrom the analyses due to the difficulties associated with achieving statistically significantand meaningful results from analyses of small groups. Therefore, the family typevariable divides respondents into two groups according to the employment status ofthe female partner: 1 = co-breadwinner (both partners employed full-time); 2 = newtraditional (male employed full-time and female employed part-time).
98AUSTRALIAN JOURNAL OF LABOUR ECONOMICSVOLUME 12 • NUMBER 1 • 2009
Analytical StrategyWe conduct our analyses separately for men and women because, as previous researchhas shown, gender is a major predictor of both paid work and housework hours,explaining a significant proportion of the variance in work hours (Baxter et al., 2005;Bianchi et al., 2000; and Davis and Greenstein, 2004). Separate analyses were alsoconducted for each of the datasets, 1986, 1993 and 2005. Rather than average acrossall men and women as some researchers have done in the past (for example, Sayer,2005), we average across men in each family type and women in each family type.Therefore, any increase in the paid work hours of women would not be a reflection ofan increase in the proportion of women working on a full-time basis and any decreasein the paid work hours of men would not be due to a decline in the proportion of menemployed on a full-time basis.
To examine trends in time spent on paid, unpaid and combined work hours wecompare mean differences for men and women for each year by household type. Weuse t-tests to examine statistically significant differences across groups. These are theappropriate tests because the time variables are continuous. To examine trends in theproportions men and women contribute to combined work and housework over timewe use fractional logit regression (Wooldridge, 2002). The proportion dependentvariables are bounded between 0 and 1 but the predicted values from a standard linearregression analysis are not confined to the unit interval. One strategy for such boundeddata is to model a logistic function of the proportion as a linear function of covariateswith ordinary least squares, but the conditional variance of the proportion isheteroscedastic. A better solution is to use quasi-maximum likelihood estimation forthe fractional logit with a robust estimator for the variance matrix (Papke andWooldridge, 1996). We adopt that strategy here. We fit a series of models with threeway interactions for time, sex and family structure, examine the significance ofcomponent terms and progressively simplify the models where possible by omittinginsignificant higher order interactions. We then plot the predicted probabilities fromthe preferred model to illustrate the trends.
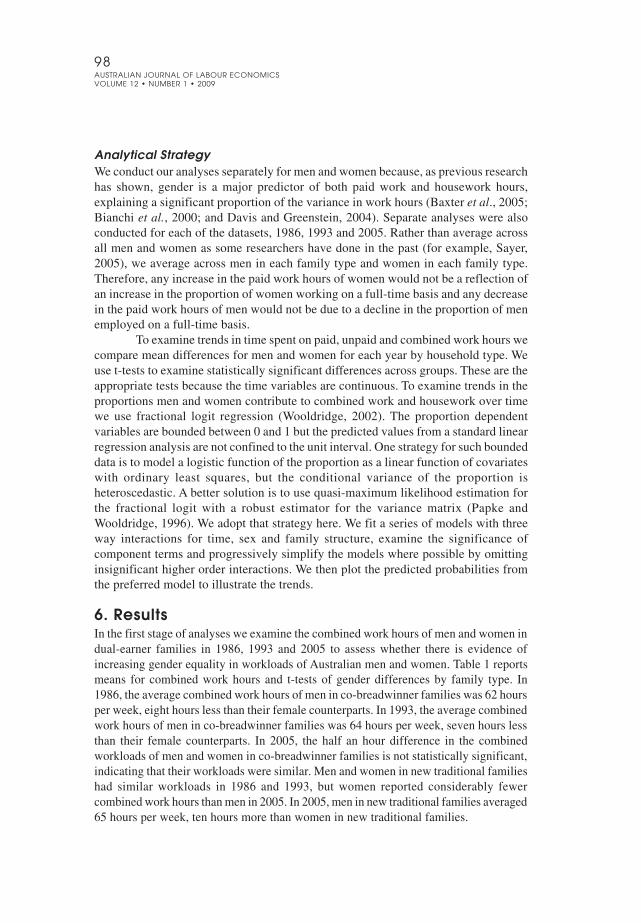
6. ResultsIn the first stage of analyses we examine the combined work hours of men and women indual-earner families in 1986, 1993 and 2005 to assess whether there is evidence ofincreasing gender equality in workloads of Australian men and women. Table 1 reportsmeans for combined work hours and t-tests of gender differences by family type. In1986, the average combined work hours of men in co-breadwinner families was 62 hoursper week, eight hours less than their female counterparts. In 1993, the average combinedwork hours of men in co-breadwinner families was 64 hours per week, seven hours lessthan their female counterparts. In 2005, the half an hour difference in the combinedworkloads of men and women in co-breadwinner families is not statistically significant,indicating that their workloads were similar. Men and women in new traditional familieshad similar workloads in 1986 and 1993, but women reported considerably fewercombined work hours than men in 2005. In 2005, men in new traditional families averaged65 hours per week, ten hours more than women in new traditional families.
99JENNY CHESTERS, JANEEN BAXTER AND MARK WESTERN
Paid and Unpaid Work in Australian Households: Trends in the Gender Division of Labour, 1986-2005
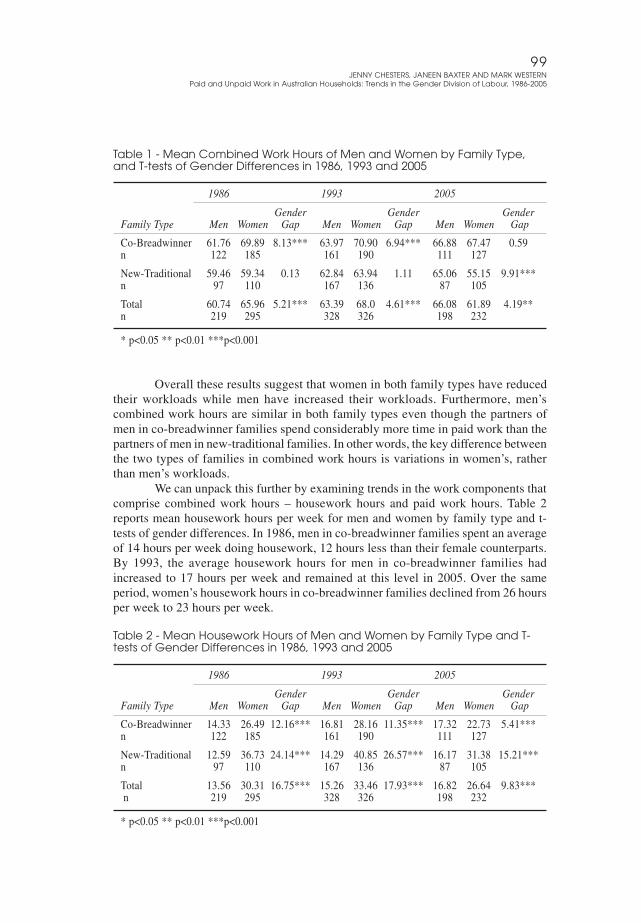
Table 1 - Mean Combined Work Hours of Men and Women by Family Type,and T-tests of Gender Differences in 1986, 1993 and 2005
1986 1993 2005
Gender Gender GenderFamily Type Men Women Gap Men Women Gap Men Women Gap
Co-Breadwinner 61.76 69.89 8.13*** 63.97 70.90 6.94*** 66.88 67.47 0.59n 122 185 161 190 111 127
New-Traditional 59.46 59.34 0.13 62.84 63.94 1.11 65.06 55.15 9.91***n 97 110 167 136 87 105
Total 60.74 65.96 5.21*** 63.39 68.0 4.61*** 66.08 61.89 4.19**n 219 295 328 326 198 232
* p<0.05 ** p<0.01 ***p<0.001
Overall these results suggest that women in both family types have reducedtheir workloads while men have increased their workloads. Furthermore, men’scombined work hours are similar in both family types even though the partners ofmen in co-breadwinner families spend considerably more time in paid work than thepartners of men in new-traditional families. In other words, the key difference betweenthe two types of families in combined work hours is variations in women’s, ratherthan men’s workloads.
We can unpack this further by examining trends in the work components thatcomprise combined work hours – housework hours and paid work hours. Table 2reports mean housework hours per week for men and women by family type and t-tests of gender differences. In 1986, men in co-breadwinner families spent an averageof 14 hours per week doing housework, 12 hours less than their female counterparts.By 1993, the average housework hours for men in co-breadwinner families hadincreased to 17 hours per week and remained at this level in 2005. Over the sameperiod, women’s housework hours in co-breadwinner families declined from 26 hoursper week to 23 hours per week.
Table 2 - Mean Housework Hours of Men and Women by Family Type and T-tests of Gender Differences in 1986, 1993 and 2005
1986 1993 2005
Gender Gender GenderFamily Type Men Women Gap Men Women Gap Men Women Gap
Co-Breadwinner 14.33 26.49 12.16*** 16.81 28.16 11.35*** 17.32 22.73 5.41***n 122 185 161 190 111 127
New-Traditional 12.59 36.73 24.14*** 14.29 40.85 26.57*** 16.17 31.38 15.21***n 97 110 167 136 87 105
Total 13.56 30.31 16.75*** 15.26 33.46 17.93*** 16.82 26.64 9.83*** n 219 295 328 326 198 232
* p<0.05 ** p<0.01 ***p<0.001
100AUSTRALIAN JOURNAL OF LABOUR ECONOMICSVOLUME 12 • NUMBER 1 • 2009
As expected there are greater differences in the housework hours of men andwomen in new traditional families. In 1986, men in new traditional families spent onaverage 24 hours less per week on housework than women in new traditional families.In 1993, the difference between male and female housework hours increased to 27hours per week and in 2005, the difference between male and female housework hoursdeclined to 15 hours per week. This decline in the gender gap is a consequence of afive hour decline in women’s housework hours and a three and a half hour increase inmen’s housework hours between 1986 and 2005.
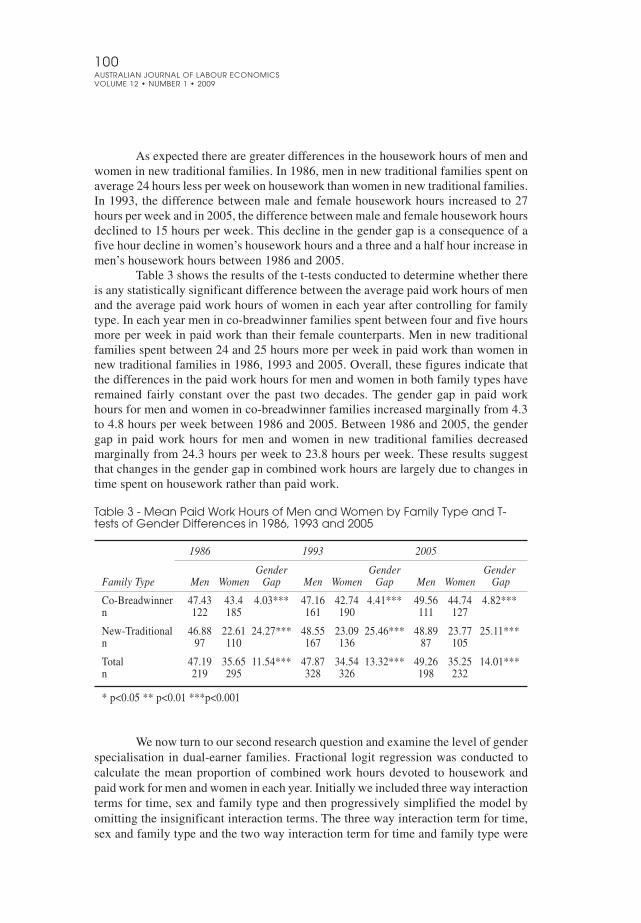
Table 3 shows the results of the t-tests conducted to determine whether thereis any statistically significant difference between the average paid work hours of menand the average paid work hours of women in each year after controlling for familytype. In each year men in co-breadwinner families spent between four and five hoursmore per week in paid work than their female counterparts. Men in new traditionalfamilies spent between 24 and 25 hours more per week in paid work than women innew traditional families in 1986, 1993 and 2005. Overall, these figures indicate thatthe differences in the paid work hours for men and women in both family types haveremained fairly constant over the past two decades. The gender gap in paid workhours for men and women in co-breadwinner families increased marginally from 4.3to 4.8 hours per week between 1986 and 2005. Between 1986 and 2005, the gendergap in paid work hours for men and women in new traditional families decreasedmarginally from 24.3 hours per week to 23.8 hours per week. These results suggestthat changes in the gender gap in combined work hours are largely due to changes intime spent on housework rather than paid work.
Table 3 - Mean Paid Work Hours of Men and Women by Family Type and T-tests of Gender Differences in 1986, 1993 and 2005
1986 1993 2005
Gender Gender GenderFamily Type Men Women Gap Men Women Gap Men Women Gap
Co-Breadwinner 47.43 43.4 4.03*** 47.16 42.74 4.41*** 49.56 44.74 4.82***n 122 185 161 190 111 127
New-Traditional 46.88 22.61 24.27*** 48.55 23.09 25.46*** 48.89 23.77 25.11***n 97 110 167 136 87 105
Total 47.19 35.65 11.54*** 47.87 34.54 13.32*** 49.26 35.25 14.01***n 219 295 328 326 198 232
* p<0.05 ** p<0.01 ***p<0.001
We now turn to our second research question and examine the level of genderspecialisation in dual-earner families. Fractional logit regression was conducted tocalculate the mean proportion of combined work hours devoted to housework andpaid work for men and women in each year. Initially we included three way interactionterms for time, sex and family type and then progressively simplified the model byomitting the insignificant interaction terms. The three way interaction term for time,sex and family type and the two way interaction term for time and family type were

101JENNY CHESTERS, JANEEN BAXTER AND MARK WESTERN
Paid and Unpaid Work in Australian Households: Trends in the Gender Division of Labour, 1986-2005
omitted. Therefore the final model includes two way interaction terms for family typewith sex and time with sex.
The predicted probabilities from the final model were then graphed and arepresented in figure 1. The average proportion of combined work hours that women innew traditional families devoted to housework declined from 0.60 in 1986 to 0.57 in2005 while the average proportion of combined work hours that women in co-breadwinner families devoted to housework declined from 0.38 in 1986 to 0.33 in2005. On the other hand, the average proportion of time that men in co-breadwinnerfamilies devoted to housework increased from 0.23 in 1986 to 0.26 in 2005 and theaverage proportion that men in new traditional families devoted to housework increasedfrom 0.20 to 0.24 over the same period.
Figure 1 - Average Proportion of Combined Work Devoted to Housework forMen and Women in Co-breadwinner and New Traditional Families
In sum, the gap between the proportion of combined work hours that mendevoted to housework and the proportion of combined work hours that women devotedto housework narrowed in both co-breadwinner and new traditional families suggestinga decline in gender specialisation. Interestingly, men in both family types allocated asimilar proportion of their combined work hours to housework indicating that theemployment status of their partners had virtually no effect on their allocation of timeto paid work and housework. In other words, regardless of whether their partner workedfull-time or part-time, men in dual-earner families devoted a similar proportion oftheir combined work hours to housework.
This apparent decline in specialisation could be the result of men reallocatingtime from paid work to housework, or women reallocating time from housework topaid work or a combination of both. However, the results presented in table 3 indicatethat paid work hours for both men and women remained fairly constant between 1986and 2005. Therefore, the increase in the housework proportion of combined work
102AUSTRALIAN JOURNAL OF LABOUR ECONOMICSVOLUME 12 • NUMBER 1 • 2009
hours for men is largely a consequence of an increase in men’s housework hours whilethe decrease in the housework proportion of combined work hours for women is largelya consequence of less housework rather than more paid work.
The final stage of the analysis compares the level of gender specialisation ofmen and women in dual-earner families with and without dependent children. Again,we conduct, fractional logit regression to calculate the mean proportion of combinedwork hours devoted to housework and paid work for men and women in each year.Initially we included three way interaction terms for time, sex and presence of dependentchildren and then progressively simplified the model by omitting the insignificantinteraction terms. The three way interaction term for time, sex and presence ofdependent children and the two way interaction term for time and presence of dependentchildren were omitted. Therefore, the final model includes two way interaction termsfor presence of dependent children with sex and time with sex.
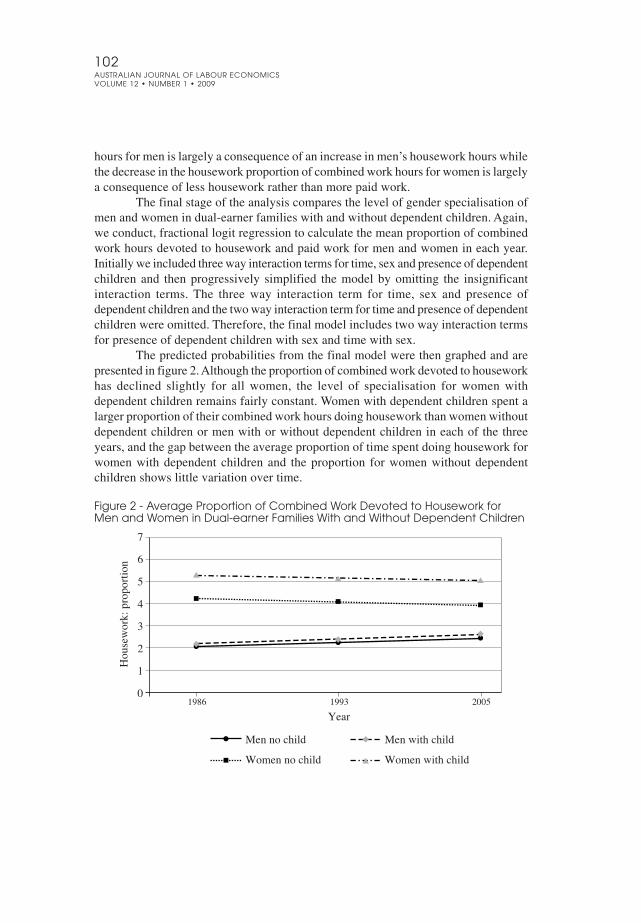
The predicted probabilities from the final model were then graphed and arepresented in figure 2. Although the proportion of combined work devoted to houseworkhas declined slightly for all women, the level of specialisation for women withdependent children remains fairly constant. Women with dependent children spent alarger proportion of their combined work hours doing housework than women withoutdependent children or men with or without dependent children in each of the threeyears, and the gap between the average proportion of time spent doing housework forwomen with dependent children and the proportion for women without dependentchildren shows little variation over time.
Figure 2 - Average Proportion of Combined Work Devoted to Housework forMen and Women in Dual-earner Families With and Without Dependent Children
103JENNY CHESTERS, JANEEN BAXTER AND MARK WESTERN
Paid and Unpaid Work in Australian Households: Trends in the Gender Division of Labour, 1986-2005
In 1986, women with dependent children devoted 0.52 of their combined workhours to housework, whereas women without dependent children devoted 0.41 of theircombined work hours to housework. In 2005, the average proportion of combinedhours that women with dependent children devoted to housework was 0.50 while forwomen without dependent children it was 0.40. This indicates little change over timein the proportion of time allocated to housework for women with and without dependentchildren but confirms that the presence of dependent children is associated with greatertime spent on housework by women.
In 1986, men with dependent children devoted 0.21 of their combined workhours to housework compared to 0.20 for men without dependent children. In 2005,men with dependent children devoted 0.27 of their combined work hours to houseworkcompared to 0.26 for men without dependent children. This indicates that in 2005,men spent a greater proportion of their combined work hours doing houseworkcompared to men in 1986. However, men in each year devoted a considerably smallerproportion of their combined work hours to housework than women. Overall, theseresults provide further evidence of continuing gender specialisation, albeit with somesmall declines, with men spending a smaller proportion of their combined work hoursdoing housework than women.
7. ConclusionThis paper examined the combined workloads of men and women in dual-earner couplefamilies to determine whether there was any evidence that their workloads had becomemore similar over time. The results presented here show that although women in co-breadwinner families had significantly higher workloads than men in co-breadwinnerfamilies in 1986, this is no longer the case. There is no statistically significant differencebetween the combined work hours of men and women in co-breadwinner families in2005. Headey et al. (2006, p. 36) report a similar finding from their analysis of thethird wave of the HILDA survey. In new traditional families, there is no statisticallysignificant difference between the combined work hours of women and men in 1986.In 2005, however, the combined work hours of the average woman in this family typewas around 10 hours per week less than their male counterparts. This suggests thatwomen in new traditional families may have lower workloads than men in newtraditional families, but recall that we have not included time spent on childcare in ouranalyses of combined work hours. We know that most women enter part-timeemployment in order to accommodate the demands of young children and familiesand research has shown that women may be reallocating time away from houseworkto childcare activities. Bittman (2004, p. 160) found that between 1974 and 1997 therewas a significant increase (from 21 to 30 hours per week) in the amount of time parentsspent with their preschool children and Craig (2006, p. 132) estimated that, in 1997,mothers spent three and half times as many hours doing childcare activities as fathers.This suggests that women in new-traditional families may be allocating an increasingnumber of hours to childcare.
We were also interested in whether there had been any decline over time inthe level of gender specialisation, that is, the allocation between paid work andhousework along traditional gender lines and whether the presence of dependent
104AUSTRALIAN JOURNAL OF LABOUR ECONOMICSVOLUME 12 • NUMBER 1 • 2009
children continued to increase the level of gender specialisation within dual-earnerfamilies. Figure 1 illustrates the convergence in the proportion of combined workhours devoted to housework by men and women in dual-earner families. Overall, menin dual-earner families are spending more, and women in dual-earner families arespending less, of their combined work hours doing housework, suggesting thatspecialisation is declining. This is a welcome development. But this trend is muchweaker for families with dependent children. As figure 2 shows, the decline in genderspecialisation here is much smaller. Overall women with dependent children devotethe greatest proportion of time to housework and this proportion shows no changeover time. This finding that women decrease their time in paid work and increase theirtime in housework when they have dependent children supports the findings of otherresearchers (Baxter et al., 2008; Drago et al., 2004; Craig, 2005; and Shelton, 1992).For example, Shelton (1992, p. 55) found that men in couple families increased theirpaid work time by one and a half hours per dependent child per week and womendecreased their paid work time by just over one hour per week for each extra dependentchild. Drago, Tseng and Wooden (2004, p. 10) found that the presence of dependentchildren increased the paid work hours of fathers by one and a half hours per weekcompared to all employed men and decreased the paid work hours of mothers by threehours per week compared to all employed women. Parenthood, it would seem, is ‘areal watershed transition’, encouraging new traditional rather than co-breadwinnerarrangements, whereby men work long hours in paid employment and women take onpart-time paid employment (Moen and Sweet, 2003, p. 26).
The finding that men with dependent children increased the houseworkproportion of their combined workload is in line with Sayer’s (2005, p. 291) findingsthat the presence of young children increased fathers’ as well as mothers’ unpaidworkloads in 1998. On the other hand, the results of Australian research conductedusing data collected in the 1980s and 1990s show that dependent children increasedthe housework hours of mothers but not fathers. For example, Craig (2005) found thatthe housework hours of partnered women increased by one hour per day whendependent children were present in the household, however, there was no correspondingchange in the housework hours of partnered men. The results of research conductedby Baxter, Hewitt and Haynes (2008, p. 268) showed that although women’s houseworkhours increased with the birth of each child, men’s housework hours were unaffectedby the birth of their first child and actually showed signs of decreasing with the birthof additional children.
The lack of difference in the proportion of combined work hours devoted tohousework over a twenty year period indicates that gender specialisation linked toparenthood has not been affected by the overall trend for men and women in couplefamilies to develop more egalitarian workloads. The results presented here mirrorthose of other researchers who have also found that although the housework hours ofmen and women in couple families have become more similar as their paid workhours have become more similar, parenthood slows this trend. We conclude thatparenthood is a constraint on equality in divisions of labour within Australianhouseholds.
105JENNY CHESTERS, JANEEN BAXTER AND MARK WESTERN
Paid and Unpaid Work in Australian Households: Trends in the Gender Division of Labour, 1986-2005
ReferencesAustralian Bureau of Statistics (1976), Social Indicators (1) 1976 Cat. No. 4101.0.
Available at www.abs.gov.auAustralian Bureau of Statistics (1996), Australian Social Trends 1996 Cat. No. 4102.0.
Available at www.abs.gov.auAustralian Bureau of Statistics (1998), How Australian Use Their Time, 1997 Cat No.
4153.0. Available at www.abs.gov.auAustralian Bureau of Statistics (2003), Family Characteristics June 2003 Cat No.
4442.0. Available at www.abs.gov.auAustralian Bureau of Statistics (2006), Australian Social Trends 2006 Cat No. 4102.0.
Available at www.abs.gov.auAustralian Bureau of Statistics (2008a), Australian Social Trends 2008 Cat No. 4102.0.
Available at www.abs.gov.auAustralian Bureau of Statistics (2008b), How Australian Use Their Time, 2006 Cat
No. 4153.0. Available at www.abs.gov.auBaxter, J. (1993), Work at Home: The Domestic Division of Labour, St Lucia, University
of Queensland Press.Baxter, J. (2002), ‘Patterns of Change and Stability in the Gender Division of Household
Labour in Australia, 1986-1997’, Journal of Sociology, 38, 399-424.Baxter, J., Hewitt, B. and Haynes, M. (2008), ‘Lifecourse Transitions and Housework:
Marriage, Parenthood and Time on Housework’, Journal of Marriage andFamily, 70, 259-272.
Baxter, J. Hewitt, B. and Western, M. (2005), ‘Post-Familial Families and the DomesticDivision of Labour’, Journal of Comparative Family Studies, 36, 583-600.
Bianchi, S.M., Milkie, M.A., Sayer, L.C. and Robinson, J.P. (2000), ‘Is Anyone Doingthe Housework? Trends in the Gender Division of Household Labor’, SocialForces, 79, 191-228.
Bianchi, S.M., Robinson, J.P. and Milkie, M.A. (2006), Changing Rhythms of AmericanFamily Life, Russell Sage Foundation, New York.
Bittman, M. (2004), ‘Parenting and Employment: What time use surveys show’, inFolbre, N. and Bittman, M. (eds), Family Time: The Social Organization ofCare, Routledge, London.
Bittman, M., England, P., Sayer, L., Folbre, N. and Matheson, G. (2003), ‘When DoesGender Trump Money? Bargaining and Time in Household Work’, AmericanJournal of Sociology, 109, 186-214.
Bittman, M. and Wajcman, J. (2004), ‘The Rush Hours: The Quality of Leisure Timeand Gender Equity’, in Folbre, N. and Bittman, M. (eds), Family Time: TheSocial Organization of Care, Routledge, London.
Blood, R.O. Jr. and Wolfe, D.M. (1960), Husbands & Wives: The Dynamics of MarriedLiving, New York, The Free Press.
Brines, J. (1994), ‘Economic Dependency, Gender and the Division of Labor at Home’,The American Journal of Sociology, 100, 652-688.
Brynin, M. and Ermisch, J. (2009), ‘Introduction: The Social Significance ofRelationships’, in M. Brynin and J. Ermisch (eds.), Changing Relationships,Routledge, New York.

106AUSTRALIAN JOURNAL OF LABOUR ECONOMICSVOLUME 12 • NUMBER 1 • 2009
Chalmers, J., Campbell I. and Charlesworth, S. (2005), ‘Part-time Work and CaringResponsibilities in Australia: Towards and Assessment of Job Quality’, Labour& Industry 15, 41-66.
Coltrane, S. and Ishii-Kuntz, M. (1992), ‘Men’s Housework: A Life CoursePerspective’, Journal of Marriage and the Family, 54, 43-57.
Craig, L. (2005), ‘The Money or the Care: A Comparison of Couple and Sole ParentHouseholds’ Time Allocation to Work and Children’, Australian Journal ofSocial Issues, 40, 521-540.
Craig, L. (2007), Contemporary Motherhood. The Impact of Children on Adult Time.Aldershot: Ashgate.
Craig, L. (2006), ‘Children and the Revolution: A Time-diary Analysis of the Impactof Motherhood on Daily Workload’, Journal of Sociology, 42, 125-143.
Craig, L. and Bittman, M. (2008), ‘The Incremental Time Costs of Children: AnAnalysis of Children’s Impact on Adult Time Use in Australia’, FeministEconomics, 14, 59-88.
Davis, S.N. and Greenstein, T.N. (2004), ‘Cross-National Variations in the Division ofHousehold Labor’, Journal of Marriage and Family, 66, 1260-1271.
de Vaus, David (2004), Diversity and Change in Australian Families: StatisticalProfiles, Australian Institute of Family Studies, Canberra.
Drago, R., Black, D. and Wooden, M. (2005), ‘Female Breadwinner Families: TheirExistence, Persistence and Sources’, Journal of Sociology, 41, 343-362.
Drago, R., Tseng, Y. and Wooden, M. (2004), Family Structure, Usual and PreferredWorking Hours, and Egalitarianism in Australia, Melbourne Institute WorkingPaper No. 1/04. Available at www.melbourneinstitute.com
Ferree, M.M. (1991), ‘The Gender Division in Two Earner Marriages: Dimensions ofVariability and Change’, Journal of Family Issues, 12, 158-180.
Gershuny, J., Bittman, M. and Brice, J. (2005), ‘Exit, Voice and Suffering: Do CouplesAdapt to Changing Employment Patterns?’, Journal of Marriage and Family,67, 656-665.
Gershuny, J., Godwin, M. and Jones, S. (1994), ‘The Domestic Labour Revolution: AProcess of Lagged Adaptation?’ in Anderson, M., Bechofer, F. and Gershuny,J. (eds), The Social and Political Economy of the Household, Oxford UniversityPress, Oxford.
Greenstein, T.N. (2000), ‘Economic Dependence, Gender, and the Division of Labourin the Home: A Replication and Extension’, Journal of Marriage and the Family,62, 322-335.
Headey, B. Warren, D. and Harding, G. (2006), Families, Incomes and Jobs: AStatistical Report of the HILDA Survey, Melbourne Institute of AppliedEconomic and Social Research. Available at: www.melbourneinstitute.com
Jacobs, J.A. and Gerson, K. (2001), ‘Overworked Individuals or Overworked Families’,Work and Occupations, 28, 40-63.
Moen, P. and Sweet, S. (2003), ‘Time Clocks: Couples’ Work Hour Strategies’ in P.Moen (ed.), It’s About Time: Career Strains, Strategies and Successes, Ithaca,NY, Connell University Press.
Papke, L.E. and Wooldridge, J.M. (1996), ‘Econometric Methods for the FractionalResponse Variables with an Application to 401(k) Plan Participation Rates’,Journal of Applied Econometrics, 11, 619-632.

107JENNY CHESTERS, JANEEN BAXTER AND MARK WESTERN
Paid and Unpaid Work in Australian Households: Trends in the Gender Division of Labour, 1986-2005
Pocock, B. (2003), The Work/Life Collision, Annandale, Federation Press.Sayer, L. (2005), ‘Gender, Time and Inequality: Trends in Women’s and Men’sPaid Work, Unpaid Work and Free Time’, Social Forces, 84, 285-303.
Shelton, B.A. (1992), Women, Men and Time: Gender Differences in Paid Work,Housework and Leisure, Westport, Greenwood Press.
Sullivan, O. (2006), Changing Gender Relations, Changing Families: Tracing thePace of Change Over Time, Lanham, Rowman & Littlefield Publishers Inc.
Western, J.S., Emmison, J.M., Baxter, J. and Chant, D.C. (1993), Social Structure ofAustralia Project, 1993. Data file held by Dept Anthropology and Sociology,University of Queensland, St Lucia.
Western, J.S., Boreham, P.R., Clegg, S., Emmison, J.M. and Marks, G.N. (2005), SocialStructure of Australia Project, 1986. Australian Social Science Data Archive-UQ. Identification Number: au.edu.anu.assda.ddi.30001. Available at http://assda-nesstar.anu.edu.au/webview/index.jsp
Western, M., Baxter, J. Pakulski, J., Tranter, B., Western, J. and van Egmond, M.(2005), Neoliberalism, Inequality and Politics National Survey. Data file. TheUniversity of Queensland Social Research Centre, St Lucia.
Western, M., Baxter, J. Pakulski, J., Tranter, B., Western, J., van Egmond, M., Chesters,J., Hosking, A., O’Flaherty, M., and van Gellecum, Y. (2007), ‘Neoliberalism,Inequality and Politics: The Changing Face of Australia’, Australian Journalof Social Issues, 42, 401-408.
Wooldridge, J. M. (2002), Econometric Analysis of Cross Section and Panel Data.Cambridge, Mass., MIT Press.