paint inspired color mixing and compositing for...
TRANSCRIPT
Paint Inspired Color Mixing and Compositing for Visualization
Nathan Gossett∗
University of Minnesota at Twin Cities
Baoquan Chen†
University of Minnesota at Twin Cities
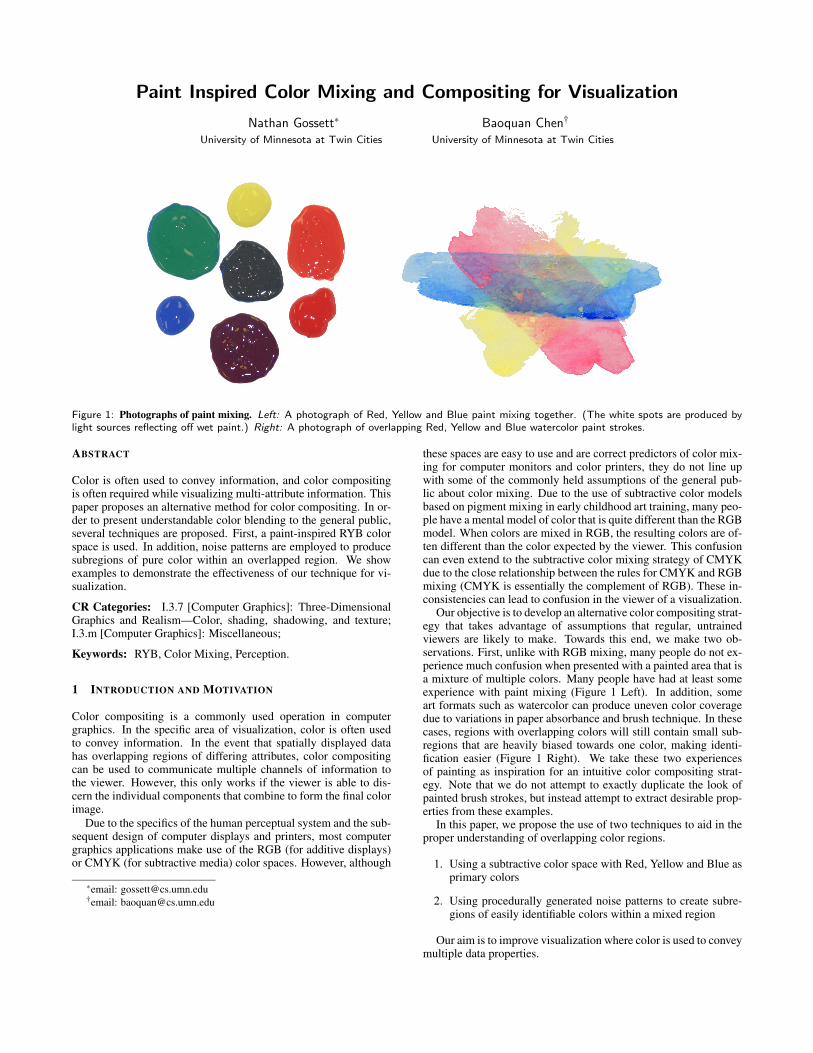
Figure 1: Photographs of paint mixing. Left: A photograph of Red, Yellow and Blue paint mixing together. (The white spots are produced bylight sources reflecting off wet paint.) Right: A photograph of overlapping Red, Yellow and Blue watercolor paint strokes.
ABSTRACT
Color is often used to convey information, and color compositingis often required while visualizing multi-attribute information. Thispaper proposes an alternative method for color compositing. In or-der to present understandable color blending to the general public,several techniques are proposed. First, a paint-inspired RYB colorspace is used. In addition, noise patterns are employed to producesubregions of pure color within an overlapped region. We showexamples to demonstrate the effectiveness of our technique for vi-sualization.
CR Categories: I.3.7 [Computer Graphics]: Three-DimensionalGraphics and Realism—Color, shading, shadowing, and texture;I.3.m [Computer Graphics]: Miscellaneous;
Keywords: RYB, Color Mixing, Perception.
1 INTRODUCTION AND MOTIVATION
Color compositing is a commonly used operation in computergraphics. In the specific area of visualization, color is often usedto convey information. In the event that spatially displayed datahas overlapping regions of differing attributes, color compositingcan be used to communicate multiple channels of information tothe viewer. However, this only works if the viewer is able to dis-cern the individual components that combine to form the final colorimage.
Due to the specifics of the human perceptual system and the sub-sequent design of computer displays and printers, most computergraphics applications make use of the RGB (for additive displays)or CMYK (for subtractive media) color spaces. However, although
∗email: [email protected]†email: [email protected]
these spaces are easy to use and are correct predictors of color mix-ing for computer monitors and color printers, they do not line upwith some of the commonly held assumptions of the general pub-lic about color mixing. Due to the use of subtractive color modelsbased on pigment mixing in early childhood art training, many peo-ple have a mental model of color that is quite different than the RGBmodel. When colors are mixed in RGB, the resulting colors are of-ten different than the color expected by the viewer. This confusioncan even extend to the subtractive color mixing strategy of CMYKdue to the close relationship between the rules for CMYK and RGBmixing (CMYK is essentially the complement of RGB). These in-consistencies can lead to confusion in the viewer of a visualization.
Our objective is to develop an alternative color compositing strat-egy that takes advantage of assumptions that regular, untrainedviewers are likely to make. Towards this end, we make two ob-servations. First, unlike with RGB mixing, many people do not ex-perience much confusion when presented with a painted area that isa mixture of multiple colors. Many people have had at least someexperience with paint mixing (Figure 1 Left). In addition, someart formats such as watercolor can produce uneven color coveragedue to variations in paper absorbance and brush technique. In thesecases, regions with overlapping colors will still contain small sub-regions that are heavily biased towards one color, making identi-fication easier (Figure 1 Right). We take these two experiencesof painting as inspiration for an intuitive color compositing strat-egy. Note that we do not attempt to exactly duplicate the look ofpainted brush strokes, but instead attempt to extract desirable prop-erties from these examples.
In this paper, we propose the use of two techniques to aid in theproper understanding of overlapping color regions.
1. Using a subtractive color space with Red, Yellow and Blue asprimary colors
2. Using procedurally generated noise patterns to create subre-gions of easily identifiable colors within a mixed region
Our aim is to improve visualization where color is used to conveymultiple data properties.
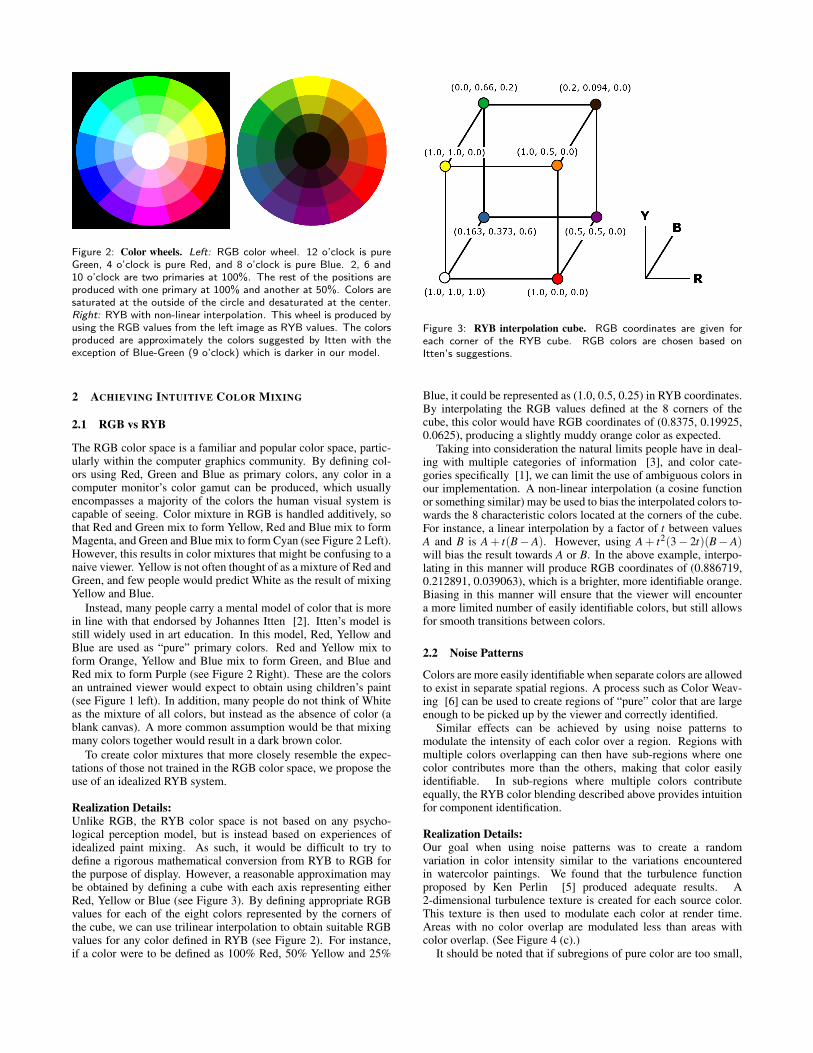
Figure 2: Color wheels. Left: RGB color wheel. 12 o’clock is pureGreen, 4 o’clock is pure Red, and 8 o’clock is pure Blue. 2, 6 and10 o’clock are two primaries at 100%. The rest of the positions areproduced with one primary at 100% and another at 50%. Colors aresaturated at the outside of the circle and desaturated at the center.Right: RYB with non-linear interpolation. This wheel is produced byusing the RGB values from the left image as RYB values. The colorsproduced are approximately the colors suggested by Itten with theexception of Blue-Green (9 o’clock) which is darker in our model.
2 ACHIEVING INTUITIVE COLOR MIXING
2.1 RGB vs RYB
The RGB color space is a familiar and popular color space, partic-ularly within the computer graphics community. By defining col-ors using Red, Green and Blue as primary colors, any color in acomputer monitor’s color gamut can be produced, which usuallyencompasses a majority of the colors the human visual system iscapable of seeing. Color mixture in RGB is handled additively, sothat Red and Green mix to form Yellow, Red and Blue mix to formMagenta, and Green and Blue mix to form Cyan (see Figure 2 Left).However, this results in color mixtures that might be confusing to anaive viewer. Yellow is not often thought of as a mixture of Red andGreen, and few people would predict White as the result of mixingYellow and Blue.
Instead, many people carry a mental model of color that is morein line with that endorsed by Johannes Itten [2]. Itten’s model isstill widely used in art education. In this model, Red, Yellow andBlue are used as “pure” primary colors. Red and Yellow mix toform Orange, Yellow and Blue mix to form Green, and Blue andRed mix to form Purple (see Figure 2 Right). These are the colorsan untrained viewer would expect to obtain using children’s paint(see Figure 1 left). In addition, many people do not think of Whiteas the mixture of all colors, but instead as the absence of color (ablank canvas). A more common assumption would be that mixingmany colors together would result in a dark brown color.
To create color mixtures that more closely resemble the expec-tations of those not trained in the RGB color space, we propose theuse of an idealized RYB system.
Realization Details:Unlike RGB, the RYB color space is not based on any psycho-logical perception model, but is instead based on experiences ofidealized paint mixing. As such, it would be difficult to try todefine a rigorous mathematical conversion from RYB to RGB forthe purpose of display. However, a reasonable approximation maybe obtained by defining a cube with each axis representing eitherRed, Yellow or Blue (see Figure 3). By defining appropriate RGBvalues for each of the eight colors represented by the corners ofthe cube, we can use trilinear interpolation to obtain suitable RGBvalues for any color defined in RYB (see Figure 2). For instance,if a color were to be defined as 100% Red, 50% Yellow and 25%
Figure 3: RYB interpolation cube. RGB coordinates are given foreach corner of the RYB cube. RGB colors are chosen based onItten’s suggestions.
Blue, it could be represented as (1.0, 0.5, 0.25) in RYB coordinates.By interpolating the RGB values defined at the 8 corners of thecube, this color would have RGB coordinates of (0.8375, 0.19925,0.0625), producing a slightly muddy orange color as expected.
Taking into consideration the natural limits people have in deal-ing with multiple categories of information [3], and color cate-gories specifically [1], we can limit the use of ambiguous colors inour implementation. A non-linear interpolation (a cosine functionor something similar) may be used to bias the interpolated colors to-wards the 8 characteristic colors located at the corners of the cube.For instance, a linear interpolation by a factor of t between valuesA and B is A + t(B − A). However, using A + t2(3 − 2t)(B− A)will bias the result towards A or B. In the above example, interpo-lating in this manner will produce RGB coordinates of (0.886719,0.212891, 0.039063), which is a brighter, more identifiable orange.Biasing in this manner will ensure that the viewer will encountera more limited number of easily identifiable colors, but still allowsfor smooth transitions between colors.
2.2 Noise Patterns
Colors are more easily identifiable when separate colors are allowedto exist in separate spatial regions. A process such as Color Weav-ing [6] can be used to create regions of “pure” color that are largeenough to be picked up by the viewer and correctly identified.
Similar effects can be achieved by using noise patterns tomodulate the intensity of each color over a region. Regions withmultiple colors overlapping can then have sub-regions where onecolor contributes more than the others, making that color easilyidentifiable. In sub-regions where multiple colors contributeequally, the RYB color blending described above provides intuitionfor component identification.
Realization Details:Our goal when using noise patterns was to create a randomvariation in color intensity similar to the variations encounteredin watercolor paintings. We found that the turbulence functionproposed by Ken Perlin [5] produced adequate results. A2-dimensional turbulence texture is created for each source color.This texture is then used to modulate each color at render time.Areas with no color overlap are modulated less than areas withcolor overlap. (See Figure 4 (c).)
It should be noted that if subregions of pure color are too small,
the viewer will perceive additive mixture of the colors [4]. Ef-fort must be made to ensure that subregions of pure color are largeenough that additive mixing does not occur.
One potential problem with using low or moderate frequency tur-bulence functions is that regions of pure color can be relatively largeand coherent, giving the false impression that the subregion is notpart of an overlapping region. To avoid this, a higher frequency pat-tern can be used. Figure 5 shows a comparison of these two optionsin the middle and bottom images.
2.3 Edge Emphasis
Using a simple edge detector, the boundary of each color regioncan be identified. By saturating the color along this edge, identifi-cation of each color region is made easier. If clean edges are toodistracting, the intensity can be blended towards the interior of thecolor region in a randomized manner. Figure 4 (c) demonstratesthis effect.
Realization Details:We render each source color separately and produce a gradientestimation using a Sobel edge detection filter. A map is thenproduced by starting at each non-zero gradient position andproceeding in the gradient direction a random distance. Pointslocated further away from the detected edge are given smallerweights in the edge map. This map is then used to intensify eachcolor in the final composite image.
3 RESULTS AND DISCUSSION
We first demonstrate our color mixing technique with a simple ex-ample in Figure 4 a-c. When using traditional RGB compositing,certain combinations, such as mixing green and red to obtain yel-low, may be unintuitive to naive viewers. Simply switching to RYBcompositing creates mixtures that are much more intuitive. With theaddition of noise patterns and edge emphasis, viewers can clearlyidentify the source colors that are mixed in any particular region.For instance, in the region where Blue and Yellow overlap, somesubregions are clearly Blue, some are clearly Yellow, and someare Green (an intuitive mixing of Blue and Yellow). Even in areaswhere more than two colors overlap, the individual source colorscan be identified.
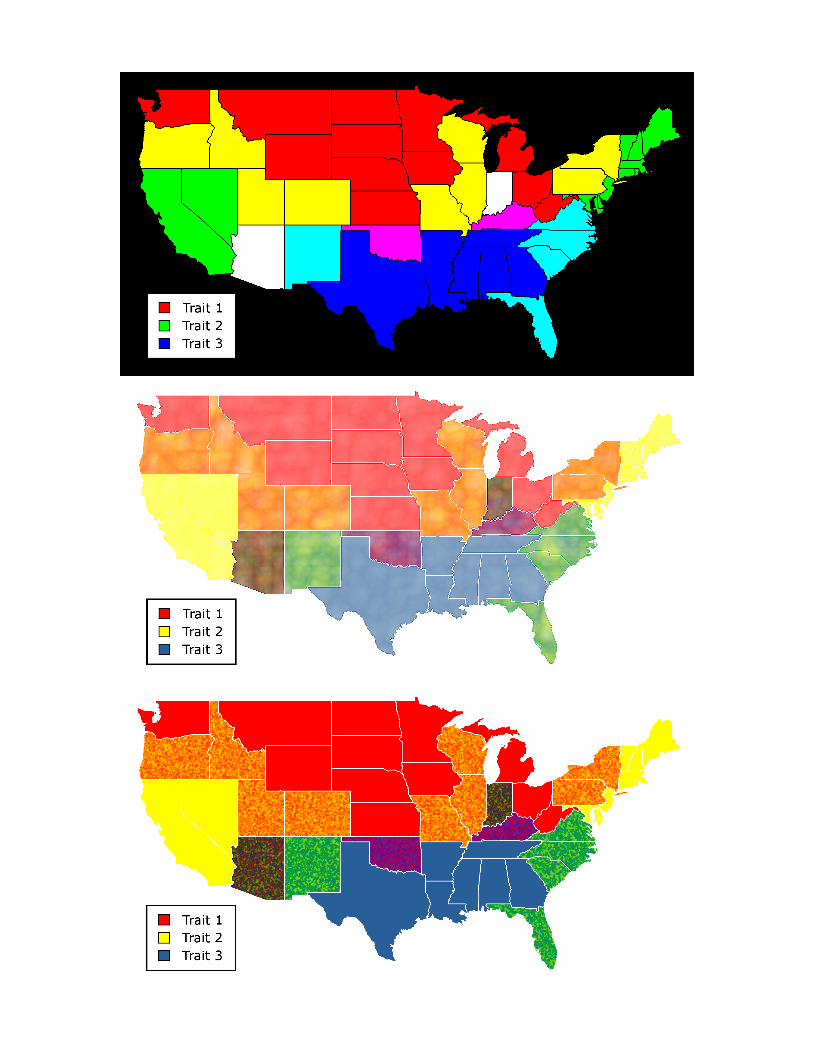
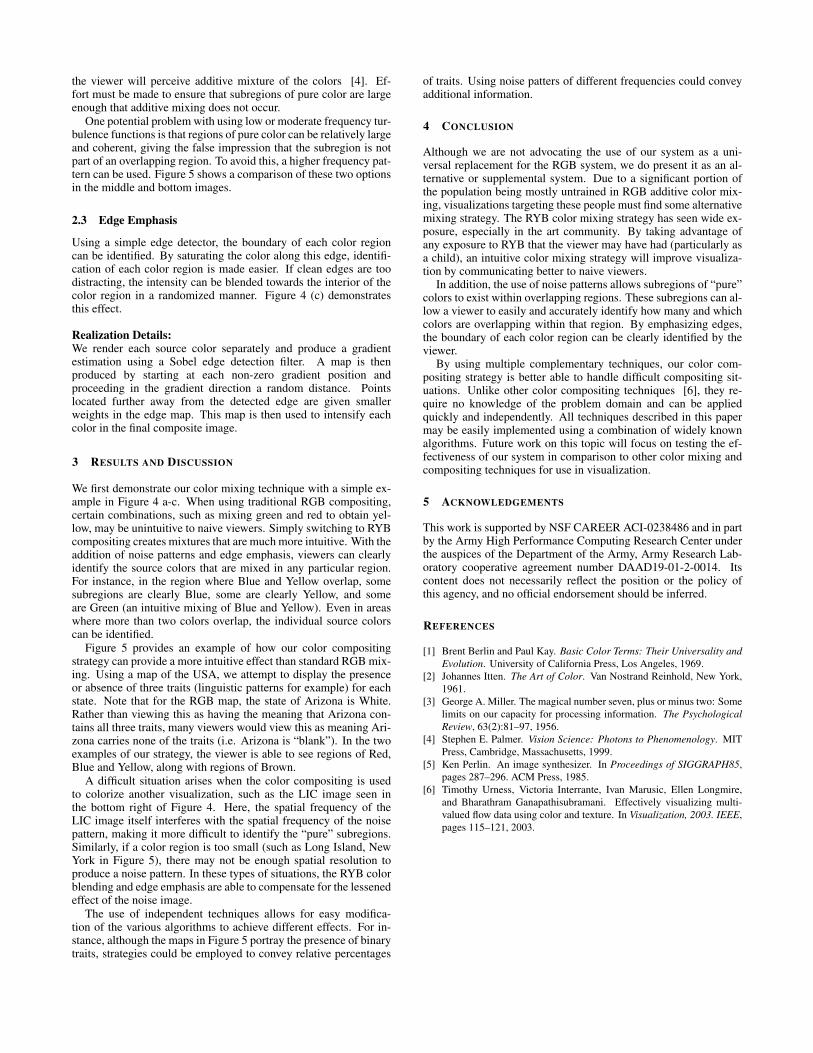
Figure 5 provides an example of how our color compositingstrategy can provide a more intuitive effect than standard RGB mix-ing. Using a map of the USA, we attempt to display the presenceor absence of three traits (linguistic patterns for example) for eachstate. Note that for the RGB map, the state of Arizona is White.Rather than viewing this as having the meaning that Arizona con-tains all three traits, many viewers would view this as meaning Ari-zona carries none of the traits (i.e. Arizona is “blank”). In the twoexamples of our strategy, the viewer is able to see regions of Red,Blue and Yellow, along with regions of Brown.
A difficult situation arises when the color compositing is usedto colorize another visualization, such as the LIC image seen inthe bottom right of Figure 4. Here, the spatial frequency of theLIC image itself interferes with the spatial frequency of the noisepattern, making it more difficult to identify the “pure” subregions.Similarly, if a color region is too small (such as Long Island, NewYork in Figure 5), there may not be enough spatial resolution toproduce a noise pattern. In these types of situations, the RYB colorblending and edge emphasis are able to compensate for the lessenedeffect of the noise image.
The use of independent techniques allows for easy modifica-tion of the various algorithms to achieve different effects. For in-stance, although the maps in Figure 5 portray the presence of binarytraits, strategies could be employed to convey relative percentages
of traits. Using noise patters of different frequencies could conveyadditional information.
4 CONCLUSION
Although we are not advocating the use of our system as a uni-versal replacement for the RGB system, we do present it as an al-ternative or supplemental system. Due to a significant portion ofthe population being mostly untrained in RGB additive color mix-ing, visualizations targeting these people must find some alternativemixing strategy. The RYB color mixing strategy has seen wide ex-posure, especially in the art community. By taking advantage ofany exposure to RYB that the viewer may have had (particularly asa child), an intuitive color mixing strategy will improve visualiza-tion by communicating better to naive viewers.
In addition, the use of noise patterns allows subregions of “pure”colors to exist within overlapping regions. These subregions can al-low a viewer to easily and accurately identify how many and whichcolors are overlapping within that region. By emphasizing edges,the boundary of each color region can be clearly identified by theviewer.
By using multiple complementary techniques, our color com-positing strategy is better able to handle difficult compositing sit-uations. Unlike other color compositing techniques [6], they re-quire no knowledge of the problem domain and can be appliedquickly and independently. All techniques described in this papermay be easily implemented using a combination of widely knownalgorithms. Future work on this topic will focus on testing the ef-fectiveness of our system in comparison to other color mixing andcompositing techniques for use in visualization.
5 ACKNOWLEDGEMENTS
This work is supported by NSF CAREER ACI-0238486 and in partby the Army High Performance Computing Research Center underthe auspices of the Department of the Army, Army Research Lab-oratory cooperative agreement number DAAD19-01-2-0014. Itscontent does not necessarily reflect the position or the policy ofthis agency, and no official endorsement should be inferred.
REFERENCES
[1] Brent Berlin and Paul Kay. Basic Color Terms: Their Universality and
Evolution. University of California Press, Los Angeles, 1969.
[2] Johannes Itten. The Art of Color. Van Nostrand Reinhold, New York,
1961.
[3] George A. Miller. The magical number seven, plus or minus two: Some
limits on our capacity for processing information. The Psychological
Review, 63(2):81–97, 1956.
[4] Stephen E. Palmer. Vision Science: Photons to Phenomenology. MIT
Press, Cambridge, Massachusetts, 1999.
[5] Ken Perlin. An image synthesizer. In Proceedings of SIGGRAPH85,
pages 287–296. ACM Press, 1985.
[6] Timothy Urness, Victoria Interrante, Ivan Marusic, Ellen Longmire,
and Bharathram Ganapathisubramani. Effectively visualizing multi-
valued flow data using color and texture. In Visualization, 2003. IEEE,
pages 115–121, 2003.
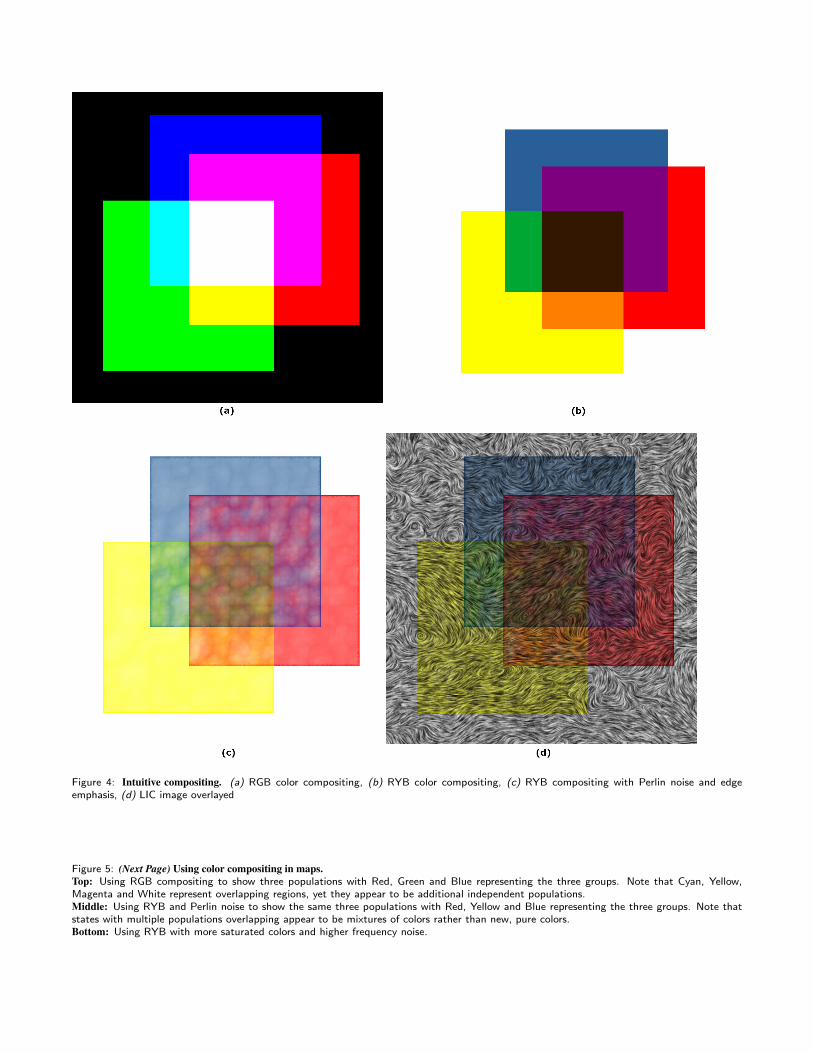
Figure 4: Intuitive compositing. (a) RGB color compositing, (b) RYB color compositing, (c) RYB compositing with Perlin noise and edgeemphasis, (d) LIC image overlayed
Figure 5: (Next Page) Using color compositing in maps.
Top: Using RGB compositing to show three populations with Red, Green and Blue representing the three groups. Note that Cyan, Yellow,Magenta and White represent overlapping regions, yet they appear to be additional independent populations.Middle: Using RYB and Perlin noise to show the same three populations with Red, Yellow and Blue representing the three groups. Note thatstates with multiple populations overlapping appear to be mixtures of colors rather than new, pure colors.Bottom: Using RYB with more saturated colors and higher frequency noise.