palaeogeography, palaeoclimatology, palaeoecologystudhope/recent_publications... · 2012-01-21 ·...
TRANSCRIPT

Palaeogeography, Palaeoclimatology, Palaeoecology 313-314 (2012) 70–77
Contents lists available at SciVerse ScienceDirect
Palaeogeography, Palaeoclimatology, Palaeoecology
j ourna l homepage: www.e lsev ie r .com/ locate /pa laeo
The skeletal geochemistry of the sclerosponge Astrosclera willeyana: Implications forbiomineralisation processes and palaeoenvironmental reconstruction
Nicola Allison a,⁎, Alexander W. Tudhope b, EIMF c
a Department of Earth Sciences, University of St Andrews, Irvine Building, North Street, St Andrews, Fife KY16 9AL, UKb School of Geosciences, University of Edinburgh, Edinburgh EH9 3JW, UKc NERC Ion Microprobe Facility, Grant Institute, University of Edinburgh, Edinburgh EH9 3JW, UK
⁎ Corresponding author. Fax: +44 1334 463949.E-mail address: [email protected] (N. Allison).
0031-0182/$ – see front matter © 2011 Elsevier B.V. Alldoi:10.1016/j.palaeo.2011.10.009
a b s t r a c t
a r t i c l e i n f oArticle history:Received 25 March 2011Received in revised form 5 October 2011Accepted 19 October 2011Available online 26 October 2011
Keywords:SclerospongeSr/CaMg/CaSSTSIMSAstrosclera
To investigate the controls on the geochemistry of aragonitic sclerosponge skeletons, we used secondary ionmass spectrometry (SIMS) to analyse an Astrosclera willeyana specimen. The high spatial resolution of SIMS al-lows the independent analysis of the two key crystal structures in the skeleton i.e. the fused spherulites (formedintracellularly and fused together at the surface of the skeleton) and the epitaxial backfill (deposited extracellu-larly at the base of the sponge tissue). We analysed Sr/Ca, Mg/Ca and Ba/Ca across a short (~5 mm) transect offused spherulites which represented several years growth. We observe cyclical variations (with a length of 0.1to 0.6 mm in both Sr/Ca and Mg/Ca in some (but not all) sections of the transect. The observed ranges of Sr/Caand Mg/Ca over the presumed seasonal cycles are ~9.5 to 11.5 mmol mol−1 and 0.6 to 1.0 mmol mol−1 respec-tively. The annual seawater temperature range at the study site is ~4.3 °C, so the inferred temperature sensitivityof skeletal Sr/Ca and Mg/Ca is ~0.5 mmol mol−1 °C (or 5%°C−1) and ~0.1 mmol mol−1°C (or 13%°C−1) respec-tively. This is higher thanobserved inmost previous sclerosponge studies or anticipated from studies of syntheticaragonite. This indicates that the chemistry of the A. willeyana skeleton is affected by one or more additional in-fluences, besides temperature, which are currently unresolved. The pH of the precipitating fluid, estimated fromskeletal δ11B, is ~8.1–8.2 for both fused spherulites and epitaxial backfill. Epitaxial backfill contains significantlyhigher Sr/Ca, Mg/Ca and B/Ca and significantly lower Ba/Ca than the fused spherulites but Sr/Ca and Mg/Ca arepositively correlated by the same relationship in both skeletal features. This suggests that the geochemistry ofeach feature is predominantly controlled by a common process. This is unlikely to be Rayleigh fractionation,which is indicated by negative correlations between Sr and Mg in aragonite.
© 2011 Elsevier B.V. All rights reserved.
1. Introduction
The isotope and trace element chemistry ofmarine calcite and arago-nite skeletons is used frequently to infer past environmental conditions.Sclerosponges are long-lived and their skeletonsmay provide archives ofenvironmental conditions over periods of 100–1000 years. The Sr/Ca ofsynthetically precipitated aragonite is temperature dependent (e.g.Kinsman and Holland, 1969) and sclerosponge skeletal Sr/Ca may indi-cate seawater temperatures (e.g. Haase-Schramm et al., 2003). Seasonalvariations in skeletal Sr/Ca and seawater temperature correlate well(r2=0.67) in a specimen of the Caribbean sclerosponge, Ceratoporellanicholsoni, (Rosenheim et al., 2004) but less well (r=~0.5) in specimensof the Indo-Pacific species, Astrosclera willeyana (Fallon et al., 2005).
Accurate calibration of the relationship between skeletal Sr/Ca andseawater temperature is complicated by the growth habit of scleros-ponges. The sponge tissue occupies calicles in the outermost 0.5–1 mm
rights reserved.
of the skeleton in C. nicholsoni (Swart et al., 2002; Rosenheim et al.,2009) and ~5 mm in A. willeyana (Fallon et al., 2005). Skeletal depositionoccurs both at the skeleton surface and towards the base of the calicle.Annual linear extension rates are 0.1–0.4 mm yr−1 for C. nicholsoni(Böhm et al., 1996, 2002; Swart et al., 2002) and 0.2–1.8 mm yr−1 forA. willeyana (Worheide 1998; Moore et al., 2000; Fallon and Guilderson2005; Fallon et al., 2005; Grottoli et al., 2010). Consequently aragonitedeposited at the base of the tissue layer serves to thicken and infill struc-tureswhichmay have been deposited up to several years previously anddrilled or milled sampling horizons, cut parallel to the sponge surface,combinemixtures of materials of significantly different ages. In C. nichol-soni backfill is precipitated in the bottom quarter of the tissue layer andbackfilled skeleton may consist of ~20% older calicle wall material, orig-inally deposited at the skeleton surface, and ~80% younger backfill(Böhm et al., 1996). In contrast, in A. willeyana, skeletal density increasesgradually overmost of the depth of the tissue layer suggesting that back-filled skeleton represents material which has been deposited and thick-ened almost continuously (Fallon et al., 2005). Variations in the timingand relative placement of skeletal accretion may explain the differentsuccess of each species in recording seasonal seawater temperatures.

71N. Allison et al. / Palaeogeography, Palaeoclimatology, Palaeoecology 313-314 (2012) 70–77
The aragonite deposited at the skeleton surface consists of intra-cellularly formed spherulites which are fused by epitaxial growthwhile the aragonite deposited at the base of the tissue layer consistsof epitaxial backfill which precipitates extracellularly. In A. willeyanathe spherulites form within vacuoles inside mobile large vesiclecells in the ectosome, the upper tissue layer of the sponge(Worheide 1998). As the membrane of the large vesicle cell lyses(breaks down), the spherulite is released and subsequently envel-oped by one or more basopinacocyte cells which have invaded thesponge tissue. The basopinacocytes transport the spherulites to theskeleton where they are attached to the vertically growing skeletalpillars. These spherulites are then fused by epitaxial processes. Epi-taxial backfill is deposited at the base of the tissue layer as the spongetissue is slowly drawn upwards, vacating the skeletal pore spaces.Any variation in Sr/Ca partitioning between the fused spherulitesand the epitaxial backfill will complicate the Sr/Ca–seawater temper-ature relationship preserved in the skeleton.
To further investigate controls on the geochemistry of A. willeyanaskeletons, we used secondary ion mass spectrometry (SIMS) to analysea single skeleton at a high spatial resolution. We used a primary beamdiameter of 15–35 μm allowing us to characterise the geochemistry ofthe different skeletal features i.e. the fused spherulites and epitaxialbackfill. We analysed a transect, along the fused spherulites, perpendic-ular to the skeleton surface, to investigate if these features record anyseasonal environmental signal. We determined Sr/Ca, Mg/Ca, Ba/Caand B/Ca. All of these elementsmay have somepotential as palaeoenvir-onmental indicators in biogenic aragonites (Shen and Sanford, 1990,Beck et al., 1992, Mitsuguchi et al., 1996, Fallon et al. 1999). In addition,correlations between trace andminor elements have been used to infercontrols in biogenic carbonate chemistry e.g. inverse correlations be-tween Sr and Mg in deep sea corals may indicate Rayleigh fractionation(Gagnon et al., 2007) while trace element incorporation may be corre-lated with crystal growth rate in synthetic aragonites (e.g. Gabitov etal., 2008). We also made a preliminary suite of δ11B analyses on thisskeleton. The δ11B of experimentally precipitated calcite and culturedforaminifera reflects the pH of local seawater (Sanyal et al., 1996,2000) and the analysis of δ11B in fossil foraminifera has been used to es-timate past seawater pH (Sanyal et al., 1995).We estimate the likely pHof the fluids present during deposition of fused spherulites and epitaxialbackfill.
Fig. 1. Transmitted light micrograph of the sclerosponge section. The areas denoted by1, 2 and 3 indicate the regions analysed for the spherulite transect, the epitaxial backfilland the spherulites at the centre of the skeleton, respectively.
2. Methods and materials
2.1. Sample preparation
We analysed an A. willeyana sponge (our reference NOM-1) col-lected from Nomuka Ika (174º49’ W; 20º16′S), Tonga in November2004. The specimen was found at a water depth of 9.5 m on theroof of a cave, under an overhang, on a modern coral reef framework.The sponge was collected from ~3.5 m into the cave. This cave hadone large entrance (under the overhang) and several smaller conduits(from the back and sides of the cave) ensuring that is was wellflushed with local sea water. The SST at the study site has an annualmean of 25.8 °C with a range of 4.3 °C, from ~24 °C (in August) to~28 °C (in February/March) and we assume that this is reflective ofwater temperatures in the cave.
The sclerosponge was approximately hemi-spherical (with di-mensions 34×20 mm) and was living when collected. After collec-tion, the specimen was air-dried and returned to the UK foranalysis. The sponge was sectioned along the axis of maximum verti-cal growth. One half of the sponge skeleton was divided into two andone of the resulting quarters was embedded in epoxy resin, mountedonto a 2.5 cm diameter glass slide and ground to a thickness of~50 μm (Fig. 1) using silicon carbide papers and 0.3 μm polishing alu-mina lubricated with water.
2.2. SIMS
All analysesweremade using a Cameca ims-4f ionmicroprobe in theSchool of GeoSciences at the University of Edinburgh. The section wasgold coated and analysed with a 16O− beam, accelerated at 15 kV.Trace andminor element ratios were determined using 2 sets of instru-ment conditions. Instrument conditions, isotopes studied and typicalcount rates are summarised in Table 1. Annual cycles in trace/minor el-ement composition were not obvious in preliminary analyses madeusing trace element conditions 1. Consequently the instrument condi-tions were adjusted, resulting in a smaller primary beam diameterand a higher analytical spatial resolution (trace element conditions 2).We estimate no significant isobaric interference for any of the isotopesstudied (Allison 1996; Allison et al., 2007). Background counts were de-termined at mass 4.7 and were insignificant (b0.1 cps).
Trace element data were collected over two days and relative ionyields (RIY) for Mg/Ca, Sr/Ca and Ba/Ca were calculated from multipleanalyses on the carbonate standard, OKA carbonatite (Mg/Ca=~2.75 m-mol mol−1; Sr/Ca=~13.66 mmol mol−1; Ba/Ca=~0.95 μmol mol−1,see Allison et al., 2007). Instrument drift was insignificant over the2 days. The accuracy of our SIMS estimates is affected by uncertainty inthe composition of the standard (e.g. reflecting variations in the differentOKA crystals used for SIMS and characterised by bulk analyticalmethods) and by potential matrix effects resulting from chemical andphysical differences between the standard and samples, i.e. calcite andaragonite. To reduce this uncertainty, we have compared estimates ofMg/Ca, Sr/Ca and Ba/Ca along adjacent coral transects by SIMS and bybulk methods of analysis and calculated standardisation factors toapply to SIMS data (Allison et al., 2007). We have normalised all theSIMS data presented here using these factors. A relative ion yield for B/Ca was calculated from multiple analyses on the fasciculi of a Poritescoral standard (M93-TB-FC-1, B/Ca=0.36 mmol mol−1, Kasemann etal., 2009).
Internal reproducibility (the precision at a single point) was calcu-lated from the standard deviation (σ) of all cycles (n=number of cy-cles) in each sclerosponge analysis as (σ/(√n)) and was typically 3%,1.5%, b0.4% and 3% for B/Ca, Mg/Ca, Sr/Ca and Ba/Ca respectively, for

Table 1SIMS instrument conditions, isotopes studied and typical count rates (from analyses onsclerosponge). na = not analysed.
Trace elements 1 Trace elements 2 δ11B
Energy offset (V) 75 75 0Primary beam current(nA)
30 10 40
Maximum beamdiameter (μm)
20 15 35
Imaged field (μm) 25 25 50Field aperture 2 1 1Contrast aperture 2 2 2Sample preclean 2 min with 50 μm
raster1 min in spotmode
1 min in spotmode
Count times (percycle) and countrates (cps):
Counttime (s)
Countrate
Counttime (s)
Countrate
Counttime (s)
Countrate
10B na – na – 5 70011B 8 160 na – 3 280026Mg 3 280 3 550 na –44Ca 2 1.8×10⁵ 2 2.9×10⁵ na –88Sr 2 7.3×10⁴ 2 1.3×10⁵ na –138Ba 5 17 5 51 na –
Number of cyclesper analysis
10 or 15 10 100
72 N. Allison et al. / Palaeogeography, Palaeoclimatology, Palaeoecology 313-314 (2012) 70–77
analyses of 10 cycles, and better than this for longer analyses. Exter-nal reproducibility (the precision of 9 analyses on the OKA standard)was 0.4%, 0.5% and 0.8% for Mg/Ca, Sr/Ca and Ba/Ca respectively. Ex-ternal B/Ca reproducibility (the precision of 9 analyses on the coralstandard) was 3%.
Sclerosponges are composed of two principle features: fused arago-nitic spherulites and epitaxial backfill. After sample preparation the sur-face of the thin section associated with epitaxial backfilled areasachieved a smooth polish while aragonitic spherulites frequentlyappeared roughened. The centres of the spherulites are often minera-lised incompletely (Worheide, 1998), leading to small voids in the sec-tion which may serve as traps for particulate materials and polishingcompounds during sample preparation. We developed a protocol toscreen out any contaminated analyses from the dataset. Ion countrates are typically constant or show small decreases over the course ofan analysis on a carbonate material (Fig. 2a). The proportionate
1E+00
1E+01
1E+02
1E+03
1E+04
1E+05
1E+06
Iso
top
e co
un
ts (
cps)
Cycle
Me/C
a ratio (arb
itary scale)
44Ca
Sr/Ca
11B
26Mg
88Sr
Mg/Ca
B/Ca
A
B
0.7
0.8
0.9
1.0
1.1
1 2 3 4 5 6 7 8 9 10
138Ba
Ba/Ca
Fig. 2. A: Typical isotope counts rates and B: typical changes inMe/Ca ratios over 10 cycleson a sclerosponge analysis. In B, the Me/Ca ratio in the first cycle is scaled to 1.
decreasemay vary between isotopes and consequently, isotope/44Ca ra-tiosmay subtly decrease or increase over longer analyses (Fig. 2b). Sim-ilar profiles of isotope/Ca behaviour are observed on carbonates of verydifferent isotope/Ca composition.We compared the profiles of analyseson the sclerosponge (Mg/Ca=~0.8 mmol mol−1; Sr/Ca=~11 mmol -mol−1; B/Ca=~0.2 mmol mol−1; Ba/Ca=~4 μmol mol−1), OKA car-bonatite (Mg/Ca=~3 mmol mol−1; Sr/Ca=~14 mmol mol−1; Ba/Ca=~1 μmol mol−1) and the coral standard M93-TB-FC-1 (Mg/Ca=~4 mmol mol−1; Sr/Ca=~9 mmol mol−1; B/Ca=~0.36 mmol -mol−1 ; Ba/Ca=~3 μmol mol−1, estimated from comparison withOKA). 11B counts on the OKA standard are typically b1cps, so B/Ca pro-files could only be compared between the sclerosponge and the coralstandard. We rejected sclerosponge analyses which exhibited differentisotope/Ca profiles compared to these standards e.g. some analysesexhibitedmuch steeper B/Ca slopes, consistentwith surface contamina-tion of B. 43% of B/Ca and 35% of Ba/Ca analyses were rejected.
Instrument conditions for δ11B analyses are summarised inTable 1. Secondary ions were collected using a mass resolution of~800–900 and each analysis is the sum of 100 cycles. A pre-analysissputter time of 1 min was used to remove surface contamination.The internal precision was typically 2.1‰. δ11B was estimated by nor-malising the 11B/10B ratios of the coral sample to the mean ratio(3.784±0.005 (1σ)) obtained from multiple SIMS analyses (n=4)of a Porites coral standard (M93-TB-FC-1, δ11B=24.8±0.4‰, 2σ,Kasemann et al., 2009).
We used SIMS to determine the geochemistry of selected areas ofthe sclerosponge. We made a series of trace/minor element analysesalong a ~5 mm transect from the outermost surface of the skeletontowards the sponge centre (Fig. 1). Analyses were focused at the cen-tres of the vertical skeletal pillars and examination of the section bytransmitted light after analysis confirmed that all analyses weremade on fused spherulites. Analyses were made along single pillarsas much as possible. Additional analyses were made in the zone of ep-itaxial backfill and were focused on regions of epitaxial growth. Final-ly a small number of trace/minor element analyses (n=10) weremade on fused spherulites at the centre of the sponge, representingthe oldest part of the skeleton (Fig. 1). 17 δ11B analyses were madeon the spherulites along the outermost 5 mm transect (region 1,Fig. 1). 24 δ11B analyses were made at the centre of the sponge (re-gion 3, Fig. 1), of these 9 were focused on fused spherulites and 15on epitaxial backfill. The typical morphology of the different regionsof the skeleton is illustrated in Fig. 3. SIMS analyses of the fusedspherulites likely sample a mixture of intracellularly and extracellu-larly deposited aragonite i.e. the spherulites plus the fusing epitaxialgrowth. However it is difficult to estimate the proportions of thesearagonites in each analysis. Mature spherulites have diameters of~15 to ≥30 μm when released from the large vesicle cells(Worheide, 1998). The fused spherulites in this study have a typicaldiameter of ~20–30 μm (Fig. 4). During epitaxial fusing, the
Fig. 3. Transmitted light micrographs of the sclerosponge skeleton, A: at the skeletonsurface, B: ~4 mm from the surface and C: ~10 mm from the surface. Fused aragoniticspherulites are marked with horizontal arrows (←) in each image. Epitaxial backfill ismarked with vertical arrows (↑) in B and C.

Fig. 4. Scanning electron micrograph of a broken cross-section of the sclerospongeskeleton showing the typical diameter of spherulites in the skeleton.
73N. Allison et al. / Palaeogeography, Palaeoclimatology, Palaeoecology 313-314 (2012) 70–77
spherulite fibres extend in the direction of the c-axis of the aragonitecrystal until they attain contact with fibres of other spherulites whichprevent further extension (Worheide 1998). As a result many spher-ulites develop an asymmetrical shape. For simplicity, if we assumethat the spherulites approximate the shape of a sphere and thattheir diameter is increased from 20 to 25 μm by epitaxial fusing,then we estimate that ~50% of the skeletal volume in the fused spher-ulites is deposited intracellularly as spherulites and 50% is depositedas epitaxial fusing. If epitaxial fusing increases the mean diameter ofthe spherulites by >5 μm then the contribution of epitaxially depos-ited aragonite to the skeletal volume will be even greater. Thisrough calculation demonstrates that a substantial proportion of thefused spherulites are deposited as epitaxial growth.
3. Results and discussion
Details of all individual SIMS analyses are summarised in ElectronicAppendices 1 (trace and minor elements) and 2 (δ11B).
3.1. Skeletal δ11B and precipitation fluid pH
δ11B data are summarised in Table 2. The precision of single ana-lyses was relatively large (typically ±2.1‰) and we did not observesignificant differences between analyses in each group. We also didnot observe significant differences in the mean δ11B of the differentregions i.e. between spherulites at the outer edge and centre of thesponge and epitaxial infill. We estimate the pH (total scale) of theprecipitating fluid from skeletal δ11B using the theoretical equationof B speciation in seawater (with boric acid pKB=8.59 (DOE 1994)at salinity=35 and T=26 °C, the mean seawater temperature atthe study site). We use the empirically-determined boron isotope ex-change equilibrium constant (11–10KB) in seawater of 1.0272(Klochko et al., 2006) and assume that the δ11B of the precipitationfluid is the same as seawater (δ11Bseawater=39.5‰). The accuracy ofour pH estimates is affected by the uncertainty in the δ11B composi-tion of the coral standard. Thermal ionisation and multi-collector
Table 2Summary of skeletal δ11B data and the estimated pH (total scale) of the precipitatingfluid. 95% confidence intervals (ci) were calculated as 2*σ/√n.
Sample δ11B pH
n Mean σ 95% ci Mean σ 95% ci
Spherulites, region 1 17 20.3 1.8 0.9 8.24 0.13 0.07Spherulites, region 3 9 18.7 2.7 1.8 8.08 0.26 0.17Epitaxial infill, region 3 15 20.0 2.5 1.3 8.21 0.20 0.10
inductively coupled plasma mass spectrometry analyses of 3 frag-ments of the same coral skeleton yielded δ11B=24.8±0.4‰ (2σ,Kasemann et al., 2009), equivalent to a pH error±~0.03. HoweverSIMS indicates that Porites corals are extremely heterogeneous withrespect to δ11B (Allison et al., 2010) and the thin section of the coralstandard, cut parallel to the coral surface and representing a narrowtime frame, may fall outside these limits. For this reason there maybe a larger error in the accuracy of our pH estimates although the pat-tern of estimated pH variations is correct. We note that the mean δ11Bof a Porites coral (25.2±1.8‰, 1σ, equivalent to pH 8.58), analysed bySIMS using the same standard, is in reasonable agreement (within0.15 pH units) with the mean δ11B estimated from other Porites corals(Honisch et al., 2004).
Our data suggest that the pH of the precipitating fluid is similar forthe fused spherulites and the epitaxial backfill (Table 2). The pH ofthe fluid used for precipitation of sclerosponge skeletons is ~0.4–0.5units lower than that of zooxanthellate corals and our tentative cali-bration suggests that the sclerosponge fluid has a similar pH to ambi-ent seawater. The fluid used for extracellular precipitation, bothepitaxial fusing and epitaxial backfill, is likely to be seawater. The or-igin of the fluid used for the intracellular precipitation of spherulitesis unknown, but given the pH similarity, may also be based on seawa-ter. In zooxanthellate corals, H+ is extruded from the calcificationfluid by the enzyme Ca-ATPase (Al Horani et al., 2003). The subse-quent pH increase favours the conversion of CO2→HCO3
−→CO3−,
and facilitates the diffusion of CO2 from the coral tissue into the calci-fication fluid. This results in high CaCO3 supersaturation states andlikely promotes rapid calcification (McConnaughey, 1989). Our datasuggest that this mechanism does not operate in sclerosponges. A re-cent study suggests that a carbonic anhydrase may catalyse the con-version of CO2→HCO3
−→CO3− in the precipitation fluid contained
in the large vesicle cells, increasing the fluid saturation state(Jackson et al., 2007).
Our estimates of precipitation fluid pH have several consequences.If sclerosponges skeletons record ambient seawater pH then fossilspecimens may provide better indications of past seawater pH thanother organisms which mediate the pH of their calcification fluidse.g. zooxanthellate corals (Al Horani et al., 2003) or calcitic foraminif-era (de Nooijer et al. 2009). Sclerosponges may also be more suscep-tible to the effects of decreases in seawater pH if they do not have theability to increase the pH of their precipitation fluids in response toocean acidification.
Wefindno evidence that the pHof the precipitatingfluid used to de-posit the fused spherulites has changed significantly over the span ofthe sclerosponge life. δ11B measurements in the outer transect of theskeleton were made from 0.6 to 3.4 mm from the skeleton surface. Ifwe assume skeletal growth rates of 0.1–0.5 mm year−1 (as suggestedby the minimum and maximum periodicity of Sr/Ca and Mg/Ca varia-tions, section 3.2), then we estimate that the analyses at the centre ofthe skeleton were deposited between 20 and 100 years before the ana-lyses in the outer transect. The pH of the surface oceans was ~0.1 unitshigher in pre-industrial times compared to the present day (Caldeiraand Wickett, 2003). We are unlikely to resolve this difference in ourdataset, even if the sclerosponge skeleton is old enough to record it, asthe precision of multiple (n=9–17) δ11B derived pH estimates is±0.07–0.17 pH units (Table 2).
3.2. Cyclical trace/minor element variations
Sr/Ca, Mg/Ca and Ba/Ca variations across the fused spherulitestransect from ~0 to 5 mm from the skeleton surface are illustratedin Fig. 5. Cyclical variations were not obvious in the outermost partof the transect i.e. in sections 1–3 from 0 to 2.4 mm from the skeletonsurface. However, cyclical variations are apparent in both Sr/Ca andMg/Ca in sections 4 and 5 of the transect (from 2.4 to 4.8 mm fromthe skeleton surface). The length of the cycles varies from ~0.1 mm

Mg/C
a mol m
ol -1S
r/C
a m
ol m
ol-1
Ba/
Ca
µmol
mol
-1
Distance from sponge surface (mm)
1 2 3 4 5
8.5
9.5
10.5
11.5
12.5
0.3
0.5
0.7
0.9
1.1
2
4
6
8
0.0 0.5 1.0 1.5 2.0 2.5 3.0 3.5 4.0 4.5 5.0
Fig. 5. Sr/Ca, Mg/Ca and Ba/Ca variations across the spherulite transect. Analyses were made along the single pillars, orientated perpendicular to the skeletal surface, as much aspossible. Changes in pillar are denoted by the section numbers along the top of the graph and by breaks in the lines joining adjacent points. Precision of individual analyses(1σ) is smaller than the symbols in each case.
74 N. Allison et al. / Palaeogeography, Palaeoclimatology, Palaeoecology 313-314 (2012) 70–77
(i.e. from 3.8 to 4.0 mm) to ~0.4–0.6 mm (e.g. from 3.2 to 3.7 mm).Skeletal Ba/Ca does not follow any obvious cyclical pattern. Few cred-ible B/Ca analyses were made along this transect using instrumentconditions 1 and B was not analysed in instrument conditions 2(Table 1). For this reason B/Ca variations are not illustrated.
Sclerosponge skeletons do not contain annual density band pat-terns and skeletal extension rates must be estimated by staining ordating skeletons. Estimated growth rates of A. willeyana skeletonsrange from ~0.2 mm yr−1 (Worheide, 1998) to 1.8 mm yr−1 (Fallonand Guilderson, 2005) at the Great Barrier Reef and from 0.4 to0.7 mm yr−1 (Soloman Islands and Indonesian seaway, Moore et al.,2000) to ~1.6 mm yr−1 (Saipan, Northern Mariana Islands, Grottoliet al., 2010) in the tropical Western Pacific. Extension rates mayvary by a factor of more than 2 within a single specimen (Fallonand Guilderson, 2005) or between individuals at the same location(Grottoli et al., 2010).It is therefore credible that some or all of thegeochemical cycles reflect an annual seasonality. However, obviouscycles are not observed in the outermost part of the transect. Someof the observed cycles are short (~0.1 mm) and if the linear extensionrate of the skeleton had slowed in the outermost section of the scler-osponge, then our sampling resolution may not be high enough to de-tect any annual cycles. This is particularly true for sections 1 and 2 ofthe transect which were analysed with a larger primary beam diame-ter compared to some other sections of the transect (see Appendix 1).In addition any annual cyclicity may be obscured if the sequential po-sitions of the analyses do not directly reflect the timing of their depo-sition e.g. if some spherulites are deposited some distance into thetissue layer, rather than directly at the skeleton surface.
We have not plotted the analyses on the epitaxial backfill as a timeseries as it is difficult to constrain accurately the order in which theanalysed regions were deposited. Similarly, we did not assign relativeages to the analyses made on the fused spherulites at the centre of thesponge. These analyses were made on multiple pillars within a smallarea and it was not possible to ascertain the order in which these re-gions had been deposited.
3.2.1. The inferred temperature sensitivity of Sr/Ca and Mg/Ca in fusedspherulites
The observed Sr/Ca range in the fused spherulites is ~9.5 to11.5 mmol mol−1. The seawater temperature range at the study siteis 4.3 °C and the skeletal Sr/Ca range is equivalent to a temperaturesensitivity of ~0.5 mmol mol−1 °C (or ~5%°C−1) assuming that theobserved cycles are annual. This is in agreement with an A. willeyanaspecimen from Federated States of Micronesia (0.47 mmol mol−1 °C,Fallon et al., 2005) but considerably higher than estimates from otherA. willeyana (0.12–0.17 mmol mol−1 °C, at the GBR, Fallon et al.,2005) or from C. nicholsoni (0.11 mmol mol−1 °C, Bahamas,
Rosenheim et al., 2004). These previous sclerosponge calibrationstudies use LA-ICP-MS to sample backfilled skeletons and single ana-lyses combine mixtures of fused spherulites and epitaxial backfill ofsignificantly different ages, smoothing any encoded temperature sig-nal. In light of this, it is not surprising that we observe a higher in-ferred temperature sensitivity than most other studies. The inferredtemperature sensitivities for both Sr/Ca (~5%°C−1) and Mg/Ca(~13%°C−1) in our specimen (and in all other sclerosponge studies)are higher than observed in synthetically precipitated aragonites(~0.7%°C−1 for Sr/Ca and ~2%°C−1 for Mg/Ca, Gaetani and Cohen,2006), indicating that the skeletal chemistry is also affected byother processes.
3.3. Correlations between trace/minor elements
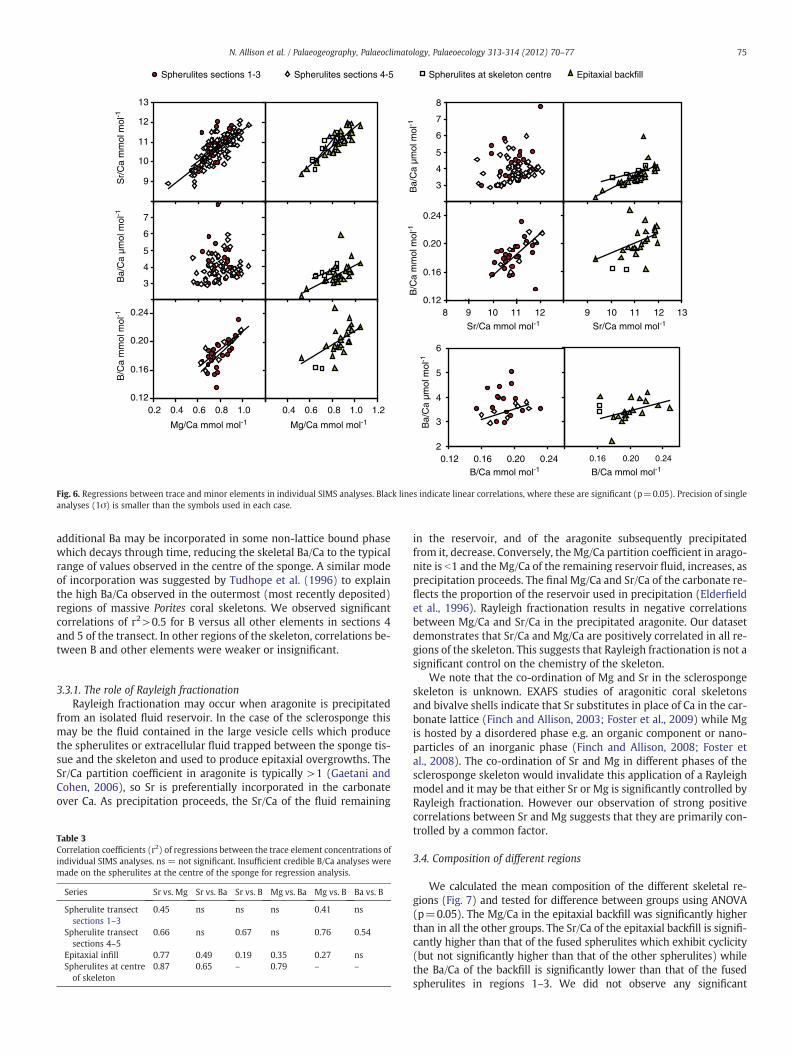
To investigate the likely processes controlling trace/minor ele-ment incorporation, we plotted regressions between all the analysedtrace/minor elements. For our plots we divided the dataset into 4groups: the section of the fused spherulites transect which exhibitedSr/Ca and Mg/Ca cycles (i.e. sections 4 and 5, Fig. 5), the section of thetransect which did not exhibit obvious cycles (i.e. sections 1 to 3,Fig. 5), the analyses of epitaxial backfill and the analyses on fusedspherulites at the centre of the skeleton. We observed positive corre-lations between Sr and Mg in all the dataset groups (Fig. 6). The re-gression coefficient increased from 0.45, in the section of thetransect which did not exhibit obvious cycles, to 0.87, in the analysesof spherulites at the centre of the skeleton (Table 3). We used regres-sion analysis to test for differences in the regression equations of thefour groups. Equations to describe the regressions between Sr/Ca andMg/Ca in the different dataset groups, were not significantly different.The regression equation for the entire dataset is:
Sr=Ca mmol mol−1� �
¼ 4:60 �Mg=Ca mmol mol−1� �
þ 7:13 r2 ¼ 0:64� �
:
Ba and Sr (and Ba and Mg) were positively correlated in the epi-taxial backfill and in the spherulites at the centre of the skeleton(Fig. 6, Table 3). They were not significantly correlated in the fusedspherulites in the outer transect. We note that minimum Ba/Ca valuesin the outer transect fall along a Ba/Ca vs. Sr/Ca line which is similar tothat describing the relationship in the epitaxial backfill and the spher-ulites at the sponge centre. We do not observe significant relation-ships between Sr/Ca and Ba/Ca in the outer transect, as many of thepoints contain higher Ba/Ca than is observed in the epitaxial backfilland the spherulites at the sponge centre. The mode of incorporationof Ba in the sclerosponge skeleton is unknown. In the outer transect
B/C
a m
mol
mol
-1
Mg/Ca mmol mol-1 Mg/Ca mmol mol-1B
a/C
a µm
ol m
ol-1
B/C
a m
mol
mol
-1
B/Ca mmol mol-1
Ba/
Ca
µmol
mol
-1
9
10
11
12
13
3
4
5
6
7
Sr/
Ca
mm
ol m
ol-1
Ba/
Ca
µmol
mol
-1
0.12
0.16
0.20
0.24
0.2 0.4 0.6 0.8 1.0 0.4 0.6 0.8 1.0 1.2
3
4
5
6
7
8
0.12
0.16
0.20
0.24
9 10 11 12 138 9 10 11 12
Sr/Ca mmol mol-1 Sr/Ca mmol mol-1
0.16 0.20 0.242
3
4
5
6
0.12 0.16 0.20 0.24B/Ca mmol mol-1
Spherulites sections 1-3 Spherulites sections 4-5 Spherulites at skeleton centre Epitaxial backfill
Fig. 6. Regressions between trace and minor elements in individual SIMS analyses. Black lines indicate linear correlations, where these are significant (p=0.05). Precision of singleanalyses (1σ) is smaller than the symbols used in each case.
75N. Allison et al. / Palaeogeography, Palaeoclimatology, Palaeoecology 313-314 (2012) 70–77
additional Ba may be incorporated in some non-lattice bound phasewhich decays through time, reducing the skeletal Ba/Ca to the typicalrange of values observed in the centre of the sponge. A similar modeof incorporation was suggested by Tudhope et al. (1996) to explainthe high Ba/Ca observed in the outermost (most recently deposited)regions of massive Porites coral skeletons. We observed significantcorrelations of r2>0.5 for B versus all other elements in sections 4and 5 of the transect. In other regions of the skeleton, correlations be-tween B and other elements were weaker or insignificant.
3.3.1. The role of Rayleigh fractionationRayleigh fractionation may occur when aragonite is precipitated
from an isolated fluid reservoir. In the case of the sclerosponge thismay be the fluid contained in the large vesicle cells which producethe spherulites or extracellular fluid trapped between the sponge tis-sue and the skeleton and used to produce epitaxial overgrowths. TheSr/Ca partition coefficient in aragonite is typically >1 (Gaetani andCohen, 2006), so Sr is preferentially incorporated in the carbonateover Ca. As precipitation proceeds, the Sr/Ca of the fluid remaining
Table 3Correlation coefficients (r2) of regressions between the trace element concentrations ofindividual SIMS analyses. ns = not significant. Insufficient credible B/Ca analyses weremade on the spherulites at the centre of the sponge for regression analysis.
Series Sr vs. Mg Sr vs. Ba Sr vs. B Mg vs. Ba Mg vs. B Ba vs. B
Spherulite transectsections 1–3
0.45 ns ns ns 0.41 ns
Spherulite transectsections 4–5
0.66 ns 0.67 ns 0.76 0.54
Epitaxial infill 0.77 0.49 0.19 0.35 0.27 nsSpherulites at centreof skeleton
0.87 0.65 – 0.79 – –
in the reservoir, and of the aragonite subsequently precipitatedfrom it, decrease. Conversely, the Mg/Ca partition coefficient in arago-nite is b1 and the Mg/Ca of the remaining reservoir fluid, increases, asprecipitation proceeds. The final Mg/Ca and Sr/Ca of the carbonate re-flects the proportion of the reservoir used in precipitation (Elderfieldet al., 1996). Rayleigh fractionation results in negative correlationsbetween Mg/Ca and Sr/Ca in the precipitated aragonite. Our datasetdemonstrates that Sr/Ca and Mg/Ca are positively correlated in all re-gions of the skeleton. This suggests that Rayleigh fractionation is not asignificant control on the chemistry of the skeleton.
We note that the co-ordination of Mg and Sr in the sclerospongeskeleton is unknown. EXAFS studies of aragonitic coral skeletonsand bivalve shells indicate that Sr substitutes in place of Ca in the car-bonate lattice (Finch and Allison, 2003; Foster et al., 2009) while Mgis hosted by a disordered phase e.g. an organic component or nano-particles of an inorganic phase (Finch and Allison, 2008; Foster etal., 2008). The co-ordination of Sr and Mg in different phases of thesclerosponge skeleton would invalidate this application of a Rayleighmodel and it may be that either Sr or Mg is significantly controlled byRayleigh fractionation. However our observation of strong positivecorrelations between Sr and Mg suggests that they are primarily con-trolled by a common factor.
3.4. Composition of different regions
We calculated the mean composition of the different skeletal re-gions (Fig. 7) and tested for difference between groups using ANOVA(p=0.05). The Mg/Ca in the epitaxial backfill was significantly higherthan in all the other groups. The Sr/Ca of the epitaxial backfill is signifi-cantly higher than that of the fused spherulites which exhibit cyclicity(but not significantly higher than that of the other spherulites) whilethe Ba/Ca of the backfill is significantly lower than that of the fusedspherulites in regions 1–3. We did not observe any significant

Ba/
Ca
µmol
mol
-1
Mg/C
a mm
ol mol -1
10.0
10.4
10.8
11.2
0.6
0.7
0.8
0.9
1.0
3.0
3.5
4.0
4.5
5.0
0.15
0.17
0.19
0.21 B/C
a mm
ol mol -1
Sr/
Ca
mm
ol m
ol-1
Spherulites,
skeleton centre
Epitaxial
backfill
Spherulites,
sections 4-5
Spherulites,
sections 1-3
Fig. 7. Mean trace and minor element ratios of the different groups of the dataset. Barsshow 95% confidence limits.
76 N. Allison et al. / Palaeogeography, Palaeoclimatology, Palaeoecology 313-314 (2012) 70–77
differences in the chemistry of the fused spherulites analysed in eachgroup, with the exception that the spherulites at the centre of thesponge contained significantly less B/Ca than the spherulites, at orclose to the sponge surface, and the epitaxial backfill.
We also combined all trace/minor element analyses on fused spher-ulites into one dataset and tested (t-test) for difference in the geochem-istry of the fused spherulites and epitaxial backfill. Epitaxial backfillcontained more Sr/Ca (p=0.002), Mg/Ca (p=0.0001) and B/Ca(p=0.0006) and less Ba/Ca (p=0.01) than the fused spherulites. Thespherulites are deposited intracellularly while the epitaxial fusing andepitaxial backfill are deposited extracellularly. Differences in geochem-istry between the features may reflect variations in the composition ofthe precipitation fluid, the incorporation of ions in the skeleton or kineticeffects e.g. crystal growth rate (Gabitov et al. 2008). We observe similarSr/Ca andMg/Ca ranges between the short and long length geochemicalcycles in the fused spherulites (Fig. 5). If we assume that these cycles areannual, then the large variations in annual skeletal extension rate do notappear to affect the Sr/Ca and Mg/Ca of the skeleton. Little is knownabout crystal extension rates in sclerosponge skeletons. Spherulite for-mation beginswith the deposition of 2–3 μm randomly orientated euhe-dral seed crystals. These crystals become radially orientated, extend asaragonite fibres and collectively grow to form round, egg-shaped oraster-shaped spherulites, which are typically ~15 μm in diameter. It isperhaps unlikely that skeletal extension and crystal extension rates arecorrelated i.e. during a slow growing year, fewer spherulites may be pro-duced by the sponge, but each spherulite may be produced at a similarrate.
Both the vacuoles, in the large vesicle cells, and the extracellularspaces, from which epitaxial growth occurs, contain an acidic mucuswith a large Ca2+ binding capacity (Worheide, 1998). However dif-ferences are observed in the organic matrix associated with the depo-sition of the spherulites, epitaxial fusing and epitaxial backfill. Forexample, the EDTA insoluble organic matrix in the extracellularspaces used to produce the epitaxial fusing is less dense than that ob-served in the large vesicle cells. The epitaxial backfill zone is charac-terised by a reduced number or absence of choanocytes (the
flagellate cells responsible for inducing water currents inside thesponge) and symbiotic bacteria (Worheide, 1998). The spherulitescontain the digested remains of symbiotic bacteria which may act asseeds for the nucleation of CaCO3 (Jackson et al., 2010).
In spite of the variations in deposition environment between thefused spherulites and the epitaxial backfill we note that the meanpH of the depositional environments is similar and Sr/Ca and Mg/Caare positively correlated by the same relationship in both fusedspherulites and epitaxial backfill. This suggests that the geochemistryof each feature is predominantly controlled by a common process.
3.5. A. willeyana geochemistry as a palaeoenvironmental indicator
Our high spatial resolution SIMS record indicates that the presum-ably annual Sr/Ca variations in the fused spherulites transect are largerthan observed in most other calibration studies which sample mixturesof fused spherulites and epitaxial backfill (Rosenheim et al., 2004;Fallon et al., 2005). The inferred temperature dependence of Sr/Ca istherefore higher, both frommost other sclerosponges and from studiesof synthetic aragonite (Gaetani and Cohen, 2006). This suggests that thechemistry of the A. willeyana skeleton is affected by one or more addi-tional influences, which are currently unresolved.
This does not necessarily preclude the use of A. willeyana skeletonsas indicators of sea surface temperature. The trace and minor elementgeochemistry of any biogenic aragonite is likely to represent a com-plex synthesis of influences including seawater temperature, crystalgrowth rate and biological effects. To be a successful indicator theskeletal structure must reliably reflect local environmental parame-ters. Fallon et al. (2005) observed a relatively poor (r=~0.5) correla-tion between seawater temperature and seasonal Sr/Ca, in a LA-ICP-MS study of an A. willeyana skeleton. Single LA-ICP-MS analyses inthe study combined mixtures of fused spherulites and epitaxial back-fill which are deposited at substantially different times. An accurateseasonal SST signal may be recorded in the skeleton if the epitaxialbackfill has a consistent composition and volume. Our data do notsuggest that this is the case. We observe a large range in Sr/Ca (andMg/Ca) in analyses on the epitaxial backfill, showing that its compo-sition is as heterogeneous as that of the fused spherulites.
The epitaxial backfill, precipitated towards the base of the spongecalicle, has significantly different geochemistry, including higher Sr/Ca, compared to the fused spherulites, which are deposited at theskeleton surface. This observation emphasises the need to produceproxy calibrations from the basal (infilled) part of the skeleton. Sam-ples from this part of the skeleton combine fused spherulites and ep-itaxial backfill and are analogous to skeletal samples produced fromfossil specimens.
Supplementary materials related to this article can be found on-line at doi:10.1016/j.palaeo.2011.10.009
Acknowledgements
Access to the ion probe was provided by NERC Scientific Servicesand we thank Richard Hinton for his assistance with the analyses.We thank Mike Hall for making the section and Thierry Correge(Editor), Brad Rosenheim and another anonymous reviewer for con-structive comments which improved this manuscript.
References
Al-Horani, F.A., Al-Moghrabi, S.M., de Beer, D., 2003. The mechanism of calcificationand its relation to photosynthesis and respiration in the scleractinian coral Galaxeafascicularis. Marine Biology 142, 419–426.
Allison, N., 1996. Quantitative determinations of trace and minor elements in coral ara-gonite by ion microprobe analysis, with preliminary results from Phuket, SouthThailand. Geochimica et Cosmochimica Acta 60, 3457–3470.
Allison, N., Finch, A.A., Webster, J.M., Clague, D.A., 2007. Palaeoenvironmental recordsfrom fossil corals: the effects of submarine diagenesis on temperature and climateestimates. Geochimica et Cosmochimica Acta 71, 4693–4703.

77N. Allison et al. / Palaeogeography, Palaeoclimatology, Palaeoecology 313-314 (2012) 70–77
Allison, N., Finch, A.A., EIMF, 2010. δ11B, 2010. Sr, Mg and B in a modern Porites coral:the relationship between calcification site pH and skeletal chemistry. Geochimicaet Cosmochimica Acta 74, 1790–1800.
Beck, J.W., Edwards, R.L., Ito, E., et al., 1992. Sea-surface temperature from coral skeletalstrontium calcium ratios. Science 257, 644–647.
Böhm, F., Joachimski, M., Lehnert, H., Morgenroth, G., Kretschmer, W., Vacelet, J., Dullo,W.-C., 1996. Carbon isotope records from extant Caribbean and South Pacificsponges: Evolution of δ13C in surface water DIC. Earth and Planetary Science Let-ters 139, 291–303.
Böhm, F., Haase‐Schramm, A., Eisenhauer, A., Dullo, W.-C., Joachimski, M.M., Lehnert,H., Reitner, J., 2002. Evidence for preindustrial variations in the marine surfacewater carbonate system from coralline sponges. Geochemistry, Geophysics, Geo-systems 3, 1019. doi:10.1029/2001GC000264.
Caldeira, K., Wickett, M.E., 2003. Anthropogenic carbon and ocean pH. Nature 425, 365.D.O.E., 1994. Handbook of Methods for the Analysis of the Various Parameters of the
Carbon Dioxide System in Seawater. In: Dickson, A.G., Goyet, C. (Eds.), ORNL/CDIAC-74, Version 2. Department of Energy.
de Nooijer, L.J., Toyofuku, T., Kitazato, H., 2009. Foraminifera promote calcification byelevating their intracellular pH. Proceedings of the National Academy of Science106, 15374–15378.
Elderfield, H., Bertram, C.J., Erez, J., 1996. Biomineralization model for the incorporationof trace elements into foraminiferal calcium carbonate. Earth and Planetary ScienceLetters 142, 409–423.
Fallon, S.J., Guilderson, T.P., 2005. Extracting growth rates from the nonlaminated cor-alline sponge Astrosclera willeyana using bomb radiocarbon. Limnology and Ocean-ography Methods 3, 455–461.
Fallon, S.J., McCulloch, M.T., vanWoesik, R., Sinclair, D.J., 1999. Corals at their latitudinallimits: laser ablation trace element systematics in Porites from Shirigai Bay, Japan.Earth and Planetary Science Letters 172, 221–238.
Fallon, S.J., McCulloch, M.T., Guilderson, T.P., 2005. Interpreting environmental signalsfrom the coralline sponge Astrosclera willeyana. Palaeogeography, Palaeoclimatol-ogy, Palaeoecology 228, 58–69.
Finch, A.A., Allison, N., 2003. Strontium in coral aragonite: 2. Sr co-ordination and thelong-term stability of environmental records. Geochimica et Cosmochimica Acta67 (23), 4519–4527.
Finch, A.A., Allison, N., 2008. Mg structural state in coral aragonite and implications forthe paleoenvironmental proxy. Geophysical Research Letters 35, L08704.doi:10.1029/2008GL033543.
Foster, L., Finch, A.A., Allison, N., Andersson, C., Clarke, L.J., 2008. Mg in aragonitic bi-valve shells: seasonal variations and mode of incorporation in Arctica islandica.Chemical Geology 254, 113–119.
Foster, L.C., Allison, N., Finch, A.A., Andersson, C., 2009. Strontium distribution in theshell of the aragonite bivalve Arctica islandica. Geochemistry, Geophysics, Geosys-tems 10, Q03003. doi:10.1029/2007GC001915.
Gabitov, R.I., Gaetani, G.A., Watson, E.B., Cohen, A.L., Ehrlich, H.L., 2008. Experimentaldetermination of growth rate effect on U6+ and Mg2+ partitioning between ara-gonite and fluid at elevated U6+ concentration. Geochimica et Cosmochimica Acta72, 4058–4068.
Gaetani, G.A., Cohen, A.L., 2006. Element partitioning during precipitation of aragonitefrom seawater: a framework for understanding paleoproxies. Geochimica et Cos-mochimica Acta 70, 4617–4634.
Gagnon, A.C., Adkins, J.F., Fernandez, D.P., Robinson, L.F., 2007. Sr/Ca and Mg/Ca vital ef-fects correlated with skeletal architecture in a scleractinian deep-sea coral and therole of Rayleigh fractionation. Earth and Planetary Science Letters 261, 280–295.
Grottoli, A.G., Adkins, J.F., Panero, W.R., Reaman, D.M., Moots, K., 2010. Growth rates,stable oxygen isotopes (δ18O), and strontium (Sr/Ca) composition in two speciesof Pacific sclerosponges (Acanthocheatetes wellsi and Astrosclera willeyana) withδ18O calibration and application to paleoceanography. Journal of Geophysical Re-search 115, C06008. doi:10.1029/2009JC005586.
Haase-Schramm, A., Böhm, F., Eisenhauer, A., Dullo, W.-C., Joachimski, M.M., Hansen, B.,Reitner, J., 2003. Sr/Ca ratios and oxygen isotopes from sclerosponges: temperaturehistory of the Caribbean mixed layer and thermocline during the Little Ice Age.Paleoceanography 18. doi:10.1029/2002PA000830.
Honisch, B., Hemming, N.G., Grottoli, A.G., Amat, A., Hanson, G.N., Bjima, J., 2004. Asses-sing scleractinian corals as recorders for paleo-pH: empirical calibration and vitaleffects. Geochimica et Cosmochimica Acta 68, 3675–3685.
Jackson, D.J., Macis, L., Reitner, J., Degnan, B.M., Woerheide, G., 2007. Sponge paleoge-nomics reveals an ancient role for carbonic anhydrase in skeletogenesis. Science316, 1893–1895.
Jackson, D.J., Thiel, V., Woerheide, G., 2010. An evolutionary fast-track to biocalcifica-tion. Geobiology 8, 191–196.
Kasemann, S.A., Schmidt, D.N., Bijma, J., Foster, G.L., 2009. In situ boron isotope analysisin marine carbonates and it's application for foraminifera and palaeo-pH. ChemicalGeology 260, 138–147.
Kinsman, D.J.J., Holland, H.D., 1969. The coprecipitation of cations with CaCO3: IV. Thecoprecipitation of Sr2+ with aragonite between 16 and 96°C. Geochimica et Cos-mochimica Acta 33, 1–17.
Klochko, K., Kaufman, A.J., Yao, W.S., Bryne, R.H., Tossell, J.A., 2006. Experimental mea-surement of boron isotope fractionation in seawater. Earth and Planetary ScienceLetters 248, 276–285.
McConnaughey, T.A., 1989. 13C and 18O isotopic disequilibrium in biological carbon-ates: II. In vitro simulation of kinetic isotope effects. Geochimica et CosmochimicaActa 53, 163–171.
Mitsuguchi, T., Matsumoto, E., Abe, O., Uchida, T., Isdale, P.J., 1996. Mg/Ca thermometryin coral-skeletons. Science 274, 961–963.
Moore, M.D., Charles, C.D., Rubenstone, J.L., Fairbanks, R.G., 2000. U/Th-dated scleros-ponges from the Indonesian Seaway record subsurface adjustments to west Pacificwinds. Paleoceanography 15, 404–416.
Rosenheim, E.B., Swart, P.K., Thorrold, S.R., Willenz, P., Berry, L., Latkoczy, C., 2004.High-resolution Sr/Ca records in sclerosponges calibrated to temperature in situ.Geology 32, 145–148.
Rosenheim, B.E., Swart, P.K., Willenz, P., 2009. Calibration of sclerosponge oxygen iso-tope records to temperature using high‐resolution δ18O data. Geochimica et Cos-mochimica Acta 73, 5308–5319.
Sanyal, A., Hemming, N.G., Hanson, G.N., Broecker, W.S., 1995. Evidence for a higher pHin the glacial ocean from boron isotopes in foraminifera. Nature 373, 234–236.
Sanyal, A., Hemming, N.G., Broecker, W.S., Lea, D.W., Spero, H.G., Hanson, G.N., 1996.Oceanic pH control on the boron isotopic composition of foraminifera: evidencefrom culture experiments. Paleoceanography 11, 513–517.
Sanyal, A., Nugent, M., Reeder, R.J., Bijima, J., 2000. Seawater pH control on the boronisotopic composition of calcite: evidence from inorganic calcite precipitation ex-periments. Geochimica et Cosmochimica Acta 64, 1551–1555.
Shen, G.T., Sanford, C.L., 1990. Trace element indicators of climate change in annuallybanded corals. In: Glynn, P.W. (Ed.), Global Ecological Consequences of the1982–83 El Nino. Elsevier, New York, pp. 255–283.
Swart, P.K., Thorrold, S.R., Rosenheim, B.E., Eisenhauer, A., Harrison, C.G.A., Grammer,M., Latkosczy, C., 2002. Intra-annual variation in the stable oxygen and carbonand trace element composition of sclerosponges. Paleoceanography 17.doi:10.1029/2000PA000622.
Tudhope, A.W., Lea, D.W., Shimmield, G.B., Chilcott, C.P., Head, S., 1996. Monsoon cli-mate and Arabian sea coastal upwelling recorded in massive corals from southern.Palaios 11, 347–361.
Worheide, G., 1998. The reef cave dwelling ultraconservative coralline demospongeAstrosclera willeyana (LISTER 1900) from the Indo-Pacific, micromorphology, ul-trastructure, biocalcification, isotope record, taxonomy, biogeography, phylogeny.Facies 38, 1–88.