palladium based catalysts for oxygen reduction in polymer ... · pdf filereduction in polymer...
TRANSCRIPT

Palladium Based Catalysts for Oxygen
Reduction in Polymer Electrolyte Membrane
Fuel Cells
Newcastle University
A Thesis Submitted By
Georgina Fernández Álvarez
For the Degree of Doctor of Philosophy
School of Chemical Engineering & Advanced Materials
University of Newcastle upon Tyne
August 2010
ii
Abstract
An important issue in low temperature polymer electrolyte membrane fuel cells
(PEMFC) is the lack of alternative catalysts to platinum for the oxygen reduction reaction
(ORR). The high cost and potential limited availability of platinum restricts its long term
use for large scale applications in PEMFC. Consequently, there is a great interest in
alternative catalysts to platinum for PEMFC. In this research a systematic study of the
synthesis and optimization of carbon-supported palladium and palladium alloy
nanoparticle electrocatalysts is reported. The catalysts investigated were Pd, Pd-Au, Pd-
Co, Pd-Fe and Pd-Ti supported on carbon black (Vulcan XC-72R). At least two different
atomic metal to metal ratios for bimetallic catalysts were investigated. All catalysts were
initially evaluated for the ORR by voltammetry in a three-electrode cell.
Different reducing agents, including hydrogen, ethylene glycol (EG), formaldehyde and
sodium borohydride were used for the synthesis of Pd nanoparticles. The use of EG led to
Pd nanoparticles with the highest ORR activity; this synthetic method was optimised by
adjusting the pH of the system. Pd nanoparticles of approximately 6 nm diameter
dispersed on carbon black with exchange current densities for the ORR of ca.
1.0 x 10⁻¹¹
A cm-2
were obtained. Two synthetic procedures were chosen for the
preparation of bimetallic catalysts: simultaneous co-deposition of both metals on the
carbon support and deposition of the second metal on carbon-supported Pd. Pd-Co alloy
with atomic ratio Pd:Co 4:1 exhibited improved ORR activity compared to Pd/C after
being heat treated at 300 ºC under H2 flow. The effect of heat treatment under H2 flow on
the ORR activity and physicochemical properties was also studied. Pure Pd particles
exhibited sintering after heat treatment; the presence of Au, Co and Fe decreased the
degree of sintering and the presence of Ti did not affect Pd particle growth.
Pd and Pd-Co were evaluated in low temperature hydrogen PEMFC, and Pd was tested as
cathode catalysts in hydrogen polybenzimidazole (PBI) based high temperature PEMFC,
and in direct methanol fuel cells (DMFC). Optimized Pd and Pd-Co catalysts were tested

iii
in a hydrogen low temperature PEMFC and the results were compared to those of the
state of the art commercial Pt catalyst. With approximately 1.7 times higher metal loading
than Pt (still significantly lower cost) the fuel cell with the Pd cathode gave better
performance than that with Pt operating with air at 40 ºC. A comparative study of Pd and
Pt was carried out in DMFC using different methanol concentrations and under different
operating conditions. At methanol concentrations of 5 M and higher, the Pd cathode
based cell performed better than that with Pt at 60 ºC with air.
A pseudo one dimensional model for Nafion®
-based low temperature hydrogen PEMFC
was developed to simulate the influence of cathode catalyst, metal loading, electrode
thickness and different operating conditions on the cell voltage and current density
output. The model considered mass transport through a thin film electrolyte and through
porous media but not gas flow along the channels of the cell. The model closely predicted
experimental results at 20 and 40 ºC. Above 40 ºC cell performance did not improve
experimentally as was predicted by the model; this lack of improvement was attributed to
the decrease of oxygen permeability through Nafion® caused by the lower humidity at
higher temperatures. Predicted results showed that enhanced fuel cell performance in the
whole current density range could be achieved by increasing metal loading in the cathode
whilst maintaining the catalyst layer thickness, which could be practically achieved by
increasing the metal content of the carbon-supported catalyst.

iv
Acknowledgments
I read somewhere that this one will be the most widely read page of my entire thesis,
people will see here whether they meant something in my life as PhD candidate. I believe
there is a big truth in this statement and therefore I would like the people mentioned
below to know they all made a real contribution to this piece of work.
I am grateful to my supervisor, Professor Keith Scott, for his continuous guidance and
support during the last three years. I would like to thank Dr Jong Hyun Jang, Dr Senthil
Kumar Sakkarapalayam-Murugesan and especially Dr Mohamed Mamlouk for their help,
guidance and support in the production of this thesis. I would also like to thank the
members of the Electron Microscopy and Chemical Analysis services and all the
members of staff at CEAM school for their assistance, in particular Dr Kath Liddell, for
her crucial help with the X-ray crystallography analyses.
Thanks also to all the members of the research group, who offered me both their help and
friendship. Especially I would like to thank Tiago Sousa, Beate Chistgen, Nur Hidayati,
Georgios Vlachogia nnopoulos, Amor Larrosa Guerrero, Xu Wang and Xu Wu.
I would like to thank my parents and my brother for the infinite love and support they
gave me during the whole process, and my boyfriend, Daniel, for all his patience, love
and encouragement. Also thanks to all my family and friends for their constant support.
I dedicate this thesis to my mother, Ada. Thank you for everything.

v
Table of Contents
Abstract ................................................................................................................................ i
Acknowledgments.............................................................................................................. iv
Table of Contents ................................................................................................................ v
List of Figures ..................................................................................................................... x
List of Tables ....................................................................................................................... x
Nomenclature .................................................................................................................... xx
Chapter 1: Introduction ....................................................................................................... 1
1.1. Overview .............................................................................................................. 1
1.2. Project aim and objectives.................................................................................... 2
1.3. Thesis structure .................................................................................................... 3
References ....................................................................................................................... 5
Chapter 2: Literature review ............................................................................................... 7
2.1. Introduction .......................................................................................................... 7
2.2. Low temperature polymer electrolyte membrane fuel cells ................................. 7
2.3. High temperature polymer electrolyte membrane fuel cell .................................. 9
2.4. Direct methanol fuel cell .................................................................................... 10
2.5. Modeling of low temperature polymer electrolyte membrane fuel cell ............. 12
2.6. Oxygen reduction reaction ................................................................................. 13
2.7. Palladium catalysts ............................................................................................. 15
2.8. Palladium alloy catalysts .................................................................................... 16
2.9. Conclusions ........................................................................................................ 21
References ..................................................................................................................... 23
vi
Chapter 3: Research methodology .................................................................................... 29
3.1. Introduction ........................................................................................................ 29
3.2. Three-electrode cell ............................................................................................ 29
3.3. Low temperature polymer electrolyte membrane fuel cell ................................ 31
3.4. High temperature polymer electrolyte membrane fuel cell ................................ 33
3.4.1. Polybenzimidazole membrane preparation .................................................... 33
3.4.2. Membrane electrode assembly preparation and testing .................................. 34
3.5. Direct methanol fuel cell .................................................................................... 34
3.6. Cyclic voltammetry and Tafel analysis .............................................................. 36
3.6.1. Cyclic voltammetry ........................................................................................ 36
3.6.2. Tafel analysis .................................................................................................. 37
3.7. Rotating disc electrode and Koutecky-Levich plots .......................................... 40
3.8. X-ray diffraction analyses .................................................................................. 41
3.9. Energy Dispersive X-Ray Analysis .................................................................... 42
3.10. Transmission electron microscopy analysis ................................................... 42
3.11. Catalysts preparation ...................................................................................... 43
3.11.1. Preparation of carbon-supported Pd nanoparticles.................................. 43
3.11.2. Preparation using ethylene glycol as a reducing agent ........................... 43
3.11.3. Preparation using formaldehyde as a reducing agent .............................. 45
3.11.4. Preparation using sodium borohydride as a reducing agent .................... 45
3.11.5. Preparation of carbon-supported bimetallic nanoparticles ...................... 46
References ..................................................................................................................... 50
Chapter 4: Characterization of carbon-supported Pd nanoparticles ................................. 53
4.1. Introduction ........................................................................................................ 53
4.2. Physicochemical characterization of carbon-supported Pd nanoparticles ......... 54
vii
4.2.1. EDXA and TEM characterization of carbon-supported Pd nanoparticles .. 54
4.2.2. XRD characterization of carbon-supported Pd nanoparticles ..................... 56
4.3. Electrochemical characterization of carbon-supported Pd nanoparticles .......... 60
4.3.1. Palladium electrochemical dissolution in acid electrolyte .......................... 62
4.3.2. Quantification of the electrochemical surface area ..................................... 64
4.4. Activity towards the oxygen reduction reaction of carbon-supported Pd
nanoparticles ................................................................................................................. 71
4.5. Conclusions ........................................................................................................ 84
References ..................................................................................................................... 87
Chapter 5: Characterization of carbon-supported bimetallic Pd-M nanoparticles ............ 91
5.1. Introduction ........................................................................................................ 91
5.2. Physicochemical characterization of carbon-supported bimetallic nanoparticles
………………………………………………………………………………….92
5.2.1. Physicochemical characterization of palladium-gold catalysts .................. 93
5.2.2. Physicochemical characterization of palladium-cobalt catalysts ................ 98
5.2.3. Physicochemical characterization of palladium-iron catalysts ................. 102
5.2.4. Physicochemical characterization of palladium-titanium catalysts .......... 107
5.3. Electrochemical characterization of carbon-supported bimetallic nanoparticles
………………………………………………………………………………...111
5.3.1. Electrochemical characterization of palladium-gold catalysts .................. 111
5.3.2. Electrochemical characterization of palladium-cobalt catalysts ............... 120
5.3.3. Electrochemical characterization of palladium-iron catalysts .................. 123
5.3.4. Electrochemical characterization of palladium- titanium catalysts .......... 128
5.4. Activity towards the oxygen reduction reaction of carbon-supported bimetallic
nanoparticles ............................................................................................................... 131
5.4.1. Evaluation of palladium-gold catalysts ..................................................... 131

viii
5.4.2. Evaluation of palladium-cobalt catalysts .................................................. 136
5.4.3. Evaluation of palladium-iron catalysts ..................................................... 142
5.4.4. Evaluation of palladium- titanium catalysts ............................................. 148
5.5. Conclusions ...................................................................................................... 153
References ................................................................................................................... 156
Chapter 6: Hydrogen fuel cell tests ................................................................................. 159
6.1. Introduction ...................................................................................................... 159
6.2. Low temperature polymer electrolyte membrane fuel cell tests ...................... 159
6.2.1. Evaluation of carbon-supported palladium nanoparticles ......................... 159
6.2.2. Evaluation of carbon supported bimetallic Pd-M nanoparticles ............... 174
6.2.3. Evaluation of higher loading palladium electrodes .................................. 181
6.3. High temperature polymer electrolyte membrane fuel cell tests...................... 186
6.4. Conclusions ...................................................................................................... 191
Chapter 7: Direct methanol fuel cell ............................................................................... 196
7.1. Introduction ...................................................................................................... 196
7.2. Effect of methanol concentration on fuel cell performance ............................. 197
7.2.1. Cell polarizations .......................................................................................... 197
7.2.2. Cathode polarizations ................................................................................... 208
7.3. Effect of temperature on fuel cell performance................................................ 213
7.4. Conclusions ...................................................................................................... 216
Chapter 8: Modeling of low temperature polymer electrolyte membrane fuel cell ........ 220
8.1. Introduction ...................................................................................................... 220
8.2. Mathematical model ......................................................................................... 220
8.3. Thermodynamic equilibrium potential ............................................................. 222
8.4. Gas transport through porous media ................................................................ 225

ix
8.5. Gas transport through thin film electrolyte ...................................................... 227
8.6. Kinetics............................................................................................................. 230
8.7. Conductivity and IR losses ............................................................................... 231
8.8. Results and discussion ...................................................................................... 233
8.8.1. Mass transport losses .................................................................................... 233
8.8.1.1. Mass transport in porous media ................................................................ 233
8.8.1.2. Mass transport in thin film ........................................................................ 234
8.8.2. Model predictions and limitations ................................................................ 235
8.8.3. Temperature effect ........................................................................................ 240
8.8.4. Catalyst loading effect .................................................................................. 244
8.9. Conclusions ...................................................................................................... 247
References ................................................................................................................... 249
Chapter 9: Conclusions and future work ........................................................................ 252
9.1. Conclusions ...................................................................................................... 252
9.2. Future work ...................................................................................................... 259
Appendix A ..................................................................................................................... 262
Appendix B ..................................................................................................................... 265

x
List of Figures
Figure 3-1: Schematic diagram of the half cell experimental setup. ................................ 30
Figure 3-2: Schematic diagram of the low temperature PEM fuel cell experimental setup.
........................................................................................................................................... 32
Figure 3-3: Schematic diagram of the direct methanol fuel cell experimental setup. ...... 35
Figure 4-1: TEM pictures of A) Pd/C-EG11 and B) Pt/C-EG11. ..................................... 56
Figure 4-2: XRD patterns of carbon-supported palladium catalysts. a) Pd/C-EG b) Pd/C-
CH2O c) Pd/C-NaBH4 d) Pd/C-EG-300 e) Pd/C-CH2O-300 f) Pd/C-NaBH4-300. .......... 58
Figure 4-3: XRD patterns of carbon-supported palladium catalysts. a) Pd/C-EG10 b)
Pd/C-EG11 c) Pd/C-EG12 d) Pd/C-EG13. ....................................................................... 59
Figure 4-4: XRD patterns of carbon-supported Pd catalysts. a) Pd/C-EG11 b) Pd/C-
EG11-100 c) Pd/C-EG11-200 d) Pd/C-EG11-300. ........................................................... 60
Figure 4-5: Cyclic voltammogram of Pt/C from E-Tek in N2 saturated 0.5 M H2SO4
solution at room temperature, scan rate 10 mV s−1
. .......................................................... 61
Figure 4-6: Cyclic voltammogram of Pd/C-EG11-untr in N2 saturated 0.5 M H2SO4
solution at room temperature, scan rate 5 mV s−1
. ............................................................ 62
Figure 4-7: Cyclic voltammogram of commercial Pd/C (Etek) in N2 saturated 0.5 M
H2SO4 solution at room temperature, scan rate 50 mV s−1
. The plot shows the first 80
potential cycles of the electrode. ....................................................................................... 63
Figure 4-8: Cyclic voltammograms of Pd/C catalysts prepared using three different
reducing agents, EG, CH2O and NaBH4. .......................................................................... 65
Figure 4-9: Cyclic voltammograms of Pd/C catalysts prepared by EG reduction at five
different pH values in a range from 10 to 13 pH units. .................................................... 66
Figure 4-10: Cyclic voltammograms of Pd/C-EG11, commercial Pd/C and a Pd foil
electrode. ........................................................................................................................... 67
Figure 4-11: Cyclic voltammograms of Pd/C catalysts prepared by EG reduction at pH 11
using two different carbon supports, Vulcan XC-72R as-received and Vulcan XC-72R
pretreated with HNO3. ...................................................................................................... 69
Figure 4-12: Cyclic voltammograms of Pd/C-EG and Pd/C-EG-300, before and after heat
treatment. .......................................................................................................................... 70

xi
Figure 4-13: Cyclic voltammograms of Pd/C-CH2O and Pd/C-CH2O-300, before and
after heat treatment. .......................................................................................................... 70
Figure 4-14: Cyclic voltammograms of Pd/C-NaBH4 and Pd/C-NaBH4-300, before and
after heat treatment. .......................................................................................................... 71
Figure 4-15: Linear sweep voltammograms of Pd/C-EG11-untr in O2 saturated 0.5M
H2SO4 solution at room temperature, scan rate 1 mV s−1
and 2500 rpm.. ......................... 73
Figure 4-16: Linear sweep voltammograms of Pd/C catalysts Pd/C-EG, Pd/C-CH2O and
Pd/C-NaBH4. ..................................................................................................................... 74
Figure 4-17: Linear sweep voltammograms of Pd/C catalysts Pd/C-EG10, Pd/C-EG11,
Pd/C-EG12 and Pd/C-EG13. ............................................................................................ 76
Figure 4-18: Tafel plot for the Pd/C catalysts Pd/C-EG11. .............................................. 78
Figure 4-19: Tafel plots for Pd/C catalysts A) Pd/C-EG, Pd/C-CH2O and Pd/C-NaBH4 B)
Pd/C-EG10, Pd/C-EG11, Pd/C-EG12 and Pd/C-EG13. ................................................... 79
Figure 4-20: Linear sweep voltammograms of Pd/C-untr at different rotation speed. ..... 82
Figure 4-21: Koutecký-Levich plots for Pd/C-untr. .......................................................... 83
Figure 4-22: Kinetic current vs potential plots for Pd/C-untr. .......................................... 84
Figure 5-1: X-ray diffraction patterns of carbon-supported Pd-Au catalysts. .................. 95
Figure 5-2: X-ray diffraction patterns of carbon-supported Pd-Au catalysts heat treated in
H2 at 300 ºC....................................................................................................................... 96
Figure 5-3: X-ray diffraction patterns of carbon-supported Pd-Co catalysts prepared by
ethylene glycol reduction. ............................................................................................... 100
Figure 5-4: X-ray diffraction patterns of carbon-supported Pd-Co catalysts after heat
treatment in H2 at 300 ºC. ............................................................................................... 101
Figure 5-5: X-ray diffraction patterns of carbon-supported Pd-Fe catalysts prepared by
EG reduction. .................................................................................................................. 103
Figure 5-6: Comparison of X-ray diffraction patterns of PdFe-EG11 and Pd-EG11
catalysts. .......................................................................................................................... 104
Figure 5-7: X-ray diffraction patterns of carbon-supported Pd-Fe catalysts prepared by
reduction in H2 at 500 ºC. ............................................................................................... 105
Figure 5-8: X-ray diffraction patterns of carbon-supported Pd-Ti catalysts prepared by
ethylene glycol reduction. ............................................................................................... 108

xii
Figure 5-9: X-ray diffraction patterns of carbon-supported Pd-Ti catalysts prepared by
reduction in H2 at 900 ºC with atomic ratio Pd:Ti 1:1. ....................................................110
Figure 5-10: X-ray diffraction patterns of carbon-supported Pd-Ti catalysts prepared by
reduction in H2 at 900 ºC with atomic ratio Pd:Ti 9:1. ....................................................110
Figure 5-11: Fast scan cyclic voltammograms of carbon-supported Pd-Au catalysts A)
PdAu-EG11 and B) PdAu-EG11-300. .............................................................................113
Figure 5-12: Fast scan cyclic voltammograms of carbon-supported Pd-Au catalysts A)
Pd9Au-EG11 and B) Pd9Au-EG11-300............................................................................115
Figure 5-13: Fast scan cyclic voltammograms of carbon-supported Pd-Au catalysts A)
Pd(Au)-EG11and B) Pd(Au)-EG11-300. .........................................................................116
Figure 5-14: Fast scan cyclic voltammograms of carbon-supported Pd-Au catalysts A)
Pd3(Au)-EG11 and B) Pd3(Au)-EG11-300. .....................................................................117
Figure 5-15: Cyclic voltammograms of carbon-supported Pd-Au catalysts prepared A) by
co-deposition of Pd and Au salts on carbon and B) on Pd/C. ..........................................118
Figure 5-16: Cyclic voltammograms of carbon-supported Pd-Co catalysts prepared A) by
co-deposition of Pd and Co salts on carbon and B) on Pd/C. ......................................... 121
Figure 5-17: Fast scan cyclic voltammograms of carbon-supported Pd-Fe catalysts A)
PdFe-EG11 and B) Pd3Fe-EG11. .................................................................................... 124
Figure 5-18: Cyclic voltammograms of carbon-supported Pd-Fe catalysts prepared A) by
ethylene glycol reduction and B) by reduction in H2 at 500 ºC. ..................................... 127
Figure 5-19: Cyclic voltammograms of carbon-supported Pd-Ti catalysts prepared A) by
ethylene glycol reduction and B) by reduction in H2 at 900 ºC. ..................................... 129
Figure 5-20: Linear sweep voltammograms of carbon-supported Pd-Au catalysts prepared
by co-deposition of Pd and Au salts on carbon. .............................................................. 133
Figure 5-21: Tafel plots for palladium-gold catalysts. .................................................... 133
Figure 5-22: Linear sweep voltammograms of carbon-supported Pd-Au catalysts prepared
on Pd/C............................................................................................................................ 135
Figure 5-23: Linear sweep voltammograms of carbon-supported Pd-Co catalysts prepared
by A) co-deposition of Pd and Co salts on carbon and B) on Pd/C. ............................... 139
Figure 5-24: Tafel plots for palladium-cobalt catalysts. ................................................. 142

xiii
Figure 5-25: Linear sweep voltammograms of carbon-supported Pd-Fe catalysts prepared
by ethylene glycol reduction. .......................................................................................... 144
Figure 5-26: Tafel plots for palladium-iron catalysts. ..................................................... 145
Figure 5-27: Linear sweep voltammograms of carbon-supported Pd-Fe catalysts prepared
by reduction in H2 at 500 ºC. .......................................................................................... 147
Figure 5-28: Linear sweep voltammograms of carbon-supported Pd-Ti catalysts prepared
by ethylene glycol reduction. .......................................................................................... 150
Figure 5-29: Linear sweep voltammograms of carbon-supported Pd-Ti catalysts prepared
by reduction in H2 at 900 ºC. .......................................................................................... 151
Figure 5-30: Tafel plots for palladium-titanium catalysts. .............................................. 152
Figure 6-1: Polarization curves of a low temperature polymer electrolyte membrane fuel
cell with carbon-supported Pd nanoparticles as cathode catalyst at 20, 40 and 60 ºC
operating with air. ........................................................................................................... 160
Figure 6-2: Polarization curves of a low temperature polymer electrolyte membrane fuel
cell with carbon-supported Pd nanoparticles as cathode catalyst at 20, 40 and 60 ºC
operating with oxygen..................................................................................................... 162
Figure 6-3: Polarization curves of a low temperature polymer electrolyte membrane fuel
cell with Pt–Etek as cathode catalyst at 60 ºC operating with oxygen with the humidifier
at 70 and 80 ºC. ............................................................................................................... 165
Figure 6-4: Polarization curves of a low temperature polymer electrolyte membrane fuel
cell with commercial carbon-supported Pt as cathode catalyst at 20, 40 and 60 ºC
operating with air. ........................................................................................................... 166
Figure 6-5: Polarization curves of a low temperature polymer electrolyte membrane fuel
cell with commercial carbon-supported Pt as cathode catalyst at 20, 40 and 60 ºC
operating with oxygen..................................................................................................... 167
Figure 6-6: Comparison of polarization curves of a low temperature polymer electrolyte
membrane fuel cell with carbon-supported Pd nanoparticles and commercial Pt/C from E-
tek as cathode catalyst at 20 ºC. ...................................................................................... 168
Figure 6-7: Comparison of polarization curves of a low temperature polymer electrolyte
membrane fuel cell with carbon-supported Pd nanoparticles and commercial Pt/C from E-
tek as cathode catalyst at 40 ºC. ...................................................................................... 172

xiv
Figure 6-8: Comparison of polarization curves of a low temperature polymer electrolyte
membrane fuel cell with carbon-supported Pd nanoparticles and commercial Pt/C from E-
tek as cathode catalyst at 60
ºC......................................................................................................................................172
Figure 6-9: Polarization curves of a low temperature polymer electrolyte membrane fuel
cell with carbon-supported Pd-Co nanoparticles as cathode catalyst at 20, 40 and 60 ºC
operating with air. ........................................................................................................... 175
Figure 6-10: Polarization curves of a low temperature polymer electrolyte membrane fuel
cell with carbon-supported Pd-Co nanoparticles as cathode catalyst at 20, 40 and 60 ºC
operating with oxygen..................................................................................................... 176
Figure 6-11: Comparison of polarization curves of a low temperature polymer electrolyte
membrane fuel cell with carbon-supported Pd nanoparticles and carbon-supported Pd-Co
nanoparticles as cathode catalyst at 20 ºC. ..................................................................... 177
Figure 6-12: Comparison of polarization curves of a low temperature polymer electrolyte
membrane fuel cell with carbon-supported Pd nanoparticles and carbon-supported Pd-Co
nanoparticles as cathode catalyst at 40 ºC. ..................................................................... 178
Figure 6-13: Comparison of polarization curves of a low temperature polymer electrolyte
membrane fuel cell with carbon-supported Pd nanoparticles and carbon-supported Pd-Co
nanoparticles as cathode catalyst at 60 ºC. ..................................................................... 179
Figure 6-14: Comparison of polarization curves of a low temperature polymer electrolyte
membrane fuel cell with carbon-supported Pd nanoparticles and carbon-supported Pd-Co
nanoparticles as cathode catalyst at 60 ºC. ..................................................................... 179
Figure 6-15: Comparison of polarization curves of a low temperature PEMFC with
cathode catalyst Pd/C-EG11 and loadings 0.6 and 1.0 mg cm-2
at 20 ºC. ...................... 182
Figure 6-16: Comparison of polarization curves of a low temperature PEMFC with
cathode catalyst Pd/C-EG11 and loadings 0.6 and 1.0 mg cm-2
at 40 ºC. ...................... 183
Figure 6-17: Comparison of polarization curves of a low temperature PEMFC with
cathode loadings 1 mg cm-2
of Pd/C-EG11 and 0.6 mg cm-2
Pt/C-Etek at 20 ºC. .......... 185
Figure 6-18: Comparison of polarization curves of a low temperature PEMFC with
cathode loadings 1 mg cm-2
of Pd/C-EG11 and 0.6 mg cm-2
Pt/C-Etek at 40 ºC. .......... 185
xv
Figure 6-19: Comparison of polarization curves of a high temperature PEMFC with
cathode catalysts Pd/C-EG11 and Pt/C-Etek at 120 ºC. ................................................. 187
Figure 6-20: Comparison of polarization curves of a high temperature PEMFC with
cathode catalysts Pd/C-EG11 and Pt/C-Etek at 150 ºC. ................................................. 189
Figure 6-21: Comparison of polarization curves of a high temperature PEMFC with
cathode catalysts Pd/C-EG11 and Pt/C-Etek at 175 ºC. ................................................. 189
Figure 7-1: Comparison of polarization curves of a direct methanol fuel cell with Pd/C
and commercial Pt/C from E-tek as cathode catalyst at 20 ºC and 1M methanol. ......... 197
Figure 7-2: Comparison of polarization curves of a direct methanol fuel cell with Pd/C
and commercial Pt/C from E-tek as cathode catalyst at 40 ºC and 1M methanol. ......... 198
Figure 7-3: Comparison of polarization curves of a direct methanol fuel cell with Pd/C
and commercial Pt/C from E-tek as cathode catalyst at 60 ºC and 1M methanol. ......... 199
Figure 7-4: Comparison of polarization curves of a direct methanol fuel cell operating
with air and 3M methanol with Pd/C and commercial Pt/C from E-tek as cathode catalyst
at 20, 40 and 60 ºC. ......................................................................................................... 201
Figure 7-5: Comparison of polarization curves of a direct methanol fuel cell operating on
oxygen and 3M methanol with Pd/C and commercial Pt/C from E-tek as cathode catalyst
at 20, 40 and 60 ºC. ......................................................................................................... 202
Figure 7-6: Comparison of polarization curves of a direct methanol fuel cell operating
with air and 5M methanol with Pd/C and commercial Pt/C from E-tek as cathode catalyst
at 20, 40 and 60 ºC. ......................................................................................................... 204
Figure 7-7: Comparison of polarization curves of a direct methanol fuel cell operating
with oxygen and 5M methanol with Pd/C and commercial Pt/C from E-tek as cathode
catalyst at 20, 40 and 60 ºC. ............................................................................................ 205
Figure 7-8: Comparison of polarization curves of a direct methanol fuel cell operating
with air with Pd/C and commercial Pt/C from E-tek as cathode catalyst at 60 ºC and 3, 5
and 7M methanol. ........................................................................................................... 207
Figure 7-9: Comparison of polarization curves of a direct methanol fuel cell operating
with oxygen with Pd/C and commercial Pt/C from E-tek as cathode catalyst at 60 ºC and
3, 5 and 7M methanol. .................................................................................................... 207

xvi
Figure 7-10: Anode polarization curves for a fuel cell with PtRu/C from E-tek anode
catalyst and Pd-EG11 cathode catalyst at 60 ºC fed with methanol 1, 3, 5 and 7M with air
operation. ........................................................................................................................ 209
Figure 7-11: Cathode polarization curves for Pt MEA for a DMFC at 60 ºC fed with 1, 3,
5 and 7M methanol solution with air operation compared to experimental (0.6 mg) and
predicted (2.0 mg) data from a H2 PEM fuel cell. .......................................................... 210
Figure 7-12: Cathode polarization curves for Pd MEA for a DMFC at 60 ºC fed with 3, 5
and 7M methanol solution compared to data from a H2 PEM fuel cell. ......................... 212
Figure 7-13: Anode polarization curves for a fuel cell with PtRu/C from E-tek anode
catalyst and Pd-EG11 cathode catalyst at 20, 40 and 60 ºC fed with methanol 5M. ...... 214
Figure 7-14: Cathode polarization curves for Pt MEA for a DMFC at 20, 40 and 60 ºC fed
with 5M methanol solution compared to data from a H2 PEM fuel cell. ........................ 215
Figure 7-15: Cathode polarization curves for Pd MEA for a DMFC at 20, 40 and 60 ºC
fed with 5M methanol solution compared to data from a H2 PEM fuel cell. ................. 216
Figure 8-1: Plots of A) inverse of temperature versus natural logarithm of oxygen
solubility and B) inverse of temperature versus natural logarithm of oxygen diffusivity in
Nafion®. .......................................................................................................................... 229
Figure 8-2: Predicted effect of operating current density on the cathode gas mixture
operating with air at 40 ºC. ............................................................................................. 234
Figure 8-3: Predicted effect of operating current density on the oxygen concentration in
the thin film with air and oxygen at 40 ºC. ..................................................................... 235
Figure 8-4: Comparison between experimental and predicted polarization curves for a
low temperature PEMFC at 40 ºC using commercial Pt/C at the cathode with reaction
order γ=1. ........................................................................................................................ 236
Figure 8-5: Comparison between experimental and predicted polarization curves for a
low temperature PEMFC at 40 ºC using Pd/C-EG11 at the cathode with reaction order
γ=1. ................................................................................................................................. 236
Figure 8-6: Comparison between predicted polarization curves for a low temperature
PEMFC operating on air at 40 ºC using commercial Pt/C at the cathode with reaction
orders γ=1 and γ=1.75. .................................................................................................... 239

xvii
Figure 8-7: Comparison between predicted polarization curves for a low temperature
PEMFC operating with oxygen at 40 ºC using Pt/C at the cathode with reaction orders
γ=1 and γ=1.75. ............................................................................................................... 239
Figure 8-8: Comparison between predicted and experimental data for a low temperature
PEMFC operating with air (γ=1.5) and O2 (γ=1) at 20 ºC using A) commercial Pt/C and
B) Pd/C-EG11 as cathode catalysts. ............................................................................... 240
Figure 8-9: Comparison between predicted and experimental data for a low temperature
PEMFC operating with air (γ=1. 75) and O2 (γ=1) at 40 ºC using A) commercial Pt/C and
B) Pd/C-EG11 as cathode catalysts. ............................................................................... 241
Figure 8-10: Comparison between predicted and experimental data for a low temperature
PEMFC operating with air (γ=2) and O2 (γ=1) at 60 ºC using A) commercial Pt/C and B)
Pd/C-EG11 as cathode catalysts. .................................................................................... 243
Figure 8-11: Predicted effect of operating current density with the cathode oxygen
concentration operating with air at 40 and 60 ºC. ........................................................... 244
Figure 8-12: Comparison between predicted and experimental data for a low temperature
PEMFC operating with air (γ=1.75) and O2 at 40 ºC using 1mg cm-2
of Pd in the cathode.
......................................................................................................................................... 245
Figure 8-13: Predicted effect of operating current density on the cathode gas mixture
operating with air at 40 ºC for a catalysts load of 1.2 mg cm-2
. ...................................... 245
Figure 8-14: Comparison between predicted polarization curves for a low temperature
PEMFC operating with air (γ=1.75) and O2 at 40 ºC with 1.0 and 1.8 mg Pd in the
cathode. ........................................................................................................................... 246
Figure 8-15: Comparison between predicted polarization curves for a low temperature
PEMFC operating with air (γ=1.75) and O2 at 40 ºC with different catalysts layer
thickness. ......................................................................................................................... 247
Figure A-1: Linear sweep voltammograms of gas diffusion electrodes of commercial Pt/C
from E-tek and homemade PdCoAu/C. .......................................................................... 262
Figure A-2: Linear sweep voltammograms of a gas diffusion electrode with homemade
PdCoAu/C tested over five consecutive days. ................................................................ 263
Figure A-3: Linear sweep voltammograms of a rotating disk electrode with commercial
Pt/C and PdTi-H2-900. .................................................................................................... 264

xviii
List of Tables
Table 2-1: Significant publications on palladium-based catalysts for ORR for PEMFC
applications. ...................................................................................................................... 21
Table 3-1: Nominal atomic ratios and synthetic methods used in the preparation of
bimetallic catalysts. ........................................................................................................... 48
Table 4-1: Particle size, ECSA and metal content for carbon-supported palladium
catalysts. ............................................................................................................................ 55
Table 4-2: Tafel slope, transfer coefficient, exchange current density and onset potential
for different carbon-supported Pd catalysts. ..................................................................... 75
Table 5-1: Particle size, electrochemical surface area, Pd-Pd bond distance and metal
content for palladium-gold electrocatalysts. ..................................................................... 93
Table 5-2: Particle size, electrochemical surface area, Pd-Pd bond distance and metal
content for palladium-cobalt electrocatalysts. .................................................................. 99
Table 5-3: Particle size, electrochemical surface area, Pd-Pd bond distance and metal
content for palladium-iron electrocatalysts. .................................................................... 102
Table 5-4: Particle size, electrochemical surface area, Pd-Pd bond distance and metal
content for palladium-titanium electrocatalysts. ............................................................. 107
Table 5-5: Onset potential, Tafel slope, transfer coefficient, exchange current density and
mass activity for carbon-supported palladium-gold catalysts. ........................................ 132
Table 5-6: Onset potential, Tafel slope, transfer coefficient, exchange current density and
mass activity for carbon-supported palladium-cobalt catalysts. ..................................... 137
Table 5-7: Onset potential, Tafel slope, transfer coefficient, exchange current density and
mass activity for several carbon-supported palladium-iron catalysts. ............................ 143
Table 5-8: Onset potential, Tafel slope, transfer coefficient, exchange current density and
mass activity for several carbon-supported palladium-titanium catalysts. ..................... 149
Table 6-1: Current densities at 0.65 V and peak power densities for low temperature PEM
fuel cell at different conditions and with different electrocatalysts in the cathode. ........ 163
Table 6-2: Comparison of Pd-Co catalysts performance with published data. ............... 181

xix
Table 6-3: Current densities at 0.65 V and cell potentials at 0.2 A cm-2
for high
temperature PEM fuel cell at different conditions and with different electrocatalysts in the
cathode. ........................................................................................................................... 188
Table 7-1: Current densities at 0.4 V, cell voltage at 5 mA cm-2
and peak power densities
for a direct methanol fuel cell with 1 M methanol solution fed to the anode. ................ 199
Table 7-2: Current densities at 0.4 V, cell voltage at 5 mA cm-2
and peak power densities
for a direct methanol fuel cell with 3M methanol solution fed to the anode at 20, 40 and
60 ºC. ............................................................................................................................... 203
Table 7-3: Current densities at 0.4 V, cell voltage at 5 mA cm-2
and peak power densities
for a direct methanol fuel cell with 5M methanol solution fed to the anode at 20, 40 and
60 ºC. ............................................................................................................................... 205
Table 7-4: Current densities at 0.4 V, cell voltage at 5 mA cm-2
and peak power densities
for a direct methanol fuel cell with 3, 5 and 7M methanol solution fed to the anode at 60
ºC. .................................................................................................................................... 208
Table 7-5: Comparison of Pd catalysts performance with published data. ..................... 213
Table 8-6: Kinetic parameters used in the construction of the model. ............................ 231

xx
Nomenclature
A Electrode active area for flux (cm2)
Pre-exponential factor
ac Electrochemical surface area (mmetal2 g
-1)
b Tafel slope (mV dec-1
)
CS, CB Surface and bulk concentrations (mol dm-3
)
CPt Oxygen concentration at platinum surface (mol dm-3
)
Cdissolve Oxygen concentration in the thin film electrolyte (mol dm-3
)
Cref Oxygen concentration where i0ref
was measured (mol dm-3
)
d Distance between atomic layers in crystals (Å)
D Diffusion coefficient through the polymer membrane (cm2 s
-1)
Particle diameter (Å)
E Potential versus Normal Hydrogen Electrode (V)
Ea Activation energy (kJ mol-1
)
E0
Standard reduction potential (V)
E0
rev Standard cell reversal potential (V)
Erev Cell reversal potential (V)
F Faraday constant (C mol-1
)
ΔG0
Standard Gibbs free energy (kJ)
H Henry‟s constant (m3
atm mol-1
)
i Current density (mA cm-2
)
icross-over Cross-over current density (mA cm-2
)
ik Kinetic current density (mA cm-2
)
iL Limiting current density (mA cm-2
)
i0 Exchange current density (mA cm-2
)
i0ref
Exchange current density at reference temperature (A cm-2
)
j Current density (mA cm-2
)
j0 Reference current density (mA cm-2
)
k Reaction rate constant (mol dm-3 s-1)
Lc Catalyst loading (gmetal cm-2
)

xxi
L Membrane thickness (m)
M Molecular weight (g mol-1
)
Ni Molar flux of species i (mol s-1
cm-2
)
n Number of electrons involved in a reaction
Pi Partial pressure of species i (atm)
P0i Reference standard partial pressure of species i (atm)
P*H2O Saturation vapor pressure of water at a given temperature (atm)
QO Charge of the oxygen monolayer on smooth Pd (µC cm-2
)
QH Charge of the hydrogen monolayer on smooth Pt (µC cm-2
)
R Gas constant (J K-1
mol-1
)
Electron/proton transport resistance (Ohm)
Sc Specific surface area of carbon per unit area
SPt Specific surface area of Pt per unit area
SA Surface area (m2 g
-1)
T Temperature (K)
Tref Reference temperature at which i0ref
was measured (K)
t Time (s)
Ucell Cell potential (V)
Xi Molar fraction of species i
Z Thickness of the gas diffusion electrode (m)
Greek Symbols
α Transfer coefficient
αa, αc Transfer coefficient for anodic and cathodic reactions
γ Reaction order
η Overpotential (V)
ηcross-over Cross over potential loss (V)
θ Diffraction peak position (radians)
λ Wavelength (Å)
xxii
σ Conductivity (S cm-1
)
ω Rotation speed (rpm)
Acronyms
CV Cyclic Voltammogram
DMFC Direct Methanol Fuel Cell
DAB 3-3‟-diaminobenzidine
ECSA Electrochemical Surface Area
EDXA Energy Dispersive X-ray Analysis
EG Ethylene Glycol
FWHM Full width of the peak at half maximum (radians)
GDL Gas Diffusion Layer
HTPEMFC High Temperature Polymer Electrolyte Membrane Fuel Cell
IPA Isophthalic acid
LSV Linear Sweep Voltammogram
MA Mass Activity
MEA Membrane Electrode Assembly
NHE Normal Hydrogen Electrode
OCP Open Circuit Potential
ORR Oxygen Reduction Reaction
PBI Polybenzimidazole
PEMFC Polymer Electrolyte Membrane Fuel Cell
PPA Poly-phosphoric acid
RDE Rotating Disk Electrode
RH Relative Humidity
TEM Transmission Electron Microscopy
XRD X-ray Diffraction

xxiii
Catalysts synthesis method
Pd/C-EG Reduction with ethylene glycol.
Pd/C-EG-300 Reduction with ethylene glycol and treatment in H2 at 300 ºC.
Pd/C-CH2O Reduction with formaldehyde.
Pd/C-CH2O-300 Reduction with formaldehyde and treatment in H2 at 300 ºC.
Pd/C-NaBH4 Reduction with sodium borohydride.
Pd/C-NaBH4-300 Reduction with sodium borohydride and treatment in H2 at 300 ºC.
Pd/C-EG10 Reduction with ethylene glycol at pH 10.
Pd/C-EG11 Reduction with ethylene glycol at pH 11.
Pd/C-EG12 Reduction with ethylene glycol at pH 12.
Pd/C-EG13 Reduction with ethylene glycol at pH 13.
Pd/C-EG11-untr Reduction with ethylene glycol at pH 11 on as-received Vulcan
XC-72R.
Pd/C-EG11-untr-rt Reduction with ethylene glycol at pH 11 on as-received Vulcan
XC-72R and treatment in H2 at room temperature.
Pd/C-EG11-untr-100 Reduction with ethylene glycol at pH 11 on as-received Vulcan
XC-72R and treatment in H2 at 100 ºC.
Pd/C-EG11-untr-200 Reduction with ethylene glycol at pH 11 on as-received Vulcan
XC-72R and treatment in H2 at 200 ºC.
Pd/C-EG11-untr-300 Reduction with ethylene glycol at pH 11 on as-received Vulcan
XC-72R and treatment in H2 at 300 ºC.
Pd/C-Etek Pd catalyst purchased from E-Tek.
Pt/C-Etek Pt catalyst purchased from E-Tek.
PdAu-EG11 Simultaneous reduction with ethylene glycol at pH 11 on as-
received Vulcan XC-72R. Nominal atomic ratios Pd:Au 1:1.
PdAu-EG11-300 Simultaneous reduction with ethylene glycol at pH 11 on as-
received Vulcan XC-72R and treatment in H2 at 300 ºC. Nominal
atomic ratios Pd:Au 1:1.
Pd9Au-EG11 Simultaneous reduction with ethylene glycol at pH 11 on as-
received Vulcan XC-72R. Nominal atomic ratios Pd:Au 9:1.

xxiv
Pd9Au-EG11-300 Simultaneous reduction with ethylene glycol at pH 11 on as-
received Vulcan XC-72R and treatment in H2 at 300 ºC. Nominal
atomic ratios Pd:Au 9:1.
Pd(Au)-EG11 Reduction of the Au precursor salt with ethylene glycol at pH 11
on Pd/C-EG11. Nominal atomic ratios Pd:Au 1:1.
Pd(Au)-EG11-300 Reduction of the Au precursor salt with ethylene glycol at pH 11
on Pd/C-EG11 and treatment in H2 at 300 ºC. Nominal atomic
ratios Pd:Au 1:1.
Pd3(Au)-EG11 Reduction of the Au precursor salt with ethylene glycol at pH 11
on Pd/C-EG11. Nominal atomic ratios Pd:Au 3:1.
Pd3(Au)-EG11-300 Reduction of the Au precursor salt with ethylene glycol at pH 11
on Pd/C-EG11 and treatment in H2 at 300 ºC. Nominal atomic
ratios Pd:Au 3:1.
PdCo-EG11 Simultaneous reduction with ethylene glycol at pH 11 on as-
received Vulcan XC-72R. Nominal atomic ratios Pd:Co 1:1.
PdCo-EG11-300 Simultaneous reduction with ethylene glycol at pH 11 on as-
received Vulcan XC-72R and treatment in H2 at 300 ºC. Nominal
atomic ratios Pd:Co 1:1.
Pd4Co-EG11 Simultaneous reduction with ethylene glycol at pH 11 on as-
received Vulcan XC-72R. Nominal atomic ratios Pd:Co 4:1.
Pd4Co-EG11-300 Simultaneous reduction with ethylene glycol at pH 11 on as-
received Vulcan XC-72R and treatment in H2 at 300 ºC. Nominal
atomic ratios Pd:Co 4:1.
Pd(Co)-EG11 Reduction of the Co precursor salt with ethylene glycol at pH 11
on Pd/C-EG11. Nominal atomic ratios Pd:Co 1:1.
Pd(Co)-EG11-300 Reduction of the Co precursor salt with ethylene glycol at pH 11
on Pd/C-EG11 and treatment in H2 at 300 ºC. Nominal atomic
ratios Pd:Co 1:1.
Pd4(Co)-EG11 Reduction of the Co precursor salt with ethylene glycol at pH 11
on Pd/C-EG11. Nominal atomic ratios Pd:Co 4:1.
xxv
Pd4(Co)-EG11-300 Reduction of the Co precursor salt with ethylene glycol at pH 11
on Pd/C-EG11 and treatment in H2 at 300 ºC. Nominal atomic
ratios Pd:Co 4:1.
PdFe-EG11 Simultaneous reduction with ethylene glycol at pH 11 on as-
received Vulcan XC-72R. Nominal atomic ratios Pd:Fe 1:1.
PdFe-EG11-300 Simultaneous reduction with ethylene glycol at pH 11 on as-
received Vulcan XC-72R and treatment in H2 at 300 ºC. Nominal
atomic ratios Pd:Fe 1:1.
Pd3Fe-EG11 Simultaneous reduction with ethylene glycol at pH 11 on as-
received Vulcan XC-72R. Nominal atomic ratios Pd:Fe 3:1.
Pd3Fe-EG11-300 Simultaneous reduction with ethylene glycol at pH 11 on as-
received Vulcan XC-72R and treatment in H2 at 300 ºC. Nominal
atomic ratios Pd:Fe 3:1.
PdFe-H2-500 Simultaneous reduction in H2 at 500 ºC on as-received Vulcan XC-
72R. Nominal atomic ratios Pd:Fe 1:1.
Pd(Fe)-H2-500 Reduction of the Fe precursor salt in H2 at 500 ºC on Pd/C-EG11-
72R. Nominal atomic ratios Pd:Fe 1:1.
Pd3Fe-H2-500 Simultaneous reduction in H2 at 500 ºC on as-received Vulcan XC-
72R. Nominal atomic ratios Pd:Fe 3:1.
Pd3(Fe)-H2-500 Reduction of the Fe precursor salt in H2 at 500 ºC on Pd/C-EG11-
72R. Nominal atomic ratios Pd:Fe 3:1.
PdTi-EG11 Simultaneous reduction with ethylene glycol at pH 11 on as-
received Vulcan XC-72R. Nominal atomic ratios Pd:Ti 1:1.
PdTi-EG11-300 Simultaneous reduction with ethylene glycol at pH 11 on as-
received Vulcan XC-72R and treatment in H2 at 300 ºC. Nominal
atomic ratios Pd:Ti 1:1.
Pd9Ti-EG11 Simultaneous reduction with ethylene glycol at pH 11 on as-
received Vulcan XC-72R. Nominal atomic ratios Pd:Ti 9:1.
Pd9Ti-EG11-300 Simultaneous reduction with ethylene glycol at pH 11 on as-
received Vulcan XC-72R and treatment in H2 at 300 ºC. Nominal
atomic ratios Pd:Ti 9:1.

xxvi
PdTi-H2-900 Simultaneous reduction in H2 at 900 ºC on as-received Vulcan XC-
72R. Nominal atomic ratios Pd:Ti 1:1.
Pd(Ti)-H2-900 Reduction of the Ti precursor salt in H2 at 900 ºC on Pd/C-EG11-
72R. Nominal atomic ratios Pd:Ti 1:1.
Pd9Ti-H2-900 Simultaneous reduction in H2 at 900 ºC on as-received Vulcan XC-
72R. Nominal atomic ratios Pd:Ti 9:1.
Pd9(Ti)-H2-900 Reduction of the Ti precursor salt in H2 at 900 ºC on Pd/C-EG11-
72R. Nominal atomic ratios Pd:Ti 9:1.
1
Chapter 1: Introduction
1.1. Overview
Polymer electrolyte membrane fuel cells (PEMFC) are considered good alternatives to
internal combustion engines because of their high power density, high energy conversion
efficiency and low emission level. Polymer electrolyte membranes used in low
temperature PEMFC require water to conduct protons which limits the operation to
temperatures below 80 ºC. The technology is currently well developed, however it suffers
from several limitations associated with a low temperature of operation: these include
low utility of the heat produced during operation, difficult water balance and poor heat
transfer characteristics due to the small temperature gradient with the environment.
A major concern with current PEMFC is their high cost compared with internal
combustion engines. They typically use platinum catalysts which represents a major part
of the fuel cell cost. For instance, for automotive applications, the reported platinum
requirements were more than 75 g per vehicle [1]. Considering the average price of
platinum in the last five years, ca. $1,200 per troy ounce (Johnson Matthey prices), the
cost of the platinum for the fuel cell system will rise to approximately $3,000 per car.
These figures represent a clear indicator of the immediate need of finding an alternative
material to platinum catalysts for PEMFC if they are to be widely commercialized.
Numerous studies on possible substitutes to platinum can be found in the literature; some
replace platinum with alternative less expensive metals. This approach has yielded some
competitive alloy catalysts, like Pt-Ni, Pt-Co and Pt-Fe [2-5] for the oxygen reduction
reaction (ORR), but the cost is still high. Therefore, the most ambitious approach to this
problem is to replace platinum with less expensive materials while maintaining
electrocatalytic activity at least equal to that of state of the art Pt catalysts.

2
Palladium based catalysts have been reported as interesting alternatives for PEMFC [6-9].
Also, considering that the average price of palladium in the last five years was nearly one
quarter of the price of platinum, approximately $300 per troy ounce, palladium based
catalysts appear as promising candidates to replace platinum.
1.2. Project aim and objectives
The aim of this project is to identify alternative catalysts to platinum for the oxygen
reduction reaction in polymer electrolyte membrane fuel cells. The research plan
comprised the following objectives:
Synthesis and physicochemical characterization of palladium-based carbon-
supported metal nanoparticles.
Electrochemical characterization and evaluation of the catalytic activity towards
the oxygen reduction reaction of the metal nanoparticles.
Evaluation of significantly active electrocatalysts as cathode materials in polymer
electrolyte membrane fuel cells. Tests were carried out in low and high
temperature PEMFC and in direct methanol fuel cells.
All catalysts prepared during this research project were supported on carbon black;
Vulcan XC-72R. This support was chosen based on its physicochemical properties:
ability to adsorb metal ions on its surface, porosity and high surface area, good electric
conductivity and high chemical stability. The employed synthetic method was
impregnation followed by reaction with a reducing agent [10-13]. The impregnation
method consists of soaking a solution of precursor metal salts into a porous support
followed by chemical reduction of the adsorbed salts to form metal particles. Several
reducing agents were employed in this study, the main two being ethylene glycol and
hydrogen.

3
The electrochemical method used to evaluate the catalytic activity of the prepared
catalyst was cyclic voltammetry which was initially carried out in a 3-electrode cell with
a rotating disc electrode. Low temperature polymer electrolyte membrane fuel cell tests
were carried out using either H2 or methanol (direct methanol fuel cell) as fuel and O2 or
air as oxidant. High temperature PEMFC tests were carried out at 120, 150 and 175 ºC
using H2 as fuel and O2 or air as oxidant.
1.3. Thesis structure
This thesis is divided into nine chapters:
Chapter 1 provides an overview of current issues with polymer electrolyte
membrane fuel cells, together with a summary of the experimental objectives and
methodology used in this work.
Chapter 2 consists of a literature review including low and high temperature
hydrogen PEMFC, direct methanol fuel cells, oxygen reduction and Pd based
alloys.
Chapter 3 describes experimental methods and techniques used in this study and
details of the experimental procedures used in catalysts synthesis, in electrodes
preparation and in fuel cell tests.
Chapter 4 describes data on physicochemical characterization, electrochemical
characterization and activity towards the oxygen reduction reaction of carbon-
supported Pd nanoparticles. Characteristics of catalysts prepared by different
synthetic procedures, obtained by X-Ray Diffraction (XRD), Energy Dispersive
X-Ray Analysis (EDXA) and Transmission Electron Microscopy (TEM) analyses
and in a three-electrode cell, are compared and discussed.

4
Chapter 5 compares physicochemical and electrochemical characteristics of
bimetallic carbon-supported nanoparticles to those of Pd/C. Characteristics of
bimetallic catalysts prepared by different synthetic procedures, obtained by XRD,
EDXA and TEM analyses and in a three-electrode cell, are compared and
discussed.
In Chapter 6 data from hydrogen polymer electrolyte membrane fuel cell tests is
presented and discussed. This chapter includes fuel cell data from low and high
temperature PEMFC. Low temperature tests used Pd, Pd-Co and Pt commercial
cathodes. High temperature tests compared Pd/C and commercial Pt/C.
Chapter 7 provides the experimental data obtained from evaluation of the Pd/C
cathode catalysts in a direct methanol fuel cell. The effects of the temperature and
methanol concentration on cell performance are discussed and the results
compared to those of commercial Pt/C.
In Chapter 8 a model for low temperature hydrogen polymer electrolyte
membrane fuel cells developed using thermodynamics, transport and kinetic
equations, is presented. The model is used to simulate the influence of cathode
catalyst and operating conditions on the cell voltage and current density output.
Chapter 9 provides conclusions drawn from this study together with
recommendations for future work.
In this work a systematic study of the synthesis and optimization of carbon-supported
palladium and palladium alloy nanoparticles is reported. A comprehensive comparative
study of Pd and Pt catalyst for ORR in polymer electrolyte membrane fuel cells is
reported in this piece of work: low and high temperature PEM fuel cells and direct
methanol fuel cells.

5
References
1. Gasteiger, H.A., S.S. Kocha, B. Sompalli, and F.T. Wagner, Activity benchmarks
and requirements for Pt, Pt-alloy, and non-Pt oxygen reduction catalysts for
PEMFCs. Applied Catalysis, B: Environmental, 2005. 56(1-2): p. 9-35.
2. Xiong, L. and A. Manthiram, Nanostructured Pt-M/C (M = Fe and Co) catalysts
prepared by a microemulsion method for oxygen reduction in proton exchange
membrane fuel cells. Electrochimica Acta, 2005. 50(11): p. 2323-2329.
3. Xiong, L., A.M. Kannan, and A. Manthiram, Pt-M (M = Fe, Co, Ni and Cu)
electrocatalysts synthesized by an aqueous route for proton exchange membrane
fuel cells. Electrochemistry Communications, 2002. 4(11): p. 898-903.
4. Salgado, J.R.C., E. Antolini, and E.R. Gonzalez, Pt-Co/C electrocatalysts for
oxygen reduction in H2/O 2 PEMFCs synthesized by borohydride method. Journal
of the Electrochemical Society, 2004. 151(12).
5. Paulus, U.A., A. Wokaun, G.G. Scherer, T.J. Schmidt, V. Stamenkovic, V.
Radmilovic, N.M. Markovic, and P.N. Ross, Oxygen Reduction on Carbon-
Supported Pt-Ni and Pt-Co Alloy Catalysts. Journal of Physical Chemistry B,
2002. 106(16): p. 4181-4191.
6. Fernández, J.L., V. Raghuveer, A. Manthiram, and A.J. Bard, Pd-Ti and Pd-Co-Au
Electrocatalysts as a Replacement for Platinum for Oxygen Reduction in Proton
Exchange Membrane Fuel Cells. Journal of the American Chemical Society,
2005. 127(38): p. 13100-13101.
7. Shao, M.-H., K. Sasaki, and R.R. Adzic, Pd-Fe Nanoparticles as Electrocatalysts
for Oxygen Reduction. Journal of the American Chemical Society, 2006. 128(11):
p. 3526-3527.
8. Wang, X., N. Kariuki, J.T. Vaughey, J. Goodpaster, R. Kumar, and D.J. Myers,
Bimetallic Pd-Cu Oxygen Reduction Electrocatalysts. Journal of the
Electrochemical Society, 2008. 155(6): p. B602-B609.
9. Mustain, W.E., K. Kepler, and J. Prakash, Investigations of carbon-supported
CoPd3 catalysts as oxygen cathodes in PEM fuel cells. Electrochemistry
Communications, 2006. 8(3): p. 406-410.

6
10. Fernández, J.L., D.A. Walsh, and A.J. Bard, Thermodynamic Guidelines for the
Design of Bimetallic Catalysts for Oxygen Electroreduction and Rapid Screening
by Scanning Electrochemical Microscopy. M-Co (M: Pd, Ag, Au). Journal of the
American Chemical Society, 2004. 127(1): p. 357-365.
11. Moreira, J., P. del Angel, A.L. Ocampo, P.J. Sebastian, J.A. Montoya, and R.H.
Castellanos, Synthesis, characterization and application of a Pd/Vulcan and Pd/C
catalyst in a PEM fuel cell. International Journal of Hydrogen Energy, 2004.
29(9): p. 915-920.
12. Salgado, J.R.C., E. Antolini, and E.R. Gonzalez, Structure and Activity of Carbon-
Supported Pt-Co Electrocatalysts for Oxygen Reduction. Journal of Physical
Chemistry B, 2004. 108(46): p. 17767-17774.
13. Chan, K.-Y., J. Ding, J. Ren, S. Cheng, and K.Y. Tsang, Supported mixed metal
nanoparticles as electrocatalysts in low temperature fuel cells. Journal of
Materials Chemistry, 2004. 14(4): p. 505-516.

7
Chapter 2: Literature review
2.1. Introduction
Polymer electrolyte membrane fuel cells (PEMFCs) are usually catalysed by platinum,
which makes their production very expensive and hinders their commercialisation. The
oxygen reduction reaction (ORR) is the limiting reaction in a PEMFC, due to its slow
kinetics and cathodes normally require higher platinum loading than anodes. Therefore
there is a clear interest in finding alternative catalysts to platinum for ORR.
Several kinds of catalysts have been considered for the ORR, including tungsten carbides
[1-3], molybdenum nitrides [4] and palladium-based catalyst among others. Palladium-
based catalysts were the selected materials in this research because the ORR on
palladium has been reported to occur by a similar mechanism to that on platinum (Section
2.6) and the price of Pd is approximately one quarter of Pt. Studies of Pd and Pd alloy
catalysts by several groups have been reviewed [5-12].
2.2. Low temperature polymer electrolyte membrane fuel cells
A fuel cell is an electrochemical device which converts the chemical energy of a fuel
directly into electricity. The first demonstration of a fuel cell was in 1839 by Sir William
Robert Grove [13]. In 1800, William Nicholson and Anthony Carlisle described the
decomposition of water into hydrogen and oxygen using electricity; Grove went a step
further and proposed the combination of the same gases to produce water and electricity.
He carried out his idea with a device called a “gas battery”, using oxygen and hydrogen
electrochemically generated and an acid electrolyte with platinum electrodes [14].
Although fuel cells are seen as modern devices they have been known for over 150 years.
During the 19th
century fuel cells had been generally considered as a curiosity and from
the early 20th
century they became the object of vehement research and development.

8
During the last decade of the past century the interest in fuel cell development grew, due
to an increased concern about the need to reduce CO2 emissions [13, 14].
The electrochemical reactions taking place in a fuel cell are in principle similar to those
in a battery. The main difference between a battery and a fuel cell is that a fuel cell does
not store energy internally within the cell; but uses a continuous fuel supply. A fuel cell
consists of two electrodes, an anode and a cathode, and an electrolyte, which separates
the electrodes and allows ions to flow across it. The fuel is externally supplied to the
anode and the oxidant, generally oxygen or air, is supplied to the cathode. At the anode of
an acid electrolyte fuel cell the fuel is oxidized, generating protons (positively charged)
and electrons. Protons migrate through the electrolyte and react with oxygen at the
cathode, while electrons flow from anode to cathode through the external circuit
generating an electrical current. The electrolyte does not allow electron transfer,
otherwise the electrons would not pass through the external circuit and the function of the
cell would be lost.
In fuel cells electrons, protons and oxygen combine at the cathode to form water. Anodic
and cathodic reactions occurring in acid electrolyte hydrogen fuel cells are:
eHH 442 2 (2.1)
OHeHO 22 244
(2.2)
The polymer electrolyte membrane (PEM) or proton exchange fuel cell was initially
conceived as an acid electrolyte system. It was based on a proton conducting electrolyte.
Eventually, the use of acid electrolyte was replaced by the use of a solid polymer
electrolyte membrane in which the acid anion is bound to a solid polymer structure. This
kind of cells is inherently simple; the membrane is sandwiched between two porous
electrodes, which usually use platinum as catalyst, and is mechanically compressed.
Proton conduction inside the membrane occurs by formation of hydrated protons, e.g.
H3O+ ions, which are mobile [13, 15, 16]. Nafion
® (DuPont) is the most popular of the
9
available proton exchange membranes for PEM cells because of its excellent thermal and
mechanical stability, and is a member of a class of synthetic polymers with ionic
properties called ionomers. Nafion® properties result from incorporating perfluorovinyl
ether groups terminated with sulfonate groups onto a tetrafluoroethylene backbone [17].
Nafion®
and similar materials depend on water to conduct the protons; therefore they
need to be fully hydrated during cell operation. For this reason the operating
temperatures are usually below 80 ºC [18].
PEMFC are expensive; and the platinum catalyst makes a major contribution to the cost.
For example, in the United States, at the end of 2005 the cost of fuel cell systems was
approximately $50 per kW [19]. Automotive applications are one of the target markets of
PEMFC; an average car has a power requirement of 50 kW, which means $2500 per car
for the fuel cell system alone. In view of a potential increasing price of platinum (nearly
doubled since 2005, the need for alternative catalysts to platinum in PEMFCs appears
obvious.
2.3. High temperature polymer electrolyte membrane fuel cell
Current low temperature PEM fuel cell technology suffers several limitations. Some of
these limitations are due to issues related to hydrogen production, storage, distribution
and purity, and many others are caused by the nature of the electrolyte membrane
employed. Membrane materials such as Nafion® need to be fully hydrated during cell
operation to allow effective proton conductivity. To be fully hydrated operating
temperatures lower than 80 ºC are required. This restriction in operating temperature
leads to different several technical problems, which have delayed commercialization and
require expensive solutions.
Low temperature operation of PEMFCs causes an enlarged impact of poisonous species
like carbon monoxide or sulphur species which reduced the catalytic activity [20] and can
completely deactivate the catalyst. This requires expensive fuel refining processes. These
operating conditions also require complex systems for thermal and water management.

10
Other challenges include low value of heat energy and low overall efficiency. Operating
at high temperatures provides several benefits including enhanced carbon monoxide
tolerance and lower humidification issues [18]. Technological developments in high
temperature polymer electrolyte membrane fuel cells (HTPEMFC) will also extend the
use of alternative fuels in PEM fuel cells, an area experiencing a rapid growth [21, 22].
The current and well developed low temperature PEMFC technology is based on
perfluoro sulphonic acid polymer membranes, which require the presence of water to
conduct protons. To operate at high temperature a new range of polymer electrolyte
membranes, stable and proton conductive in the absence of liquid water, is required.
Many attempts have been made to develop a solid polymer electrolyte capable of
maintaining high proton conductivity at elevated temperatures without the need of
humidification. Some materials have been developed for operation between 100 - 200 ºC.
The most broadly used polymer electrolyte is poly[2,2-(m-phenylene)-5,5
bibenzimidazole], commonly called polybenzimidazole (PBI). Phosphoric acid doped
PBI films have been considered as promising candidates as membranes for high
temperature PEMFC [23].
Recent work in high temperature hydrogen PEMFC has been published by Mamlouk and
Scott [24]. In this study they investigated the effect of acid and polytetrafluoroethylene
(PTFE) content in the catalyst layer, membrane doping level and metal loading of the
catalyst. They reported that 40% PTFE in the catalyst layer, 1 mg cm-2
phosphoric acid in
the cathode and 5.6 molecules of acid per repeat polymer unit (PRU) were favourable for
fuel cell operation. Peak powers of 0.27 and 0.4 W cm-2
were achieved with air at 120
and 150 ºC respectively.
2.4. Direct methanol fuel cell
Among liquid organic fuels methanol is a good candidate for direct electrochemical
oxidation in terms of reactivity at low temperatures, handling and storage. Methanol-fed
polymer electrolyte membrane fuel cells would be convenient because this would avoid

11
many difficulties encountered when operating with hydrogen-fed fuel cells, such as gas
storage and reforming. In a direct methanol fuel cell (DMFC), methanol is oxidized to
carbon dioxide in the anode, protons cross the electrolyte membrane and combine with
oxygen at the cathode to form water. Anodic and cathodic reactions occurring in a
polymer acid electrolyte DMFC are:
eHCOOHOHCH 66223 (2.3)
OHeHO 22 3662
3
(2.4)
One of the major technical problems of current DMFCs is the methanol crossover, i.e.
methanol permeation from the anode compartment through the electrolyte membrane to
the cathode compartment. This causes cathode performance losses due to the formation of
mixed potentials on the cathode catalyst as well as the decrease in the efficiency of
methanol utilization [25]. To avoid mixed potentials in the cathode, caused by the
simultaneous methanol oxidation and oxygen reduction reactions taking place, a possible
solution would be employing a cathode electrocatalyst selective for the ORR.
Previous studies showed that Ru-based catalysts (e.g. Ru-Se, Ru-Se-Mo and Ru-Se-Rh)
have some promising properties, i.e. reasonably high activity for oxygen reduction and
high methanol tolerance [26-28]. Another possible candidate to substitute Pt is Pd.
Palladium, like platinum, has a four-electron pathway for the oxygen reduction reaction
and its activity for ORR is only surpassed by platinum [29]. Additionally, Pd has
negligible electrocatalytic activity towards methanol oxidation in acid medium [30].
Lee et al. studied the ORR in acid media in the presence of methanol on Pt, Pd and Pd
alloys [30]. They found that the Pt electrode exhibited a large anodic current above ca.
0.75 V vs NHE due to methanol oxidation. This methanol oxidation led to an onset
potential ca. 200 mV lower that that observed without methanol in the electrolyte, which
was attributed to the formation of a mixed potential on the Pt surface. Pd and Pd alloy
electrocatalysts did not show mixed potential in the presence of both oxygen and

12
methanol. Several groups have reported enhanced activity of Pd-Pt catalyst towards
selective ORR compared to pure Pt in the presence of methanol [31-33].
2.5. Modeling of low temperature polymer electrolyte membrane fuel cell
Mathematical modeling of fuel cells is useful to help understand the exact effect of
operating conditions and material properties on fuel cell performance. Various
mathematical models for Nafion® based polymer electrolyte membrane fuel cells
(PEMFCs) have been reported in the literature. One of the early phenomenological
models for a PEMFC with Nafion
membrane was developed by Bernardi and Verbrugge
[34]. Mathematical models were used to plot temperature distribution and liquid
saturation maps [35], to study current distributions and reactants concentration [36], to
describe multi-component transport through flow channels and diffusion layers [37] and
or for modeling mass transport throughout porous electrodes [38].
Scott et al. used a one dimensional model for polybenzimidazole membrane fuel cells, the
Butler-Volmer equation to describe electrode kinetics and multi-component Stefan
Maxwell equations together with Darcy‟s law to describe mass transport [39]. This model
fitted experimental data but failed to predict limiting current with air operation. In a
similar way, Hu et al. reported two other one and two dimensional models for simulation
of polarization curves at different stages of an ageing test [8, 40], however, these failed to
predict mass transport limitations when the cell was operated with air.
These models assumed that mass transport occurred only through the porous media and
thus failed to predict mass transport limitations with air operation and consequently over
estimated the cell performance at high current densities. This was similar to the single
phase mass transport observation discussed earlier in Nafion based PEMFC models. In
practice a thin film of electrolyte covers the catalyst nanoparticles and it is necessary to
consider mass transport also through this phase. Reactants need to dissolve in this phase
and diffuse through it to reach the catalytic sites; diffusion through the polymer

13
electrolyte is slower compared to that through the porous media which explains the
experimentally observed transport behavior. The thin film effect has been introduced in
some models for phosphoric acid fuel cells [41, 42].
2.6. Oxygen reduction reaction
The reduction of oxygen to water has been widely studied because of its importance for
many practical systems. The electrochemistry of oxygen is also a good example of
catalytic reaction involving adsorption on the catalyst surface. Reduction mechanism and
kinetics of the cathodic reduction of oxygen are highly sensitive to the properties of the
electrode surface and the presence of other adsorbed species. Mechanism and kinetics of
the oxygen reduction reaction (ORR) have been investigated on a great variety of
electrode materials and electrolytes. An important driving factor for these studies was the
high overpotential for the ORR observed in low temperature fuel cells with aqueous
electrolytes.
The reduction of O2 in aqueous solutions is believed to occur by two overall pathways;
the direct 4-electron pathway and the 2-electron peroxide pathway [43]. The direct 4-
electron pathway involves several steps leading to the reduction of oxygen into OH- or
water. The peroxide pathway involves the formation of hydrogen peroxide in the
solution; this peroxide can decompose in the solution, producing O2 and H2O.
In acid media, equations for both pathways would be:
- Direct 4-electron pathway
OHeHO 22 244
(2.5)
- Peroxide pathway

14
222 22 OHeHO
(2.6)
followed by either
OHeHOH 222 222 (2.7)
or
2222 222 OOHOH (2.8)
The standard reduction potential calculated from thermodynamic data is, for equation 2.5,
1.229 V vs Normal Hydrogen Electrode (NHE). Each pathway involves several
intermediates and reaction steps, thus many possible operating routes have been
proposed. The main difference is that in the direct 4-electron pathway none of the
intermediates lead to peroxide species in the solution, while in the 2-electron peroxide
pathway peroxide species are present in the solution [13, 29].
The pathway followed by the ORR depends on the electrode material. The 4-electron
pathway is believed to be predominant when Pt or Pd is used, while the peroxide pathway
seems to be preferred by electrodes made of Au [13]. Several models have been proposed
to explain the interaction of O2 with the catalysts surface. The interaction of molecular
oxygen with a transition metal can be explained in terms of molecular orbitals. For
instance, the bridge-type interactions, believed to occur with Pt, involve a lateral
interaction of the π orbitals of the O2 with d orbitals of the transition element. This
interaction occurs with back-bonding from the other d orbitals of the transition element to
the π* orbitals of the O2. A strong metal-oxygen interaction results in the weakening of
the O-O bond. If the interaction is strong enough it may lead to the dissociative
adsorption of O2 [43].
Because the oxygen reduction mechanism has been reported to be the same for palladium
as for platinum [44, 45], the mechanism reported above has been assumed to be the one
occurring on the palladium-based electrocatalysts prepared.

15
2.7. Palladium catalysts
The use of several different non platinum-based catalysts for the ORR in acid electrolyte
have been reported, including tungsten carbides [1-3], molybdenum nitrides [4] and
palladium-based catalyst [5, 10, 11, 46, 47] among others. In the initial stages of this
research project some exploratory studies were carried out with molybdenum nitrides,
which were reported to be potential candidates to replace Pt for its applications for fuel
cells. However, because data reported in this piece of work corresponds to palladium-
based catalyst, this literature review is restricted to Pd-based electrocatalysts.
Palladium is a noble metal with high catalytic activity, and is used in several industrial
processes [48]. It is more abundant than platinum in the earth crust and less expensive. In
electrocatalysis, palladium based catalysts have demonstrated to be good for use in
organic fuel oxidation [49] and are able to store and release substantial amounts of
hydrogen [50]. Studies of palladium and palladium alloys catalytic activity for oxygen
reduction have been reported since the 1960s [45]. Early preparations of carbon-
supported Pd catalyst were reported by Chaston et al. in 1961; they studied the reduction
of Pd salts on activated charcoal [51]. Similar publications followed this one, as for
instance the ones from Pope at al. and Bond [52, 53].
Moreira et al. reported the preparation of carbon supported palladium catalysts (on
activated carbon and Vulcan), by an impregnation method and H2 reduction at 300 ºC,
[12]. Catalyst morphology was characterised by X-ray diffraction (XRD) and
electrocatalytic activity was tested by cyclic and linear voltammetry. Catalysts were also
tested as cathodes in hydrogen PEMFC; current densities exhibited operating with pure
H2 and O2 at room temperature (1 mg cm-2
Pd/Vulcan in the cathode) were 0.04 and 0.13
A cm-2
at 0.5 and 0.3 V respectively. The fuel cell performance was better with Pd/Vulcan
than with Pd/C.

16
2.8. Palladium alloy catalysts
In 2004, Savadogo et al. reported for the first time “extremely active” catalysts for ORR
in acid electrolyte based on palladium alloys [54]. Those alloys were prepared by
sputtering under vacuum from a palladium target and alloying metal sheets on a glassy
carbon support. Catalytic properties of these alloys were tested by cyclic voltammetry
(CV) in 0.1M H2SO4 at 30 ºC. Results indicated that Pd–Co alloy did not show any
significant change in their shape or size during the testing process, therefore the Pd–Co
alloy catalyst was stable under the applied conditions. Specific activity reported by
Savadogo et al. for palladium-cobalt 28% atomic cobalt was 580 μA cm
-2 at 0.80 V,
considerably higher than for bulk platinum, 250 μA cm-2
.
The same year Fernández et al. proposed guidelines for the production of catalyst alloys
for ORR in acidic media [6]. They assumed a mechanism where one metal is responsible
for the cleavage of the O2 molecule bond while a second metal assists the reduction of the
atomic oxygen adsorbed on the surface of the catalyst. Electrocatalytic activity for ORR
of binary and ternary combinations of metals (Pd, Co, Au and Ag) deposited on glassy
carbon was evaluated, using scanning electrochemical microscopy (SECM) as a rapid
activity screening method. Selected metal combinations were prepared on carbon black
using an impregnation method followed by a reduction in H2 at 350 ºC. The mixture Pd-
Co 80:20 weight ratios showed the highest activity, close to that of the commercial Pt
catalyst. Nevertheless, when tested in a PEM fuel cell, Pd-Co/C catalyst showed an
increased overpotential after 3 hours of continuous operation. With addition of a small
amount of Au the catalyst stability improved.
Fernández et al. also reported two electrocatalysts, Pd-Ti and Pd-Co-Au, performing at
least equal to Pt catalyst for ORR in current PEMFC [5]. Catalysts were prepared by a
reverse micro-emulsion route for the Pd-Co-Au/C and by an impregnation method for the
Pd-Ti/C catalyst, both were finally heat treated in a reducing flowing atmosphere (90%
Ar and 10% H2 mixture) at high temperatures. Both catalysts were tested as cathode
materials in single PEM cells. Pd-Co-Au/C, heat treated at 750 ºC, and Pd-Ti/C, heat

17
treated at 900 ºC, showed both performances at least equal to those of the commercial
Pt/C catalyst at the same metal content. Current densities reported at 0.5 V at 60 ºC, with
pure H2 and O2 and using 0.2 mg cm-2
of metal in the cathode, for commercial Pt/C, Pd-
Co-Au/C and Pd-Ti/C were 0.15, 0.16 and 0.10 A cm-2
, respectively. Preliminary stability
tests were carried out for these two catalysts by polarizing the cell at 200 mA cm-2
for 12
hours. The performance of the MEA made with the Pd-Ti/C cathode was essentially
stable during the stability tests; however the performance of MEA with the Pd-Co-Au/C
cathode degraded. These materials were considered to be worth further investigations due
to their significantly lower cost and their relative abundance compared to that of Pt.
However, further studies for fuel cell applications of these materials have not been
reported by Fernández et al. A more extensive physicochemical characterization study
was published in 2009 [55].
Studies of Pd deposited on a TiO2-Ti support were recently reported by Fu et al. [56].
Highly ordered TiO2 nanotubes were fabricated on a pure titanium support, Pd was then
electrochemically deposited on this support. The ORR activity was investigated in acid
media in a three-electrode cell and the electrocatalytic activity was found to be lower than
that of commercial Pt/C. This lower ORR current was attributed to a lower active area (a
consequence of larger Pd particle size) and the lower electrical conductivity of TiO2
compared to carbon. However this catalyst was cheaper than the commercial Pt/C and the
TiO2-Ti support is more stable than carbon in PEMFC operating conditions.
A comparative study of Pd-Co-Au catalysts prepared by two different methods was
presented by Raghuveer et al. [8]. Catalysts were synthesized by a reverse microemulsion
method, followed by heat treatment in a reducing atmosphere, and by impregnation
followed by reduction using sodium borohydride. Catalysts were characterized by XRD
and transmission electron microscopy. The catalyst prepared by reverse microemulsion
method presented a single phase Pd-Co-Au alloy after being heat treated at 500 ºC, while
the catalyst prepared by borohydride reduction needed temperatures of 900 ºC to form a
single metal phase. Average particle sizes measured from TEM images after heat
treatments at 900 ºC were 46 and 35 nm for borohydride and microemulsion methods,

18
respectively. Catalytic activities for ORR were tested in PEM fuel cells at 60 ºC and the
catalyst prepared by reverse microemulsion showed higher current densities. Current
densities at 0.5 V were 0.03, 0.05 A cm-2
for borohydride and microemulsion methods,
respectively. The difference in current densities was attributed to the difference in particle
sizes and consequent differences in surface area.
In 2007, Mustain et al. published a comparative study of commercial platinum catalyst
and carbon supported Pd-Co alloy for ORR in PEMFCs [7]. CoPdx/C was prepared by a
low temperature aqueous method, reducing salts with sodium bicarbonate and exposing
them to a H2/Air flow. The catalytic activity was studied between 30 and 60 ºC in a 5 cm2
single PEM fuel cell with Nafion® membrane. The best performance was showed by the
catalyst with a nominal atomic ratio 1:3, CoPd3/C, comparable with the commercial Pt/C.
Current densities of ca. 0.5 A cm-2
at 0.5 V were reported for both Pt/C and Pd3Co/C
cathodes. CoPd3/C showed excellent chemical stability, with the open circuit potential
and the current density at 0.8 V decreasing by only 3 and 10% respectively over 25 h.
Also Pd-Co alloy, this time at a nominal atomic ratio of 65% Pd to 35% Co, was studied
for the ORR by Zhang et al. [11]. They studied the effect of reducing agent and H2
treatment temperature on catalyst morphology and activity towards ORR. They used
three reducing agents, ethylene glycol, sodium borohydride and formaldehyde and heat
treatments in the range 300-700 ºC. Catalytic activities were measured with a RDE in 0.5
M H2SO4 at room temperature. They concluded that 300 ºC was the optimal hydrogen
treatment temperature for all three Pd-Co catalyst. After heat treatment the sample
prepared using ethylene glycol showed the smallest particle size, approximately 5 nm, the
highest electrochemical surface area, and the highest ORR activity of all three Pd-Co
catalysts.
Shao and et al. investigated the oxygen reduction reaction on Pd based alloys [9]. Alloys
were prepared from commercial crystals, annealed at high temperatures by induction
heating. It was found that the activity of Pd2Co/C alloy catalyst nanoparticles synthesized
was comparable to that of commercial platinum catalysts, which agrees with the results of

19
Mustain, Savadogo and Zhang previously reported [7, 11, 54]. In 2007 Shao et al. also
reported carbon-supported Pd-Fe alloy nanoparticles with very high activity for the
oxygen reduction reaction. Pd3Fe on Vulcan was prepared by reduction of FeCl3 on
commercial Pd/C at 500 ºC in H2 flow. The ORR activity of these catalysts in acid
electrolyte was higher than the activity of the state of the art commercial Pt/C
electrocatalyst. In half cell tests with a rotating disc electrode, with 10 µg cm-2
of metal,
current densities reported at 0.8 V were 5.0 and 4.5 mA cm-2
for Pd3Fe/C and Pt/C
respectively.
Wang et al. [47] prepared a series of carbon supported palladium-copper catalysts with
different molar ratios by co-impregnation and subsequent reduction in hydrogen
atmosphere. It was concluded that the highest activity was shown by the catalysts with
atomic ratio Pd:Cu approximately 1:1. In 2009 Fouda-Onana et al. [57] reached the same
conclusion, the alloy with Pd:Cu 1:1 atomic ratio had the best activity for ORR. This last
study was carried out with Pd-Cu alloys fabricated by sputtering on glassy carbon. Nickel
and tin have also been found to enhance the electrocatalytic activity of palladium towards
the reduction of molecular oxygen in acid media [58, 59]; however the stability of these
materials in operating fuel cell conditions is low.
Many studies of bimetallic catalysts for ORR looked at the deposition of a metallic
monolayer on a different metal or alloy. Nilekar et al. studied the deposition of a Pt
monolayer on different noble metals; the highest activity towards oxygen reduction was
recorded when Pt was deposited on palladium and the amount of Pt used could be further
reduced by partially substituting it by a late transition metal [60]. Zhou et al studied the
ORR at bare and Pt covered single crystal Pd2Co (111) and found that activity of Pt on
annealed Pd2Co (111) was higher than on pure Pt [61]. This same group studied the
catalytic activity of a monolayer of Pt on Pd3Fe with a monolayer of segregated Pd [62],
a layer formed on the surface of Pd3Fe when it was annealed at high temperatures. It was
found that although Pd3Fe suffers ORR activity losses ORR due to potential cycling,
Pd3Fe is an excellent substrate for Pt monolayer catalysts for ORR.

20
Table 2-1 summarises reported electrochemical characteristics of some catalysts with
reported ORR activities close to commercial Pt, which could potentially be employed in
PEMFC applications. Fernández et al. claimed that carbon-supported Pd-Co-Au exhibited
higher performance than commercial Pt/C operating in a H2 PEMFC at 0.5 V [5].
However, some lack of stability was also reported. In the same publication it was also
claimed that the performance of the Pd-Tu cathode was “essentially equal” to that of
commercial carbon-supported Pt. At the beginning of this PhD project efforts were made
to reproduce their work in order to use it as a stepping stone for the development of new
palladium-based catalysts for ORR in low and high temperature PEMFC and possibly
DMFC. Unfortunately, after several attempts the performance claimed in their
publications could not be matched. By contrary, it was found that reported synthetic
methods led to catalysts with ORR activity significantly lower than that of commercial
Pt, especially Pd-Ti, which exhibited very low ORR activity (see Appendix A). Shao et
al. also claimed the obtainment of a palladium based catalysts for the ORR which
performed better than commercial Pt/C, Pd3Fe/C [9]. Again this work was investigated
with the intention to add further developments, however the ORR activity of catalysts
prepared according to their synthetic method was dramatically below their claims (see
Section 5.4.3).
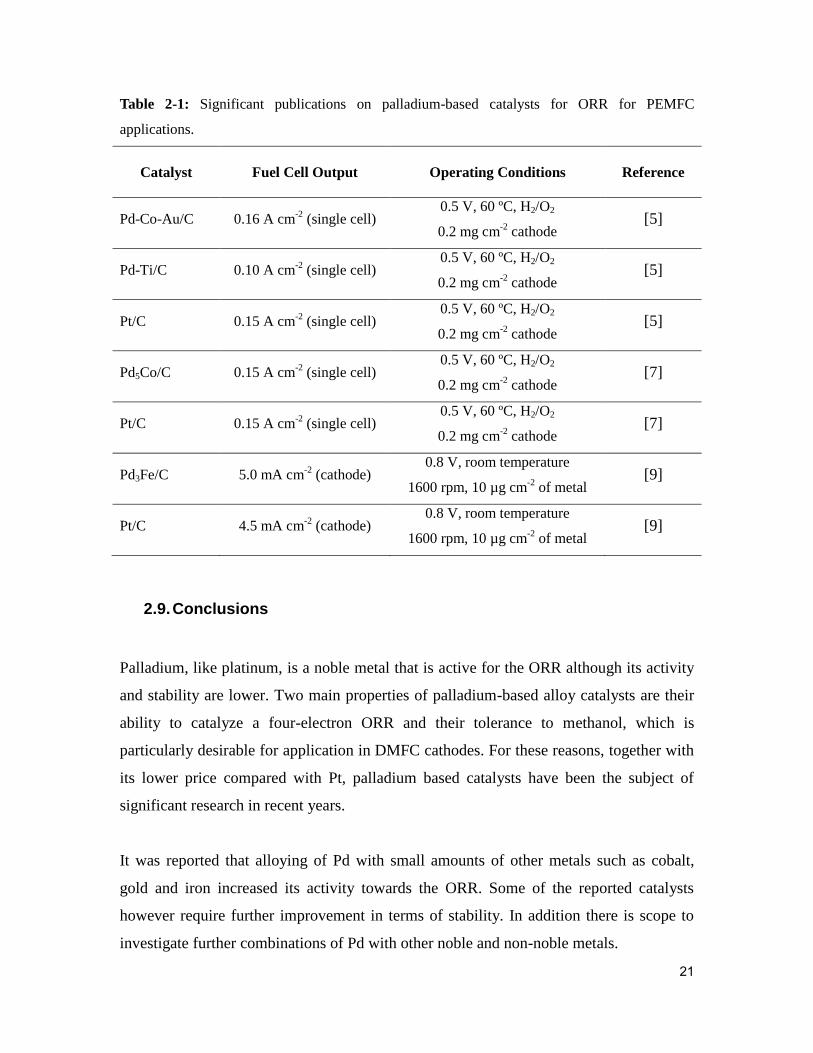
21
Table 2-1: Significant publications on palladium-based catalysts for ORR for PEMFC
applications.
Catalyst
Fuel Cell Output
Operating Conditions
Reference
Pd-Co-Au/C 0.16 A cm-2
(single cell) 0.5 V, 60 ºC, H2/O2
0.2 mg cm-2
cathode [5]
Pd-Ti/C 0.10 A cm-2
(single cell) 0.5 V, 60 ºC, H2/O2
0.2 mg cm-2
cathode [5]
Pt/C 0.15 A cm-2
(single cell) 0.5 V, 60 ºC, H2/O2
0.2 mg cm-2
cathode [5]
Pd5Co/C 0.15 A cm-2
(single cell) 0.5 V, 60 ºC, H2/O2
0.2 mg cm-2
cathode [7]
Pt/C 0.15 A cm-2
(single cell) 0.5 V, 60 ºC, H2/O2
0.2 mg cm-2
cathode [7]
Pd3Fe/C 5.0 mA cm-2
(cathode) 0.8 V, room temperature
1600 rpm, 10 µg cm-2
of metal [9]
Pt/C 4.5 mA cm-2
(cathode) 0.8 V, room temperature
1600 rpm, 10 µg cm-2
of metal [9]
2.9. Conclusions
Palladium, like platinum, is a noble metal that is active for the ORR although its activity
and stability are lower. Two main properties of palladium-based alloy catalysts are their
ability to catalyze a four-electron ORR and their tolerance to methanol, which is
particularly desirable for application in DMFC cathodes. For these reasons, together with
its lower price compared with Pt, palladium based catalysts have been the subject of
significant research in recent years.
It was reported that alloying of Pd with small amounts of other metals such as cobalt,
gold and iron increased its activity towards the ORR. Some of the reported catalysts
however require further improvement in terms of stability. In addition there is scope to
investigate further combinations of Pd with other noble and non-noble metals.

22
Palladium and gold form a uniform alloy with a face-centered cubic crystal structure at
any atomic ratio at temperatures below ca. 1280 ºC. Palladium and cobalt form a uniform
alloy with a face-centered cubic crystal structure when the Pd to Co atomic ratio is 1 to 1
or higher, at temperatures lower than ca. 1300 ºC. The study of these two bimetallic
systems would aid the understanding of the behavior of ternary alloys, necessary to
improve their electrochemical properties.
Shao et al. used experimental data and Density Functional Theory calculations to
correlate the electrocatalytic activity of different metal alloys and monolayers with their
electronic properties. Dependence of the activity towards the ORR on the binding energy
between oxygen and the d-band center of the metal overlayer was established. The
Pd overlayer on Pd3Fe(111) was claimed to be more active than Pt due to its moderate
bond with oxygen which equilibrates the O-O bond-breaking, and the removal of O
and OH (unlike pure Pd and Pt surfaces which bind oxygen strongly making the removal
of the adsorbed reaction intermediates difficult, and therefore slowing the ORR kinetics).
The Pd overlayer on PdFe(111) was reported to have lower ORR activity than on
Pd3Fe(111).
Palladium and titanium form a uniform alloy with a face-centered cubic crystal structure
when the Pd to Ti atomic ratio is ca. 9 to 1 or higher, at temperatures lower than
approximately 1700 ºC. The activity towards the ORR of Pd has been claimed to be
influenced by the presence of TiO2. The effect of different amounts of Ti in the Pd lattice
and of adjacent TiO2 particles on the ORR activity is to be studied.
It has also been reported that the performance of certain ternary Pd based catalysts
surpassed the activity of state of the art commercial Pt/C electrocatalysts. Preparation and
characterization of polycrystalline Pd-Fe alloys with different atomic ratios would
contribute to the understanding of the Pd-Fe system and this would be employed in future
preparation of ternary catalysts.

23
References
1. Ota, K., A. Ishihara, S. Mitsushima, K. Lee, Y. Suzuki, N. Horibe, T. Nakagawa,
and N. Kamiya, Improvement of cathode materials for polymer electrolyte fuel
cell. Journal of New Materials for Electrochemical Systems, 2005. 8(1): p. 25-35.
2. Lee, K., A. Ishihara, S. Mitsushima, N. Kamiya, and K.-i. Ota, Stability and
electrocatalytic activity for oxygen reduction in WC + Ta catalyst. Electrochimica
Acta, 2004. 49(21): p. 3479-3485.
3. Meng, H. and P.K. Shen, Tungsten Carbide Nanocrystal Promoted Pt/C
Electrocatalysts for Oxygen Reduction. Journal of Physical Chemistry B, 2005.
109(48): p. 22705-22709.
4. Zhong, H., H. Zhang, G. Liu, Y. Liang, J. Hu, and B. Yi, A novel non-noble
electrocatalyst for PEM fuel cell based on molybdenum nitride. Electrochemistry
Communications, 2006. 8(5): p. 707-712.
5. Fernández, J.L., V. Raghuveer, A. Manthiram, and A.J. Bard, Pd-Ti and Pd-Co-Au
Electrocatalysts as a Replacement for Platinum for Oxygen Reduction in Proton
Exchange Membrane Fuel Cells. Journal of the American Chemical Society,
2005. 127(38): p. 13100-13101.
6. Fernández, J.L., D.A. Walsh, and A.J. Bard, Thermodynamic Guidelines for the
Design of Bimetallic Catalysts for Oxygen Electroreduction and Rapid Screening
by Scanning Electrochemical Microscopy. M-Co (M: Pd, Ag, Au). Journal of the
American Chemical Society, 2004. 127(1): p. 357-365.
7. Mustain, W.E., K. Kepler, and J. Prakash, CoPdx oxygen reduction
electrocatalysts for polymer electrolyte membrane and direct methanol fuel cells.
Electrochimica Acta, 2006. 52(5): p. 2102-2108.
8. Raghuveer, V., P.J. Ferreira, and A. Manthiram, Comparison of Pd-Co-Au
electrocatalysts prepared by conventional borohydride and microemulsion
methods for oxygen reduction in fuel cells. Electrochemistry Communications,
2006. 8(5): p. 807-814.
9. Shao, M.H., T. Huang, P. Liu, J. Zhang, K. Sasaki, M.B. Vukmirovic, and R.R.
Adzic, Palladium Monolayer and Palladium Alloy Electrocatalysts for Oxygen
Reduction. Langmuir, 2006. 22(25): p. 10409-10415.

24
10. Shao, M.-H., K. Sasaki, and R.R. Adzic, Pd-Fe Nanoparticles as Electrocatalysts
for Oxygen Reduction. Journal of the American Chemical Society, 2006. 128(11):
p. 3526-3527.
11. Zhang, L., K. Lee, and J. Zhang, Effect of synthetic reducing agents on
morphology and ORR activity of carbon-supported nano-Pd-Co alloy
electrocatalysts. Electrochimica Acta, 2007. 52(28): p. 7964-7971.
12. Moreira, J., P. del Angel, A.L. Ocampo, P.J. Sebastian, J.A. Montoya, and R.H.
Castellanos, Synthesis, characterization and application of a Pd/Vulcan and Pd/C
catalyst in a PEM fuel cell. International Journal of Hydrogen Energy, 2004.
29(9): p. 915-920.
13. Vielstich, W., H. Gasteiger, and A. Lamm, Handbook of fuel cells : fundamentals,
technology and applications. 2003, Chichester: Wiley. 4 v.
14. Fuel cells: Collecting History with the World Wide Web. 2001: Smithsonian
Institution.
15. Blomen, L.J.M.J. and M.N. Mugerwa, Fuel cell systems. 1993, New York:
Plenum Press. xix, 614.
16. Larminie, J., A. Dicks, and Knovel (Firm), Fuel cell systems explained. 2nd ed.
2003, Chichester, West Sussex: J. Wiley. xxii, 406.
17. Heitner-Wirguin, C., Recent advances in perfluorinated ionomer membranes:
Structure, properties and applications. Journal of Membrane Science, 1996.
120(1): p. 1-33.
18. Scott, K. and A.K. Shukla, Polymer electrolyte membrane fuel cells: Principles
and advances. Re-views in Environmental Science and Biotechnology, 2004.
3(3): p. 273-280.
19. Bar-On, I., R. Kirchain, and R. Roth, Technical cost analysis for PEM fuel cells.
Journal of Power Sources, 2002. 109(1): p. 71-75.
20. Li, Q., R. He, J.-A. Gao, J.O. Jensen, and N.J. Bjerrum, The CO Poisoning Effect
in PEMFCs Operational at Temperatures up to 200 ºC. Journal of the
Electrochemical Society, 2003. 150(12): p. A1599-A1605.
21. Scott, K.a.A.K.S., Direct Methanol Fuel Cells: Fundamentals, Problems and
Perspectives., in Modern aspects of electrochemistry, ed. R.E. white. 2007, New
York: Springer.

25
22. Scott, K., A.K. Shukla, C.L. Jackson, and W.R.A. Meuleman, A mixed-reactants
solid-polymer-electrolyte direct methanol fuel cell. Journal of Power Sources,
2004. 126(1-2): p. 67-75.
23. Ma, Y.L., J.S. Wainright, M.H. Litt, and R.F. Savinell, Conductivity of PBI
membranes for high-temperature polymer electrolyte fuel cells. Journal of the
Electrochemical Society, 2004. 151(1).
24. Mamlouk, M. and K. Scott, Phosphoric acid-doped electrodes for a PBI polymer
membrane fuel cell. International journal of energy reasearch, 2010.
25. Electrocatalysis of Direct Methanol Fuel Cells, ed. H. Liu and J. Zhang. 2009,
Weinheim: WILEY-VCH.
26. Cheng, H., Yuan, W., Scott, K. , The influence of a new fabrication procedure on
the catalytic activity of ruthenium-selenium catalysts. Electrochimica Acta, 2006.
52(2): p. 466-473.
27. Hilgendorff, M., Diesner, K., Schulenburg, H., Bogdanoff, P., Bron, M., Fiechter,
S., Preparation Strategies towards Selective Ru-Based Oxygen Reduction
Catalysts for Direct Methanol Fuel Cells Journal of New Materials for
Electrochemical Systems, 2002. 5(2): p. 71-81.
28. Schulenburg, H., Hilgendorff, M., Dorbandt, I., Radnik, J., Bogdanoff, P.,
Fiechter, S., Bron, M., Tributsch, H., Oxygen reduction at carbon supported
ruthenium-selenium catalysts: Selenium as promoter and stabilizer of catalytic
activity. Journal of Power Sources, 2006. 155(1): p. 47-51.
29. Kinoshita, K. and Electrochemical Society., Electrochemical oxygen technology.
The Electrochemical Society series. 1992, New York: Wiley. xiv, 431.
30. Lee, K., O. Savadogo, A. Ishihara, S. Mitsushima, N. Kamiya, and K.I. Ota,
Methanol-tolerant oxygen reduction electrocatalysts based on Pd-3D transition
metal alloys for direct methanol fuel cells. Journal of the Electrochemical Society,
2006. 153(1).
31. Li, H., Q. Xin, W. Li, Z. Zhou, L. Jiang, S. Yang, and G. Sun, An improved
palladium-based DMFCs cathode catalyst. Chemical Communications, 2004(23):
p. 2776-2777.
32. Joo, J.B., Y.J. Kim, W. Kim, N.D. Kim, P. Kim, Y. Kim, and J. Yi, Methanol-
tolerant PdPt/C alloy catalyst for oxygen electro-reduction reaction. Korean
Journal of Chemical Engineering, 2008. 25(4): p. 770-774.
26
33. Kim, I.T., H.K. Lee, and J. Shim, Synthesis and characterization of Pt-Pd
catalysts for methanol oxidation and oxygen reduction. Journal of Nanoscience
and Nanotechnology, 2008. 8(10): p. 5302-5305.
34. Bernardi, D.M. and M.W. Verbrugge, A Mathematical Model of the Solid-
Polymer-Electrolyte Fuel Cell. Journal of The Electrochemical Society, 1992.
139(9): p. 2477-2491.
35. Hottinen, T., M. Noponen, T. Mennola, O. Himanen, M. Mikkola, and P. Lund,
Effect of ambient conditions on performance and current distribution of a polymer
electrolyte membrane fuel cell. Journal of Applied Electrochemistry, 2003. 33(3):
p. 265-271.
36. Mennola, T., M. Noponen, M. Aronniemi, T. Hottinen, M. Mikkola, O. Himanen,
and P. Lund, Mass transport in the cathode of a free-breathing polymer electrolyte
membrane fuel cell. Journal of Applied Electrochemistry, 2003. 33(11): p. 979-
987.
37. Guvelioglu, G.H. and H.G. Stenger, Computational fluid dynamics modeling of
polymer electrolyte membrane fuel cells. Journal of Power Sources, 2005. 147(1-
2): p. 95-106.
38. Sun, Y.-P. and K. Scott, An analysis of the influence of mass transfer on porous
electrode performance. Chemical Engineering Journal, 2004. 102(1): p. 83-91.
39. Scott, K., S. Pilditch, and M. Mamlouk, Modelling and experimental validation of
a high temperature polymer electrolyte fuel cell. Journal of Applied
Electrochemistry, 2007. 37(11): p. 1245-1259.
40. Hu, J., H. Zhang, Y. Zhai, G. Liu, J. Hu, and B. Yi, Performance degradation
studies on PBI/H3PO4 high temperature PEMFC and one-dimensional numerical
analysis. Electrochimica Acta, 2006. 52(2): p. 394-401.
41. Cutlip, M.B., S.C. Yang, and P. Stonehart, Simulation and optimization of porous
gas-diffusion electrodes used in hydrogen oxygen phosphoric acid fuel cells--II
development of a detailed anode model. Electrochimica Acta, 1991. 36(3-4): p.
547-553.
42. Yang, S.C., M.B. Cutlip, and P. Stonehart, Simulation and optimization of porous
gas-diffusion electrodes used in hydrogen/oxygen phosphoric acid fuel cells--I.
Application of cathode model simulation and optimization to PAFC cathode
development. Electrochimica Acta, 1990. 35(5): p. 869-878.
27
43. Yeager, E., Dioxygen electrocatalysis: mechanisms in relation to catalyst
structure. Journal of Molecular Catalysis, 1986. 38(1-2): p. 5-25.
44. Sawyer, D.T. and R.J. Day, Kinetics for oxygen reduction at platinum, palladium
and silver electrodes. Electrochimica Acta, 1963. 8(8): p. 589-594.
45. Damjanovic, A. and V. Brusic, Oxygen reduction at Pt-Au and Pd-Au alloy
electrodes in acid solution. Electrochimica Acta, 1967. 12(9): p. 1171-1184.
46. Mustain, W.E., K. Kepler, and J. Prakash, Investigations of carbon-supported
CoPd3 catalysts as oxygen cathodes in PEM fuel cells. Electrochemistry
Communications, 2006. 8(3): p. 406-410.
47. Wang, X., N. Kariuki, J.T. Vaughey, J. Goodpaster, R. Kumar, and D.J. Myers,
Bimetallic Pd-Cu Oxygen Reduction Electrocatalysts. Journal of the
Electrochemical Society, 2008. 155(6): p. B602-B609.
48. Papageorgopoulos, D.C., M. Keijzer, J.B.J. Veldhuis, and F.A. de Bruijn, CO
Tolerance of Pd-Rich Platinum Palladium Carbon-Supported Electrocatalysts.
Journal of the Electrochemical Society, 2002. 149(11): p. A1400-A1404.
49. Machida, K. and M. Enyo, In situ x-ray diffraction study of hydrogen entry into
palladium and palladium-gold alloy electrodes during anodic formaldehyde
oxidation. Journal of the Electrochemical Society, 1987. 134(6): p. 1472-4.
50. Lewis, F.A., The Palladium-Hydrogen System. 1967. 178 pp.
51. Chaston, J.C., E.J. Sercombe, and V.I.O.P. 122-125, Palladium-on-Charcoal
Catalysts: some effects of variables on hydrogenation activity. Platinum Metals
Review, 1961. 5(4): p. 122-125.
52. Bond, G.C., Small Particles of the Platinum Metals. Platinum Metals Review,
1975. 19(4): p. 126-134.
53. Pope, D., W.L. Smith, M.J. Eastlake, and R.L. Moss, The structure and activity of
supported metal catalysts. VI. Measurement of dispersion in palladium-charcoal
catalysts. Journal of Catalysis, 1971. 22(1): p. 72-84.
54. Savadogo, O., K. Lee, K. Oishi, S. Mitsushima, N. Kamiya, and K.I. Ota, New
palladium alloys catalyst for the oxygen reduction reaction in an acid medium.
Electrochemistry Communications, 2004. 6(2): p. 105-109.
28
55. Sun, Y.M., M. Alpuche-Aviles, A.J. Bard, J.P. Zhou, and J.M. White, Preparation
and characterization of Pd-Ti electrocatalyst on carbon supports for oxygen
reduction. Journal of Nanoscience and Nanotechnology, 2009. 9(2): p. 1281-1286.
56. Fu, Y., Z.D. Wei, S.G. Chen, L. Li, Y.C. Feng, Y.Q. Wang, X.L. Ma, M.J. Liao,
P.K. Shen, and S.P. Jiang, Synthesis of Pd/TiO2 nanotubes/Ti for oxygen reduction
reaction in acidic solution. Journal of Power Sources, 2009. 189(2): p. 982-987.
57. Fouda-Onana, F., S. Bah, and O. Savadogo, Palladium-copper alloys as catalysts
for the oxygen reduction reaction in an acidic media I: Correlation between the
ORR kinetic parameters and intrinsic physical properties of the alloys. Journal of
Electroanalytical Chemistry, 2009. 636(1-2): p. 1-9.
58. Solorza-Feria, O., V. Collins-Martinez, R.G. Gonzalez-Huerta, A. Lopez-Ortiz,
and D. Delgado-Vigil, Oxygen reduction kinetics of ball-milling synthesis Pd
electrocatalysts in acid medium. Journal of New Materials for Electrochemical
Systems, 2009. 12(2-3): p. 63-67.
59. Miah, M.R., M.T. Alam, T. Okajima, and T. Ohsaka, Electrochemically fabricated
tin-palladium bimetallic electrocatalyst for oxygen reduction reaction in acidic
media. Journal of the Electrochemical Society, 2009. 156(10): p. B1142-B1149.
60. Nilekar, A.U., Y. Xu, J. Zhang, M.B. Vukmirovic, K. Sasaki, R.R. Adzic, and M.
Mavrikakis, Bimetallic and ternary alloys for improved oxygen reduction
catalysis. Topics in Catalysis, 2007. 46(3-4): p. 276-284.
61. Zhou, W.P., M.B. Vukmirovic, K. Sasaki, and R.R. Adzic. Oxygen reduction
reaction on a Pt monolayer on a Pd2Co(111) single crystal surface. in ECS
Transactions. 2008.
62. Zhou, W.P., X. Yang, M.B. Vukmirovic, B.E. Koel, J. Jiao, G. Peng, M.
Mavrikakis, and R.R. Adzic, Improving electrocatalysts for O2 reduction by fine-
tuning the Pt-support interaction: Pt monolayer on the surfaces of a Pd3Fe(111)
single-crystal alloy. Journal of the American Chemical Society, 2009. 131(35): p.
12755-12762.

29
Chapter 3: Research methodology
3.1. Introduction
In this chapter methods and techniques employed in the physicochemical and
electrochemical characterization of electrocatalysts are briefly described. It also includes
the detailed description of experimental set up used to carry out different electrochemical
tests and different synthetic procedures employed in the preparation of electrocatalysts.
Electrochemical characterization of the electrocatalysts was initially carried out using a
three-electrode cell. Cyclic voltammetry was the main electrochemical method used to
characterise the catalysts. A few selected catalysts were further tested in low and high
temperature hydrogen PEMFC and DMFC.
The crystalline structure of carbon-supported palladium and palladium-based catalysts
was characterised using X-Ray Diffraction (XRD). Transmission Electron Microscopy
was employed to study particle size and particle distribution on the carbon support.
Energy Dispersive X-ray analysis was used to quantify the metal content of the
electrocatalysts. Particle sizes and distance between atomic layers in crystals were
calculated from the XRD data using Scherrer and Bragg equations, respectively.
3.2. Three-electrode cell
In the study of the oxygen reduction reaction, the cathodic reaction must be the rate
determining reaction. At the counter electrode (the anode) water was oxidized to oxygen
and protons. The area of the counter electrode was larger than that of the cathode to
ensure that the anode reaction was not limiting. The three-electrode cell used in this study
is shown schematically in Figure 3-1.

30
O2 / N2
RD
E
Counter Electrode:
Pt Wire
Reference Electrode:
Ag/AgCl
Luggin capillary
Figure 3-1: Schematic diagram of the half cell experimental setup.
The electrolyte, 0.1 dm3
(L) of 0.5 mol dm-3
H2SO4, was saturated either with N2 or O2
before carrying out electrochemical measurements. To ensure the electrolyte was fully
saturated with either N2 or O2, the desired gas was bubbled into the solution at a flow rate
of ca. 40 cm3 min
-1 for 0.5 hours before running each test. Gas flow was controlled
manually with a N2 or O2 flow meter (Platon (RM&C), U.K); gas flow rates lower than
20 cm3 min
-1 were used while tests were carried out.
The half cell consists of a Rotating Disc Electrode (RDE), from Radiometer Analytical,
as a working electrode. The RDE tip was made of glassy carbon, 3 mm in diameter.
Different rotation speeds were used when ORR activities were studied. The reference
electrode employed was a Silver Chloride Saturated KCl electrode (+0.197 V vs Normal
Hydrogen Electrode), and the counter electrode was a coiled platinum wire, 23 cm long
and 0.5 mm diameter. A Luggin capillary held the reference electrode to minimise the IR

31
potential losses across the electrolyte. The tip of the Luggin capillary was situated
approximately 1 mm from the working electrode.
The electrode was prepared by depositing a drop of catalyst ink onto the glassy carbon tip
of the RDE. Catalysts inks were prepared by mixing 30.3 mg of carbon supported
catalysts with 4 mL of water-ethanol (33% volume of ethanol) solution containing 0.38%
of Nafion®. This mixture was mixed in the ultrasonic bath for ca. 0.3 hours, then
immediately an ink drop of 4 µL was located on the glassy carbon tip of the RDE. The
drop was allowed to dry in air and the electrode was then introduced in the oven under an
air atmosphere for 3 minutes at 100 ºC. The catalyst loading on the electrode was 86 μg
cm-2
for all different catalysts tested. Electrochemical data was collected with a BAS
Epsilon potentiostat.
3.3. Low temperature polymer electrolyte membrane fuel cell
Membrane electrode assemblies (MEAs) were prepared by hot pressing membrane and
electrodes together at 130 ºC for 3 min applying a load of ca. 50 kg cm-2
. Nafion® 112
(DuPont) was used as the electrolyte membrane; the received membrane was boiled in
2% hydrogen peroxide for approximately 0.5 hours, rinsed with deionized water and then
boiled in 1M H2SO4 for 1 hour before being thoroughly washed with deionized water.
Pt/C purchased from E-Tek was used as anode material in each case.
The electrodes were prepared as follows. Catalyst inks were prepared by mixing in an
ultrasonic bath the carbon-supported catalyst with Nafion® in a water-ethanol (66%
volume of ethanol) solution for 0.5 hours. The amount of Nafion®
in the catalyst ink was
20% of the catalyst weight. Metal loadings were 0.2 mg cm-2
of Pt in the anode and 0.6
mg cm-2
of Pt, Pd, Pd4Co or Pd9Ti in the cathode. The catalyst layer was sprayed on a
commercial gas diffusion layer, a low temperature microporous layer (GDL LT 1200-W,
from E-Tek).

32
The fuel cell setup used to test the MEAs is shown schematically in Figure 3-2. The cell
body was made of graphite with 1 cm x 1 cm parallel flow fields. The temperature of the
cell was controlled by cartridge heaters inserted into the cell body. Operation
temperatures were 20, 40 and 60 ºC. The relative humidity was measured at different
operating conditions using a humidity and temperature transmitter (Vaisala HUMICAP®
,
Finland). H2 was used as a fuel and either air or oxygen was used as an oxidant. The
hydrogen passed through a home-made humidifier kept at a temperature 10 ºC higher
than the cell operation temperature. Air and oxygen were used directly without further
humidification. Flow rates were controlled manually by appropriate flow meters (Platon
(RM&C), U.K). Gases were fed at atmospheric pressure.
Figure 3-2: Schematic diagram of the low temperature PEM fuel cell experimental setup.
MEA conductivity was measured using a Gill AC frequency response analyzer (ACM
instruments, U.K) in the range of 10 to 200 kHz with amplitude of 15 mV.
33
3.4. High temperature polymer electrolyte membrane fuel cell
Membrane Electrode Assemblies (MEA) for High Temperature Polymer Electrolyte
Membrane (HTPEM) fuel cell tests were prepared using home-made polybenzimidazole
membrane (PBI) and gas diffusion electrodes suitable for high temperature operation.
3.4.1. Polybenzimidazole membrane preparation
For the preparation of the membrane, PBI powder (from Between Lizenz GmbH,
Germany) was dissolved in N,N‟-dimethylacetamide (DMAc) at a temperature of 250°C
in an autoclave. The autoclave was purged with nitrogen and the temperature gradually
increased to 250°C whilst the pressure was increased to 6 bars. The temperature was then
held for 5 hours and the solution was kept under magnetic stirring to allow the polymer to
dissolve. A 2% weight lithium chloride solution was added to the solution as a stabiliser
[1]. The solution was allowed to cool and then was filtered to remove any un-dissolved
polymer. The membrane was casted by pouring the solution on an optically flat glass and
kept in the oven between 90 and 110 ºC for 12 hours to produce a 40 to 60 μm thick
membrane. Membranes were then further dried at 200 ºC for 2 hours to remove any
traces of DMAc. Membrane was finally boiled in de-ionised water for 1 hour to remove
any possible traces of solvent and lithium chloride.
Pure PBI has a very low conductivity [2], therefore it requires doping with phosphoric
acid to facilitate proton conduction. The higher the doping level the higher the
conductivity, however, its mechanical properties deteriorate dramatically by increasing
the doping level [3]. The doping process was carried out by immersing the membrane in
an 11.5% weight phosphoric acid solution for 5 days at room temperature. After doping,
the membrane was dried under vacuum at 110°C until it was a constant weight. The
doping level was calculated from the weight gain of the membrane before and after
doping; it was between 5.5 and 6 molecules of acid per repeat polymer unit.

34
3.4.2. Membrane electrode assembly preparation and testing
Membrane electrode assemblies (MEAs) were prepared by hot pressing the membrane
together with the electrodes at 130 ºC for 3 min applying a load of ca. 50 kg cm-2
. The
electrodes were prepared as follows using catalysts inks. The catalyst ink was prepared
by mixing the carbon-supported catalyst in a water:ethanol 3:1 mixture containing 40 and
20% weight PTFE for the cathode and anode inks, respectively, for 30 minutes. The
required amount of PA acid was added afterwards to the surface of the catalyst layer
using a micro-pipette. Metal loadings were 0.2 mg cm-2
of Pt in the anode and 0.3 mg cm-
2 of metal in the cathode. 20% weight Pt/C purchased from E-Tek was used as anode
material in each case. The catalyst layer was sprayed on a commercial wet proofed gas
diffusion layer, (H2315 C1 from Freudenberg, Germany).
The cell used for the HTPEMFC tests was built of titanium, and was gold plated in the
area in contact with the MEA as the oxide formation in this surface increases the contact
resistance. The fuel cell had 1 cm x 1 cm gold plated parallel flow fields. The cell
temperature was controlled by thermostatically managed cartridge heaters inserted into
the cell body. Feeding gases were passed through a home-made humidifier before
entering the cell at room temperature. Flow rates were controlled manually by an
appropriate flow meter (Platon (RM&C), U.K).
3.5. Direct methanol fuel cell
Membrane electrode assemblies (MEAs) were prepared, as for low and high temperature
PEMFCs, by hot pressing membrane and electrodes at 130 ºC for 3 min, applying a load
of ca. 50 kg cm-2
. The electrodes were prepared as follows using catalysts inks. Metal
loadings were 2 mg cm-2
PtRu in the anode and 2 mg cm-2
of Pd or Pt in the cathode.
Catalysts used were commercial carbon-supported PtRu 60% weight (E-Tek) for the
anode and commercial carbon-supported Pt 20% weight (E-Tek) or home-made Pd/C
20% weight. Nafion® 117 was used as the electrolyte membrane; the received material
was boiled in 2% hydrogen peroxide for 30 minutes, rinsed with deionized water and

35
then boiled with 1M H2SO4 for 1 hour before being thoroughly washed with deionized
water. Catalyst layers were sprayed on a commercial commercial wet proofed gas
diffusion layer, (CX196, from Freudenberg, Germany). The catalyst ink was prepared by
mixing in an ultrasonic bath the carbon-supported catalyst with a water:ethanol Nafion®
solution for 30 minutes. The amount of Nafion® in the catalyst ink was 15% of the
catalyst weight.
The fuel cell setup used to test the MEAs is shown schematically in Figure 3-3. The cell
body was made of two graphite blocks each with 3 cm x 3 cm parallel flow fields. The
temperature of the cell was controlled by heating pads located at both sides of the cell
body. Operating temperatures were 20, 40 and 60 ºC. Aqueous 1M methanol solution was
pumped into the anode at a rate of ca. 7 mL min-1
using a Watson Marlow 101U/R pump.
Air or oxygen was fed to the cathode side at a rate of approximately 300 mL min-1
. Gas
flow rate was controlled manually by appropriate flow meters (Platon (RM&C), U.K) and
was fed at atmospheric pressure.
TT
CA
TH
OD
E
AN
OD
E
METHANOLAIR /
OXYGEN
M
E
A
Flow meterPump
Figure 3-3: Schematic diagram of the direct methanol fuel cell experimental setup.

36
3.6. Cyclic voltammetry and Tafel analysis
3.6.1. Cyclic voltammetry
The electrochemical behavior of a system can be obtained by recording the current-time
curves at different potentials. Information can be obtained in a single experiment, by
sweeping the potential with time and recording the current-potential curve. This method
is known as Linear Sweep Voltammetry (LSV). By switching the direction of the scan at
a certain potential (switching potential) and carrying out the reverse experiment of the
LSV the so called Cyclic Voltammetry (CV) is obtained. CV is one of the most
commonly used methods for the study of electrochemical systems. The cyclic
voltammogram of a given electrode without any active species in the electrolyte results in
a current-potential curve characteristic for the electrode material used [4, 5]. Cyclic
voltammetry was the main electrochemical method used to characterise the synthesized
catalysts.
Cyclic voltammetry in oxygen free electrolyte was used to characterise short term
stability of catalysts, to quantify the electrochemical surface area (ECSA) and, together
with XRD analysis, to determine whether a new metal phase was formed in the study of
alloy catalysts. As previously mentioned the cyclic voltammogram of a given electrode
without active species in the electrolyte is characteristic for each electrode material.
Therefore, the modification of the electrode material, for instance by alloying it with
another metal, would lead to a change in the current-potential curve recorded. Short term
stability and electrochemical surface area studies are both based on the surface area of the
catalysts determined from the cyclic voltammogram.
For palladium electrodes, in contrast with platinum, the charge of a monolayer of
adsorbed hydrogen is difficult to determine due to the ability of bulk palladium to absorb
hydrogen [6, 7]. Therefore, the electrochemical surface area was calculated from the
charge of the monolayer of chemisorbed oxygen, which was estimated from the area of
the palladium oxide reduction peak. The charge of the oxygen monolayer (QO) for a
37
smooth palladium electrode is twice as large as the hydrogen monolayer (QH) in
platinum, QH = ½ QO (QH = 210 µC cm-2
) [6, 8, 9]. When the values of the
electrochemical surface area (the area of the Pd-O reduction peak) decreased by a
significant fraction with each successive potential cycle the catalyst was said not to have
short term stability.
Electrochemical surface area (ECSA) was quantified from slow scan voltammograms, at
scan rate 5 mV s-1
. Electrode conditioning consisted of ten cycles at scan rate 50 mV s-1
,
after this slow voltammograms were recorded. Different potential ranges were selected
depending on the scan rate. Initial 10 cyclic voltammetries in N2 saturated electrolyte
were performed between 0.04 and 1.24 V vs Normal Hydrogen Electrode (NHE); when
the scan rate was 5 mV s-1
the potential range was between 0.07 and 1.24 V vs NHE.
Open circuit potential of the cell was taken as initial potential, ca. 0.8 V, the first and
second switching potentials were 1.24 and 0.04 or 0.07 V, respectively, and the final
potential was 1.24 V.
The activity towards the ORR was evaluated by CV in O2 saturated electrolyte. A cyclic
voltammogram was recorded in O2 saturated 0.5 M H2SO4 electrolyte at scan rate
1 mV s-1
. The open circuit potential (OCP) of the cell was measured when the electrode
was immersed in the O2 saturated electrolyte. The first scan or LSV was recorded by
holding the electrode at a potential 50 mV higher than the OCP for 10 s and then,
immediately after, sweeping the potential at 1 mV s-1
towards lower potentials, to 0.25 V.
The second scan or backward LSV started from 0.25 V sweeping the potential at 1 mV s-1
up to the OCP potential plus 50 mV. All parameters reported were obtained from the
backward LSV.
3.6.2. Tafel analysis
The kinetic current density or current density in absence of mass transport effect, ik, is a
function of the exchange current density, i0, this relationship can be expressed by the
Butler-Volmer equation as [10]:

38
RT
F
RT
Fii ac
k expexp0
(3.1)
Where ik is the overall current density, i0 is the exchange current density (in A m-2
) η is
the overpotential, and α is the transfer coefficient.
The relationship between the overall current density, i, and the currents with and without
mass transport effects is expressed by the well known Koutecky-Levich equation
(Equation 3.2):
lk iii
111 (3.2)
Koutecky-Levich equation can be solved for the kinetic current and expressed as:
ii
iii
L
Lk
(3.3)
Substituting Equation 3.3 in the Butler-Volmer equation:
RT
F
RT
Fi
ii
ii ac
L
L expexp0 (3.4)
For large negative overpotentials the second term, exp(αaFη/RT), becomes negligible and
Equation 3.4 becomes the Tafel form:
RT
Fi
ii
ii
L
L exp0 (3.5)
39
Rearranging Equation 3.5:
ii
ii
F
RTi
F
RT
L
Llnln 0
(3.6)
The relationship between overpotential and current densities at high overpotentials when
the system is not mass transfer affected is given by Tafel as:
ii
iiba
L
Llog (3.7)
From Equations 3.6 and 3.7 we obtain the empirical Tafel constants:
0log3.2
iF
RTa
(3.8)
F
RTb
3.2 (3.9)
Plots of log i vs η are known as Tafel plots, they are useful tools to evaluate kinetic
parameters. Tafel plots generate a linear region of slope b. From b the transfer
coefficient, α, can be calculated using Equation 3.9. When the linear region is
extrapolated to zero overpotential log i0 is obtained.
Data points for Tafel analysis of the kinetically controlled region were taken from the
near-steady-state voltammograms, with linear sweep voltammetries at scan rate 1 mV s-1
.
To determine Tafel data parameters (Equation 3.7) log(iLxi/iL-i) vs η data were plotted.
Tafel parameters were obtained by adjusting the straight line to the linear region of the
plot (minimum correlation coefficient of 0.995).
40
3.7. Rotating disc electrode and Koutecky-Levich plots
The Rotating Disc Electrode (RDE) provides a well defined hydrodynamic regime when
used in the study of the kinetics of electrode reactions. The use of RDE allows passing a
controllable flow of electrolyte (containing dissolved oxygen) over the catalysts later on
the electrode. It was employed in the three electrode cell experiments. The RDE
employed in this study was an EDI101 from Radiometer Analytical, and consisted of a
flat glassy carbon disc embedded in a rod of PTFE. Rotation speeds of 400, 900, 1600,
2500 and 3600 rpm were selected to evaluate the kinetics and the mass transport effects.
The relationship between the overall current density and the currents with and without
mass transport effects is expressed by the previously cited Koutecky-Levich equation
(Equation 3.2).
The Koutecky-Levich equation can be also expressed as:
Bii k
111 (3.10)
Where ω is the rotation speed and B is a constant dependent on the oxygen diffusivity,
concentration and on the viscosity of the electrolyte [4]. Koutecký-Levich plots were
obtained representing i-1
vs ω-1/2
, where i is the overall current density and ω is the
rotation speed, at a given potential value. The extrapolation of the linear region of the
plots to infinite rotation speed allowed the determination of the kinetic current ik.
Activity for ORR of Pd/C catalysts was analyzed using the Koutecky-Levich plots. From
this analysis current densities in the absence of mass transport, ik, were obtained. Current
densities measured at five different rotation speeds, 400, 900, 1600, 2500 and 3600 rpm,

41
were presented for five different potential values. Data was obtained from slow scan
voltammograms, linear sweep voltammetries at scan rate 5 mV s-1
.
3.8. X-ray diffraction analyses
X-Ray Diffraction (XRD) crystallography was used to determine the crystal structure of
the catalysts, thus determining the formation of alloy. Changes in the crystal structure
compared to pure Pd were use to determinate whether or not an alloy was formed. Data
obtained from XRD diffractograms was used to calculate distances between atomic layers
in crystals and estimate the size of metal nanoparticles.
A broad peak at a 2 value around 25º, due to the carbon support [11], was present in
every spectrum. Data from diffraction peak corresponding Pd (220) crystal face, which
was considered not to be influenced by the presence of carbon, was employed in
calculations. Diffraction peaks of Pd (111), Pd (220) and Pd (331) might overlap with the
diffraction peak of the carbon support, therefore Pd (220) peak was chosen to evaluate
the size of supported Pd particles [12, 13].
X-ray diffraction analyses were carried out using a PANanalytical X'Pert Pro
diffractometer fitted with an X'Celerator and peak positions were analysed using the
X'Pert Data Viewer software. The radiation was Cu K-alpha, with λ = 1.54180 Å.
Analyses were performed by the Chemical Analysis Unit at Newcastle University.
The crystallite size, referred to as particle size, was calculated from the XRD data using
Scherrer equation [14]:
cos/ FWHMkD (3.11)
Where D is the particle diameter, in Å, k is the shape factor (k =0.89 for spherical
particles), FWHM is the full width of the peak at half maximum, λ is the wavelength

42
applied in the characterization and θ is the position at the maximum of diffraction. Both
FWHM and θ are expressed in radians.
The Pd-Pd bond distance, or nearest neighbour distance in the lattice, was calculated
using Braggs equation [14]:
nd sin2 (3.12)
Where d is the distance between atomic layers in crystals, expressed in Å, and n is an
integer (n =1).
3.9. Energy Dispersive X-Ray Analysis
Energy Dispersive X-Ray Analysis (EDXA) was used for the elemental analysis of the
samples. This technique was used to quantify the overall metal content in carbon
supported catalysts and to determine the atomic metal to metal ratio for bimetallic
electrocatalysts. This analytical technique relies on the investigation of interactions
between electromagnetic radiation and matter, analyzing X-rays emitted by the sample,
which are characteristic of each atomic structure, and therefore of each element [15].
Carbon supported metal nanoparticles were located in aluminium supports for the
analysis. The EDXA analyzer was a Rontec Edwin. Analyses were performed by the
Chemical Analysis Unit at Newcastle University.
3.10. Transmission electron microscopy analysis
Transmission Electron Microscopy (TEM) analysis were used to study particle size and
particle distribution on the carbon support. Carbon and metal particles have different
capacity to absorb electrons. This difference provides a contrast in the images which
allows the metal nanoparticles on the carbon support to be located. Metal particles appear
darker than carbon in TEM images [16].
43
Catalyst powder was suspended in deionised water; this mixture was located on 200 mesh
copper grids (Gilder Grids Ltd.) and dried on air. Images were obtained from a Philips
CM100 TEM with Compustage attached to a high resolution digital camera. Analyses
were performed by the Electron Microscopy Research Services at Newcastle University.
3.11. Catalysts preparation
3.11.1. Preparation of carbon-supported Pd nanoparticles
Electrocatalysts were prepared by reduction of the palladium precursor, ammonium
tetrachloropalladate (II), using different reducing agents; ethylene glycol (EG),
formaldehyde and sodium borohydride. The reduction with EG, using the polyol method
[17], was carried out under N2 flow to minimise the number of oxidized species in the
catalysts [18]. Synthesis with the other two reducing agents was carried out under air.
Further catalyst preparations were carried out using the polyol method and maintaining
an alkaline pH, in order to optimise the synthesis method. The carbon support used was
Vulcan XC-72R (Cabot), which was pre-treated in order to create acidic functionalities
on the carbon surface. These acid groups would increase the hydrophilic character of the
carbon and lead to a more uniform distribution of the Pd nanoparticles on the carbon
surface. Pre-treatment consisted of refluxing the carbon for 16 hours at 120 ºC in a
solution containing 7 mol dm-3
(M) of HNO3 [12]. Prior to metal deposition, pre-treated
carbon was thoroughly washed with deionised water until the pH was close to neutral.
3.11.2. Preparation using ethylene glycol as a reducing agent
Reduction of the palladium salt with ethylene glycol (EG) was carried out at five
different conditions. For the first procedure there was no pH control during the addition
of the palladium salt; the salt was dissolved in a 4:1 mixture of ethylene glycol and 0.1 M
aqueous NaOH solution. For the other four procedures the pH was adjusted to a certain

44
value (10, 11, 12 or 13) and kept constant during the addition of the aqueous Pd salt
solution. The pH was measured using a Jenway 3310 pH meter. Pd nanoparticles were
also deposited on untreated Vulcan XC-72R using EG at pH 11.
In the preparation, 40 cm3 (mL) of ethylene glycol (Aldrich, 99.8%), were mixed with 0.3
g of pre-treated Vulcan XC-72R under magnetic stirring and nitrogen flow. The pH of the
solution was adjusted, if applicable, with drops of 1 M NaOH (Aldrich, 98%) solution. 20
cm3of an aqueous solution containing 0.203 g of (NH4)2PdCl4 (Aldrich, 99.995%) were
added drop wise whilst maintaining a constant pH. The mixture was heated to 110 ºC and
refluxed for 3 hours. The system was continuously stirred overnight at room temperature.
The overall reduction of the palladium salt by ethylene glycol is shown in Equation 3.13.
This reaction is believed to yield palladium metal and CO2 adsorbed on the surface of the
metal particles [19]. This adsorbed CO2 may be further oxidized to CO2. The
intermediate products of the ethylene glycol oxidation would be aldehydes, which are not
very stable and would oxidize to glycolic and oxalic acid. The two carboxylic acids
would be further oxidized to CO2.
HPdCOPdOHC 6323 2
2
262 (3.13)
In each case, the carbon-supported palladium catalyst was separated by centrifuging and
extensively washed with water and acetone. The catalyst was dried at 100 ºC in air
overnight and the resulting solid was ground with a mortar. These materials were called
Pd/C-EG, Pd/C-EG10, Pd/C-EG11, Pd/C-EG12 and Pd/C-EG13 corresponding to no pH
control, pH 10, pH 11, pH 12 and pH 13 respectively. The Pd prepared on untreated
carbon was called Pd/C-EG11-untr. Part of each catalyst was further treated at 300 ºC
under H2 flow for 1 hour [11] and those materials were called Pd/C-EG-300, Pd/C-EG10-
300, Pd/C-EG11-300, Pd/C-EG12-300, Pd/C-EG13-300 and Pd/C-EG11-untr-300.
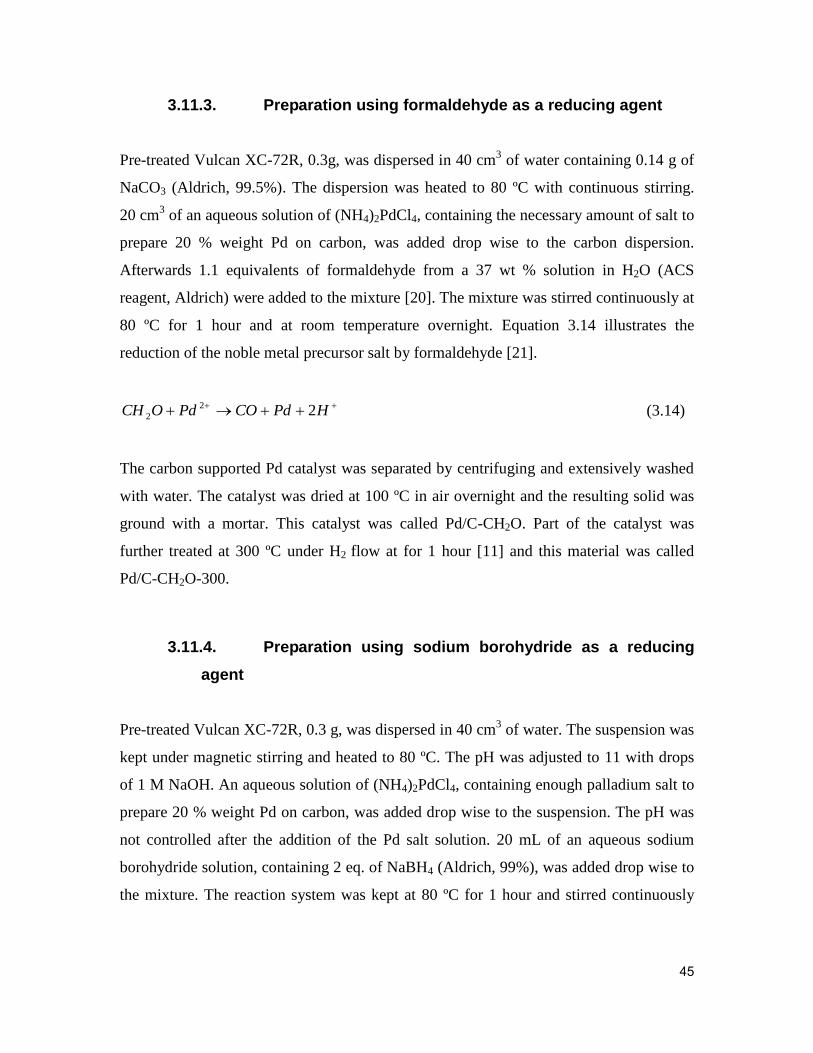
45
3.11.3. Preparation using formaldehyde as a reducing agent
Pre-treated Vulcan XC-72R, 0.3g, was dispersed in 40 cm3 of water containing 0.14 g of
NaCO3 (Aldrich, 99.5%). The dispersion was heated to 80 ºC with continuous stirring.
20 cm3 of an aqueous solution of (NH4)2PdCl4, containing the necessary amount of salt to
prepare 20 % weight Pd on carbon, was added drop wise to the carbon dispersion.
Afterwards 1.1 equivalents of formaldehyde from a 37 wt % solution in H2O (ACS
reagent, Aldrich) were added to the mixture [20]. The mixture was stirred continuously at
80 ºC for 1 hour and at room temperature overnight. Equation 3.14 illustrates the
reduction of the noble metal precursor salt by formaldehyde [21].
HPdCOPdOCH 22
2 (3.14)
The carbon supported Pd catalyst was separated by centrifuging and extensively washed
with water. The catalyst was dried at 100 ºC in air overnight and the resulting solid was
ground with a mortar. This catalyst was called Pd/C-CH2O. Part of the catalyst was
further treated at 300 ºC under H2 flow at for 1 hour [11] and this material was called
Pd/C-CH2O-300.
3.11.4. Preparation using sodium borohydride as a reducing
agent
Pre-treated Vulcan XC-72R, 0.3 g, was dispersed in 40 cm3 of water. The suspension was
kept under magnetic stirring and heated to 80 ºC. The pH was adjusted to 11 with drops
of 1 M NaOH. An aqueous solution of (NH4)2PdCl4, containing enough palladium salt to
prepare 20 % weight Pd on carbon, was added drop wise to the suspension. The pH was
not controlled after the addition of the Pd salt solution. 20 mL of an aqueous sodium
borohydride solution, containing 2 eq. of NaBH4 (Aldrich, 99%), was added drop wise to
the mixture. The reaction system was kept at 80 ºC for 1 hour and stirred continuously

46
overnight at room temperature [11]. The reduction in alkaline media of the palladium
precursor salt to Pd metal is illustrated in Equation 3.15 [22].
OHHBOPdOHPdBH 22
3
3
2
4 32262 (3.15)
The carbon supported Pd catalyst was separated by centrifuging and extensively washed
with water. The catalyst was dried at 100 ºC in air overnight and the resulting solid was
ground with a mortar. This catalyst was called Pd/C-NaBH4. Part of the catalyst was
further treated at 300 ºC under H2 flow for 1 hour and this material was called Pd/C-
NaBH4-300.
3.11.5. Preparation of carbon-supported bimetallic
nanoparticles
Catalysts were prepared by reduction of the precursor salts on Vulcan XC-72R, using
either ethylene glycol (EG) or hydrogen as reducing agent. A portion of the catalysts
prepared by EG reduction were treated at 300 ºC under H2 to study the effect of heat
treatment. Precursors used for Pd, Au, Co, Fe and Ti were ammonium
tetrachloropalladate (II) (99.995%, Sigma-Aldrich), gold (III) chloride trihydrate
(99.99%, Sigma-Aldrich), cobalt (II) nitrite hexahydrate (98%, Sigma-Aldrich), iron (III)
chloride hexahydrate (98%, Fluka) and titanium (IV) propoxide (98%, Sigma-Aldrich),
respectively.
At least two different atomic ratios were selected for each bimetallic combination; 1:1,
3:1 and 9:1 for Pd-Au, 1:1 and 4:1 for Pd-Co, 1:1 and 3:1 for Pd-Fe and 1:1 and 9:1 for
Pd-Ti. Also two different synthetic procedures were chosen for preparations;
simultaneous co-deposition of both metals on the carbon support and deposition of the
second metal on carbon-supported Pd, Pd/C. The Pd/C was prepared by EG reduction at
pH 11 following the procedure described in chapter 4. All catalysts prepared by co-

47
deposition were initially prepared with a 20% weight metal content; catalysts prepared on
Pd/C were prepared on Pd/C 20% weight, therefore the metal content was higher.
Palladium-gold and palladium-cobalt catalysts were exclusively synthesized by EG
reduction. Catalysts prepared were named PdAu-EG11, PdAu-EG11-300, Pd9Au-EG11
and Pd9Au-EG11-300 when they were prepared by co-deposition of both precursors, and
Pd(Au)-EG11, Pd(Au)-EG11-300, Pd3(Au)-EG11 and Pd3(Au)-EG11-300 when they
were prepared on Pd/C. Pd-Co catalysts were called PdCo-EG11, PdCo-EG11-300,
Pd3Co-EG11 and Pd3Co-EG11-300 when prepared by co-deposition, and Pd(Co)-EG11,
Pd(Co)-EG11-300, Pd3(Co)-EG11 and Pd3(Co)-EG11-300 when prepared on Pd/C.
Palladium-iron and palladium-titanium catalysts were initially prepared following the co-
deposition procedure by EG reduction; PdFe-EG11, PdFe-EG11-300, Pd3Fe-EG11, and
Pd3Fe-EG11-300 and PdTi-EG11, PdTi-EG11-300, Pd9Ti-EG11 and Pd9Ti-EG11-300
respectively. The second collection of these bimetallic catalysts was prepared by reducing
its precursor salts in H2 at high temperature, following both the co-deposition and
deposition on Pd/C procedures. The temperature of the furnace was 500 ºC for Pd-Fe [23]
and 900 ºC for Pd-Ti [24]. Catalysts were named PdFe-H2-500, Pd3Fe-H2-500, Pd(Fe)-
H2-500 and Pd3(Fe)-H2-500, and PdTi-H2-900, Pd(Ti)-H2-900, Pd9Ti-H2-900 and
Pd9(Ti)-H2-900 for palladium-iron and palladium-titanium bimetallic catalysts,
respectively.
Reductions by EG were carried out using the polyol method [17] under N2 flow to
minimise the number of oxidized species in the catalyst [18]; the pH of the reaction
system was kept constant at 11, which was concluded in the previous chapter to be the
optimum pH value for the synthesis of carbon-supported Pd nanoparticles. The carbon
support used was Vulcan XC-72R, which was used as received. A typical synthesis using
ethylene glycol as a reducing agent was described in section 3.11.2.
Pd-Fe and Pd-Ti catalysts prepared by reduction in H2 atmosphere were synthesized as
follows. Precursor salts (the necessary amount to prepare catalysts with 20 % metal

48
content) were dissolved in deionised water. Carbon black, 0.3 g per 60 mL of water, was
suspended in the solution. The solvent was evaporated overnight at 60 ºC under
continuous stirring. The dried solid was placed in a boat and treated in the furnace under
H2 flow, 40 mL min-1
, during 2 hours at 500 and 900 ºC for Pd-Fe and Pd-Ti respectively.
For catalysts prepared on Pd/C, the latter was suspended in a solution containing the
second metal salt. The amount of either iron or titanium precursor was calculated based
on the selected atomic ratio between the palladium and the second metal.
Table 3-1 summarises atomic ratios of Pd to metal, and synthetic methods selected for the
preparation of bimetallic catalysts. The key to the synthetic methods is given below. Each
carbon-supported catalyst was separated from the reaction solution by centrifuging and
was extensively washed with water and acetone. Catalysts were dried at 100 ºC in air
overnight. The resulting solid was ground with a mortar and a portion of each catalyst
was treated at 300 ºC under H2.
Table 3-1: Nominal atomic ratios and synthetic methods used in the preparation of bimetallic
catalysts.
Catalyst Atomic
ratio
Synthetic
method
Pd-Au
1:1
3:1
9:1
EG-pH11, EG-pH11-300, Pd/C + EG-pH11, Pd/C + EG-pH11-300
EG-pH11, EG-pH11-300
Pd/C + EG-pH11, Pd/C + EG-pH11-300
Pd-Co 1:1
4:1
EG-pH11, EG-pH11-300, Pd/C + EG-pH11, Pd/C + EG-pH11-300
EG-pH11, EG-pH11-300, Pd/C + EG-pH11, Pd/C + EG-pH11-300
Pd-Fe 1:1
3:1
EG-pH11, EG-pH11-300, H2-500, Pd/C + H2-500
EG-pH11, EG-pH11-300, H2-500, Pd/C + H2-500
Pd-Ti 1:1
9:1
EG-pH11, EG-pH11-300, H2-900, Pd/C + H2-900
EG-pH11, EG-pH11-300, H2-900, Pd/C + H2-900
The meaning of each synthetic method is the following: “EG-pH11”, reduction with
ethylene glycol at pH 11;“Pd/C + EG-pH11”, reduction with ethylene glycol at pH 11
using Pd/C as support; “-300”, heat treatment in H2 at 300 ºC; “H2-500” and “H2-900”,

49
reduction in H2 at 500 ºC and 900 ºC, respectively; “Pd/C + H2-500” and “Pd/C + H2-
900”, reduction in H2 at 500 ºC and 900 ºC using Pd/C as support, respectively (see also
Nomenclature).
50
References
1. Sandor, R.B.C., NC), Thornburg, Theodore S. (Harrisburg, NC),
Polybenzimidazole solutions. 1991, Hoechst Celanese Corporation (Charlotte,
NC): United States.
2. Hoel, D. and E. Grunwald, High protonic conduction of polybenzimidazole films
[3]. Journal of Physical Chemistry, 1977. 81(22): p. 2135-2136.
3. Li, Q., R. He, J.O. Jensen, and N.J. Bjerrum, PBI-Based Polymer Membranes for
High Temperature Fuel Cells - Preparation, Characterization and Fuel Cell
Demonstration. Fuel Cells, 2004. 4(3): p. 147-159.
4. Bard, A.J., Electrochemical Methods: Fundamentals and Applications. 2nd
edition ed. 2001: John Wiley & Sons, Inc.
5. Vielstich, W., H. Gasteiger, and A. Lamm, Handbook of fuel cells : fundamentals,
technology and applications. 2003, Chichester: Wiley. 4 v.
6. Breiter, M.W., Dissolution and adsorption of hydrogen at smooth Pd wires at
potentials of the alpha phase in sulfuric acid solution. Journal of Electroanalytical
Chemistry, 1977. 81(2): p. 275-284.
7. Mallát, T., É. Polyánszky, and J. Petró³, Electrochemical study of palladium
powder catalysts. Journal of Catalysis, 1976. 44(3): p. 345-351.
8. Lee, K., O. Savadogo, A. Ishihara, S. Mitsushima, N. Kamiya, and K.-i. Ota,
Methanol-Tolerant Oxygen Reduction Electrocatalysts Based on Pd-3D Transition
Metal Alloys for Direct Methanol Fuel Cells. Journal of the Electrochemical
Society, 2006. 153(1): p. A20-A24.
9. Suo, Y., L. Zhuang, and J. Lu, First-principles considerations in the design of Pd-
alloy catalysts for oxygen reduction. Angewandte Chemie - International Edition,
2007. 46(16): p. 2862-2864.
10. Scott, K., S. Pilditch, and M. Mamlouk, Modelling and experimental validation of
a high temperature polymer electrolyte fuel cell. Journal of Applied
Electrochemistry, 2007. 37(11): p. 1245-1259.
11. Zhang, L., K. Lee, and J. Zhang, Effect of synthetic reducing agents on
morphology and ORR activity of carbon-supported nano-Pd-Co alloy
electrocatalysts. Electrochimica Acta, 2007. 52(28): p. 7964-7971.

51
12. Guha, A., W. Lu, T.A. Zawodzinski Jr, and D.A. Schiraldi, Surface-modified
carbons as platinum catalyst support for PEM fuel cells. Carbon, 2007. 45(7): p.
1506-1517.
13. Wu, C., H. Zhang, and B. Yi, Hydrogen generation from catalytic hydrolysis of
sodium borohydride for proton exchange membrane fuel cells. Catalysis Today,
2004. 93-95: p. 477-483.
14. Cullity, B.D., Elements of X-Ray Diffraction. 1978: Addison-Wesley.
15. Garratt-Reed, A.J., Energy Dispersive X-ray Analysis in the Electron Microscope.
2003, London: BIOS Scientific Publishers.
16. Heidenreich, R.D., Fundamentals of transmission electron microscopy 1964, New
York: Interscience Publishers.
17. Larcher, D. and R. Patrice, Preparation of metallic powders and alloys in polyol
media: A thermodynamic approach. Journal of Solid State Chemistry, 2000.
154(2): p. 405-411.
18. Li, H., G. Sun, Y. Gao, Q. Jiang, Z. Jia, and Q. Xin, Effect of Reaction Atmosphere
on the Electrocatalytic Activities of Pt/C and PtRu/C Obtained in a Polyol
Process. Journal of Physical Chemistry C, 2007. 111(42): p. 15192-15200.
19. Bock, C., C. Paquet, M. Couillard, A. Botton Gianluigi, and R. MacDougall
Barry, Size-selected synthesis of PtRu nano-catalysts: reaction and size control
mechanism. Journal of the American Chemical Society, 2004. 126(25): p. 8028-
37.
20. Umeda, M., M. Kokubo, M. Mohamedi, and I. Uchida, Porous-microelectrode
study on Pt/C catalysts for methanol electrooxidation. Electrochimica Acta, 2003.
48(10): p. 1367-1374.
21. Ohtani, B., S. Ikeda, H. Nakayama, and S.I. Nishimoto, Shape- and size-selective
photocatalytic reactions by layered titanic acid powder suspended in deaerated
aqueous alcohol solutions. Physical Chemistry Chemical Physics, 2000. 2(22): p.
5308-5313.
22. Lee, D., S. Hwang, and I. Lee, One-step preparation and characterization of PtRu
(1:1)/C electrocatalysts by polyol method for polymer electrolyte fuel cells.
Journal of Power Sources, 2006. 160(1): p. 155-160.
52
23. Shao, M.-H., K. Sasaki, and R.R. Adzic, Pd-Fe Nanoparticles as Electrocatalysts
for Oxygen Reduction. Journal of the American Chemical Society, 2006. 128(11):
p. 3526-3527.
24. Fernández, J.L., V. Raghuveer, A. Manthiram, and A.J. Bard, Pd-Ti and Pd-Co-Au
Electrocatalysts as a Replacement for Platinum for Oxygen Reduction in Proton
Exchange Membrane Fuel Cells. Journal of the American Chemical Society,
2005. 127(38): p. 13100-13101.

53
Chapter 4: Characterization of carbon-supported Pd
nanoparticles
4.1. Introduction
The activity of carbon-supported palladium nanoparticles for the oxygen reduction
reaction (ORR) in acid electrolyte is reported in this chapter. Catalysts‟ crystal structure,
particle size and particle distribution on the carbon support were characterised by X-ray
diffraction analysis and transmission electron microscopy. Their electrochemical
characteristics were investigated by cyclic voltammetry in 0.5 M H2SO4.
Palladium nanoparticles were prepared on pre-treated Vulcan XC-72R. The carbon
support was subjected to acid treatment in order to modify the hydrophilic character of
the carbon surface [1]. Synthetic conditions which led to be best catalyst for ORR were
repeated on as-received Vulcan XC-72R, this new catalyst was also studied for
comparison.
An impregnation-reduction method was used for preparation of carbon-supported
palladium nanoparticles. Metal precursors were impregnated on the carbon support from
an aqueous solution and subsequently reduced. Three different reducing agents were
initially selected: ethylene glycol [2], formaldehyde [3] and sodium borohydride [4]
Ethylene glycol was chosen as a reducing agent, and the catalyst synthesis was optimized
by adjusting the pH of the system. All catalysts were physicochemically and
electrochemically characterized in order to determine the influence of the synthesis
method on their particle size, distribution and activity for the ORR.

54
The effect of heat treatment, under a reducing atmosphere (H2), on the catalyst particle
size was also studied. The effect of temperature in the range from room temperature to
300 ºC was also studied for a specific catalyst.
4.2. Physicochemical characterization of carbon-supported Pd
nanoparticles
4.2.1. EDXA and TEM characterization of carbon-supported Pd
nanoparticles
For all three catalysts prepared without pH control, the Pd contents estimated by EDXA
analyses were 21.7%, 18.7% and 19.1% by weight, for Pd/C-EG, Pd/C-CH2O and Pd/C-
NaBH4, respectively. According to the preparation procedure, complete deposition of Pd
precursor on the carbon would lead to a 20% weight palladium catalysts. Deviations from
the nominal value may be due to either carbon loss or incomplete Pd deposition on the
carbon surface. No further studies on the amount of Pd deposited on the carbon were
carried out for Pd/C-EG, Pd/C-CH2O and Pd/C-NaBH4.
Palladium contents for catalysts prepared by ethylene glycol reduction in basic media
were all greater than 20%. Average palladium weight percentages obtained from EDXA
analysis were between 24 and 34% (Table 4-1). This suggested an increase in carbon loss
when the reduction was carried out in the basic pH region. Since the pre-treated Vulcan
XC-72R employed in the synthesis had its surface functionalized with oxygen containing
groups with a different acidic characteristic [1], the alkalinity of the reaction system
could have favored the suspension, and subsequent loss, of the carbon support. TEM
images showed that not all the carbon had Pd nanoparticles deposited on its surface.
Therefore, it may be possible that during the washing stage some carbon particles, mainly
those without Pd nanoparticles, were removed. The catalyst supported on untreated
carbon black and prepared by EG reduction at pH 11, Pd/C-EG11-untr, had a palladium
content of 22.5%, closer to the nominal 20% by weight, which indicates a smaller carbon

55
loss during the preparation stages. This would support the hypothesis stated above that
the pre-treated carbon was more likely than the untreated to be removed during the
washing process.
Table 4-1: Particle size, ECSA and metal content for carbon-supported palladium catalysts.
Catalyst Particle size (nm) ECSA (m2 g
-1)
Metal content
(% weight)
Pd/C-EG 10.7 6.1 21.7
Pd/C-EG-300 21.8 2.0 21.7
Pd/C-CH2O 5.2 9.6 18.7
Pd/C-CH2O-300 18.1 3.1 18.7
Pd/C-NaBH4 11.7 4.4 19.1
Pd/C-NaBH4-300 18.8 2.4 19.1
Pd/C-EG10 5.8 11.7 26.5
Pd/C-EG11 5.7 15.4 34.1
Pd/C-EG12 7.7 10.6 29.2
Pd/C-EG13 5.8 15.3 23.6
Pd/C-EG11-untr 7.3 14.6 22.5
Pd/C-EG11-untr-rt 10.4 - 22.5
Pd/C-EG11-untr-100 11.2 - 22.5
Pd/C-EG11-untr-200 14.1 - 22.5
Pd/C-EG11-untr-300 16.5 - 22.5
Pd/C Etek 3.5 15.7 19.9
Pt/C Etek 3.4 55.3 19.8
Catalysts were examined by transmission electron microscopy. Every sample showed
agglomeration of metal particles. Figure 4-1A shows a TEM image of Pd/C-EG11.
Carbon-supported platinum catalyst was also prepared using EG reduction at pH 11.
Particles sizes of approximately 3.5 nm and a good distribution of the platinum
nanoparticles on the carbon support were obtained (Figure 4-1B). All palladium catalysts
exhibited significant agglomeration, for this reason particle size and particle size
distribution could not be studied from the TEM images. However, some individual

56
particles were measured from the TEM pictures and the observed size matched the sizes
obtained from the X-ray diffraction spectra. The least severe agglomeration was observed
for Pd/C-EG11.
Figure 4-1: TEM pictures of A) Pd/C-EG11 and B) Pt/C-EG11.
4.2.2. XRD characterization of carbon-supported Pd nanoparticles
The average Pd-Pd bond distance, d, was calculated for each carbon-supported palladium
catalyst prepared. Pd-Pd bond for Pd/C was found to have an average value of 0.2751
nm; the associated error was ± 0.0003 nm. This value matched the International Centre
for Diffraction Data (ICDD) data for palladium [5].
All carbon-supported palladium catalysts were characterised by X-Ray diffraction
spectrophotometry. The broad peak at a 2 value around 25º in each spectra was due to
the carbon support [4]. All samples showed peaks matching those of palladium face-
centered cubic (fcc) lattice. Diffraction patterns corresponding to palladium oxides were
not observed in any case. A portion of each prepared catalyst was heat treated under H2
atmosphere at 300 ºC to study the effect on the Pd nanoparticles. Every palladium

57
catalyst treated under H2 at 300 ºC exhibited larger Pd nanoparticles after this treatment.
Particle sizes are shown in Table 4-1.
Particle size and Pd-Pd bond distance, or nearest neighbour distance in the lattice, were
calculated from the XRD data using Scherrer (equation 3.11) and Bragg (equation 3.12)
equations [6], respectively. Peak (220), which was considered to not be influenced by the
presence of carbon, was used for calculations. Diffraction peaks of Pd (111), Pd (220) and
Pd (331) might overlap with diffraction peaks of the carbon support, therefore the Pd
(220) peak was chosen to evaluate the size of supported Pd particles [1, 7], values of
which are shown in Table 4-1.
Figure 4-2 shows XRD patterns corresponding to carbon-supported palladium catalysts
initially prepared using three different reducing agents, both before and after treatment in
H2 at 300 ºC. Smallest particles were obtained using formaldehyde as the reducing agent.
Particle sizes for Pd/C-EG and Pd/C-NaBH4 were similar to each other and much larger
than those of Pd/C-CH2O, as can be seen from a simple comparison of spectra peaks;
peaks corresponding to the face-centered cubic lattice of Pd were wider and shorter for
Pd/C-CH2O, which indicates smaller particles. When catalysts were treated at 300 ºC
under H2, particle growth was observed in every catalyst; peaks for treated catalysts were
higher and narrower. Larger growth was experienced by smaller palladium nanoparticles.
Those of Pd/C-CH2O increased from 5 nm diameter before heat treatment to 18 nm after,
and particles in Pd/C-EG and Pd/C-NaBH4 increased from 11 and 12 to 22 and 19 nm,
respectively. Commercial Pd/C from Etek was also characterized; it exhibited the
smallest Pd nanoparticles of all electrocatalysts characterized (3.5 nm) and suffered the
biggest sintering when heat treated under H2 (16 nm after treatment).
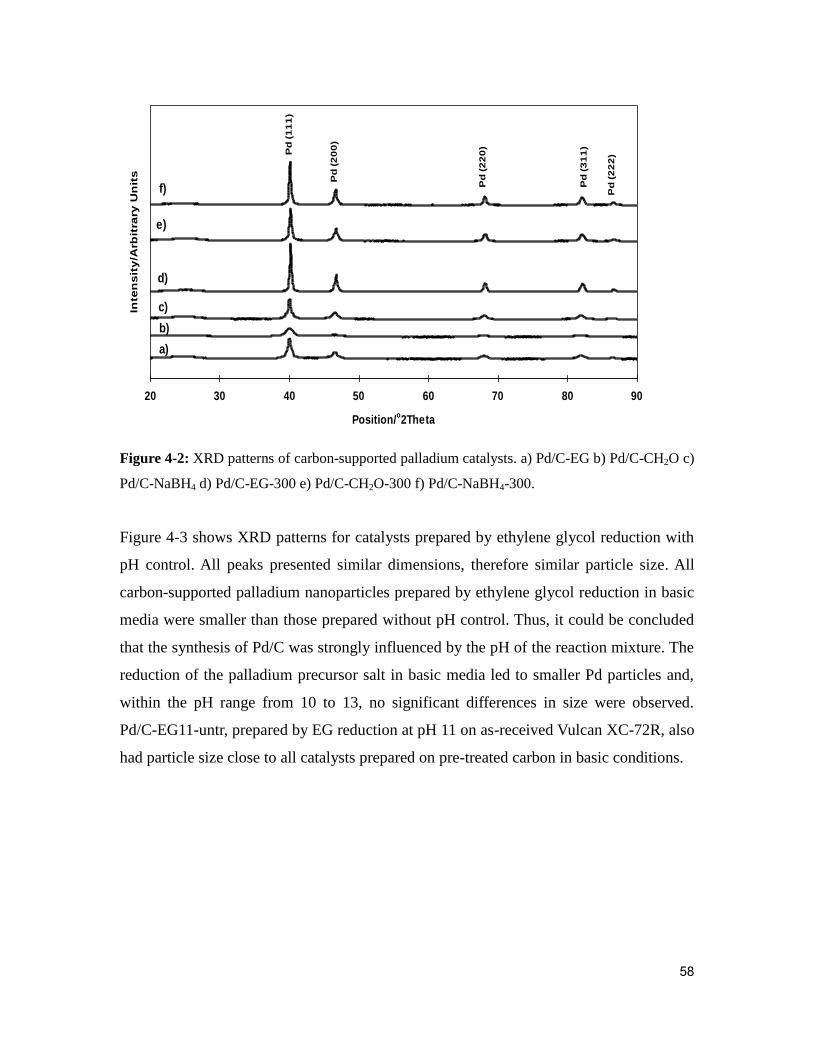
58
20 30 40 50 60 70 80 90
Position/o2Theta
Inte
ns
ity
/Arb
itra
ry U
nit
s
a)
f)
e)
d)
c)
b)
Pd
(1
11
)
Pd
(2
00
)
Pd
(2
20
)
Pd
(3
11
)
Pd
(2
22
)
Figure 4-2: XRD patterns of carbon-supported palladium catalysts. a) Pd/C-EG b) Pd/C-CH2O c)
Pd/C-NaBH4 d) Pd/C-EG-300 e) Pd/C-CH2O-300 f) Pd/C-NaBH4-300.
Figure 4-3 shows XRD patterns for catalysts prepared by ethylene glycol reduction with
pH control. All peaks presented similar dimensions, therefore similar particle size. All
carbon-supported palladium nanoparticles prepared by ethylene glycol reduction in basic
media were smaller than those prepared without pH control. Thus, it could be concluded
that the synthesis of Pd/C was strongly influenced by the pH of the reaction mixture. The
reduction of the palladium precursor salt in basic media led to smaller Pd particles and,
within the pH range from 10 to 13, no significant differences in size were observed.
Pd/C-EG11-untr, prepared by EG reduction at pH 11 on as-received Vulcan XC-72R, also
had particle size close to all catalysts prepared on pre-treated carbon in basic conditions.

59
20 30 40 50 60 70 80 90
Position / o2Theta
Inte
nsit
y / A
rbit
rary
Un
its
Pd (
111)
Pd (
222)
Pd (
311)
Pd (
220)
Pd (
200)
a)
d)
c)
b)
Figure 4-3: XRD patterns of carbon-supported palladium catalysts. a) Pd/C-EG10 b) Pd/C-EG11
c) Pd/C-EG12 d) Pd/C-EG13.
When catalysts prepared by ethylene glycol reduction with pH control were treated at 300
ºC under H2 they all exhibited particle growth. To study the effect of temperature on the
sintering of Pd nanoparticles small amounts of Pd/C-EG11 were treated under hydrogen
at 100, 200 and 300 ºC. XRD spectra of these catalysts are shown on Figure 4-4. Particle
size increased with increasing treatment temperature (Table 4-1). At 100 ºC the Pd
particle size increased from 6 to 11 nm, at 200 ºC to 14 nm and at 300 ºC to 17 nm. XRD
data indicated the presence of a single Pd metallic phase with a face-centered cubic
structure. Temperature treatment did not affect the metallic phase but clearly induced Pd
particle growth, as it was evident from the sharpening of the diffraction peaks (smaller
full width at half maximum of the peak leads to larger particle size according to Scherrer
equation). This particle growth with temperature has been previously reported in nitrogen
by Canton et al. [8] and in hydrogen by Jiang et al. [9].
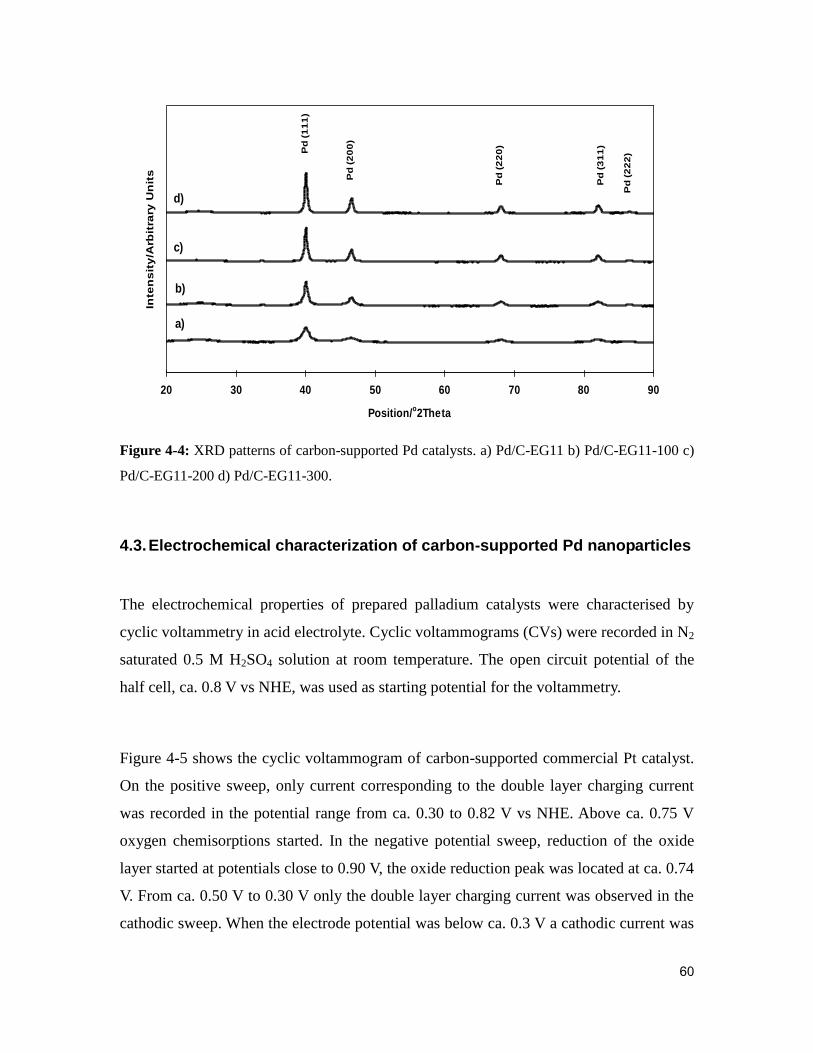
60
20 30 40 50 60 70 80 90
Position/o2Theta
Inte
ns
ity
/Arb
itra
ry U
nit
s
a)
d)
c)
b)P
d (
11
1)
Pd
(2
00
)
Pd
(2
20
)
Pd
(3
11
)
Pd
(2
22
)
Figure 4-4: XRD patterns of carbon-supported Pd catalysts. a) Pd/C-EG11 b) Pd/C-EG11-100 c)
Pd/C-EG11-200 d) Pd/C-EG11-300.
4.3. Electrochemical characterization of carbon-supported Pd nanoparticles
The electrochemical properties of prepared palladium catalysts were characterised by
cyclic voltammetry in acid electrolyte. Cyclic voltammograms (CVs) were recorded in N2
saturated 0.5 M H2SO4 solution at room temperature. The open circuit potential of the
half cell, ca. 0.8 V vs NHE, was used as starting potential for the voltammetry.
Figure 4-5 shows the cyclic voltammogram of carbon-supported commercial Pt catalyst.
On the positive sweep, only current corresponding to the double layer charging current
was recorded in the potential range from ca. 0.30 to 0.82 V vs NHE. Above ca. 0.75 V
oxygen chemisorptions started. In the negative potential sweep, reduction of the oxide
layer started at potentials close to 0.90 V, the oxide reduction peak was located at ca. 0.74
V. From ca. 0.50 V to 0.30 V only the double layer charging current was observed in the
cathodic sweep. When the electrode potential was below ca. 0.3 V a cathodic current was

61
recorded. This current was due to hydrogen adsorption on the platinum surface. At
potentials below ca. 0.02 V H2 gas evolved. After the scan reversion H2 molecules and
the layer of chemisorpted hydrogen were oxidized again [10].
-1.2
-1
-0.8
-0.6
-0.4
-0.2
0
0.2
0.4
0.6
0.8
1
-0.1 0 0.1 0.2 0.3 0.4 0.5 0.6 0.7 0.8 0.9 1 1.1 1.2 1.3
E / V (vs NHE)
j / m
A c
m-2
Hydrogen Region Double Layer Oxygen Region
H2 evolution
Pt-OH and Pt-O
formation
Pt-O
reductionPt-H formation
Pt-H oxidation
Figure 4-5: Cyclic voltammogram of Pt/C from E-Tek in N2 saturated 0.5 M H2SO4 solution at
room temperature, scan rate 10 mV s−1
.
A typical CV of the prepared Pd/C catalysts deposited on glassy carbon is shown in
Figure 4-6. The initial potential was the open circuit potential, ca. 0.8 V, and scans were
performed between potentials of 1.24 and 0.07 V, respectively; and the final potential was
1.24 V. On the positive sweep, only current corresponding to the double layer charging
current was recorded in the potential range from ca. 0.3 to 0.75 V vs NHE. Oxidation of
the palladium surface started at ca. 0.75 V and a small peak at ca. 1.04 V was also
observed; these results matched previous observations by Burke et al. [11, 12]. In the
negative potential sweep oxide reduction started at ca. 0.83 V with the peak positions
located at ca. 0.72 V. From ca. 0.55 V to 0.3 V only the double layer charging current was
observed in the cathodic sweep. When the electrode potential was below ca. 0.3 V a

62
cathodic current was recorded. Burke et al. [12] and Breiter [13] attributed this current to,
initially, hydrogen adsorption on the palladium surface and, at lower potentials, to the
dissolution of hydrogen in the bulk of the palladium.
-0.5
-0.4
-0.3
-0.2
-0.1
0
0.1
0.2
0.3
0.4
0 0.1 0.2 0.3 0.4 0.5 0.6 0.7 0.8 0.9 1 1.1 1.2 1.3
E / V (vs NHE)
j / m
A c
m-2
Hydrogen Region Double Layer Oxygen Region
H2 evolution
Pd-OH and Pd-O
formation
Pd-O
reduction
Qo
Figure 4-6: Cyclic voltammogram of Pd/C-EG11-untr in N2 saturated 0.5 M H2SO4 solution at
room temperature, scan rate 5 mV s−1
.
4.3.1. Palladium electrochemical dissolution in acid electrolyte
Palladium dissolution in sulphuric acid solution was reported to start at potentials close to
0.96 V in the anodic sweep by Rand et al. [14]. Thus, peaks corresponding to its anodic
dissolution could not be discriminated from the oxygen adsorption peaks in the
voltammogram at a scan rate 5 mV s-1
. After the initial fast cycling to condition the
electrodes, none of the prepared carbon-supported palladium catalysts presented evidence
of dissolution. Nevertheless, the dissolution rate depends on the metal surface area;
therefore catalysts with smaller metal particles, which mean higher surface area per gram
of metal, would dissolve faster. Evidence of dissolution was seen in the fast scan cyclic
voltammograms recorded for the commercial Pd/C, which had a particle diameter of

63
approximately half the diameter of the Pd/C-EG11-untr (3.5 compared to 7 nm,
respectively). Figure 4-7 shows voltammograms corresponding to 80 cycles at scan rate
50 mV s-1
of a commercial Pd/C (Etek) electrode. A dissolution peak at ca. 0.96 V could
not be differentiated, but the loss of electrochemical surface area was dramatic, which
could be appreciated after each single cycle. Palladium dissolution during the electrode
conditioning, also called electrochemical activation, of palladium nanoparticles in 0.5 M
H2SO4 was also reported by Solla-Gullón et al. [15].
Whilst voltammograms in N2 saturated 0.5 M H2SO4 were recorded, N2 was being
bubbled into the electrolyte. The stirring caused by these bubbles in the solution would
remove some dissolved metal from the vicinity of the electrode surface; this together with
the large volume of electrolyte, would cause a low re-deposition rate at lower potentials
in the cathodic sweep. Re-deposition of dissolved Pd was reported by Rand et al. to occur
at potentials close to 0.7 V in the cathodic sweep [14]. Therefore, due to the small re-
deposition rate of Pd, the current generated by this would not have been large enough to
be discriminated from the oxygen desorption peak, at ca. 0.7 V.
Figure 4-7: Cyclic voltammogram of commercial Pd/C (Etek) in N2 saturated 0.5 M H2SO4
solution at room temperature, scan rate 50 mV s−1
. The plot shows the first 80 potential cycles of
the electrode.

64
The electrode conditioning consisted of ten cycles between 0.04 and 1.24 V vs NHE
using a scan rate of 50 mV s-1
. All Pd/C catalysts presented a stable voltammogram after
the ten cycles, but the commercial Pd/C (Etek) did not. Nonetheless, the slow scan cyclic
voltammogram of the commercial Pd/C, recorded straight after the conditioning, was
used for comparison despite its instability.
4.3.2. Quantification of the electrochemical surface area
In contrast to platinum, it was difficult to determine the charge of a monolayer of
adsorbed hydrogen on a Pd catalyst due to the capacity of palladium to absorb hydrogen
[13, 16]. Therefore, quantification of the electrochemical surface area (ECSA) was made
using the oxygen desorption peaks as explained in Chapter 3.
There was a large difference in the ECSA for the commercial Pd/C catalyst compared to
those of catalysts prepared without pH control. This can be easily seen in Figure 4-8 from
the difference in the palladium oxide reduction peak sizes. For commercial Pd/C catalyst
ECSA was 16 m2
g-1
, whilst for Pd/C-CH2O, Pd/C-EG and Pd/C-NaBH4 calculated values
were 10, 6 and 4 m2
g-1
, respectively. Electrochemical surface area values were in
agreement with palladium particle sizes calculated from the XRD diffractograms, smaller
particles lead to higher surface areas.

65
-0.5
-0.4
-0.3
-0.2
-0.1
0
0.1
0.2
0.3
0.4
0 0.1 0.2 0.3 0.4 0.5 0.6 0.7 0.8 0.9 1 1.1 1.2 1.3
E / V (vs NHE)
j /
mA
cm
-2
Pd/C-NaBH4
Pd/C-EG
Pd/C-HCOH
Pd/C Etek
Figure 4-8: Cyclic voltammograms of Pd/C catalysts prepared using three different reducing
agents, EG, CH2O and NaBH4.
In Figure 4-8 it can be seen that the maximum of the oxide reduction peak is positioned at
different potentials for different Pd catalysts. Potential values were approximately 0.70 V
for Pd/C Etek, 0.72 V for Pd/C-CH2O and 0.74 V for Pd/C-EG and Pd/C-NaBH4 vs NHE.
The shift in potentials was believed to be related to the size of the palladium particles;
smaller palladium particles exhibit the maximum current of the oxide reduction peak at
lower potentials. This behavior has been previously reported by Zeng et al. for carbon-
supported platinum nanoparticles [17]. The Pt oxide reduction peak was reported to shift
progressively to negative potentials with a decrease in the size of platinum particles.
Mukerjee et al. attributed this behavior to stronger adsorption of the OH groups in
smaller particles, caused by an increase in low coordination sites with the decrease of the
particle diameter [18].
As reported above, Pd/C-CH2O, Pd/C-EG and Pd/C-NaBH4 gave ECSA values of 10, 6
and 4 m2 g
-1, and their particle sizes were 5, 11 and 12 nm, respectively. Pd/C-CH2O gave
the highest ECSA, however its activity towards ORR was low, as discussed in Section
4.4. Pd/C-NaBH4 had both low ECSA and activity for ORR. Pd/C-EG gave an ECSA
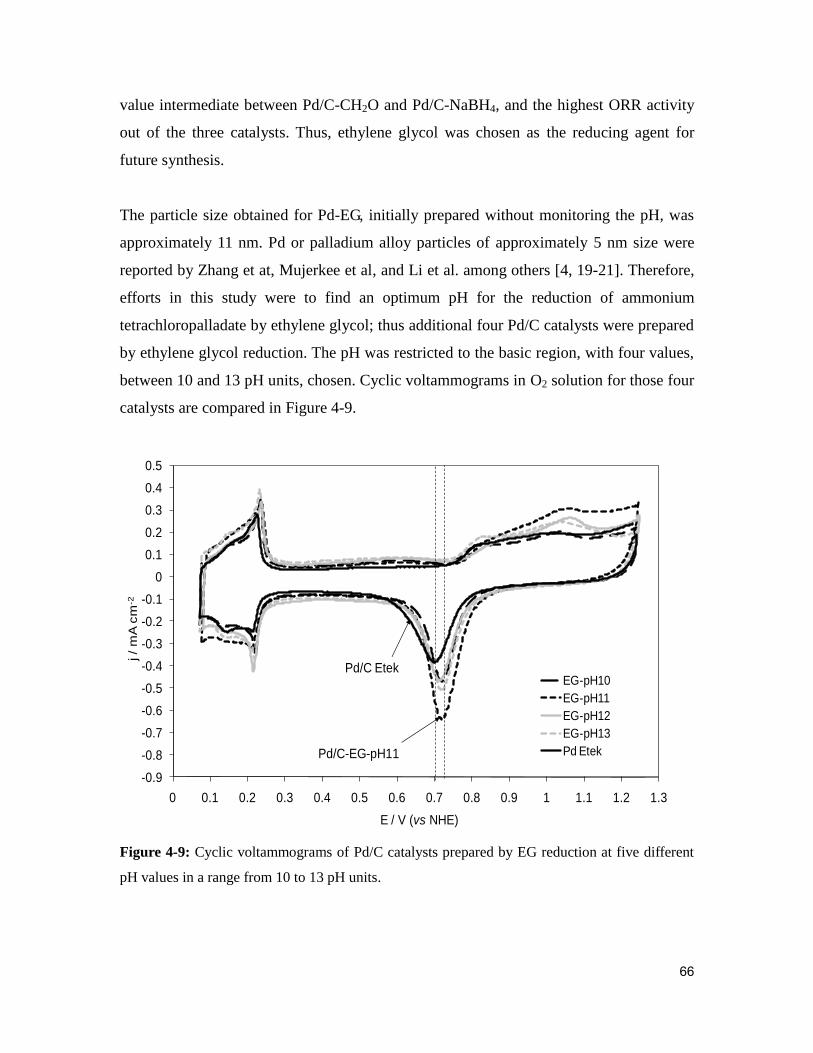
66
value intermediate between Pd/C-CH2O and Pd/C-NaBH4, and the highest ORR activity
out of the three catalysts. Thus, ethylene glycol was chosen as the reducing agent for
future synthesis.
The particle size obtained for Pd-EG, initially prepared without monitoring the pH, was
approximately 11 nm. Pd or palladium alloy particles of approximately 5 nm size were
reported by Zhang et at, Mujerkee et al, and Li et al. among others [4, 19-21]. Therefore,
efforts in this study were to find an optimum pH for the reduction of ammonium
tetrachloropalladate by ethylene glycol; thus additional four Pd/C catalysts were prepared
by ethylene glycol reduction. The pH was restricted to the basic region, with four values,
between 10 and 13 pH units, chosen. Cyclic voltammograms in O2 solution for those four
catalysts are compared in Figure 4-9.
-0.9
-0.8
-0.7
-0.6
-0.5
-0.4
-0.3
-0.2
-0.1
0
0.1
0.2
0.3
0.4
0.5
0 0.1 0.2 0.3 0.4 0.5 0.6 0.7 0.8 0.9 1 1.1 1.2 1.3
j /
mA
cm
-2
E / V (vs NHE)
EG-pH10
EG-pH11
EG-pH12
EG-pH13
Pd Etek
Pd/C Etek
Pd/C-EG-pH11
Figure 4-9: Cyclic voltammograms of Pd/C catalysts prepared by EG reduction at five different
pH values in a range from 10 to 13 pH units.
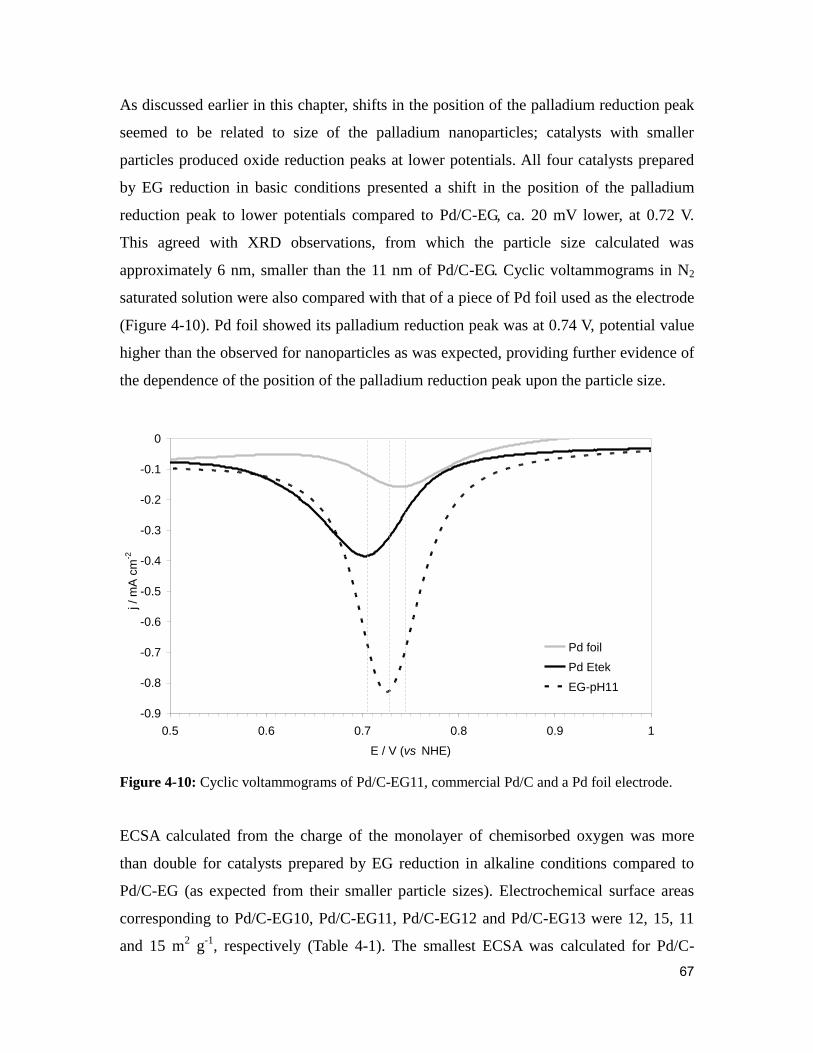
67
As discussed earlier in this chapter, shifts in the position of the palladium reduction peak
seemed to be related to size of the palladium nanoparticles; catalysts with smaller
particles produced oxide reduction peaks at lower potentials. All four catalysts prepared
by EG reduction in basic conditions presented a shift in the position of the palladium
reduction peak to lower potentials compared to Pd/C-EG, ca. 20 mV lower, at 0.72 V.
This agreed with XRD observations, from which the particle size calculated was
approximately 6 nm, smaller than the 11 nm of Pd/C-EG. Cyclic voltammograms in N2
saturated solution were also compared with that of a piece of Pd foil used as the electrode
(Figure 4-10). Pd foil showed its palladium reduction peak was at 0.74 V, potential value
higher than the observed for nanoparticles as was expected, providing further evidence of
the dependence of the position of the palladium reduction peak upon the particle size.
-0.9
-0.8
-0.7
-0.6
-0.5
-0.4
-0.3
-0.2
-0.1
0
0.5 0.6 0.7 0.8 0.9 1
E / V (vs NHE)
j /
mA
cm
-2
Pd foil
Pd Etek
EG-pH11
Figure 4-10: Cyclic voltammograms of Pd/C-EG11, commercial Pd/C and a Pd foil electrode.
ECSA calculated from the charge of the monolayer of chemisorbed oxygen was more
than double for catalysts prepared by EG reduction in alkaline conditions compared to
Pd/C-EG (as expected from their smaller particle sizes). Electrochemical surface areas
corresponding to Pd/C-EG10, Pd/C-EG11, Pd/C-EG12 and Pd/C-EG13 were 12, 15, 11
and 15 m2 g
-1, respectively (Table 4-1). The smallest ECSA was calculated for Pd/C-

68
EG12, which had the largest particle size of 8 nm compared to 6 nm for the other three.
The two catalysts with highest active areas were prepared at pH 11 and 13. This
information, together with the distribution of the nanoparticles on the carbon surface and
the kinetic parameters obtained from the study of the ORR, led to the selection of the
synthesis method for carbon-supported nanoparticles for the ORR reaction in acid
electrolyte.
Carbon-supported palladium nanoparticles were also prepared on as-received Vulcan XC-
72R using ethylene glycol as a reducing agent at pH 11 (Pd/C-EG11-untr). The ECSA
calculated for Pd/C-EG11-untr was 15 m2 g
-1, the same ECSA value that the catalyst
prepared on pre-treated carbon (Table 4-1). Voltammograms of Pd/C-EG11-untr and
Pd/C-EG11 in oxygen free electrolyte are compared in Figure 4-11. The double layer
charging current and the area of the oxide reduction peak were larger for the catalyst
supported on pre-treated carbon due to the presence of functional groups on its surface
and the higher metal content (see Table 4-1), respectively. The hydrogen sorption-
desorption and the oxidation-reduction reactions of the Pd nanoparticles occurred at the
same potentials for both catalysts. Neither the physicochemical characteristics of the Pd
nanoparticles nor the activity towards ORR, as discussed in Section 4.4, of Pd/C-EG11-
untr catalyst showed significant differences to those for the Pd/C-EG11.

69
-0.8
-0.7
-0.6
-0.5
-0.4
-0.3
-0.2
-0.1
0
0.1
0.2
0.3
0.4
0.5
0 0.1 0.2 0.3 0.4 0.5 0.6 0.7 0.8 0.9 1 1.1 1.2 1.3
E / V (vs NHE)
j / m
A c
m-2
Pd/C-EG11-untr
Pd/C-EG11
Figure 4-11: Cyclic voltammograms of Pd/C catalysts prepared by EG reduction at pH 11 using
two different carbon supports, Vulcan XC-72R as-received and Vulcan XC-72R pretreated with
HNO3.
Particle size values estimated from XRD diffractograms indicated that catalyst heat
treatment, under H2 flow at 300 ºC, increased the size of Pd particles in every catalyst
prepared. The decrease in the ECSA is a direct consequence of the particle size growth,
and this decrease could be clearly observed when comparing voltammograms of the
treated and untreated catalysts. Figure 4-12, Figure 4-13 and Figure 4-14 show
voltammograms of catalysts prepared without pH control before and after heat treatment.

70
-0.3
-0.2
-0.1
0
0.1
0.2
0 0.1 0.2 0.3 0.4 0.5 0.6 0.7 0.8 0.9 1 1.1 1.2 1.3
E / V (vs NHE)
j /
mA
cm
-2
Pd/C-EG
Pd/C-EG-300
Figure 4-12: Cyclic voltammograms of Pd/C-EG and Pd/C-EG-300, before and after heat
treatment.
-0.5
-0.4
-0.3
-0.2
-0.1
0
0.1
0.2
0 0.1 0.2 0.3 0.4 0.5 0.6 0.7 0.8 0.9 1 1.1 1.2 1.3
E / V (vs NHE)
j /
mA
cm
-2
Pd/C-HCOH
Pd/C-HCOH-300
Figure 4-13: Cyclic voltammograms of Pd/C-CH2O and Pd/C-CH2O-300, before and after heat
treatment.
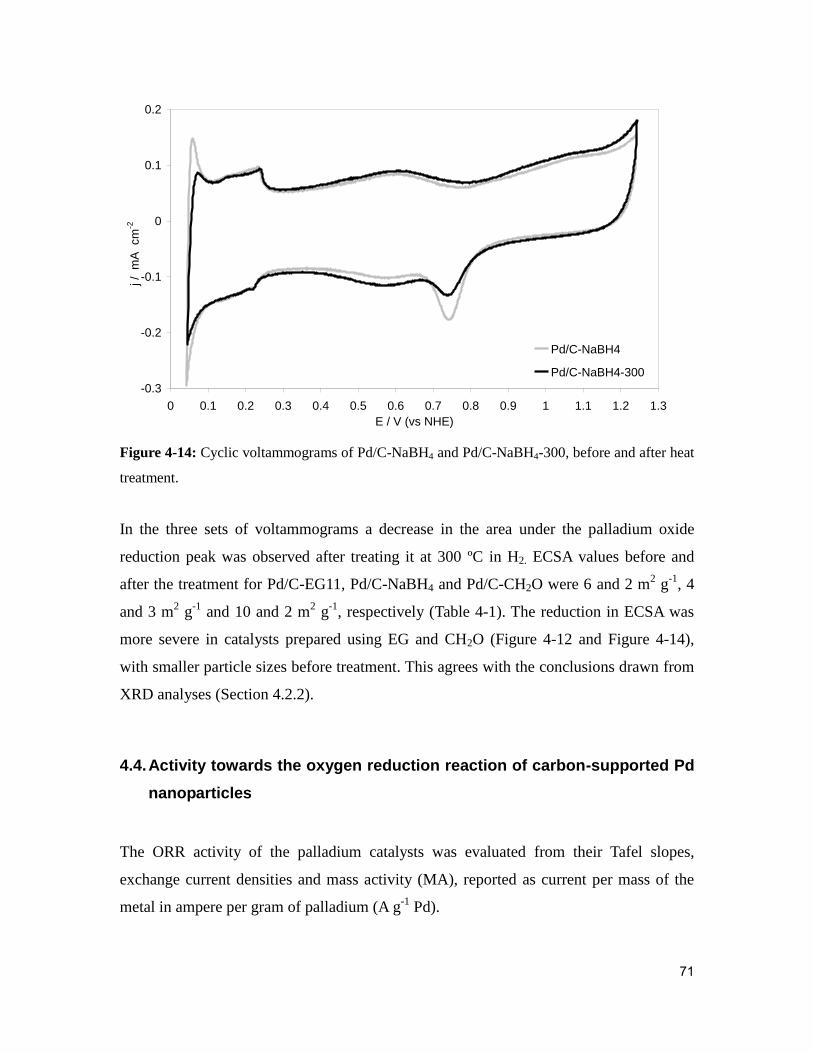
71
-0.3
-0.2
-0.1
0
0.1
0.2
0 0.1 0.2 0.3 0.4 0.5 0.6 0.7 0.8 0.9 1 1.1 1.2 1.3
E / V (vs NHE)
j /
mA
cm
-2
Pd/C-NaBH4
Pd/C-NaBH4-300
Figure 4-14: Cyclic voltammograms of Pd/C-NaBH4 and Pd/C-NaBH4-300, before and after heat
treatment.
In the three sets of voltammograms a decrease in the area under the palladium oxide
reduction peak was observed after treating it at 300 ºC in H2. ECSA values before and
after the treatment for Pd/C-EG11, Pd/C-NaBH4 and Pd/C-CH2O were 6 and 2 m2 g
-1, 4
and 3 m2 g
-1 and 10 and 2 m
2 g
-1, respectively (Table 4-1). The reduction in ECSA was
more severe in catalysts prepared using EG and CH2O (Figure 4-12 and Figure 4-14),
with smaller particle sizes before treatment. This agrees with the conclusions drawn from
XRD analyses (Section 4.2.2).
4.4. Activity towards the oxygen reduction reaction of carbon-supported Pd
nanoparticles
The ORR activity of the palladium catalysts was evaluated from their Tafel slopes,
exchange current densities and mass activity (MA), reported as current per mass of the
metal in ampere per gram of palladium (A g-1
Pd).
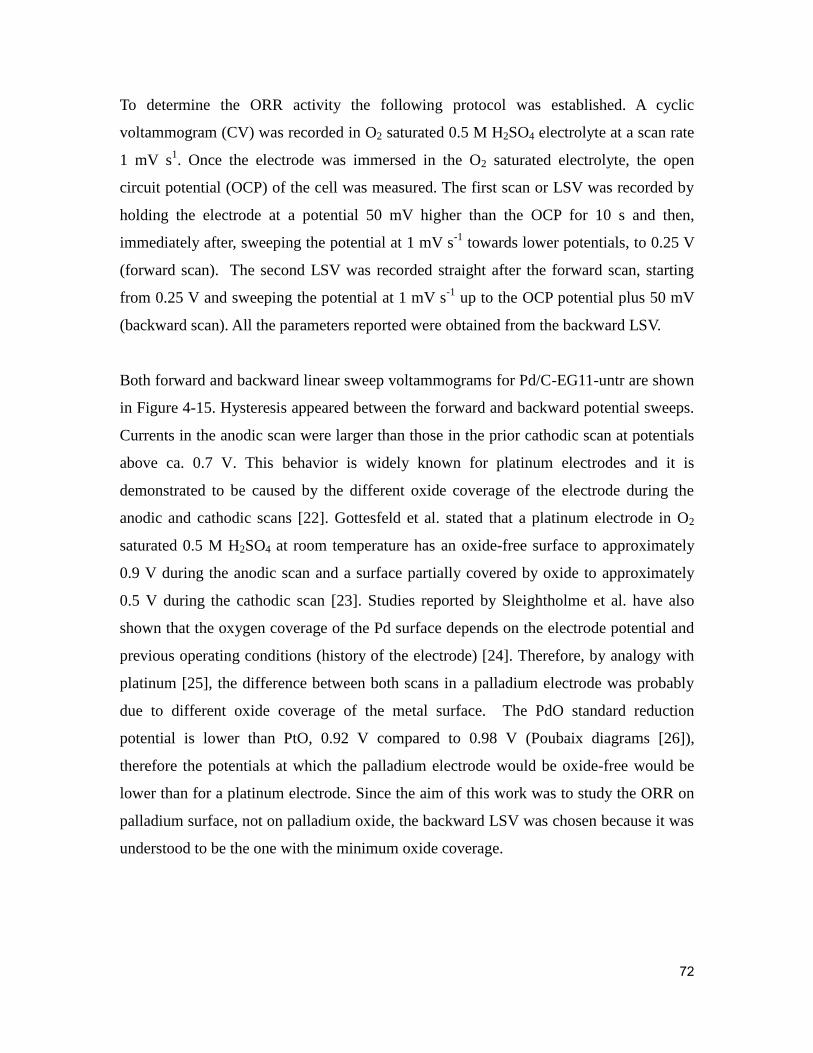
72
To determine the ORR activity the following protocol was established. A cyclic
voltammogram (CV) was recorded in O2 saturated 0.5 M H2SO4 electrolyte at a scan rate
1 mV s1. Once the electrode was immersed in the O2 saturated electrolyte, the open
circuit potential (OCP) of the cell was measured. The first scan or LSV was recorded by
holding the electrode at a potential 50 mV higher than the OCP for 10 s and then,
immediately after, sweeping the potential at 1 mV s-1
towards lower potentials, to 0.25 V
(forward scan). The second LSV was recorded straight after the forward scan, starting
from 0.25 V and sweeping the potential at 1 mV s-1
up to the OCP potential plus 50 mV
(backward scan). All the parameters reported were obtained from the backward LSV.
Both forward and backward linear sweep voltammograms for Pd/C-EG11-untr are shown
in Figure 4-15. Hysteresis appeared between the forward and backward potential sweeps.
Currents in the anodic scan were larger than those in the prior cathodic scan at potentials
above ca. 0.7 V. This behavior is widely known for platinum electrodes and it is
demonstrated to be caused by the different oxide coverage of the electrode during the
anodic and cathodic scans [22]. Gottesfeld et al. stated that a platinum electrode in O2
saturated 0.5 M H2SO4 at room temperature has an oxide-free surface to approximately
0.9 V during the anodic scan and a surface partially covered by oxide to approximately
0.5 V during the cathodic scan [23]. Studies reported by Sleightholme et al. have also
shown that the oxygen coverage of the Pd surface depends on the electrode potential and
previous operating conditions (history of the electrode) [24]. Therefore, by analogy with
platinum [25], the difference between both scans in a palladium electrode was probably
due to different oxide coverage of the metal surface. The PdO standard reduction
potential is lower than PtO, 0.92 V compared to 0.98 V (Poubaix diagrams [26]),
therefore the potentials at which the palladium electrode would be oxide-free would be
lower than for a platinum electrode. Since the aim of this work was to study the ORR on
palladium surface, not on palladium oxide, the backward LSV was chosen because it was
understood to be the one with the minimum oxide coverage.
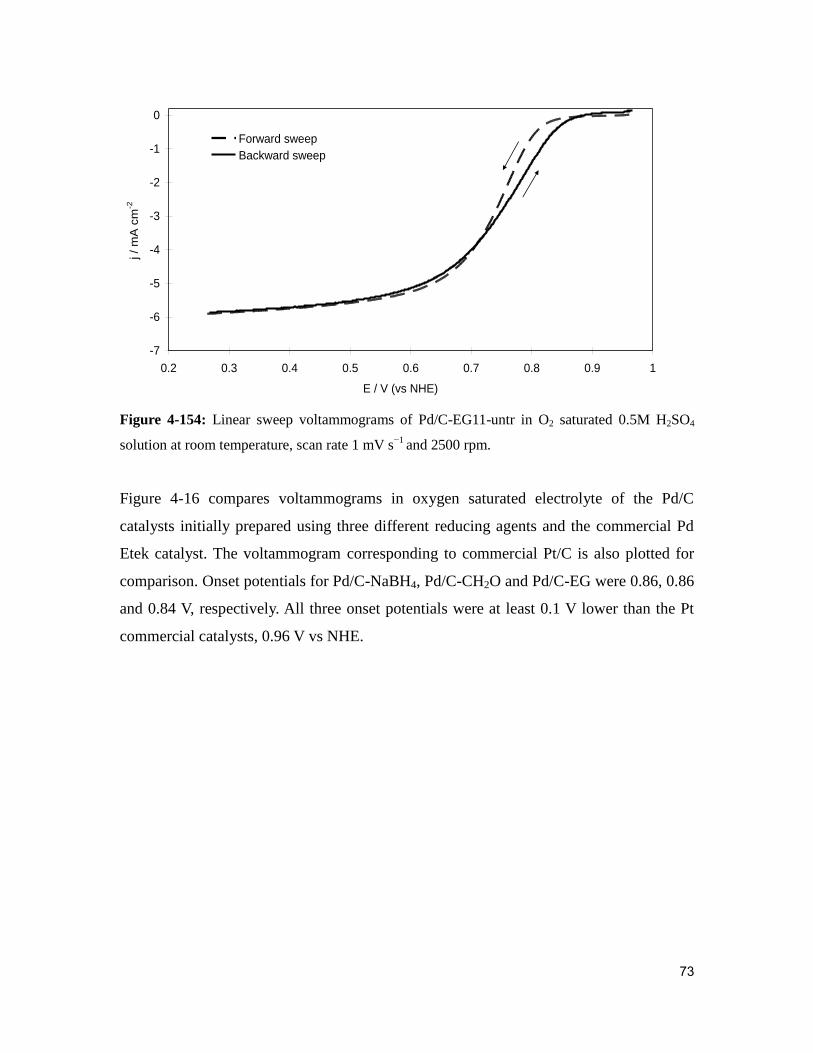
73
-7
-6
-5
-4
-3
-2
-1
0
0.2 0.3 0.4 0.5 0.6 0.7 0.8 0.9 1
E / V (vs NHE)
j / m
A c
m-2
Forward sweep
Backward sweep
Figure 4-154: Linear sweep voltammograms of Pd/C-EG11-untr in O2 saturated 0.5M H2SO4
solution at room temperature, scan rate 1 mV s−1
and 2500 rpm.
Figure 4-16 compares voltammograms in oxygen saturated electrolyte of the Pd/C
catalysts initially prepared using three different reducing agents and the commercial Pd
Etek catalyst. The voltammogram corresponding to commercial Pt/C is also plotted for
comparison. Onset potentials for Pd/C-NaBH4, Pd/C-CH2O and Pd/C-EG were 0.86, 0.86
and 0.84 V, respectively. All three onset potentials were at least 0.1 V lower than the Pt
commercial catalysts, 0.96 V vs NHE.

74
-7.0
-6.0
-5.0
-4.0
-3.0
-2.0
-1.0
0.0
1.0
0.2 0.3 0.4 0.5 0.6 0.7 0.8 0.9 1E / V (vs NHE)
j /
mA
cm
-2
Pd/C-NaBH4
Pd/C-HCOH
Pd/C-EG
Pd Etek
Pt Etek
Figure 4-16: Linear sweep voltammograms of Pd/C catalysts Pd/C-EG, Pd/C-CH2O and Pd/C-
NaBH4.
Mass activities of Pd/C-NaBH4, Pd/C-CH2O and Pd/C-EG were compared at 0.75 V,
where current densities were significant for all catalysts. The highest mass activity (MA)
at 0.75 V was exhibited by Pd/C-EG, 7 A g-2
Pd (Table 4-2), which was close to the MA
of Pd/C from Etek (9 A g-2
Pd) but still only approximately 15% of the MA of Pt/C from
Etek, 45 A g-2
Pd. The higher MA of Pd/C-EG compared to Pd/C-CH2O or Pd/C-NaBH4
could be attributed to a better distribution of the metal nanoparticles on the carbon
surface (therefore higher surface area), a consequence of the use of this milder reducing
agent. Similar behavior was reported for palladium-cobalt catalysts by Zhang et al. [4].

75
Table 4-2: Tafel slope, transfer coefficient, exchange current density and onset potential for
different carbon-supported Pd catalysts.
Figure 4-17 shows LSVs for the Pd/C catalysts prepared using EG as a reducing agent
and controlling the pH of the system. In every case the onset potential increased by
between 20 and 30 mV with respect to the catalyst prepared using EG without controlling
the pH of the system. Measured onset potentials were 0.88, 0.89, 0.89 and 0.87 V for
Pd/C-EG10, Pd/C-EG11, Pd/C-EG12 and Pd/C-EG13, respectively. Although there were
no significant differences in onset potentials between these four catalysts, highest onset
potentials recorded were for Pd/C-EG11 and Pd/C-EG12, 0.89 V. This was believed to be
due to the higher metal content of these two catalysts, 34 and 29% weight, respectively.
Mass activities, measured at 0.75V, were all more than double of the MA for Pd/C-EG,
and were all in the range between 16 and 20 A g-2
: Pd/C-EG11 being the highest at 20 A
g-2
Pd. This value was twice the MA of Pd/C from Etek, 9 A g-2
Pd, and nearly thrice that
of the MA of Pd/C-EG, but was much lower than 45 A g-2
of Pt/C from Etek.
Catalyst
Onset
potential
(V vs NHE)
Tafel slope
(mV dec-1
)
Transfer
coefficient
Exchange
current
density
(A cm-2
)
Mass
activity
at 0.75V
(A g-1
Pd)
Pd/C-EG 0.86 62 0.93 6.0 x 10⁻¹² 7.2
Pd/C-EG-300 0.83 60 0.96 8.5 x 10⁻¹² 2.9
Pd/C-CH2O 0.86 62 0.93 2.2 x 10⁻¹² 3.9
Pd/C-NaBH4 0.84 62 0.94 2.7 x 10⁻¹² 2.4
Pd/C-EG10 0.88 60 0.96 9.7 x 10⁻¹² 16.4
Pd/C-EG11 0.89 59 0.98 7.7 x 10⁻¹² 19.6
Pd/C-EG12 0.89 60 0.96 1.0 x 10⁻¹¹ 15.7
Pd/C-EG13 0.87 62 0.93 8.6 x 10⁻¹² 15.7
Pd/C-untr 0.89 59 0.98 1.0 x 10⁻¹¹
29.7
Pd/C Etek 0.86 64 0.90 5.2 x 10⁻¹² 8.8
Pt/C Etek 0.96 64
128
0.91
0.45
1.4 x 10⁻¹⁰
6.1 x 10⁻⁸
45.3

76
-7
-6
-5
-4
-3
-2
-1
0
1
0.2 0.3 0.4 0.5 0.6 0.7 0.8 0.9 1
E / V (vs NHE)
j /
mA
cm
-2
Pd EtekEG-pH13EG-pH10
EG-pH12EG-pH11Pt Etek
Figure 4-17: Linear sweep voltammograms of Pd/C catalysts Pd/C-EG10, Pd/C-EG11, Pd/C-
EG12 and Pd/C-EG13.
Mass activity of Pd/C-EG11 and Pd/C-untr were also measured at 0.80 V in order to
compare them with the available literature. Values were 7.8 and 9.4 A g-1
for Pd/C-EG11
and Pd/C-untr, respectively. Mass activity values for carbon-supported Pd nanoparticles
have been reported in the same range, 8.4 A g-1
Pd at 0.8 V, by Wang et al. [27]. On the
other hand, mass activity values over one order of magnitude larger than ours, ca. 230 A
g-1
at 0.80 V, have been reported by Shao et al. using a thinner catalysts layer (10 g
cm-2
) [28]. Different activities for different catalyst layer thickness illustrate the strong
influence of the thickness of the catalyst layer in fuel cells and this effect is discussed in
Chapter 6.
All palladium catalysts prepared by EG reduction in basic media presented improved
mass activities compared to the palladium catalyst prepared by EG reduction without pH
control. The distribution of metal particles on the carbon surface was better and the
diameter of palladium nanoparticles was smaller when alkaline conditions were used
during the synthesis. Higher distribution meant less agglomeration of the Pd
nanoparticles and lead to catalysts with higher active area; therefore higher mass

77
activities were recorded. The better distribution of palladium particles at basic pH was
already discussed in the section 4.3.2.
Tafel analysis of data points in the kinetically controlled region were taken from the near-
steady-state linear sweep voltammogramms at scan rate 1 mV s-1
. Data was corrected for
mass transport effects, using the correction parameter )/( iiii LL (where i represents
the current density at any potential and iL the limiting current density) [29].
Tafel plots were linear, with a minimum correlation coefficient of 0.995, over one order
of magnitude of the current density. In Figure 4-19A Tafel plots for Pd/C Etek, Pd/C-EG,
Pd/C-CH2O and Pd/C-NaBH4 are compared and Figure 4-19B shows Tafel plots for Pd/C
catalysts prepared by ethylene glycol reduction at different controlled pH values of the
system for Pd/C-EG10, Pd/C-EG11, Pd/C-EG12 and Pd/C-EG13. All plots were parallel
and all carbon-supported palladium catalysts exhibited Tafel slopes (b) ranging from 59
to 64 mV decade-1
. In the case of the Pt catalysts two Tafel slopes were observed. The
slope in the low current density region, between ca. 0.88 and 0.94 V, was 64 mV decade-1
and the slope in the high current density region, between ca. 0.72 and 0.87, was 128 mV
decade-1
. A non linear region was observed in the high current density region for the
palladium catalysts, as can be seen in Figure 4-18.

78
0.60
0.65
0.70
0.75
0.80
0.85
0.90
0.95
1.00
-4.5 -3.5 -2.5 -1.5 -0.5 0.5
log (ixiL/iL-i) / mA
E / V
(vs
NH
E)
Figure 4-18: Tafel plot for the Pd/C catalysts Pd/C-EG11.

79
0.65
0.70
0.75
0.80
0.85
0.90
-3 -2.5 -2 -1.5 -1 -0.5 0 0.5
log (ixiL/iL-i) / mA
E / V
(vs N
HE
)
Pd/C-EG
Pd/C-HCOH
Pd/C-NaBH4
Pd Etek
Linear (Pd/C-EG)Linear (Pd/C-HCOH)Linear (Pd/C-NaBH4)Linear (PdEtek)
A
0.65
0.70
0.75
0.80
0.85
0.90
-3 -2.5 -2 -1.5 -1 -0.5 0 0.5
log (ixiL/iL-i) / mA
E / V
(vs
NH
E)
Pd/C-EG11
Pd/C-EG12
Pd/C-EG10
Pd/C-EG13
Pd Etek
Linear (Pd/C-EG10)Linear (Pd/C-EG11)Linear (Pd/C-EG12)Linear (Pd/C-EG13)Linear (PdEtek)
B
Figure 4-19: Tafel plots for Pd/C catalysts A) Pd/C-EG, Pd/C-CH2O and Pd/C-NaBH4 B) Pd/C-
EG10, Pd/C-EG11, Pd/C-EG12 and Pd/C-EG13.
Tafel slopes of ca. 60 to 70 mV decade-1
have been previously reported for Pd and Pd
alloys in 0.5 M H2SO4 by Zhang, Gnanamutu, Hoare, Mustain, Savadogo and Tilak
among others [4, 30-34]. Damjanovic et al. reported that the mechanism of the ORR on a

80
palladium electrode is the same that the one taking place on a platinum electrode, since
both electrodes exhibited the same Tafel slope for the ORR. They also reported that the
low Tafel slope value for a platinum electrode, 60 mV decade-1
, corresponds to the
oxygen reduction taking place on a oxide-covered platinum electrode [25]. Thus, it was
concluded that all Tafel slopes reported in this piece of work for palladium catalysts
correspond to ORR on oxide-covered palladium electrodes. Tafel plots, potential versus
logarithm of current density, are shown in Figure 4-19.
Exchange current densities were obtained by extrapolating the Tafel line to the
equilibrium potential. The equilibrium potential value used was 1.21 V after correcting
the standard reduction potential for oxygen concentration, using the solubility value of O2
in 0.5 M H2SO4 (1.02 x 10⁻³
mol dm-3
[35]) and the Nernst equation. Exchange current
densities for Pd/C-EG, Pd/C-CH2O and Pd/C-NaBH4, were 6.0 x 10⁻¹²
, 2.2 x 10⁻¹²
and 2.7
x 10-12
A cm-2
, respectively (Table 4-2). Exchange current densities for Pd/C-EG10,
Pd/C-EG11, Pd/C-EG12 and Pd/C-EG13 were 9.7 x 10⁻¹²
, 7.7 x 10⁻¹²
, 1.0 x 10⁻¹¹
and 8.6
x 10-12
A cm-2
, respectively. Exchange current densities of catalysts synthesized
monitoring the pH were the same order of magnitude as values reported for palladium by
Gnanamuthu et al. and by Tilak et al. (10-11
A cm-2
) [30, 34], but over an order of
magnitude lower that the value reported by Savadogo et al. for palladium (2.2 x 10⁻¹⁰
A
cm-2
) [33]. All palladium catalysts prepared using ethylene glycol, had an exchange
current density of ca. 10-11
A cm-2
. The other two catalysts, Pd/C-CH2O and Pd/C-NaBH4,
exhibited exchange current densities closer to 10-12
A cm-2
. This would indicate that
physicochemical characteristics of palladium nanoparticles synthesized using
formaldehyde or sodium borohydride are less favorable than those synthesized using
ethylene glycol.
The ORR activity of catalysts reduced in a hydrogen atmosphere, i.e. Pd/C-EG-300 was
studied. A decrease in mass activity compared to Pd/C-EG was observed (7 to 3 A g-1
at
0.75V). This decrease was believed to be due to the loss of catalyst surface area caused
by particle growth during heat treatment. The exchange current density for Pd/C-EG-300
(8.5 x 10⁻¹²
A cm-2
Pd) was not significantly different to the other Pd/C synthesized using
81
ethylene glycol. Because all heat treated catalysts suffered a loss of ECSA compared to
the untreated catalyst, ORR activity studies for other treated catalysts were not carried
out.
Activity towards the oxygen reduction reaction of Pd/C-EG11-untr was also evaluated.
Pd/C-EG11 and Pd/C-EG11-untr presented similar particle sizes, calculated for the XRD
patterns, and similar ECSA, calculated from the cyclic voltammograms in N2 saturated
electrolyte. Therefore it was not surprising that the onset potentials and exchange current
densities were also very close for Pd/C-EG11 and Pd/C-EG11-untr: OCP was 0.89 V for
both and i0 was 8 x 10-12
and 1 x 10-11
A cm-2
, respectively. However, the current density
at 0.75 V was higher for Pd/C-EG11-untr, which led to higher mass activity, 30 A g-2
Pd.
The slight increase in the current density at 0.75 V together with the decrease in carbon
lost (discussed in Section 4.2.1) and the simplicity of the synthesis, led to the selection of
Pd/C-EG11 as the catalyst of choice for further investigations. Thus, pre-treatment of the
carbon support with HNO3 was no longer carried out for practical reasons. The carbon
treatment was highly time consuming; the carbon would be allowed to reflux in a nitric
acid solution overnight, the product was washed up to twenty times with deionized water
until reaching a pH close to neutral and subsequently separated by centrifugation. The
carbon treated this way was allowed to dry overnight at 100 ºC and ground afterwards.
Approximately one gram of treated carbon was obtained at the end of the process.
Figure 4-20 shows anodic LSVs for Pd/C-EG11-untr at five different rotation speeds,
400, 900, 1600, 2500 and 3600 rpm (tests carried out from lower to higher rotation
speeds). Forward and backward linear sweep voltammograms were successively recorded
for each rotation speed in the potential range 0.25 to 0.95 V, starting with 400 rpm and
ending with 3600 rpm. For the rotation speed 400 rpm the cathodic potential sweep is
also plotted (dotted line). The inset in Figure 4-20 shows the onset potential region, in
which it can be seen that the variability in onset potential within the five voltammograms
was only 2 mV. Therefore it could be concluded that the palladium nanoparticles were
stable in the conditions applied and further investigations were carried out.

82
Figure 4-20: Linear sweep voltammograms of Pd/C-untr at different rotation speed.
Linear sweep voltammograms at different rotation speeds were analyzed using the
Koutecky-Levich equation: Lk iii /1/1/1 [36]. In this equation ik is the kinetic current
and iL is the mass-transport controlled current. Koutecký-Levich plots are plots of i-1
vs
-1/2, where i is the overall current density and is the rotation speed, were produced for
some of the catalysts. In a plot of i vs , the overall current will tend to a limit, ik, when
the rotating speed tends to . The kinetic current, ik, is defined as the current is absence
of any mass-transport effect. When i-1
is plotted vs -1/2, the plot should be linear and it
can be extrapolated to infinite rotation speed, -1/2 = 0, to obtain ik
-1 [36]. Koutecký-
Levich plots for Pd/C-EG11-untr are shown in Figure 4-21. Current values were taken
from the linear sweep voltammograms, current values at five different rotation speeds and
at five different potentials, 0.67, 071, 075, 079 and 0.82 V.
-8
-7
-6
-5
-4
-3
-2
-1
0
0.1 0.2 0.3 0.4 0.5 0.6 0.7 0.8 0.9 1
E / V (vs NHE)
j / m
A c
m-2
3600rpm
2500rpm
1600rpm
400rpm
900rpm
-0.05
0
0.05
0.87 0.88 0.89 0.9 0.91
E /V (vs NHE)
j / m
A c
m-2

83
0.0
0.5
1.0
1.5
2.0
2.5
3.0
0.01 0.015 0.02 0.025 0.03 0.035 0.04 0.045 0.05 0.055 0.06
w-1/2
/ rpm-1/2
i-1 /
mA
-1
0.82 V
0.75 V
0.79 V
0.67 V
0.71 V
Figure 4-21: Koutecký-Levich plots for Pd/C-untr.
A plot of the logarithm of the kinetic currents obtained from Koutecký-Levich plots vs
potential was built to evaluate the Tafel slope in this new potential range (Figure 4-22).
The Tafel slope from Koutecký-Levich plots (potential range ca. 0.70 to 0.80 V) was 101
mV decade-1
, significantly different from the slope estimated from mass-transport
corrected Tafel plots (range 0.80 to 0.85 V), of 59 mV decade-1
. This change in the slope,
by analogy with Pt, was attributed to a change in the surface coverage of the chemisorbed
oxygen-containing species: the oxygen coverage changes with the potential and this
coverage influences the oxygen adsorption, as explained by Tarasevich (cited by
Tammevesky [37] and Mamlouk [38]) and Parthasarathy [39]. The oxygen coverage in
the potential range 0.70 to 0.80 V was different to the coverage in the kinetic region
(potential range 0.80 to 0.85 V) as was previously discussed in Section 4.3.1; therefore
different Tafel slopes would be observed in these two potential regions.
The straight line fitted to produce a Tafel equation from data obtained from Koutecký-
Levich plots (Figure 4-22), had a correlation coefficient of only 0.987, which is lower
than the minimum of 0.995 obtained in traditional Tafel plots. The change in Tafel slope
at high current was shown in Figure 4-18 and was confirmed by Koutecký-Levich plots.

84
y = -0.1007x + 0.7951
R2 = 0.9871
0.60
0.65
0.70
0.75
0.80
0.85
0.90
0.95
1.00
-1.0 -0.5 0.0 0.5 1.0 1.5
log (ik) / mA
E /
V (
vs N
HE
)
Figure 4-22: Kinetic current vs potential plots for Pd/C-untr.
4.5. Conclusions
Palladium nanoparticles supported on pre-treated Vulcan XC-72R were initially
synthesized using an impregnation method followed by a reduction with three different
reducing agents: ethylene glycol, formaldehyde and sodium borohydride. The pH of the
system was not controlled in any of these three syntheses. Ethylene glycol yielded the
catalyst with higher activity towards the ORR per unit of mass (mass activity) and so
ethylene glycol was chosen as the reducing agent.
Different syntheses were carried out using ethylene glycol as the reducing agent in order
to identify the most favourable pH to carry out the reduction. The aim was to obtain
palladium particles well dispersed on the carbon support and with an optimum particle
size for the ORR. Palladium nanoparticles which provided both high ORR activity and
stability were obtained (optimum particle size); however further research on particle
distribution on the carbon surface would be necessary. It was found that reduction of

85
ammonium tetrachloropalladate (II) at basic pH, between 10 and 13 pH units, yielded Pd
particles of approximately 6 nm. The pH, within this alkaline region, had no apparent
effect on the Pd particle size. Exchange current densities estimated for Pd/C catalysts
prepared by EG reduction were all similar, in the interval 7.7 x 10⁻¹²
to 1.0 x 10⁻¹¹
A cm-2
Pd. Therefore, it was concluded that the particle size, within the studied range, did not
influence the ORR activity of Pd nanoparticles prepared by EG reduction.
On the other hand, the pH of the reaction system induced a change in the dispersion of
palladium nanoparticles on the carbon surface. Dispersion of the Pd nanoparticles was
higher in basic pH, as indicated by higher ECSA and mass activity values. TEM analysis
showed particle agglomeration for all the Pd/C catalysts analysed. The least severe
agglomeration was observed for Pd/C-EG11, this was as evidenced by its mass activity
(20 A g-2
Pd) higher than mass activities of Pd/C-EG, Pd/C-EG10, Pd/C-EG12 or Pd/C-
EG13. A pH value of 11 was chosen in further catalyst preparations by EG reduction,
both for Pd or palladium-based bimetallic catalysts.
All carbon-supported palladium catalysts exhibited only one Tafel slope, this one being in
the low current density region, with values ranging from 59 to 64 mV decade-1
. In the
high current density region a constantly changing Tafel slope was observed. This change
in Tafel slope was believed to be due to the change of the oxygen coverage of the catalyst
surface with the potential.
Carbon-supported palladium nanoparticles were also prepared on as-received Vulcan XC-
72R using ethylene glycol as reducing agent at pH 11. Characterization of this catalyst
(Pd/C-untr) showed that its particle size of 7 nm with an ECSA of 15 m2 g
-1, and
exchange current density of 1.0 x 10⁻¹¹
A cm-2
Pd, were similar to those calculated for
Pd/C-EG11. Future preparations were carried out on as-received Vulcan XC-72R.
Heat treatment in H2 at 300 ºC caused particle growth on all carbon-supported palladium
nanocatalysts. The extension of the sintering increased with increasing temperature in the
range from room temperature to 300 ºC, and it was more severe for smaller palladium

86
particles. Heat treatment caused an important loss of ECSA in each catalyst and therefore
a decrease in its mass activity. Heat treatment did not affect the activity towards ORR of
the Pd catalyst; kinetic parameters calculated for Pd/C-EG-300 did not differ significantly
from those of Pd/C-EG.
To conclude, palladium nanoparticles suitable to be used as cathode catalysts in PEMFC
were obtained. By using ethylene glycol as the reducing agent at pH 11, ammonium
tetrachloropalladate (II) yielded Pd nanoparticles of approximately 6 nm which provided
both high ORR activity and stability. Further research on particle distribution on the
carbon surface would possibly lead to an increase in the electrochemical surface area and
therefore the mass activity of this catalyst.
87
References
1. Guha, A., W. Lu, T.A. Zawodzinski Jr, and D.A. Schiraldi, Surface-modified
carbons as platinum catalyst support for PEM fuel cells. Carbon, 2007. 45(7): p.
1506-1517.
2. Li, H., G. Sun, Y. Gao, Q. Jiang, Z. Jia, and Q. Xin, Effect of Reaction Atmosphere
on the Electrocatalytic Activities of Pt/C and PtRu/C Obtained in a Polyol
Process. J. Phys. Chem. C Full Journal Title:Journal of Physical Chemistry C,
2007. 111(42): p. 15192-15200.
3. Umeda, M., M. Kokubo, M. Mohamedi, and I. Uchida, Porous-microelectrode
study on Pt/C catalysts for methanol electrooxidation. Electrochim. Acta Full
Journal Title:Electrochimica Acta, 2003. 48(10): p. 1367-1374.
4. Zhang, L., K. Lee, and J. Zhang, Effect of synthetic reducing agents on
morphology and ORR activity of carbon-supported nano-Pd-Co alloy
electrocatalysts. Electrochim. Acta Full Journal Title:Electrochimica Acta, 2007.
52(28): p. 7964-7971.
5. International Centre for Diffraction Data. Available from: http://www.icdd.com/.
6. Cullity, B.D., Elements of X-Ray Diffraction. 1978: Addison-Wesley.
7. Wu, C., H. Zhang, and B. Yi, Hydrogen generation from catalytic hydrolysis of
sodium borohydride for proton exchange membrane fuel cells. Catalysis Today,
2004. 93-95: p. 477-483.
8. Canton, P., C. Meneghini, P. Riello, A. Balerna, and A. Benedetti, Thermal
evolution of carbon-supported Pd nanoparticles studied by time-resolved X-ray
diffraction. Journal of Physical Chemistry B, 2001. 105(34): p. 8088-8091.
9. Jiang, L., A. Hsu, D. Chu, and R. Chen, Size-dependent activity of palladium
nanoparticles for oxygen electroreduction in alkaline solutions. Journal of the
Electrochemical Society, 2009. 156(5): p. B643-B649.
10. Vielstich, W., H. Gasteiger, and A. Lamm, Handbook of fuel cells : fundamentals,
technology and applications. 2003, Chichester: Wiley. 4 v.

88
11. Burke, L.D. and D.T. Buckley, Anomalous oxidation reactions at noble metal
surfaces at low potentials: with particular reference to palladium. Journal of the
Electrochemical Society, 1996. 143(3): p. 845-854.
12. Burke, L.D. and J.K. Casey, Examination of the electrochemical behavior of
palladium electrodes in acid. Journal of the Electrochemical Society, 1993.
140(5): p. 1284-1291.
13. Breiter, M.W., Dissolution and adsorption of hydrogen at smooth Pd wires at
potentials of the alpha phase in sulfuric acid solution. Journal of Electroanalytical
Chemistry, 1977. 81(2): p. 275-284.
14. Rand, D.A.J. and R. Woods, A study of the dissolution of platinum, palladium,
rhodium and gold electrodes in 1 M sulphuric acid by cyclic voltammetry. Journal
of Electroanalytical Chemistry, 1972. 35(C): p. 209-218.
15. Solla-Gullón, J., V. Montiel, A. Aldaz, and J. Clavilier, Synthesis and
electrochemical decontamination of platinum-palladium nanoparticles prepared
by water-in-oil microemulsion. Journal of the Electrochemical Society, 2003.
150(2): p. E104-E109.
16. Mallát, T., É. Polyánszky, and J. Petró, Electrochemical study of palladium
powder catalysts. Journal of Catalysis, 1976. 44(3): p. 345-351.
17. Zeng, J., J.Y. Lee, and W. Zhou, Activities of Pt/C catalysts prepared by low
temperature chemical reduction methods. Appl. Catal., A Full Journal
Title:Applied Catalysis, A: General, 2006. 308: p. 99-104.
18. Mukerjee, S. and J. McBreen, Effect of particle size on the electrocatalysis by
carbon-supported Pt electrocatalysts: An in situ XAS investigation. Journal of
Electroanalytical Chemistry, 1998. 448(2): p. 163-171.
19. Li, H., G. Sun, Q. Jiang, M. Zhu, S. Sun, and Q. Xin, Synthesis of highly dispersed
Pd/C electro-catalyst with high activity for formic acid oxidation. Electrochem.
Commun. Full Journal Title:Electrochemistry Communications, 2007. 9(6): p.
1410-1415.
20. Grigoriev, S.A., P. Millet, and V.N. Fateev, Evaluation of carbon-supported Pt
and Pd nanoparticles for the hydrogen evolution reaction in PEM water
electrolysers. J. Power Sources Full Journal Title:Journal of Power Sources, 2008.
177(2): p. 281-285.

89
21. Luo, C., Y. Zhang, and Y. Wang, Palladium nanoparticles in poly(ethyleneglycol):
the efficient and recyclable catalyst for Heck reaction. Journal of Molecular
Catalysis A: Chemical, 2005. 229(1-2): p. 7-12.
22. Damjanovic, A. and V. Brusic, Electrode kinetics of oxygen reduction on oxide-
free platinum electrodes. Electrochimica Acta, 1967. 12(6): p. 615-628.
23. Gottesfeld, S., I.D. Raistrick, and S. Srinivasan, Oxygen Reduction Kinetics on a
Platinum RDE Coated with a Recast Nafion Film. Journal of the Electrochemical
Society, 1987. 134(6): p. 1455-1462.
24. Sleightholme, A.E.S., Electrochemical studies of fuel cell catalysts, in Chemistry.
2007, Imperial College: London.
25. Damjanovic, A., Mechanism of oxygen reduction related to electronic structure of
gold-palladium alloy. Journal of Physical Chemistry, 1967. 71(8): p. 2741-2742.
26. Pourbaix, M., Atlas of Electrochemical Equilibria in Aqueous Solutions. 2nd ed.
1974, Houston: National Association of Corrosion Engineers.
27. Wang, X., N. Kariuki, D. Myers, and R. Kumar, V.C.6 Non-Platinum
Electrocatalysts. DOE Hydrogen Program, 2006. FY 2006 Annual Progress
Report: p. 791-793.
28. Shao, M.-H., K. Sasaki, and R.R. Adzic, Pd-Fe Nanoparticles as Electrocatalysts
for Oxygen Reduction. Journal of the American Chemical Society, 2006. 128(11):
p. 3526-3527.
29. Parthasarathy, A., C.R. Martin, and S. Srinivasan, Investigations of the O2
reduction reaction at the platinum Nafion interface using a solid-state
electrochemical cell. Journal of the Electrochemical Society, 1991. 138(4): p. 916-
921.
30. Gnanamuthu, D.S. and J.V. Petrocelli, A Generalized Expression for the Tafel
Slope and the Kinetics of Oxygen Reduction on Noble Metals and Alloys. Journal
of The Electrochemical Society, 1967. 114(10): p. 1036-1041.
31. Hoare, J.P., Oxygen Overvoltage on Bright Palladium in Acid Solutions. Journal
of The Electrochemical Society, 1965. 112(11): p. 1129-1133.
32. Mustain, W.E., K. Kepler, and J. Prakash, CoPdx oxygen reduction
electrocatalysts for polymer electrolyte membrane and direct methanol fuel cells.
Electrochimica Acta, 2007. 52(5): p. 2102-2108.

90
33. Savadogo, O., K. Lee, K. Oishi, S. Mitsushima, N. Kamiya, and K.I. Ota, New
palladium alloys catalyst for the oxygen reduction reaction in an acid medium.
Electrochemistry Communications, 2004. 6(2): p. 105-109.
34. Tilak, B.V., K. Tari, and C.L. Hoover, Metal Anodes an Hydrogen Cathodes:
Their Activity towards O2 Evolution and ClO32-
Reduction Reactions. Journal of
the Electrochemical Society, 1988. 135(6): p. 1386-1392.
35. Gubbins, W., The Solubility and Diffusivity of Oxygen in Electrolytic Solutions.
1965.
36. Bard, A.J., Electrochemical Methods: Fundamentals and Applications. 2nd
edition ed. 2001: John Wiley & Sons, Inc.
37. Tammeveski, K., M. Arulepp, T. Tenno, C. Ferrater, and J. Claret, Oxygen
electroreduction on titanium-supported thin Pt films in alkaline solution.
Electrochimica Acta, 1997. 42(19): p. 2961-2967.
38. Mamlouk, M., Investigation of High Temperature Polymer Electrolyte Membrane
Fuel Cells, in Chemical Engineering and Advanced Materials. 2008, Newcastle
University: Newcastle upon Tyne.
39. Parthasarathy, A., S. Srinivasan, A.J. Appleby, and C.R. Martin, Temperature
dependence of the electrode kinetics of oxygen reduction at the
platinum/nafion(R) interface - a microelectrode investigation. Journal of the
Electrochemical Society, 1992. 139(9): p. 2530-2537.
91
Chapter 5: Characterization of carbon-supported bimetallic Pd-M nanoparticles
5.1. Introduction
Physicochemical characterization and catalytic activity towards the oxygen reduction
reaction (ORR) in acid media of carbon-supported bimetallic nanoparticles are discussed
in this chapter. Electrocatalysts are divided into four groups: palladium-gold, palladium-
cobalt, palladium-titanium and palladium-iron. At least two different atomic ratios were
selected for each bimetallic combination. Two synthetic procedures were chosen for the
preparations: simultaneous co-deposition of both metals on the carbon support and
deposition of the second metal on carbon-supported Pd; Pd/C prepared by the EG
reduction at pH 11 as described in the previous chapter. The effect of heat treatment in H2
at different temperatures is also discussed in this chapter.
The first bimetallic combination, palladium-gold, was chosen to establish the basis for
future study of palladium-based ternary electrocatalysts, despite the poor ORR activity
reported in the literature for Pd-Au alloys [1, 2]. Ternary metal combinations based on
palladium, like Pd-Co-Au [3], have been claimed to be as active as commercial carbon-
supported nanoparticles. Therefore, it was decided to study the synthetic method,
physicochemical properties and ORR activity of Pd-Au bimetallic catalysts with different
metal ratios. To study the influence of the introduction of Au in the Pd lattice three
different Pd to Au atomic ratios, ranging from a gold rich to a 10% atomic Au alloy, were
chosen.
Palladium-cobalt and palladium-iron alloys have been reported to have electrocatalytic
activities for the ORR higher than that of pure palladium [4-6]. Studies by Suo et al. of
adsorption energies of monoatomic oxygen in alloys with different degree of alloy
supported the experimental data [7]. In this chapter the effect of different synthetic
methods and atomic ratios has been studied for Pd-Co and Pd-Fe electrocatalysts.

92
Pd4Co alloy was reported to be very active towards the oxygen reduction reaction for
different groups [8, 9], this work was replicated in order to understand the system for
future third metal additions. The system Pd:Co 1:1 was also studied because of the
obvious advantage of the low cost of Co. Pd overlayers on Pd3Fe(111) and the Pd
overlayer on PdFe(111) were reported to have high ORR activity [10]. In this chapter the
preparation and characterization of polycrystalline Pd3Fe and PdFe are discussed.
Palladium-titanium catalysts were also prepared by different synthetic methods and using
different atomic ratios. Fernández et al [3] reported the bimetallic combination Pd-Ti with
atomic ratio 1 to 1 to be highly active towards the oxygen reaction. The preparation of a
Pd-Ti 1 to 1 atomic ratio was attempted and the results are discussed in this chapter. The
effect of small amounts of Ti in the Pd lattice, 9 to 1 Pd to Ti, on the ORR activity is also
discussed.
The aim of the experiments discussed in this chapter was to screen a number of bimetallic
electrocatalysts. The influence of different factors on the catalyst structure and ORR
activity was studied: the reducing agent, temperature, the deposition order and the atomic
ratio of both metals.
5.2. Physicochemical characterization of carbon-supported bimetallic
nanoparticles
The average d value (Pd-Pd bond distance) for Pd/C was calculated after applying the
Bragg equation to twenty carbon-supported Pd catalysts. The Pd-Pd bond for Pd/C was
found to have an average value of 0.2751 nm, the associated error was ± 0.0003 nm. In
the study of the following bimetallic catalysts, it was decided to consider as a proof of
alloy formation, a d value outside the interval 0.2751 ± 0.0006 nm. This interval was
calculated by adding 200% of the error to the Pd/C d value.

93
5.2.1. Physicochemical characterization of palladium-gold catalysts
Metal content and Pd to Au atomic ratio obtained from EDXA characterizations for each
palladium-gold catalyst are shown in Table 5-1. Total metal content of catalysts prepared
by simultaneous co-deposition of Pd and Au was aimed at 20% weight; catalysts prepared
on 20% weight Pd/C would therefore have higher metal content. Table 5-1 also lists for
each catalyst the particle size and, the Pd-Pd bond distance (estimated from XRD
patterns) and electrochemical surface area (ECSA) (estimated from slow scan cyclic
voltammograms). XRD patterns for palladium-gold catalysts are compared in this
section. Palladium-gold phase diagram [11] shows that both metals alloy at any atomic
ratio forming a face-centered cubic crystal system.
Table 5-1: Particle size, electrochemical surface area, Pd-Pd bond distance and metal content for
palladium-gold electrocatalysts.
Catalyst Particle size
(nm)
ECSA
(m2 g
-1)
Pd-Pd
bond
Metal content
(% weight)
Atomic
ratio

94
distance
(nm)
(Pd:Metal)
PdAu-EG11 2.7 - 0.2852 4.8 Pd, 12.4 Au 1:1.4
PdAu-EG11-
300 9.5 - 0.2833 4.8 Pd, 12.4 Au 1:1.4
Pd9Au-EG11 - 11.4 - 14.2 Pd, 3.7 Au 1: 0.14
Pd9Au-EG11-
300 - 4.9 - 14.2 Pd, 3.7 Au 1: 0.14
Pd(Au)-EG11 6.0 Pd, 18.8 Au 3.7 0.2751 11.2 Pd, 28.4 Au 1:1.4
Pd(Au)-EG11-
300 10.2 Pd, 21.4 Au 0.6 0.2746 11.2 Pd, 28.4 Au 1:1.4
Pd3(Au)-EG11 6.4 Pd, 13.4 Au 8.4 0.2749 17.8 Pd, 13.0 Au 1:0.4
Pd3(Au)-EG11-
300 8.9 Pd, 14.3 Au 3.0 0.2747 17.8 Pd, 13.0 Au 1:0.4
Pd-EG11-untr 7.3 14.6 0.2751 22.5 -
Pt-Etek 3.4 55.3 - 19.8 -
Figure 5-1 shows XRD patterns of all four catalysts synthesized without heat treatment in
H2. Both catalysts prepared by depositing gold on Pd/C, Pd(Au)-EG11 and Pd3(Au)-
EG11, showed diffraction patterns corresponding to pure Pd and pure Au phases, no alloy
was present in the samples. This was confirmed by the Pd-Pd bond distance calculated
from the Bragg equation; the Pd (220) diffraction peak, for Pd(Au)-EG11 and Pd3(Au)-
EG11 was 0.2751 and 0.2749 nm, respectively. The Pd-Pd bond distance did not differ
significantly from the value calculated for Pd/C, 0.2751 nm (Table 5-1).
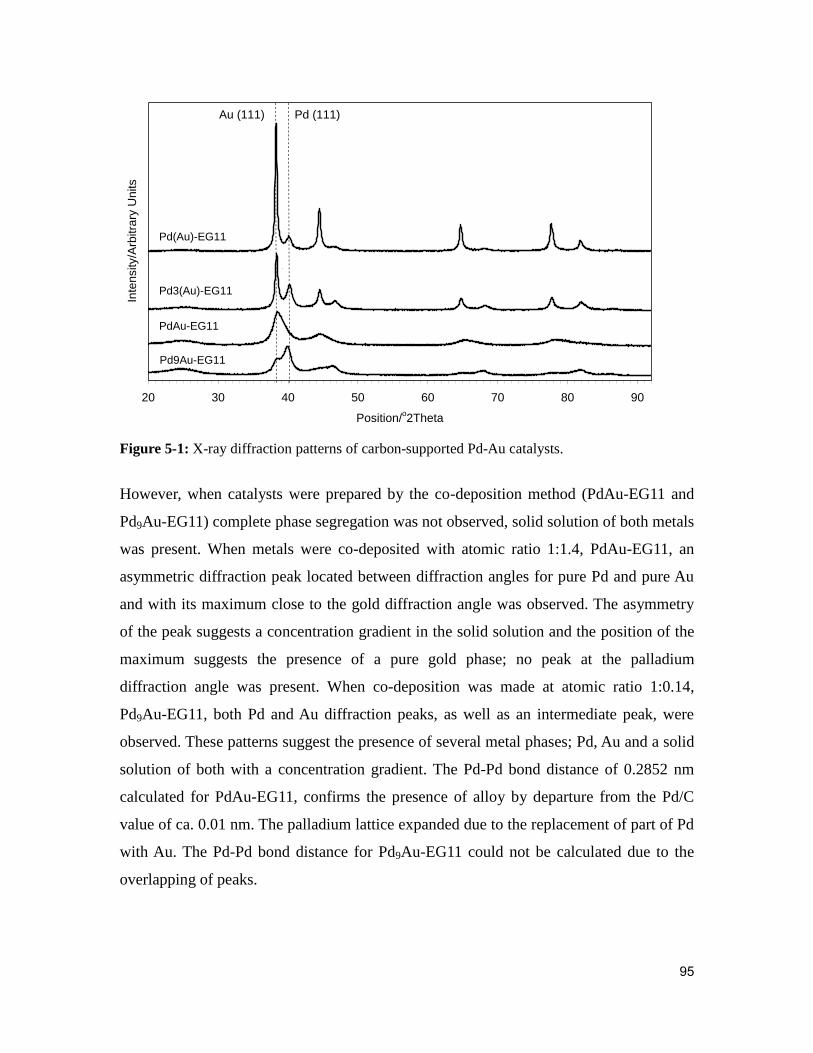
95
20 30 40 50 60 70 80 90
Position/o2Theta
Inte
nsity/A
rbitra
ry U
nits
Pd9Au-EG11
Pd3(Au)-EG11
Pd(Au)-EG11
PdAu-EG11
Au (111) Pd (111)
Figure 5-1: X-ray diffraction patterns of carbon-supported Pd-Au catalysts.
However, when catalysts were prepared by the co-deposition method (PdAu-EG11 and
Pd9Au-EG11) complete phase segregation was not observed, solid solution of both metals
was present. When metals were co-deposited with atomic ratio 1:1.4, PdAu-EG11, an
asymmetric diffraction peak located between diffraction angles for pure Pd and pure Au
and with its maximum close to the gold diffraction angle was observed. The asymmetry
of the peak suggests a concentration gradient in the solid solution and the position of the
maximum suggests the presence of a pure gold phase; no peak at the palladium
diffraction angle was present. When co-deposition was made at atomic ratio 1:0.14,
Pd9Au-EG11, both Pd and Au diffraction peaks, as well as an intermediate peak, were
observed. These patterns suggest the presence of several metal phases; Pd, Au and a solid
solution of both with a concentration gradient. The Pd-Pd bond distance of 0.2852 nm
calculated for PdAu-EG11, confirms the presence of alloy by departure from the Pd/C
value of ca. 0.01 nm. The palladium lattice expanded due to the replacement of part of Pd
with Au. The Pd-Pd bond distance for Pd9Au-EG11 could not be calculated due to the
overlapping of peaks.
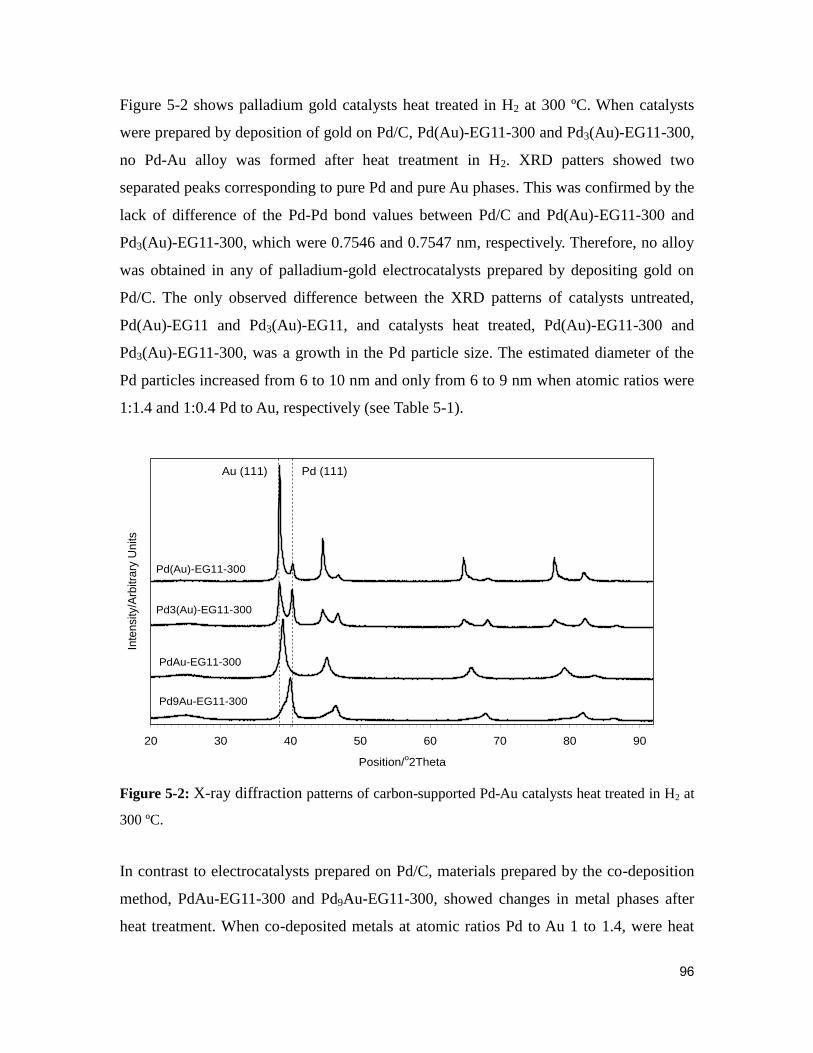
96
Figure 5-2 shows palladium gold catalysts heat treated in H2 at 300 ºC. When catalysts
were prepared by deposition of gold on Pd/C, Pd(Au)-EG11-300 and Pd3(Au)-EG11-300,
no Pd-Au alloy was formed after heat treatment in H2. XRD patters showed two
separated peaks corresponding to pure Pd and pure Au phases. This was confirmed by the
lack of difference of the Pd-Pd bond values between Pd/C and Pd(Au)-EG11-300 and
Pd3(Au)-EG11-300, which were 0.7546 and 0.7547 nm, respectively. Therefore, no alloy
was obtained in any of palladium-gold electrocatalysts prepared by depositing gold on
Pd/C. The only observed difference between the XRD patterns of catalysts untreated,
Pd(Au)-EG11 and Pd3(Au)-EG11, and catalysts heat treated, Pd(Au)-EG11-300 and
Pd3(Au)-EG11-300, was a growth in the Pd particle size. The estimated diameter of the
Pd particles increased from 6 to 10 nm and only from 6 to 9 nm when atomic ratios were
1:1.4 and 1:0.4 Pd to Au, respectively (see Table 5-1).
20 30 40 50 60 70 80 90
Position/o2Theta
Inte
nsity/A
rbitra
ry U
nits
Pd9Au-EG11-300
Pd3(Au)-EG11-300
Pd(Au)-EG11-300
PdAu-EG11-300
Pd (111)Au (111)
Figure 5-2: X-ray diffraction patterns of carbon-supported Pd-Au catalysts heat treated in H2 at
300 ºC.
In contrast to electrocatalysts prepared on Pd/C, materials prepared by the co-deposition
method, PdAu-EG11-300 and Pd9Au-EG11-300, showed changes in metal phases after
heat treatment. When co-deposited metals at atomic ratios Pd to Au 1 to 1.4, were heat

97
treated in H2, the asymmetric diffraction peak (PdAu-EG11) turned into a symmetrical
peak with its maximum at a diffraction angle between Au and Pd positions.
Diffractograms showed a typical face-centered cubic pattern with diffraction angles
shifted to lower positions compared to those of Pd/C, which indicated the formation of a
Pd-Au alloy. The Pd-Pd bond distance calculated for PdAu-EG11-300 was 0.2833 nm,
significantly larger than for Pd/C. The palladium lattice expanded due to the replacement
of part of the Pd with Au. At an atomic ratio of 1:0.14 the diffraction peaks were shifted
from the Pd and Au positions; overlapped peaks appeared on intermediate positions. This
suggests the presence of Pd-Au solid solution with different metal proportions. No peaks
at palladium or gold diffraction angles were present. Therefore, no pure Pd or Au phases
were present either on PdAu-EG11-300 or Pd9Au-EG11-300. The Pd-Pd bond distance
for Pd9Au-EG11-300 could not be calculated due to the overlapping of the peaks.
The particle size calculated for PdAu-EG11 (Table 5-1) of approximately 3 nm, was not
accurate due to the asymmetry of the diffraction peak, which was likely to be the
combination of two diffraction peaks, corresponding to Pd-Au solid solutions with
different metal ratios. The asymmetry of the peak, which was likely to be caused by peak
overlapping, could lead to a measured larger full width at half maximum (FWHM), and
therefore to calculate a smaller crystallite size. The particle size was however still used
for comparison. Since the diffractograms for Pd9Au-EG11 and Pd9Au-EG11-300
presented overlapped peaks, FWHM could not be measured and particle sizes could not
be estimated by the Scherrer equation.
The effect of heat treatment in H2 at 300 ºC on the catalysts was a growth in the Pd
particles in every case. However, this growth was smaller than the increase in the particle
size observed for pure palladium particles when subjected to the same treatment. The
effect of Au can be observed by comparing the effect of heat treatment of PdAu-EG11
with Pd/C from E-Tek. For PdAu-EG11 the estimated particle size was 3 nm, which
increased to 10 nm after heat treatment; Pd/C from E-Tek had Pd nanoparticles of
approximately 3.5 nm when received, particle size increased to 16 nm after heat
treatment. Therefore, it could be suggested that introduction of Au in the Pd lattice

98
reduced the extent of sintering when treated at high temperature in presence of H2. A
similar effect was observed in catalysts prepared on Pd/C, Pd(Au)-EG11 and Pd3(Au)-
EG11, where Pd particles increased from 6 to 10 nm and only from 6 to 9 nm,
respectively. This increase was considerably smaller than the rise observed for Pd/C
prepared by EG reduction (6 to 17 nm) as shown in the previous chapter. The depression
in the sintering degree due to the presence of a second element in the Pd lattice was
previously reported in the literature with other metals such as Fe [12]. The Au particle
size did not exhibit significant changes in any case.
5.2.2. Physicochemical characterization of palladium-cobalt catalysts
Table 5-2 lists the metal content for each palladium-cobalt catalyst. The total content of
catalysts prepared by simultaneous co-deposition of Pd and Co was close to 20% metal
weight, whilst catalysts prepared on Pd/C had higher metal content. The palladium-cobalt
phase diagram [11] shows that both metals alloy, forming a face-centered cubic crystal
system, when the Pd atomic content is higher than 52%.
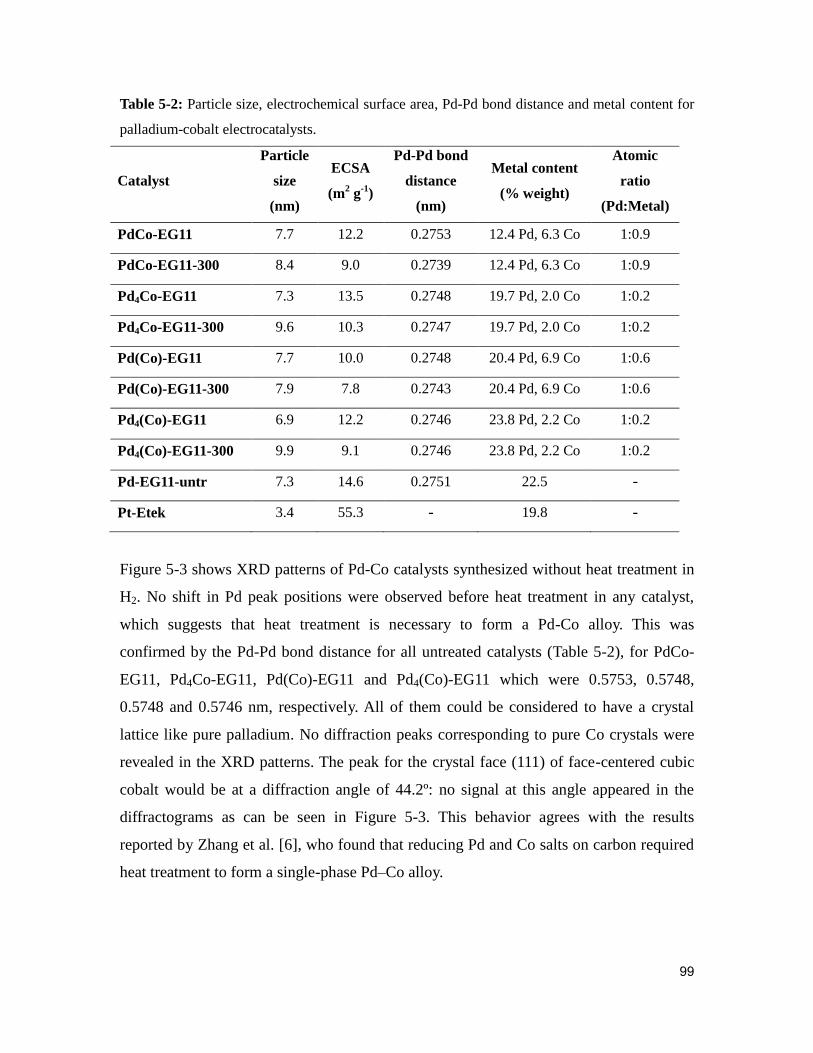
99
Table 5-2: Particle size, electrochemical surface area, Pd-Pd bond distance and metal content for
palladium-cobalt electrocatalysts.
Catalyst
Particle
size
(nm)
ECSA
(m2 g
-1)
Pd-Pd bond
distance
(nm)
Metal content
(% weight)
Atomic
ratio
(Pd:Metal)
PdCo-EG11 7.7 12.2 0.2753 12.4 Pd, 6.3 Co 1:0.9
PdCo-EG11-300 8.4 9.0 0.2739 12.4 Pd, 6.3 Co 1:0.9
Pd4Co-EG11 7.3 13.5 0.2748 19.7 Pd, 2.0 Co 1:0.2
Pd4Co-EG11-300 9.6 10.3 0.2747 19.7 Pd, 2.0 Co 1:0.2
Pd(Co)-EG11 7.7 10.0 0.2748 20.4 Pd, 6.9 Co 1:0.6
Pd(Co)-EG11-300 7.9 7.8 0.2743 20.4 Pd, 6.9 Co 1:0.6
Pd4(Co)-EG11 6.9 12.2 0.2746 23.8 Pd, 2.2 Co 1:0.2
Pd4(Co)-EG11-300 9.9 9.1 0.2746 23.8 Pd, 2.2 Co 1:0.2
Pd-EG11-untr 7.3 14.6 0.2751 22.5 -
Pt-Etek 3.4 55.3 - 19.8 -
Figure 5-3 shows XRD patterns of Pd-Co catalysts synthesized without heat treatment in
H2. No shift in Pd peak positions were observed before heat treatment in any catalyst,
which suggests that heat treatment is necessary to form a Pd-Co alloy. This was
confirmed by the Pd-Pd bond distance for all untreated catalysts (Table 5-2), for PdCo-
EG11, Pd4Co-EG11, Pd(Co)-EG11 and Pd4(Co)-EG11 which were 0.5753, 0.5748,
0.5748 and 0.5746 nm, respectively. All of them could be considered to have a crystal
lattice like pure palladium. No diffraction peaks corresponding to pure Co crystals were
revealed in the XRD patterns. The peak for the crystal face (111) of face-centered cubic
cobalt would be at a diffraction angle of 44.2º: no signal at this angle appeared in the
diffractograms as can be seen in Figure 5-3. This behavior agrees with the results
reported by Zhang et al. [6], who found that reducing Pd and Co salts on carbon required
heat treatment to form a single-phase Pd–Co alloy.

100
20 30 40 50 60 70 80 90
Position / o2Theta
Inte
nsity / A
rbitra
ry U
nits
Pd4Co-EG11
Pd4(Co)-EG11
Pd(Co)-EG11
PdCo-EG11
Pd(111) Co(111)
Figure 5-3: X-ray diffraction patterns of carbon-supported Pd-Co catalysts prepared by ethylene
glycol reduction.
Figure 5-4 shows the XRD patterns of Pd-Co catalysts synthesized after heat treatment in
H2. After heat treatment, both PdCo-EG11-300 and Pd(Co)-EG11-300 showed the typical
face-centered cubic pattern with diffraction angles shifting to higher positions compared
to those of Pd/C. Pd-Pd bond distances were 0.2739 and 0.2743 nm, respectively. Shift in
the position of diffraction peaks towards higher angles indicates the formation of a Pd-Co
alloy. The palladium lattice contracts due to the replacement of some of Pd atoms with
Co. Shifts in the peak position in catalysts with low Co content, Pd4Co-EG11-300 and
Pd4(Co)-EG11-300, could not be considered significant because the difference in the
average Pd-Pd bond distance value for all Pd/C was not larger than 0.0006 nm. Distances
were 0.2747 and 0.2745 nm, respectively. The lack of confirmation of the alloy presence
was probably due to the small magnitude of the increase in the diffraction angle, caused
by a very small amount of Co introduced in the palladium lattice.

101
20 30 40 50 60 70 80 90
Position / o2Theta
Inte
nsity / A
rbitra
ry U
nits
Pd4Co-EG11-300
Pd4(Co)-EG11-300
Pd(Co)-EG11-300
PdCo-EG11-300
Pd(111) Co(111)
Figure 5-4: X-ray diffraction patterns of carbon-supported Pd-Co catalysts after heat treatment in
H2 at 300 ºC.
Particle sizes calculated from the XRD patterns for Pd(Co)-EG11 and Pd4(Co)-EG11,
were similar to each other (8 and 7 nm, respectively) and equal to the values estimated
for PdCo-EG11 and Pd4Co-EG11 (8 and 7 nm, respectively). From the latter observation
it could be concluded that the amount of Co salt present when the Pd salt was reduced in
EG did not affect the crystallite size of the reduced Pd.
The study of the particle size after heat treatment in H2 at 300 ºC showed that heat
treatment had the same effect on catalysts prepared by co-deposition and catalysts
prepared on-Pd/C. Catalysts with low Co content, Pd4Co-EG11 and Pd4(Co)-EG11,
suffered a larger particle growth, from ca. 7 to 10 nm in both cases; catalysts with higher
Co content, PdCo-EG11 and Pd(Co)-EG11, had an average particle size of ca. 8 nm, both
before and after heat treatment (Table 5-2). For pure Pd the increase in the particle size
was much more extreme; particles for Pd/C-EG11 were calculated to be approximately 7
nm and for Pd/C-EG11-300 were approximately 17 nm, as reported in the previous
chapter. The presence of Co seemed to depress the sintering degree of Pd particles, and
the higher the atomic ratio the smaller the particle growth. This finding, i.e. the
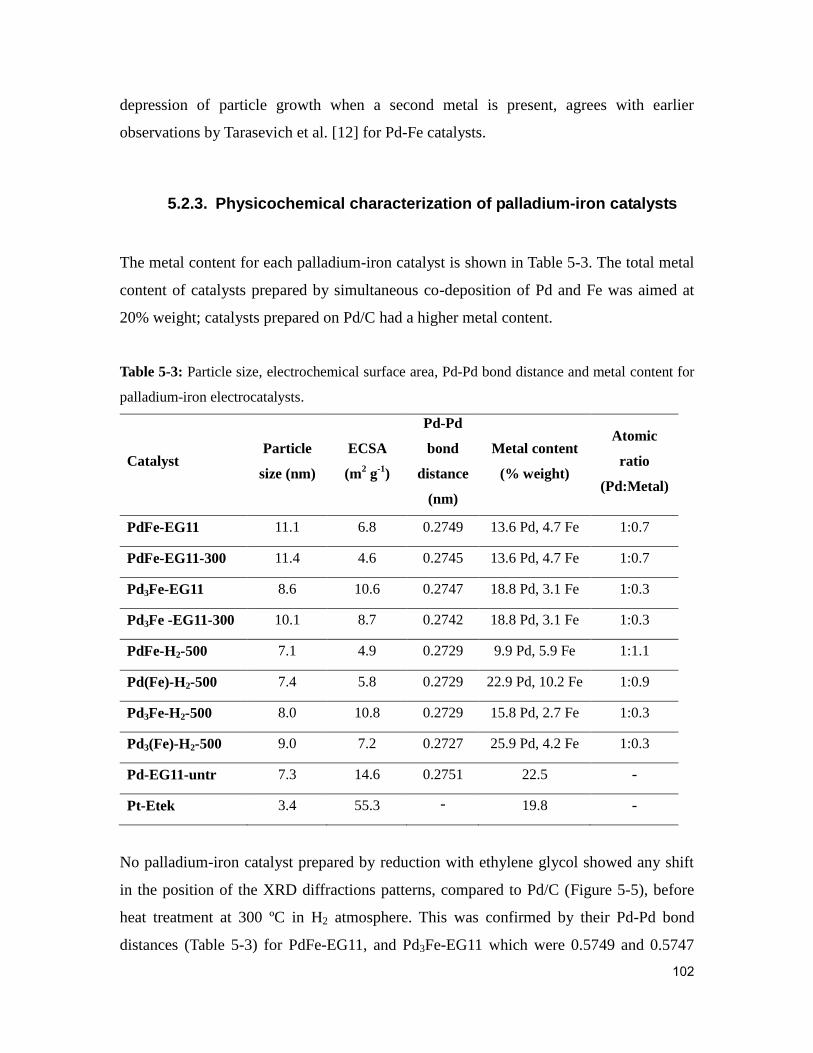
102
depression of particle growth when a second metal is present, agrees with earlier
observations by Tarasevich et al. [12] for Pd-Fe catalysts.
5.2.3. Physicochemical characterization of palladium-iron catalysts
The metal content for each palladium-iron catalyst is shown in Table 5-3. The total metal
content of catalysts prepared by simultaneous co-deposition of Pd and Fe was aimed at
20% weight; catalysts prepared on Pd/C had a higher metal content.
Table 5-3: Particle size, electrochemical surface area, Pd-Pd bond distance and metal content for
palladium-iron electrocatalysts.
Catalyst Particle
size (nm)
ECSA
(m2 g
-1)
Pd-Pd
bond
distance
(nm)
Metal content
(% weight)
Atomic
ratio
(Pd:Metal)
PdFe-EG11 11.1 6.8 0.2749 13.6 Pd, 4.7 Fe 1:0.7
PdFe-EG11-300 11.4 4.6 0.2745 13.6 Pd, 4.7 Fe 1:0.7
Pd3Fe-EG11 8.6 10.6 0.2747 18.8 Pd, 3.1 Fe 1:0.3
Pd3Fe -EG11-300 10.1 8.7 0.2742 18.8 Pd, 3.1 Fe 1:0.3
PdFe-H2-500 7.1 4.9 0.2729 9.9 Pd, 5.9 Fe 1:1.1
Pd(Fe)-H2-500 7.4 5.8 0.2729 22.9 Pd, 10.2 Fe 1:0.9
Pd3Fe-H2-500 8.0 10.8 0.2729 15.8 Pd, 2.7 Fe 1:0.3
Pd3(Fe)-H2-500 9.0 7.2 0.2727 25.9 Pd, 4.2 Fe 1:0.3
Pd-EG11-untr 7.3 14.6 0.2751 22.5 -
Pt-Etek 3.4 55.3 - 19.8 -
No palladium-iron catalyst prepared by reduction with ethylene glycol showed any shift
in the position of the XRD diffractions patterns, compared to Pd/C (Figure 5-5), before
heat treatment at 300 ºC in H2 atmosphere. This was confirmed by their Pd-Pd bond
distances (Table 5-3) for PdFe-EG11, and Pd3Fe-EG11 which were 0.5749 and 0.5747

103
nm, respectively. This suggested the no palladium-iron alloy was formed, at least in an
extent identifiable by XRD.
20 30 40 50 60 70 80 90
Inte
nsity /
Arb
itra
ry U
nits
Position / o2Theta
Pd3Fe-EG11-300
PdFe-EG11-300
Pd3Fe-EG11
PdFe-EG11
Pd (111) Fe (111)
Figure 5-5: X-ray diffraction patterns of carbon-supported Pd-Fe catalysts prepared by EG
reduction.
Although ethylene glycol reduction at 110 ºC did not prove to be able to introduce iron
atoms in the palladium lattice, a high background (high baseline) can be seen in the
diffractograms (Figure 5-6), which indicates the presence of the transition metal in the
sample. This high background was caused by the fluorescence scattering occurring when
the Cu radiation hits the Fe atoms [13]. The EDXA analysis (Table 5-3) confirmed the
presence of Fe. PdFe-EG11 and Pd3Fe-EG11 had an iron content of 40 and 23% atomic
ratio, respectively. The lack of shift in the Pd patterns and the absence of Fe or iron oxide
peaks in the diffractograms can be explained by the presence of Fe in an amorphous
form.
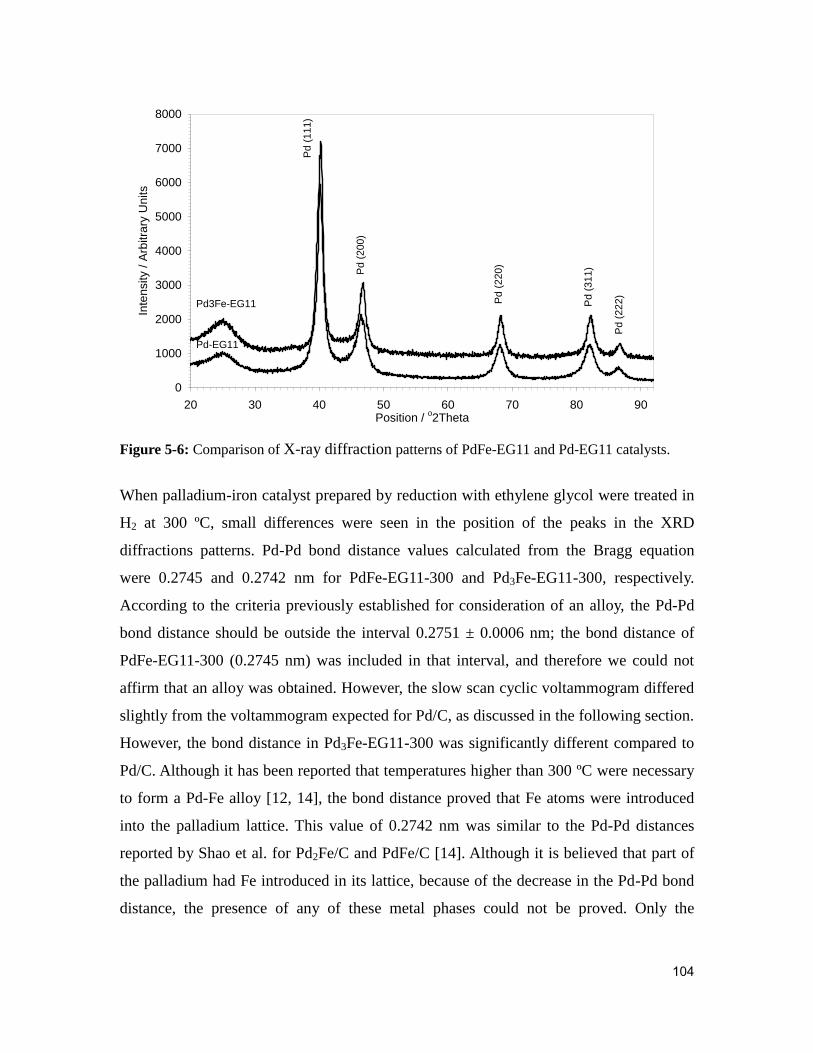
104
0
1000
2000
3000
4000
5000
6000
7000
8000
20 30 40 50 60 70 80 90Position /
o2Theta
Inte
nsity /
Arb
itra
ry U
nits
Pd
(111)
Pd
(220)
Pd
(311)Pd
(200)
Pd
(222)
Pd3Fe-EG11
Pd-EG11
Figure 5-6: Comparison of X-ray diffraction patterns of PdFe-EG11 and Pd-EG11 catalysts.
When palladium-iron catalyst prepared by reduction with ethylene glycol were treated in
H2 at 300 ºC, small differences were seen in the position of the peaks in the XRD
diffractions patterns. Pd-Pd bond distance values calculated from the Bragg equation
were 0.2745 and 0.2742 nm for PdFe-EG11-300 and Pd3Fe-EG11-300, respectively.
According to the criteria previously established for consideration of an alloy, the Pd-Pd
bond distance should be outside the interval 0.2751 ± 0.0006 nm; the bond distance of
PdFe-EG11-300 (0.2745 nm) was included in that interval, and therefore we could not
affirm that an alloy was obtained. However, the slow scan cyclic voltammogram differed
slightly from the voltammogram expected for Pd/C, as discussed in the following section.
However, the bond distance in Pd3Fe-EG11-300 was significantly different compared to
Pd/C. Although it has been reported that temperatures higher than 300 ºC were necessary
to form a Pd-Fe alloy [12, 14], the bond distance proved that Fe atoms were introduced
into the palladium lattice. This value of 0.2742 nm was similar to the Pd-Pd distances
reported by Shao et al. for Pd2Fe/C and PdFe/C [14]. Although it is believed that part of
the palladium had Fe introduced in its lattice, because of the decrease in the Pd-Pd bond
distance, the presence of any of these metal phases could not be proved. Only the
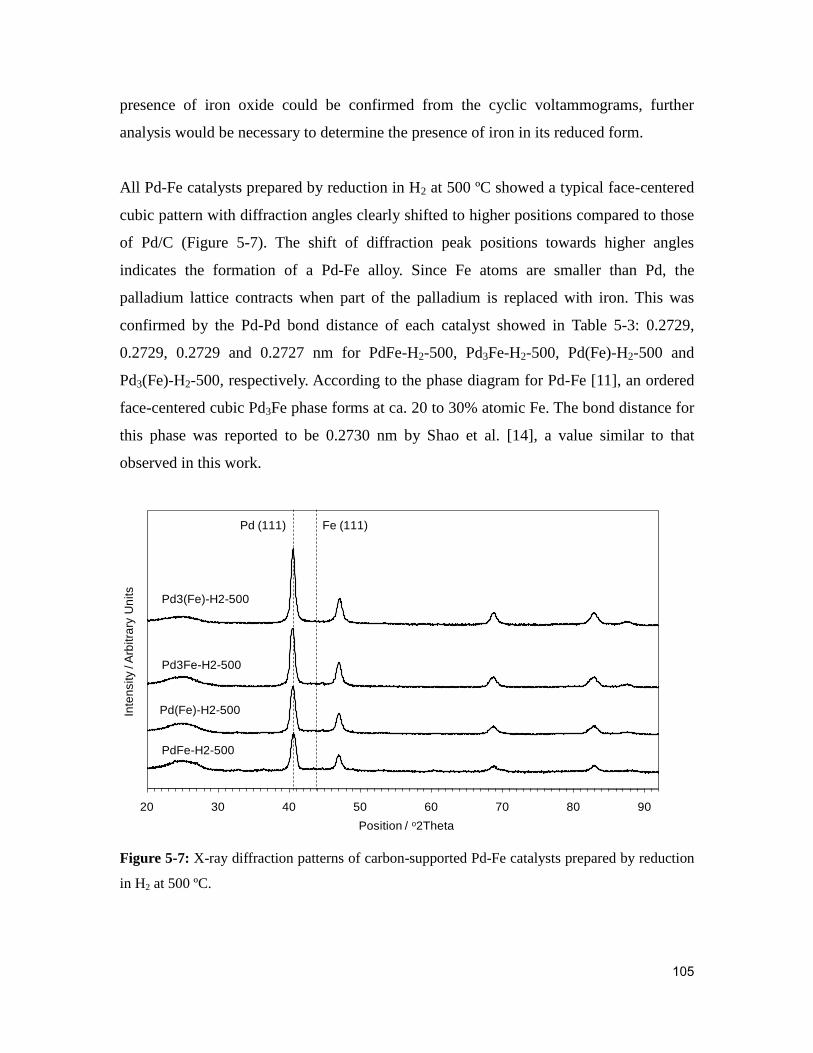
105
presence of iron oxide could be confirmed from the cyclic voltammograms, further
analysis would be necessary to determine the presence of iron in its reduced form.
All Pd-Fe catalysts prepared by reduction in H2 at 500 ºC showed a typical face-centered
cubic pattern with diffraction angles clearly shifted to higher positions compared to those
of Pd/C (Figure 5-7). The shift of diffraction peak positions towards higher angles
indicates the formation of a Pd-Fe alloy. Since Fe atoms are smaller than Pd, the
palladium lattice contracts when part of the palladium is replaced with iron. This was
confirmed by the Pd-Pd bond distance of each catalyst showed in Table 5-3: 0.2729,
0.2729, 0.2729 and 0.2727 nm for PdFe-H2-500, Pd3Fe-H2-500, Pd(Fe)-H2-500 and
Pd3(Fe)-H2-500, respectively. According to the phase diagram for Pd-Fe [11], an ordered
face-centered cubic Pd3Fe phase forms at ca. 20 to 30% atomic Fe. The bond distance for
this phase was reported to be 0.2730 nm by Shao et al. [14], a value similar to that
observed in this work.
20 30 40 50 60 70 80 90
Inte
nsity / A
rbitra
ry U
nits
Position / o2Theta
PdFe-H2-500
Pd3Fe-H2-500
Pd3(Fe)-H2-500
Pd(Fe)-H2-500
Pd (111) Fe (111)
Figure 5-7: X-ray diffraction patterns of carbon-supported Pd-Fe catalysts prepared by reduction
in H2 at 500 ºC.

106
No patterns for face-centered cubic iron phase, maximum intensity diffraction peak at
43.47º, or any other crystal phase showed in the X-ray diffractograms. Thus it was
concluded that any Fe not introduced in the Pd lattice during heat treatment may have
remained in the catalyst as an amorphous iron oxide. Previous investigations in the
synthesis of Pd-Fe nanoparticles by Tarasevich et al. [12] showed that a fraction of the
iron exists on the surface as compounds of hydrated Fe2O3.
No differences in XRD patterns were observed between catalysts prepared by
simultaneous deposition of Pd and Fe salts and catalysts synthesized on Pd/C. However,
difference in the ORR activity were observed as discussed in Section 5.4.3.
Pd-Fe catalysts synthesized by EG reduction presented low variability in their particle
sizes, calculated to be between 9 and 11 nm (Table 5-3). It is interesting to note that
hardly any sintering was observed after treatment in H2 at 300 ºC. PdFe-EG11 had 11 nm
particles both before and after treatment; Pd3Fe-EG11 had 9 nm particles before and 11
nm after heat treatment. This behavior differed to that observed for Pd/C, which suffered
larger sintering, and agreed with previously observations for Pd-Au and Pd-Co catalysts,
which also exhibited smaller sintering than Pd after heat treatment. The presence of a
second metal depressed the degree of sintering. Sintering extent decreased with
increasing Fe content.
Catalysts prepared by reduction in H2 at 500 ºC surprisingly had the smaller particle
sizes, as they were prepared at higher temperatures. PdFe-H2-500 and Pd(Fe)-H2-500 had
particles of ca. 7 nm, particles for Pd3Fe-H2-500 and Pd3(Fe)-H2-500 were 8 and 9 nm,
respectively. Larger particles of catalysts with lower Fe content confirmed previous
observations for catalysts prepared using EG: the larger the amount of Fe atoms in the
palladium lattice the smaller the particle size increase with temperature. The smaller
particles in catalysts subjected to higher temperatures during synthesis may be due to a
larger proportion on Fe in the Pd lattice, responsible for depressing sintering.

107
5.2.4. Physicochemical characterization of palladium-titanium
catalysts
Table 5-4 shows the metal content, particle size and Pd-Pd bond distance for each
palladium-titanium catalyst. The total metal content of catalysts prepared by simultaneous
co-deposition of Pd and Ti was aimed at 20% weight; catalysts prepared on Pd/C had
higher metal content.
Table 5-4: Particle size, electrochemical surface area, Pd-Pd bond distance and metal content for
palladium-titanium electrocatalysts.
Catalyst Particle
size (nm)
ECSA
(m2 g
-1)
Pd-Pd bond
distance
(nm)
Metal content
(% weight)
Atomic
ratio
(Pd:Metal)
PdTi-EG11 7.2 10.7 0.2748 14.0 Pd, 3.8 Ti 1:0.7
PdTi-EG11-300 16.3 6.3 0.2747 14.0 Pd, 3.8 Ti 1:0.7
Pd9Ti-EG11 6.9 15.5 0.2751 20.0 Pd, 1.2 Ti 1:0.14
Pd9Ti-EG11-300 15.0 7.7 0.2745 20.0 Pd, 1.2 Ti 1:0.14
PdTi-H2-900 24.6 0.75 0.2748 10.6 Pd, 9.3 Ti 1:1.9
Pd(Ti)-H2-900 26.7 1.1 0.2747 22.8 Pd, 13.6 Ti 1:1.3
Pd9Ti-H2-900 24.6 1.7 0.2747 21.7 Pd, 1.3 Ti 1:0.16
Pd9(Ti)-H2-900 22.9 2.9 0.2746 21.9 Pd, 1.3 Ti 1:0.13
Pd-EG11-untr 7.3 14.6 0.2751 22.5 -
Pt-Etek 3.4 55.3 - 19.8 -
No palladium-titanium catalysts prepared by ethylene glycol reduction showed any
significant shift in the position of XRD diffractions patterns, compared to Pd/C, before or
after heat treatment at 300 ºC in H2. Thus, no significant changes in the Pd lattice were
observed. This was concluded from their Pd-Pd bond distances calculated from the XRD
patterns (Table 5-4), for PdTi-EG11, PdTi-EG11-300, Pd9Ti-EG11 and Pd9Ti-EG11-300
which were 0.2748, 0.2747, 0.2751 and 0.2745 nm, respectively. Some of the figures, in

108
particular those corresponding to Pd9Ti-EG11 and Pd9Ti-EG11-300, could indicate some
changes in the lattice; but as it was established that significant changes were those over
200% of the error around the Pd/C (0.2751 ± 0.0006 nm Pd-Pd bond), they were not
taken as significant changes.
Figure 5-8 shows the XRD patters of all palladium-titanium catalysts prepared by
ethylene glycol reduction. At first sight only the typical face-centered cubic pattern for
palladium could be observed, but on closer inspection, the XRD pattern for TiO2 in its
anatase form could be seen in PdTi-EG11 and PdTi-EG11-300, catalysts with higher Ti
content (1:0.7 Pd:Ti). The highest intensity diffraction peak for anatase, plane (101),
appeared at a diffraction angle at ca. 25.28º [15]; the broad peak generated by the carbon
support also appeared at ca. 25º, overlapping the anatase signal. The second peak in
intensity of anatase, 35%, is (200) at 48.05º, which was partially overlapped by Pd (200)
at 46.66º. Therefore, in catalysts with very low Ti content it was difficult to identify the
presence of anatase.
20 30 40 50 60 70 80 90
Inte
nsity/A
rbitra
ry U
nits
Position/o2Theta
Pd9Ti-EG11
Pd (111)
PdTi-EG11
PdTi-EG11-300
Pd9Ti-EG11-300
* TiO2 (anatase)
**
Ti (100)
Figure 5-8: X-ray diffraction patterns of carbon-supported Pd-Ti catalysts prepared by ethylene
glycol reduction.

109
Catalysts prepared by reduction in H2 at 900 ºC, either prepared on Pd/C or with both
metals co-deposited exhibited no significant differences in the Pd-Pd bond distance
compared to the average Pd/C. Bond distances calculated from XRD patterns (Table 5-4),
were 0.2748, 0.2747, 0.2747 and 0.2746 nm for PdTi-H2-900, Pd(Ti)-H2-900, Pd9Ti-H2-
900 and Pd9(Ti)-H2-900, respectively. Although no catalysts showed a change in the Pd-
Pd bond distance that we could consider meaningful according to selected criteria, the
average Pd-Pd bond distance for catalysts synthesized by reduction in H2 at 900 ºC was
0.2747 nm (lower than that of Pd/C). This may indicate the insertion of some Ti in the Pd
lattice. The preparation of Pd-Ti alloy by heat treatment at 900 ºC in a hydrogen
atmosphere was already claimed by Fernández et al. [3]. They supported their claim on
small shifts in the position of the reflections corresponding to the face-centered cubic
lattice of palladium; they also reported the presence of small amounts of anatase.
Therefore, the presence of some Pd-alloy could not be completely ruled out.
XRD patterns for PdTi-H2-900 and Pd(Ti)-H2-900, with atomic ratios 1:0.16 and 1:0.13
Pd:Ti, are shown in Figure 5-9 and Figure 5-10, respectively. For both catalysts XRD
patterns of TiO2 in its anatase form were obvious. On the other hand, the anatase patterns
could not be seen in catalysts with low Ti content, Pd9Ti-H2-900 and Pd9(Ti)-H2-900,
1:0.16 and 1:0.13 Pd:Ti, respectively. The only difference observed between catalysts
synthesized by the different reducing agents with low titanium content was the palladium
particles size.
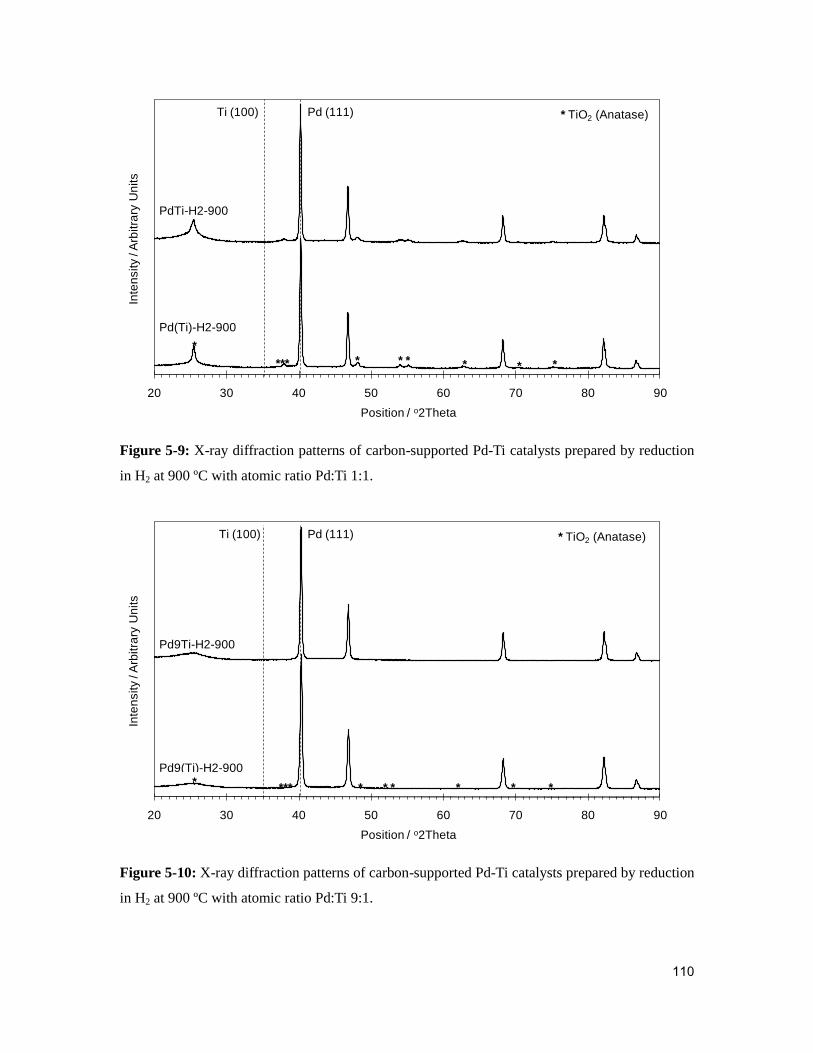
110
20 30 40 50 60 70 80 90
Inte
nsity / A
rbitra
ry U
nits
Position / o2Theta
Pd (111)
PdTi-H2-900
*
*** * * *
* TiO2 (Anatase)
Pd(Ti)-H2-900
** *
Ti (100)
Figure 5-9: X-ray diffraction patterns of carbon-supported Pd-Ti catalysts prepared by reduction
in H2 at 900 ºC with atomic ratio Pd:Ti 1:1.
20 30 40 50 60 70 80 90
Inte
nsity / A
rbitra
ry U
nits
Position / o2Theta
Pd9Ti-H2-900
Pd (111)
**** * * *
* TiO2 (Anatase)
Pd9(Ti)-H2-900
** *
Ti (100)
Figure 5-10: X-ray diffraction patterns of carbon-supported Pd-Ti catalysts prepared by reduction
in H2 at 900 ºC with atomic ratio Pd:Ti 9:1.
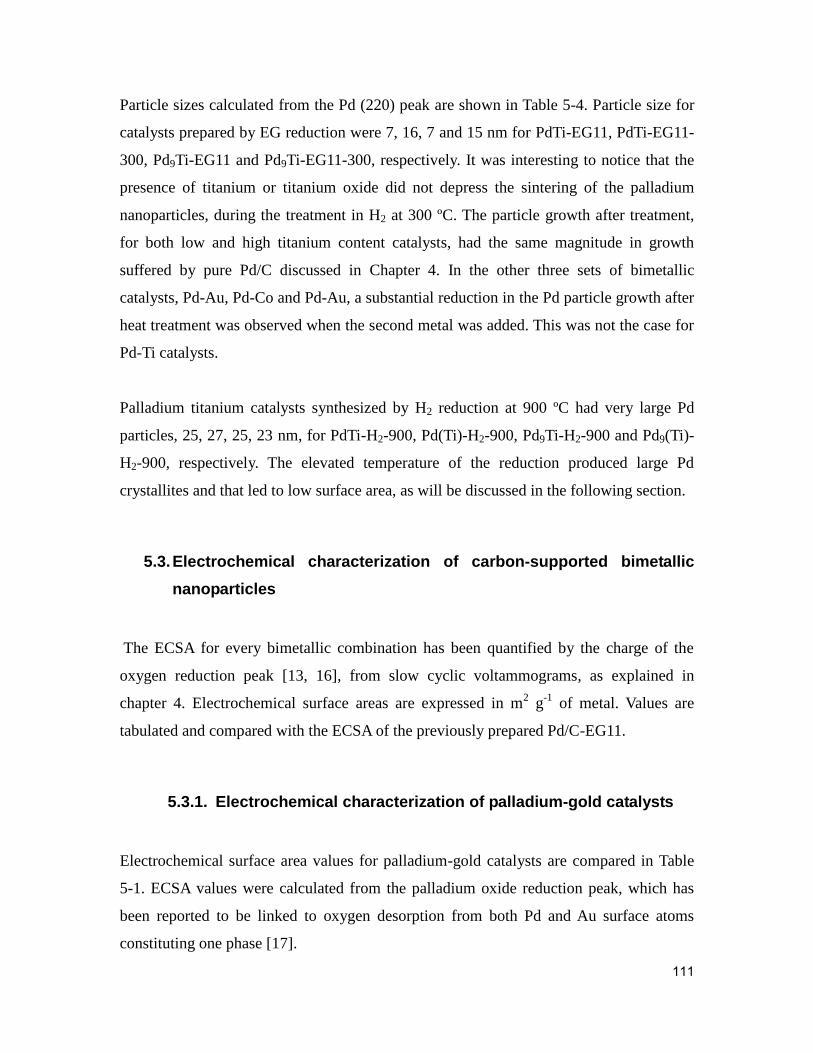
111
Particle sizes calculated from the Pd (220) peak are shown in Table 5-4. Particle size for
catalysts prepared by EG reduction were 7, 16, 7 and 15 nm for PdTi-EG11, PdTi-EG11-
300, Pd9Ti-EG11 and Pd9Ti-EG11-300, respectively. It was interesting to notice that the
presence of titanium or titanium oxide did not depress the sintering of the palladium
nanoparticles, during the treatment in H2 at 300 ºC. The particle growth after treatment,
for both low and high titanium content catalysts, had the same magnitude in growth
suffered by pure Pd/C discussed in Chapter 4. In the other three sets of bimetallic
catalysts, Pd-Au, Pd-Co and Pd-Au, a substantial reduction in the Pd particle growth after
heat treatment was observed when the second metal was added. This was not the case for
Pd-Ti catalysts.
Palladium titanium catalysts synthesized by H2 reduction at 900 ºC had very large Pd
particles, 25, 27, 25, 23 nm, for PdTi-H2-900, Pd(Ti)-H2-900, Pd9Ti-H2-900 and Pd9(Ti)-
H2-900, respectively. The elevated temperature of the reduction produced large Pd
crystallites and that led to low surface area, as will be discussed in the following section.
5.3. Electrochemical characterization of carbon-supported bimetallic
nanoparticles
The ECSA for every bimetallic combination has been quantified by the charge of the
oxygen reduction peak [13, 16], from slow cyclic voltammograms, as explained in
chapter 4. Electrochemical surface areas are expressed in m2 g
-1 of metal. Values are
tabulated and compared with the ECSA of the previously prepared Pd/C-EG11.
5.3.1. Electrochemical characterization of palladium-gold catalysts
Electrochemical surface area values for palladium-gold catalysts are compared in Table
5-1. ECSA values were calculated from the palladium oxide reduction peak, which has
been reported to be linked to oxygen desorption from both Pd and Au surface atoms
constituting one phase [17].

112
For both PdAu-EG11 and PdAu-EG11-300, the ECSA could not be determined due to the
dramatic decrease of the palladium oxide reduction peak after the initial fast cycles
(Figure 5-11A and B). During the first few potential cycles their electrochemical
behaviour was close to this of a pure Pd electrode (Section 4.3). On the positive sweep,
only current corresponding to the double layer charging current was recorded in the
potential range from ca. 0.30 to 0.80 V vs NHE; oxygen chemisorptions started above ca.
0.80 V. In the negative potential sweep, reduction of the oxide layer started at potentials
close to 0.95 V, the oxide reduction peak was located at ca. 0.80 V. From ca. 0.60 V to
0.30 V only the double layer charging current was observed in the cathodic sweep. At a
electrode potential below ca. 0.30 V a cathodic current was recorded; this current was
attributed to, initially, hydrogen adsorption on the palladium surface and, at lower
potentials, to the dissolution of hydrogen in the bulk of the palladium, as previously
discussed for the Pd electrode. It was also observed that oxygen and hydrogen adsorption
and desorption peaks were less pronounced on the heat treated catalyst (PdAu-EG11-
300); this was attributed to a larger amount of gold on the catalyst surface indicating a
more uniform alloy. After the initial electrode conditioning of ten cycles in N2 saturated
solution at scan rate 50 mV s-1
, the electrode response lost its palladium electrochemical
character and the voltammogram exhibited the electrochemical characteristics of a pure
gold electrode, where no oxidation or reduction currents could be observed when the
potential is cycled between 0.04 and 1.24 V vs NHE [18]. These observations suggest
that the electrochemical conditioning of Pd-Au alloy electrodes in acid electrolyte,
containing ca. 60% at Au, leads to a gold-like behavior. Similar behavior was previously
reported by Damjanovic et al. for gold-rich palladium alloys treated with concentrated
hydrochloric acid [19]. Łukaszewski et al. also reported that the voltammograms of Pd-
Au alloys suffer significant changes during potential cycling in acid media, this is
believed to be due to the selective dissolution of Pd [17].

113
-2.5
-2
-1.5
-1
-0.5
0
0.5
1
1.5
2
2.5
0 0.1 0.2 0.3 0.4 0.5 0.6 0.7 0.8 0.9 1 1.1 1.2 1.3
E / V (vs NHE)
j /
mA
cm
-2
PdAu-EG11
last cycle
A
-2.5
-2
-1.5
-1
-0.5
0
0.5
1
1.5
2
2.5
0 0.1 0.2 0.3 0.4 0.5 0.6 0.7 0.8 0.9 1 1.1 1.2 1.3
E / V (vs NHE)
j /
mA
cm
-2
PdAu-EG11-300
last cycle
B
Figure 5-11: Fast scan cyclic voltammograms of carbon-supported Pd-Au catalysts A) PdAu-
EG11 and B) PdAu-EG11-300.
Pd anodic dissolution starts at potentials close to 0.96 V in sulphuric acid solution while
Au dissolution does not occur at potentials below ca. 1.5 V [20]; therefore the electrode
conditioning would cause the dissolution of the Pd from the alloy surface. The stirring

114
caused by the N2 bubbles and the large electrolyte to catalyst ratio would lead to a very
low palladium re-deposition rate at cathodic potentials leaving a gold-rich electrode
surface. The study of the ORR on the electrode surface confirmed the hypothesis of the
gold rich surface (Section 5.4.1).
When the atomic ratio of Pd:Au was changed from 1:1.4 to 1:0.14 for Pd9Au-EG11 and
Pd9Au-EG11-300, respectively, the decrease in the area under the palladium oxide
reduction peak during the initial fast potential cycles still occurred. However, the
extension of this decrease was smaller compared to PdAu-EG11 and PdAu-EG11-300
(Figure 5-12A and B). From the X-ray diffraction patterns it was concluded that in both
catalysts several metal phases were present, therefore the decrease in the reduction peak
could be due to the dissolution of Pd from the surface of the Pd-Au phase leaving a gold-
rich surface. The palladium phase would also suffer dissolution but the decrease in the
area would be insignificant in only a few potential cycles. The overall result was a
smaller loss in the ECSA than in the catalysts with high Au content. That would agree
with the data for catalysts prepared on Pd/C (Figure 5-13 and Figure 5-14), with low
degree of Pd-Au alloy formation, presenting a small decrease in the Pd oxide reduction
peak during the initial conditioning.

115
-2.5
-2
-1.5
-1
-0.5
0
0.5
1
1.5
2
2.5
0 0.1 0.2 0.3 0.4 0.5 0.6 0.7 0.8 0.9 1 1.1 1.2 1.3
E / V (vs NHE)
j /
mA
cm
-2
Pd9Au-EG11
last cycle
A
-2.5
-2
-1.5
-1
-0.5
0
0.5
1
1.5
2
2.5
0 0.1 0.2 0.3 0.4 0.5 0.6 0.7 0.8 0.9 1 1.1 1.2 1.3
E / V (vs NHE)
j /
mA
cm
-2
Pd9Au-EG11-300
last cycle
B
Figure 5-12: Fast scan cyclic voltammograms of carbon-supported Pd-Au catalysts A) Pd9Au-
EG11 and B) Pd9Au-EG11-300.
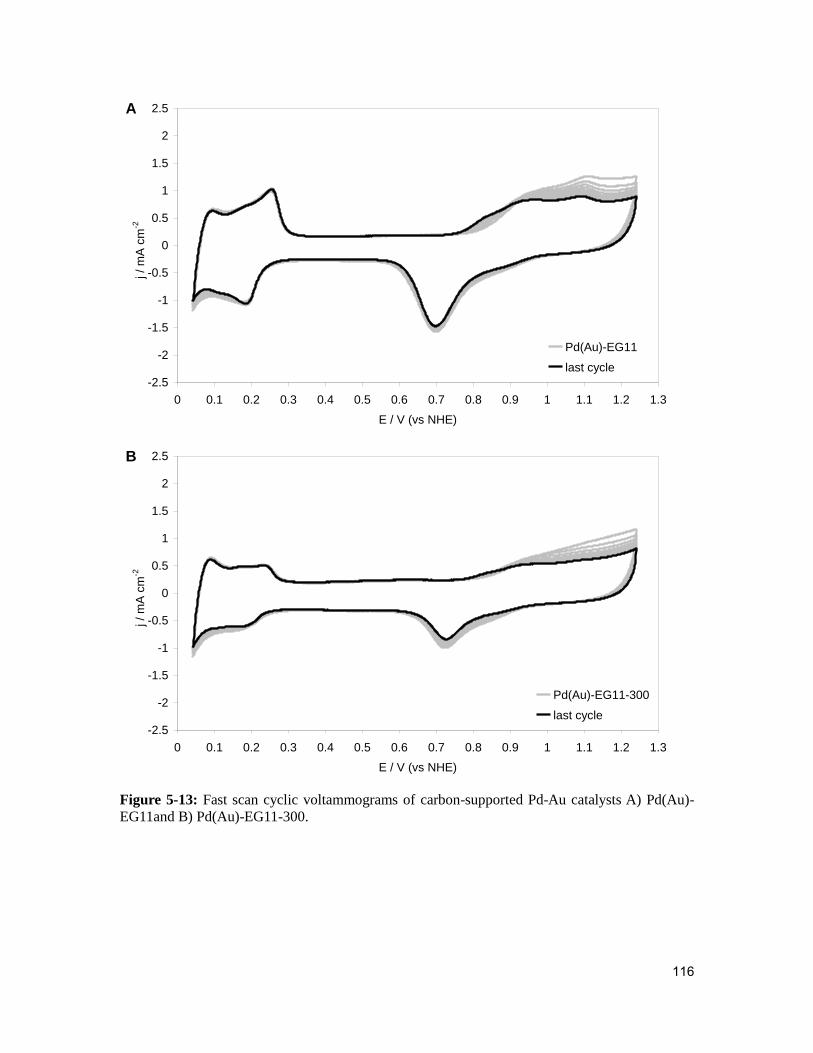
116
-2.5
-2
-1.5
-1
-0.5
0
0.5
1
1.5
2
2.5
0 0.1 0.2 0.3 0.4 0.5 0.6 0.7 0.8 0.9 1 1.1 1.2 1.3
E / V (vs NHE)
j /
mA
cm
-2
Pd(Au)-EG11
last cycle
A
-2.5
-2
-1.5
-1
-0.5
0
0.5
1
1.5
2
2.5
0 0.1 0.2 0.3 0.4 0.5 0.6 0.7 0.8 0.9 1 1.1 1.2 1.3
E / V (vs NHE)
j /
mA
cm
-2
Pd(Au)-EG11-300
last cycle
B
Figure 5-13: Fast scan cyclic voltammograms of carbon-supported Pd-Au catalysts A) Pd(Au)-
EG11and B) Pd(Au)-EG11-300.
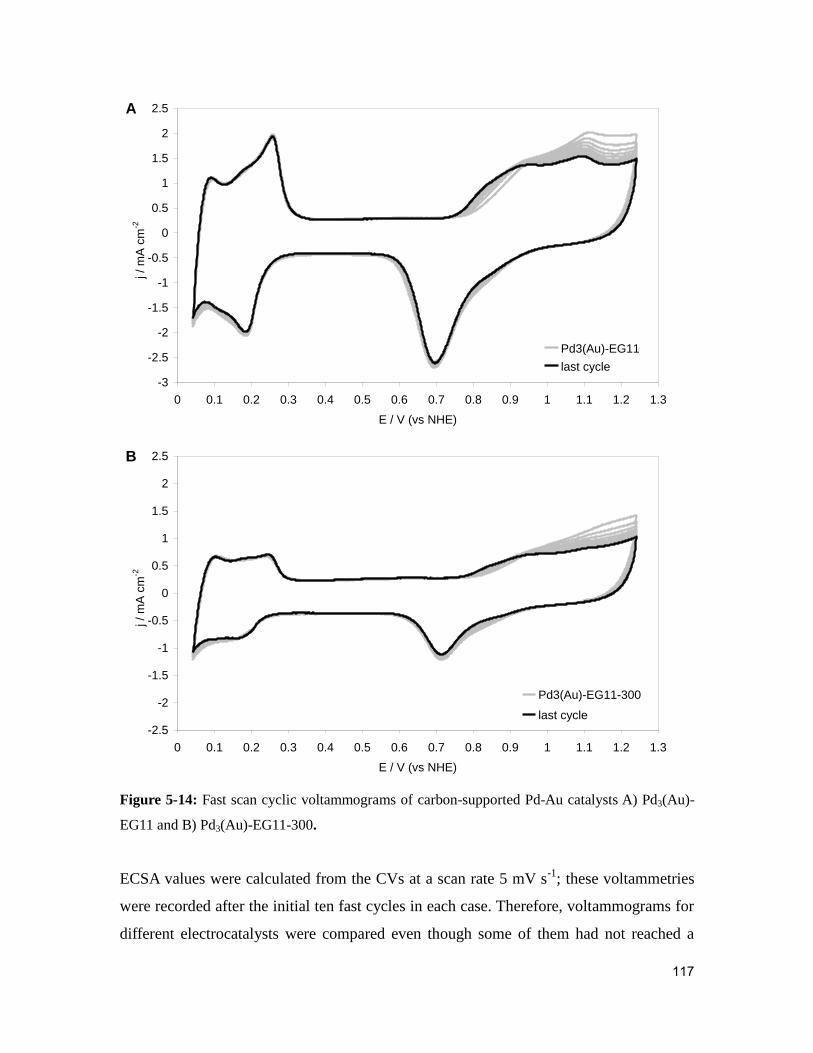
117
-3
-2.5
-2
-1.5
-1
-0.5
0
0.5
1
1.5
2
2.5
0 0.1 0.2 0.3 0.4 0.5 0.6 0.7 0.8 0.9 1 1.1 1.2 1.3
E / V (vs NHE)
j /
mA
cm
-2
Pd3(Au)-EG11
last cycle
A
-2.5
-2
-1.5
-1
-0.5
0
0.5
1
1.5
2
2.5
0 0.1 0.2 0.3 0.4 0.5 0.6 0.7 0.8 0.9 1 1.1 1.2 1.3
E / V (vs NHE)
j /
mA
cm
-2
Pd3(Au)-EG11-300
last cycle
B
Figure 5-14: Fast scan cyclic voltammograms of carbon-supported Pd-Au catalysts A) Pd3(Au)-
EG11 and B) Pd3(Au)-EG11-300.
ECSA values were calculated from the CVs at a scan rate 5 mV s-1
; these voltammetries
were recorded after the initial ten fast cycles in each case. Therefore, voltammograms for
different electrocatalysts were compared even though some of them had not reached a

118
steady state voltammogram. The slow scan rate voltammograms for Pd-Au catalysts are
compared in Figure 5-15A when prepared by co-deposition and Figure 5-15B, when
prepared on Pd/C, respectively.
-0.4
-0.3
-0.2
-0.1
0
0.1
0.2
0.3
0 0.1 0.2 0.3 0.4 0.5 0.6 0.7 0.8 0.9 1 1.1 1.2 1.3
E / V (vs NHE)
j /
mA
cm
-2
PdAu-EG11
Pd9Au-EG11
PdAu-EG11-300
Pd9Au-EG11-300
A
-0.4
-0.3
-0.2
-0.1
0
0.1
0.2
0.3
0 0.1 0.2 0.3 0.4 0.5 0.6 0.7 0.8 0.9 1 1.1 1.2 1.3
E / V (vs NHE)
j /
mA
cm
-2
Pd(Au)-EG11
Pd3(Au)-EG11
Pd(Au)-EG11-300
Pd3(Au)-EG11-300
B
Figure 5-15: Cyclic voltammograms of carbon-supported Pd-Au catalysts prepared A) by co-
deposition of Pd and Au salts on carbon and B) on Pd/C.

119
In Figure 5-15A can be observed that co-deposited electrocatalysts with high gold content
(PdAu-EG11 and PdAu-EG11-300) exhibited a gold-like behavior, no oxidation or
reduction currents could be observed when the potential is cycled between 0.04 and 1.24
V vs NHE. For low Au content (Pd9Au-EG11 and Pd9Au-EG11-300) anodic and
cathodeic currents were observed in the oxygen and hydrogen regions; these currents
were larger for Pd9Au-EG11. When Au was deposited on Pd/C (Figure 5-15B) all
catalysts exhibited oxygen and hydrogen adsorption/desorption currents; these been
larger for catalysts with lower Au content and un-treated. The largest ECSA obtained by
the co-deposition method was for Pd9Au-EG11 (11 m2 g
-1) whilst for catalysts prepared
on Pd/C a maximum value of 8 m2 g
-1 was obtained for Pd3(Au)-EG11. For Pd3(Au)-
EG11, particle sizes were approximately 6 nm for Pd and 13 nm for Au. The particle size
of Pd9Au-EG11 could not be estimated due to the overlapping of the peaks in the XRD
patterns (Figure 5-1). Therefore the relationship between the particle size and the ECSA
could not be discussed.
In every Pd-Au catalyst a large decrease in the ECSA was recorded after heat treatment in
H2 atmosphere. The decrease in area was greater than would be expected by the particle
size increase. Pd9Au-EG11 and Pd3(Au)-EG11 lost approximately 60% of its ECSA after
heat treatment, from 11 to 5 m2 g
-1 and 8 to 3 m
2 g
-1, respectively. For Pd(Au)-EG11 the
decrease was over 80%, from 4 to 0.6 m2 g
-1. The increase in the particle size, discussed
in the previous paragraph, could not be the only cause of this large loss of ECSA. Thus,
decrease of the ECSA was probably strongly affected by the increase in the degree of
alloy. ECSA values were calculated from the oxide reduction peak; this peak does not
appear in a gold electrode in the potential range studied. Therefore the more Au is
introduced in the Pd lattice the higher the blockage to oxygen adsorption is on its surface
and the smaller the area under the oxide reduction peak. Studies of the O2 adsorption on
Pd-Au alloys showed that adsorption is almost zero for Au content higher than 30% [2].
This would explain the extreme decrease in the surface area, of much larger magnitude
than the increase in the particle size; the effect observed in the ORR activity was
different, as discussed in Section 5.4.1.

120
A slight shift of the position of the palladium oxide reduction peaks after heat treatment
was also observed. The position of the oxide reduction peak shifted with alloy formation
due to a change in the catalyst properties. In Section 5.2.1 it was discussed how treatment
in a H2 atmosphere at 300 ºC increased the degree of alloy, to different extents, depending
on the catalysts. The oxide reduction peak position shifted from ca. 0.73 to 0.74 V for
Pd9Au-EG11 to Pd9Au-EG11-300, from ca. 0.73 to 0.745 V for Pd(Au)-EG11 to Pd(Au)-
EG11-300 and from ca. 0.73 to 0.74 V for Pd3(Au)-EG11 to Pd3(Au)-EG11-300. This
shift in the palladium oxide peak position with gold content of the electrode surface was
reported by Łukaszewski et al. [17]. The shift in the position would also confirm the
above mentioned change in the surface composition, towards a gold-richer surface;
causing the dramatic ECSA decrease.
5.3.2. Electrochemical characterization of palladium-cobalt catalysts
Unlike palladium-gold catalysts, ECSA values for palladium-cobalt catalysts did not
show dramatic differences with different metal ratios and synthetic methods, and no
significant differences could be found within each synthetic method. Values of ECSA are
compared in Table 5-2. Slow cyclic voltammetries for all palladium-cobalt catalysts
prepared are shown in Figure 5-16. As a general trend, in all the Pd-Co voltammograms
only current corresponding to the double layer charging current was observed in the
positive sweep in the potential range from ca. 0.25 to 0.80 V vs NHE; oxygen
chemisorptions started above ca. 0.80 V. In the negative potential sweep, reduction of the
oxide layer started at potentials close to 0.85 V, the oxide reduction peak was located at
ca. 0.75 V. From ca. 0.60 V to 0.25 V only the double layer charging current was
observed in the cathodic sweep and a cathodic current was recorded from ca. 0.25 V; this
current was attributed to hydrogen adsorption dissolution as previously discussed for the
Pd electrode.

121
-0.6
-0.5
-0.4
-0.3
-0.2
-0.1
0
0.1
0.2
0.3
0.4
0.5
0 0.1 0.2 0.3 0.4 0.5 0.6 0.7 0.8 0.9 1 1.1 1.2 1.3
E / V (vs NHE)
j / m
A c
m-2
PdCo-EG11
PdCo-EG11-300
Pd4Co-EG11
Pd4Co-EG11-300
A
-0.6
-0.5
-0.4
-0.3
-0.2
-0.1
0
0.1
0.2
0.3
0.4
0.5
0 0.1 0.2 0.3 0.4 0.5 0.6 0.7 0.8 0.9 1 1.1 1.2 1.3
E / V (vs NHE)
j / m
A c
m-2
Pd(Co)-EG11
Pd(Co)-EG11-300
Pd4(Co)-EG11
Pd4(Co)-EG11-300
B
Figure 5-16: Cyclic voltammograms of carbon-supported Pd-Co catalysts prepared A) by co-
deposition of Pd and Co salts on carbon and B) on Pd/C.
Catalyst prepared by co-deposition of Pd and Co salts, PdCo-EG11 and Pd4Co-EG11,
presented ECSA values of 12 and 14 m2 g
-1 and palladium contents of 12 and 20%
weight, respectively. Electrochemical surface area of PdCo-EG11 was ca. 90% of the area
of Pd4Co-EG11, whilst the palladium content of PdCo-EG11 was ca. 60% of Pd4Co-
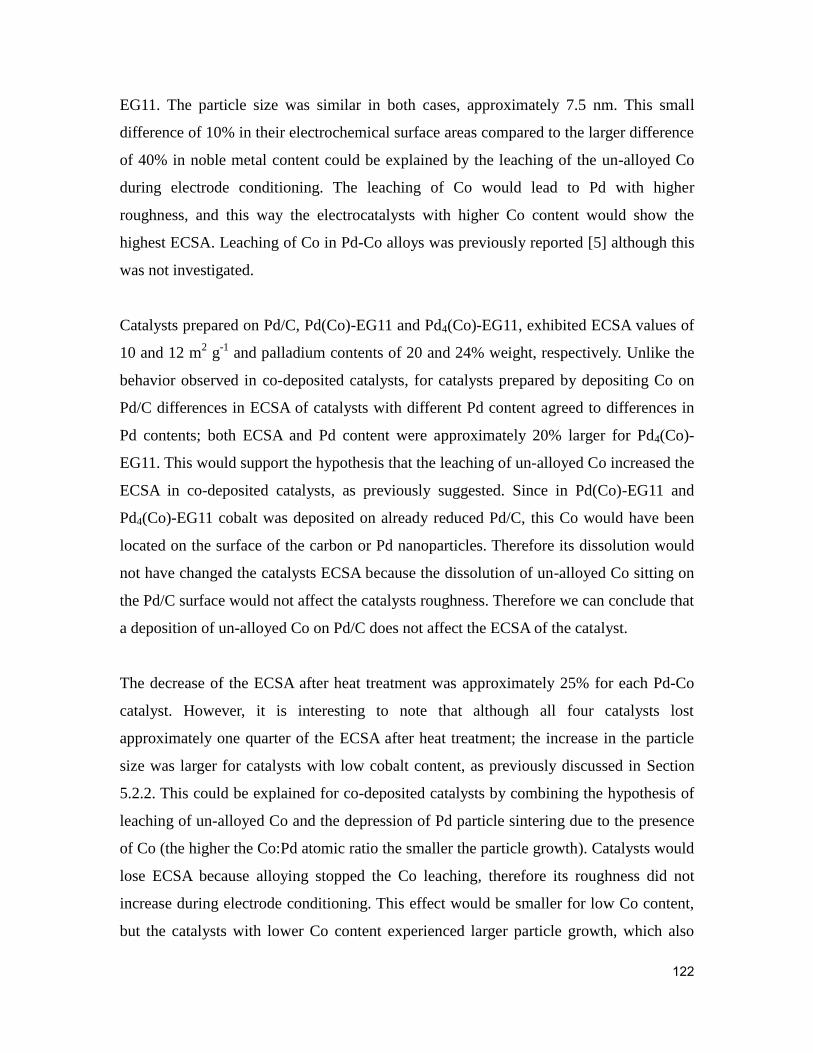
122
EG11. The particle size was similar in both cases, approximately 7.5 nm. This small
difference of 10% in their electrochemical surface areas compared to the larger difference
of 40% in noble metal content could be explained by the leaching of the un-alloyed Co
during electrode conditioning. The leaching of Co would lead to Pd with higher
roughness, and this way the electrocatalysts with higher Co content would show the
highest ECSA. Leaching of Co in Pd-Co alloys was previously reported [5] although this
was not investigated.
Catalysts prepared on Pd/C, Pd(Co)-EG11 and Pd4(Co)-EG11, exhibited ECSA values of
10 and 12 m2 g
-1 and palladium contents of 20 and 24% weight, respectively. Unlike the
behavior observed in co-deposited catalysts, for catalysts prepared by depositing Co on
Pd/C differences in ECSA of catalysts with different Pd content agreed to differences in
Pd contents; both ECSA and Pd content were approximately 20% larger for Pd4(Co)-
EG11. This would support the hypothesis that the leaching of un-alloyed Co increased the
ECSA in co-deposited catalysts, as previously suggested. Since in Pd(Co)-EG11 and
Pd4(Co)-EG11 cobalt was deposited on already reduced Pd/C, this Co would have been
located on the surface of the carbon or Pd nanoparticles. Therefore its dissolution would
not have changed the catalysts ECSA because the dissolution of un-alloyed Co sitting on
the Pd/C surface would not affect the catalysts roughness. Therefore we can conclude that
a deposition of un-alloyed Co on Pd/C does not affect the ECSA of the catalyst.
The decrease of the ECSA after heat treatment was approximately 25% for each Pd-Co
catalyst. However, it is interesting to note that although all four catalysts lost
approximately one quarter of the ECSA after heat treatment; the increase in the particle
size was larger for catalysts with low cobalt content, as previously discussed in Section
5.2.2. This could be explained for co-deposited catalysts by combining the hypothesis of
leaching of un-alloyed Co and the depression of Pd particle sintering due to the presence
of Co (the higher the Co:Pd atomic ratio the smaller the particle growth). Catalysts would
lose ECSA because alloying stopped the Co leaching, therefore its roughness did not
increase during electrode conditioning. This effect would be smaller for low Co content,
but the catalysts with lower Co content experienced larger particle growth, which also

123
decreased its surface area. This would have produced an overall similar decrease in the
ECSA of PdCo-EG11 and Pd4Co-EG11.
5.3.3. Electrochemical characterization of palladium-iron catalysts
Slow cyclic voltammetries for PdFe-EG11 and Pd3Fe-EG11 showed the electrochemical
characteristics of a palladium electrode (Section 4.3): oxygen chemisorptions started
above ca. 0.8 V in the positive sweep and in the negative potential sweep reduction of the
oxide layer started close to 0.8 V, the oxide reduction peak was located at ca. 0.7 V.
However, it is interesting to comment on the voltammograms recorded whilst
conditioning the electrode (Figure 5-17). During the first cathodic potential sweep a large
reduction peak, commencing at ca. 0.53 V and with its maximum at ca. 0.36 V, appeared
in both cases. The corresponding oxidation peak, in the following anodic sweep at ca.
0.75 V, had a much smaller area in both cases. In the second cycle both reduction and
oxidation peaks could barely be seen and they were not present in the third cycle. That
was believed to be due to all the iron in the electrode being oxidized to a soluble form.
The dissolved iron would probably have had some influence in the ORR activity of the
catalysts; this issue is discussed in Section 5.4.3.

124
-4.5
-4.0
-3.5
-3.0
-2.5
-2.0
-1.5
-1.0
-0.5
0.0
0.5
1.0
1.5
2.0
0 0.2 0.4 0.6 0.8 1 1.2
E / V (vs NHE)
j /
mA
cm
-2
PdFe-EG11
last cycle
A
-4.5
-4.0
-3.5
-3.0
-2.5
-2.0
-1.5
-1.0
-0.5
0.0
0.5
1.0
1.5
2.0
0 0.2 0.4 0.6 0.8 1 1.2
E / V (vs NHE)
j /
mA
cm
-2
Pd3Fe-EG11
last cycle
B
Figure 5-17: Fast scan cyclic voltammograms of carbon-supported Pd-Fe catalysts A) PdFe-
EG11 and B) Pd3Fe-EG11.
This reduction current is believed to be due to the reduction of iron species present in the
electrode in an oxidized form. According to the Pourbaix diagram for iron in aqueous

125
solution, the reduction of Fe2O3 at pH 1 starts at ca.0.52 V vs NHE [21], which matches
the position of the discussed reduction peak. Therefore the Fe2O3 in the electrocatalysts
would be reduced to Fe2+
enabling the electrode to go into the solution. Due to the large
volume of electrolyte compared to the amount of catalysts only a very small fraction
would redeposit during the following anodic sweep. The area under the iron oxide
reduction peak was larger for PdFe-EG11 than for Pd3Fe-EG11, indicating a larger
amount of iron in the electrode, which agrees with the EDXA analyses.
After treating PdFe-EG11 and Pd3Fe-EG11 under a H2 flow at 300 ºC a small decrease in
the area of the iron oxide reduction peak was observed in both cases, although the
behavior during fast CV cycling remained the same. Peaks caused by the reduction and
re-oxidation of Fe3+
disappeared after the first two cycles.
Catalysts synthesized by H2 reduction at 500 ºC also exhibited the iron oxide reduction
peak in the initial cycle of the conditioning. The magnitude of this peak was smaller in
any of the catalysts prepared by EG reduction. The smallest amount of amorphous Fe2O3
was found to be in Pd3(Fe)-H2-500.
The electrochemical surface area of 7 m2 g
-1 for PdFe-EG11 was smaller than for Pd3Fe-
EG11, 11 m2 g
-1 (Table 5-3). This smaller surface area appeared to be a consequence of
the larger particle size of PdFe-EG11, 11 nm compared with the 8 nm of Pd3Fe-EG11.
This would suggest that the presence of FeCl3 somehow affects the deposition of Pd with
EG when both salts are present in the solution. Larger amounts of Fe salt in the solution
would induce the formation of larger Pd particles.
Approximately one quarter of the ECSA was lost after treatment at 300 ºC under H2 flow
in both Pd-Fe catalysts prepared by EG reduction. A small amount of sintering could be
one of the causes of this decrease in ECSA, although no significant particle growth was
observed in any catalyst. The introduction of some Fe in the Pd lattice, discussed in the
previous section, could have affected the ECSA calculated for PdFe-EG11-300 and
Pd3Fe-EG11-300.

126
Electrochemical surface areas for Pd-Fe catalysts prepared by H2 reduction at 500 ºC and
co-deposition, PdFe-H2-500 and Pd3Fe-H2-500, were 5 and 11 m2 g
-1, respectively. When
prepared on Pd/C, Pd(Fe)-H2-500 and Pd3(Fe)-H2-500, the difference was less, 6 and 7
m2 g
-1, respectively. Surprisingly, differences in the ECSA for catalysts prepared by H2
reduction at 500 ºC did not correspond to differences in particle size calculated from the
XRD; sizes for PdFe-H2-500 and Pd3Fe-H2-500, were 7 and 8 nm and for Pd(Fe)-H2-500
and Pd3(Fe)-H2-500 were 8 and 9 nm, respectively (Table 5-3).
Taking into account that the ECSA was calculated per gram of metal and since no
significant disparity existed between PdFe-H2-500 and Pd3Fe-H2-500 particle sizes, the
fact that Pd3Fe-H2-500 had approximately double the ECSA could be explained by its
larger Pd content; 16% weight versus the 10% weight in PdFe-H2-500. The difference in
the Pd content would also explain why the ECSA of Pd(Fe)-H2-500 was smaller than the
ECSA of Pd3(Fe)-H2-500, since the Pd contents measured by EDXA were 23% and 26%,
respectively.
Interestingly, slow scan cyclic voltammetries for catalysts prepared by ethylene glycol
reduction presented different electrochemical characteristics before and after heat
treatment at 300 ºC in H2 (Figure 5-18A). As previously mentioned, voltammetry at a
scan rate 5 mV s-1
for PdFe-EG11 and Pd3Fe-EG11 produced the electrochemical
characteristics of a palladium electrode; the palladium oxide reduction peak was at ca.
0.72 V vs NHE. After heat treatment, PdFe-EG11-300, which showed the smallest
change, gave a small reduction peak at potentials close to 0.7 V vs NHE, which seemed
to be overlapped with the Pd oxide reduction peak. This small peak is believed to be
caused by the introduction of a small amount of Fe atoms in the Pd lattice; introduction
which could not be confirmed from XRD analyses, as discussed in the previous section.
More obvious was the change in the electrochemical behavior of Pd3Fe-EG11-300; the
whole Pd oxide reduction peak exhibited a shift of ca. 15 mV towards lower potentials.
This shift was believed to be caused by the introduction, to a larger extension than in the
PdFe-EG11-300, of Fe atoms in the Pd lattice. This hypothesis is supported by Pd-Pd

127
bond distances calculated from the X-ray diffraction angles, which were significantly
different from pure Pd. The influence of this change in the ORR activity is discussed in
Section 5.4.3.
-0.4
-0.3
-0.2
-0.1
0
0.1
0.2
0.3
0.4
0 0.1 0.2 0.3 0.4 0.5 0.6 0.7 0.8 0.9 1 1.1 1.2 1.3
E / V (vs NHE)
j /
mA
cm
-2
PdFe-EG11
PdFe-EG11-300
Pd3Fe-EG11
Pd3Fe-EG11-300
A
-0.5
-0.4
-0.3
-0.2
-0.1
0
0.1
0.2
0.3
0.4
0 0.1 0.2 0.3 0.4 0.5 0.6 0.7 0.8 0.9 1 1.1 1.2 1.3
E / V (vs NHE)
j /
mA
cm
-2
PdFe-H2-500
Pd3Fe-H2-500
Pd(Fe)-H2-500
Pd3(Fe)-H2-500
B
Figure 5-18: Cyclic voltammograms of carbon-supported Pd-Fe catalysts prepared A) by
ethylene glycol reduction and B) by reduction in H2 at 500 ºC.

128
Slow scan voltammetries of catalysts prepared by H2 reduction at 500 ºC all presented
different characteristics to Pd/C (Figure 5-18B). Catalysts with high iron content, PdFe-
H2-500 and Pd(Fe)-H2-500, presented two peaks in the cathodic sweep, one at ca. 0.72
and the other at ca. 0.65 V vs NHE. These two peaks were not resolved in the fast scan
rate voltammograms. The peak at 0.72 V would be due to reduction of palladium oxide,
the peak at 0.65 V would then correspond to the reduction of the Pd-Fe alloy. No slow
scan voltammograms in N2 saturated solution were found in the literature for comparison.
Catalysts with low iron content Pd3Fe-H2-500 and Pd3(Fe)-H2-500, showed a single broad
peak at ca. 0.68 V vs NHE which is believed to be a combination of the two peaks
observed in catalysts with higher Fe content. The Pd-Fe alloy oxide reduction peak would
be masked by the palladium oxide reduction peak due to the large amount of Pd in the
catalyst. Shifts in the oxide reduction to lower potentials for Pd-Fe compared with Pd
where also reported by Shao et al. [14].
5.3.4. Electrochemical characterization of palladium- titanium
catalysts
The shape of all slow cyclic voltammograms in a N2 saturated electrolyte of Pd-Ti
catalysts, both prepared by ethylene glycol reduction (Figure 5-19A) or by reduction in
H2 at 900 ºC (Figure 5-19B), exhibited the electrochemical behavior of a pure Pd
electrode (Section 4-3). On the positive sweep oxygen chemisorptions started above ca.
0.8 V. In the negative potential sweep, reduction of the oxide layer started at potentials of
ca. 0.8 V and the oxide reduction peak was located at ca. 0.7 V. From ca. 0.6 V to 0.3 V
only the double layer charging current was observed in the cathodic sweep. At an
electrode potential below ca. 0.3 V a cathodic current was recorded which was attributed
to hydrogen adsorption and dissolution. Titanium oxide electrodes reported in the
literature [22] do not present reduction or oxidation peaks in the selected potential range.
Therefore its presence could not be determined by these voltammograms.

129
-0.5
-0.4
-0.3
-0.2
-0.1
0
0.1
0.2
0.3
0.4
0 0.1 0.2 0.3 0.4 0.5 0.6 0.7 0.8 0.9 1 1.1 1.2 1.3
E / V (vs NHE)
j /
mA
cm
-2
Pd9Ti-EG11
Pd9Ti-EG11-300
PdTi-EG11
PdTi-EG11-300
A
-0.5
-0.4
-0.3
-0.2
-0.1
0
0.1
0.2
0.3
0.4
0 0.1 0.2 0.3 0.4 0.5 0.6 0.7 0.8 0.9 1 1.1 1.2 1.3
E / V (vs NHE)
j / m
A c
m-2
PdTi-H2-900
Pd(Ti)-H2-900
Pd9Ti-H2-900
Pd9(Ti)-H2-900
B
Figure 5-19: Cyclic voltammograms of carbon-supported Pd-Ti catalysts prepared A) by ethylene
glycol reduction and B) by reduction in H2 at 900 ºC.
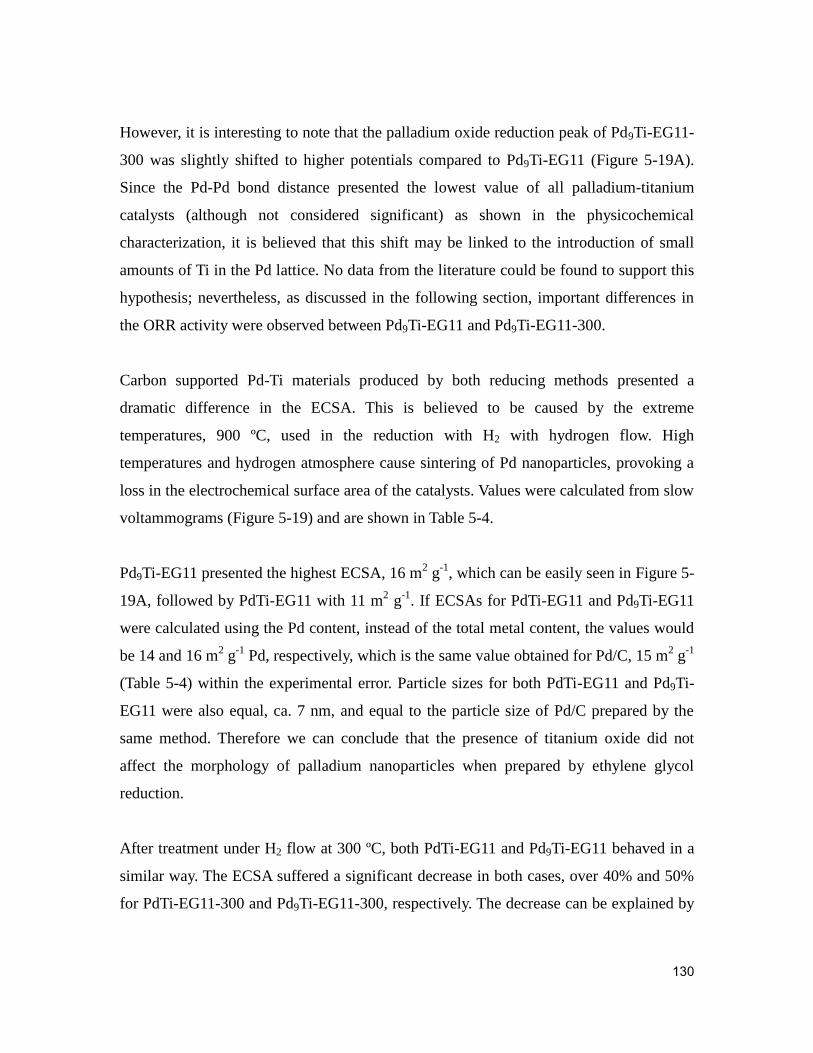
130
However, it is interesting to note that the palladium oxide reduction peak of Pd9Ti-EG11-
300 was slightly shifted to higher potentials compared to Pd9Ti-EG11 (Figure 5-19A).
Since the Pd-Pd bond distance presented the lowest value of all palladium-titanium
catalysts (although not considered significant) as shown in the physicochemical
characterization, it is believed that this shift may be linked to the introduction of small
amounts of Ti in the Pd lattice. No data from the literature could be found to support this
hypothesis; nevertheless, as discussed in the following section, important differences in
the ORR activity were observed between Pd9Ti-EG11 and Pd9Ti-EG11-300.
Carbon supported Pd-Ti materials produced by both reducing methods presented a
dramatic difference in the ECSA. This is believed to be caused by the extreme
temperatures, 900 ºC, used in the reduction with H2 with hydrogen flow. High
temperatures and hydrogen atmosphere cause sintering of Pd nanoparticles, provoking a
loss in the electrochemical surface area of the catalysts. Values were calculated from slow
voltammograms (Figure 5-19) and are shown in Table 5-4.
Pd9Ti-EG11 presented the highest ECSA, 16 m2 g
-1, which can be easily seen in Figure 5-
19A, followed by PdTi-EG11 with 11 m2 g
-1. If ECSAs for PdTi-EG11 and Pd9Ti-EG11
were calculated using the Pd content, instead of the total metal content, the values would
be 14 and 16 m2 g
-1 Pd, respectively, which is the same value obtained for Pd/C, 15 m
2 g
-1
(Table 5-4) within the experimental error. Particle sizes for both PdTi-EG11 and Pd9Ti-
EG11 were also equal, ca. 7 nm, and equal to the particle size of Pd/C prepared by the
same method. Therefore we can conclude that the presence of titanium oxide did not
affect the morphology of palladium nanoparticles when prepared by ethylene glycol
reduction.
After treatment under H2 flow at 300 ºC, both PdTi-EG11 and Pd9Ti-EG11 behaved in a
similar way. The ECSA suffered a significant decrease in both cases, over 40% and 50%
for PdTi-EG11-300 and Pd9Ti-EG11-300, respectively. The decrease can be explained by

131
the particle size growth after heat treatment as previously mentioned. The effect of TiO2
on the activity towards ORR will be discussed in the following section.
Cyclic voltammetries for Pd-Ti catalysts prepared by reduction at 900 ºC in H2 are
compared in Figure 5-19B. The largest ECSA calculated belonged to Pd9(Ti)-H2-900 and
was just below 3 m2 g
-1; the smallest was for PdTi-H2-900, 0.75 m
2 g
-1. These small
active surface areas are believed to be due to particularly large particles. Particle sizes are
in the range of 23 to 27 nm (Table 5-4). The smallest ECSA recorded for Pd-Ti and
bimetallic catalysts was that for PdTi-H2-900, under 0.8 m2 g
-1. The low Pd content, ca.
10% weight, combined with the large particle size, 25 nm, were believed to be the cause
of this small value.
5.4. Activity towards the oxygen reduction reaction of carbon-supported
bimetallic nanoparticles
5.4.1. Evaluation of palladium-gold catalysts
Onset potentials, exchange current density and Tafel slopes for palladium-gold catalysts
were compared with the same parameters for Pd/C-EG11, Pt/C from E-Tek and Au
electrodes data from the literature (Table 5-5).
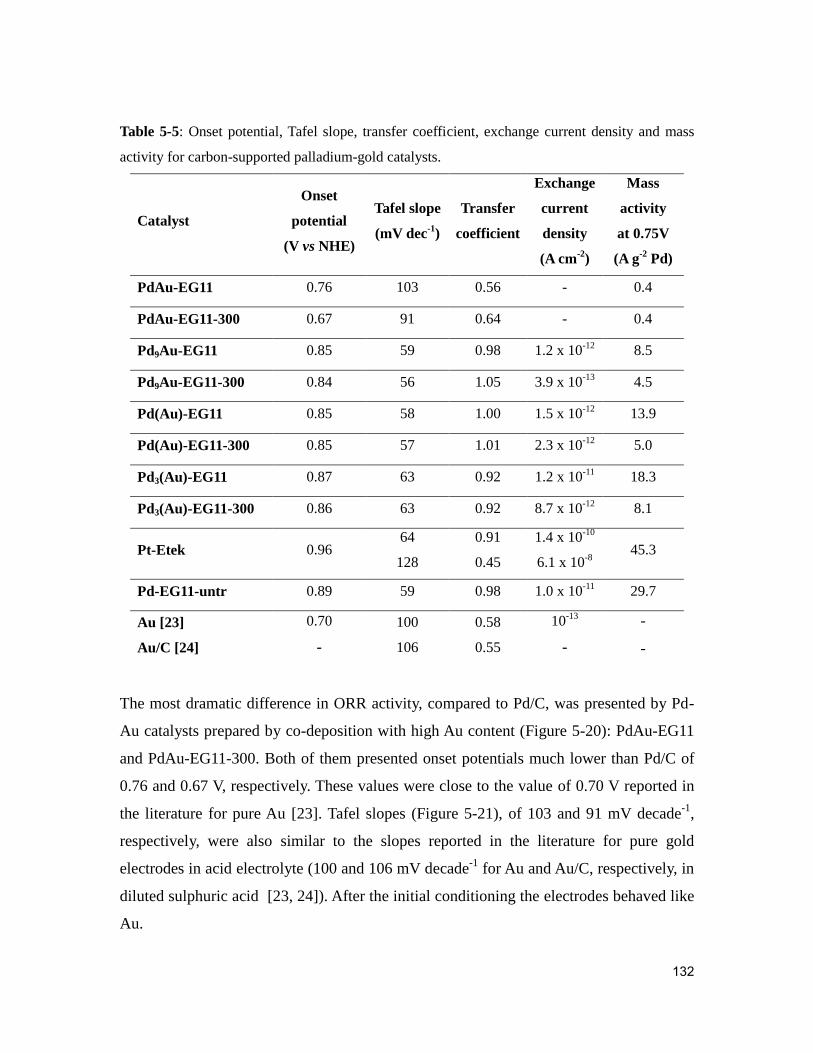
132
Table 5-5: Onset potential, Tafel slope, transfer coefficient, exchange current density and mass
activity for carbon-supported palladium-gold catalysts.
Catalyst
Onset
potential
(V vs NHE)
Tafel slope
(mV dec-1
)
Transfer
coefficient
Exchange
current
density
(A cm-2
)
Mass
activity
at 0.75V
(A g-2
Pd)
PdAu-EG11 0.76 103 0.56 - 0.4
PdAu-EG11-300 0.67 91 0.64 - 0.4
Pd9Au-EG11 0.85 59 0.98 1.2 x 10⁻¹² 8.5
Pd9Au-EG11-300 0.84 56 1.05 3.9 x 10⁻¹³ 4.5
Pd(Au)-EG11 0.85 58 1.00 1.5 x 10⁻¹² 13.9
Pd(Au)-EG11-300 0.85 57 1.01 2.3 x 10⁻¹² 5.0
Pd3(Au)-EG11 0.87 63 0.92 1.2 x 10⁻¹¹ 18.3
Pd3(Au)-EG11-300 0.86 63 0.92 8.7 x 10⁻¹² 8.1
Pt-Etek 0.96 64
128
0.91
0.45
1.4 x 10⁻¹⁰
6.1 x 10⁻⁸
45.3
Pd-EG11-untr 0.89 59 0.98 1.0 x 10⁻¹¹
29.7
Au [23]
Au/C [24]
0.70
-
100
106
0.58
0.55
10-13
-
-
-
The most dramatic difference in ORR activity, compared to Pd/C, was presented by Pd-
Au catalysts prepared by co-deposition with high Au content (Figure 5-20): PdAu-EG11
and PdAu-EG11-300. Both of them presented onset potentials much lower than Pd/C of
0.76 and 0.67 V, respectively. These values were close to the value of 0.70 V reported in
the literature for pure Au [23]. Tafel slopes (Figure 5-21), of 103 and 91 mV decade-1
,
respectively, were also similar to the slopes reported in the literature for pure gold
electrodes in acid electrolyte (100 and 106 mV decade-1
for Au and Au/C, respectively, in
diluted sulphuric acid [23, 24]). After the initial conditioning the electrodes behaved like
Au.
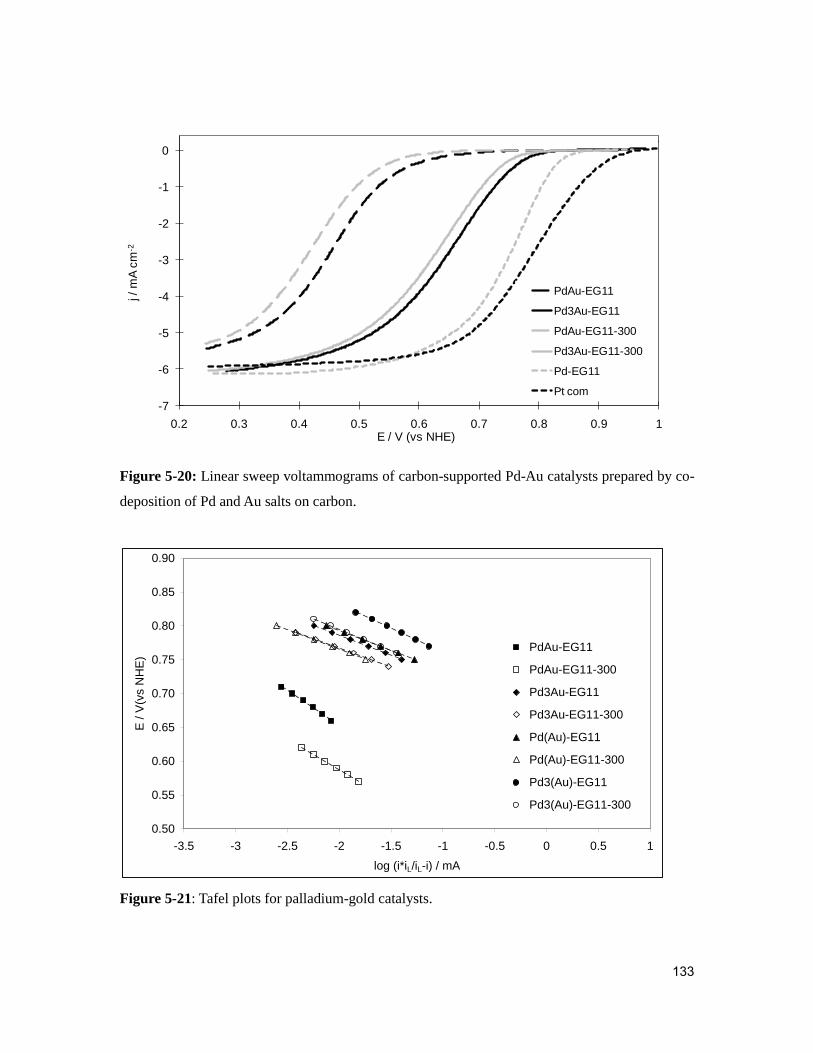
133
-7
-6
-5
-4
-3
-2
-1
0
0.2 0.3 0.4 0.5 0.6 0.7 0.8 0.9 1
j /
mA
cm
-2
E / V (vs NHE)
PdAu-EG11
Pd3Au-EG11
PdAu-EG11-300
Pd3Au-EG11-300
Pd-EG11
Pt com
Figure 5-20: Linear sweep voltammograms of carbon-supported Pd-Au catalysts prepared by co-
deposition of Pd and Au salts on carbon.
0.50
0.55
0.60
0.65
0.70
0.75
0.80
0.85
0.90
-3.5 -3 -2.5 -2 -1.5 -1 -0.5 0 0.5 1
log (i*iL/iL-i) / mA
E /
V(v
s N
HE
)
PdAu-EG11
PdAu-EG11-300
Pd3Au-EG11
Pd3Au-EG11-300
Pd(Au)-EG11
Pd(Au)-EG11-300
Pd3(Au)-EG11
Pd3(Au)-EG11-300
Linear (PdAu-EG11)
Linear (Pd3Au-EG11-300)Linear (PdAu-EG11-300)Linear (Pd3Au-EG11)
Linear (Pd3(Au)-EG11)Linear (Pd(Au)-EG11)
Linear (Pd(Au)-EG11-300)Linear (Pd3(Au)-EG11-300)
Figure 5-21: Tafel plots for palladium-gold catalysts.

134
The behavior of catalysts synthesized by co-deposition with more than 50% atomic Au
content agreed with data reported by Damjanovic et al [19], who observed a gold-like
behavior on Pd-Au alloy electrodes containing more that 50% atomic Au. Damjanovic et
al. [19] suggested that the change in Tafel slope from 60 to 100 mV decade-1
, in Pd-Au
alloys with more than 50% atomic Au, was due to a mechanism change caused by a
change in the electronic structure of the alloy. Exchange current densities were not
calculated for these two catalysts because data for their ECSAs could not be obtained
from the slow scan cyclic voltammograms, as discussed in the previous section.
Every other palladium-gold catalyst prepared, (Pd9Au-EG11, Pd9Au-EG11-300, Pd(Au)-
EG11, Pd3(Au)-EG11, Pd(Au)-EG11-300 and Pd3(Au)-EG11-300), gave onset potentials
and Tafel slopes closer to Pd/C-EG11, although the onset potential was lower in every
case. Onset potentials were 0.85, 0.84, 0.85, 0.87, 0.85 and 0.86 V vs NHE for Pd9Au-
EG11, Pd9Au-EG11-300, Pd(Au)-EG11, Pd3(Au)-EG11, Pd(Au)-EG11-300 and Pd3(Au)-
EG11-300. Their Tafel slopes values were all within the range 60 ± 4 mV decade-1
.
Pd9Au-EG11 and Pd9Au-EG11-300 (Figure 5-20) exhibited onset potentials of 0.85 and
0.84 V; 40 and 50 mV lower than Pd/C, respectively. Pd9Au-EG11 showed an i0 value
one order of magnitude lower than Pd/C (see Table 5-5). XRD patterns for this catalyst
indicated the presence of several metal phases; Pd, Au and a solid solution of both with a
concentration gradient. The partial solution of Au in the Pd lattice could be held
responsible for the decrease in the i0 in Pd9Au-EG11. The alloy formation could cause the
electrochemical characteristics of the electrode to shift towards gold-like behavior [19],
as previously discussed for PdAu-EG11 and PdAu-EG11-300. This would be supported
by the one order of magnitude decrease in the exchange current density, when the catalyst
was treated in H2 at 300 ºC. As discussed in the physicochemical characterization, heat
treatment caused an increase in the extent of the alloy and no pure Pd phase was longer
present. Therefore, the exchange current density would differ even more than that for
Pd/C.

135
Pd(Au)-EG11 and Pd3(Au)-EG11 (Figure 5-22) showed onset potentials of 0.85 and 0.87
V, 40 and 20 mV lower than Pd/C, respectively. The i0 for catalysts at atomic ratio Pd:Au
1:0.4 was 1.2 x 10⁻¹¹
A cm-2
, very similar to Pd/C, whilst the exchange current density for
catalysts at atomic ratio Pd:Au 1:1.4 was one order of magnitude lower, 1.5 x 10⁻¹²
A cm-2
. The decrease in the ORR activity, specially noticed in the catalysts at atomic ratio
Pd:Au 1:1.4, was believed to be due to the influence of the gold particles deposited on
Pd/C, since not Pd-Au alloy was formed according to the XRD patterns. The larger the
amount of Au nanoparticles introduced in the catalysts the closer the ORR activity to a
gold electrode.
-7
-6
-5
-4
-3
-2
-1
0
0.2 0.3 0.4 0.5 0.6 0.7 0.8 0.9 1
j /
mA
cm
-2
E / V (vs NHE)
Pd(Au)-EG11
Pd3(Au)-EG11
Pd(Au)-EG11-300
Pd3(Au)-EG11-300
Pd-EG11
Pt com
Figure 5-22: Linear sweep voltammograms of carbon-supported Pd-Au catalysts prepared on
Pd/C.
When Pd(Au)-EG11 and Pd3(Au)-EG11 were treated in H2 at 300 ºC, neither the
exchange current density nor the onset potential changed significantly (Table 5-5). Onset
values for treated catalysts, Pd(Au)-EG11-300 and Pd3(Au)-EG11-300 (Figure 5-22),
were 0.85 and 0.86 V and i0 was 2.3 x 10⁻¹²
and 8.7 x 10
-12 A cm
-2, respectively. This
confirmed the information obtained from X-ray diffraction analyses, which showed that
no Pd-Au alloy was formed. However, a small extension of alloy was believed to have

136
occurred, based on both the extreme decrease of the ECSA compared to the particle size
increase and the shift in the palladium oxide reduction peak, as previously discussed.
After heat treatment a decrease in the mass activity was observed in every case. Mass
activities decreased from 9 to 5, 14 to 5 and 18 to 8 A g-2
Pd for Pd9Au-EG11, Pd(Au)-
EG11 and Pd3(Au)-EG11 after heat treatment, respectively. This behavior was expected
since heat treatment caused particle growth and that would lead to smaller surface area.
Onset potentials and i0 values for Pd(Au)-EG11 and Pd3(Au)-EG11 did not show
significant changes.
As discussed in the previous paragraph, the more Au introduced in the Pd lattice the
lower the oxygen adsorption on its surface and therefore the smaller the area under the
oxide reduction peak. However this was found to be contradictory with the invariability
of the onset and i0 before and after treatment, as the adsorption of oxygen is believed to
strongly affect the kinetics of the ORR, as discussed in Chapter 4.
5.4.2. Evaluation of palladium-cobalt catalysts
Table 5-6 compares onset potential, exchange current density and Tafel slopes for
palladium-cobalt catalysts with the same parameters for Pd/C-EG11 prepared catalyst and
Pt/C from E-Tek. Every palladium-cobalt catalysts presented onset potentials and Tafel
slopes close to Pd/C-EG11, onset potentials were equal or lower in every case. Tafel
slopes values were all within the range of 60 ± 4 mV decade-1
.

137
Table 5-6: Onset potential, Tafel slope, transfer coefficient, exchange current density and mass
activity for carbon-supported palladium-cobalt catalysts.
Catalyst
Onset
potential
(V vs NHE)
Tafel slope
(mV dec-1
)
Transfer
coefficient
Exchange
current
density
(A cm-2
)
Mass
activity
at 0.75V
(A g-2
Pd)
PdCo-EG11 0.89 58 0.99 9.7 x 10⁻¹² 44.8
PdCo-EG11-300 0.84 57 1.03 2.8 x 10⁻¹³ 8.2
Pd4Co-EG11 0.88 62 0.93 8.5 x 10⁻¹² 19.2
Pd4Co-EG11-300 0.88 63 0.90 1.4 x 10⁻¹¹ 23.1
Pd(Co)-EG11 0.87 61 0.95 4.3 x 10⁻¹² 10.4
Pd(Co)-EG11-300 0.86 61 0.96 2.7 x 10⁻¹² 9.5
Pd4(Co)-EG11 0.88 58 1.00 9.1 x 10⁻¹² 26.2
Pd4(Co)-EG11-
300 0.88 63 0.92 7.5 x 10
-12 12.2
Pt 0.96 64
128
0.91
0.45
1.4 x 10⁻¹⁰
6.1 x 10⁻⁸
45.3
Pd 0.89 59 0.98 1.0 x 10⁻¹¹
29.7
From the XRD analyses we concluded that Pd-Co alloys were not formed without heat
treatment in any case. Therefore this section will discuss differences in the activity ORR
after treatment in H2 at 300 ºC.
Catalysts with a Co content of ca. Pd:Co 1:0.6 or higher, PdCo-EG11 and Pd(Co)-EG11,
exhibited a decrease in the exchange current density after H2 treatment (Table 5-6).
Untreated PdCo-EG11 and Pd(Co)-EG11 had i0 values of 9.7 x 10⁻¹²
A cm-2
and 4.3 x 10-
12 A cm
-2, respectively. These values fell after heat treatment by nearly two orders of
magnitude for the co-deposited catalyst and approximately half when prepared on Pd/C,
to 2.8 x 10⁻¹³
A cm-2
and 2.7 x 10⁻¹²
A cm-2
for PdCo-EG11-300 and Pd(Co)-EG11-300,
respectively. All exchange current densities of Pd-Co catalysts were at least two orders of

138
magnitude lower than the value reported by Savadogo et al. for palladium-cobalt 28%
atomic cobalt, 5.1 x 10⁻⁹
A cm-2
[4].
Onset potentials of untreated high cobalt content catalysts, PdCo-EG11 and Pd(Co)-EG11
(Figure 5-23), were close to the onset value of Pd/C, 0.89 and 0.87 V, respectively. Both
onset potentials decreased after heat treatment, to 0.84 and 0.86 V for PdCo-EG11-300
and Pd(Co)-EG11-300, respectively. The catalyst prepared by simultaneous co-deposition
of palladium and cobalt at atomic ratio Pd:Co 1:0.9, PdCo-EG11, exhibited a decrease
mass activity at 0.75 V vs NHE, in agreement with the decrease in onset potential and i0,
when heat treated. PdCo-EG11-300 mass activity decreased by more than 75%, from 244
to 61 A g Pd-1
, respectively. Unlike the small decrease recorded in their exchange current
densities, catalysts synthesized by depositing Co on Pd/C at atomic ratio 1:0.6 Pd:Co,
Pd(Co)-EG11 and Pd(Co)-EG11-300, did not show significant differences in mass
activity before and after H2 treatment. Mass activity remained ca. 10 A g Pd-1
.

139
-7
-6
-5
-4
-3
-2
-1
0
0.2 0.3 0.4 0.5 0.6 0.7 0.8 0.9 1E / V (vs NHE)
j / m
A c
m-2
PdCo-EG11
PdCo-EG11-300
Pd4Co-EG11
Pd4Co-EG11-300
Pt com
Pd-EG11
A
-7
-6
-5
-4
-3
-2
-1
0
0.2 0.3 0.4 0.5 0.6 0.7 0.8 0.9 1E / V (vs NHE)
j / m
A c
m-2
Pd(Co)-EG11
Pd(Co)-EG11-300
Pd4(Co)-EG11
Pd4(Co)-EG11-300
Pt com
Pd-EG11
B
Figure 5-23: Linear sweep voltammograms of carbon-supported Pd-Co catalysts prepared by A)
co-deposition of Pd and Co salts on carbon and B) on Pd/C.
For lower Co content, ca. Pd:Co 1:0.2, Pd4Co-EG11 and Pd4(Co)-EG11, exchange
current densities were also close to those of Pd/C-EG11. After H2 treatment i0 increased
for the co-deposited catalyst, from 8.5 x 10⁻¹²
to 1.4 x 10⁻¹¹
A cm-2
, and hardly changed

140
for the catalyst prepared on Pd/C, from 9.1 x 10⁻¹²
to 7.5 x 10⁻¹²
A cm-2
. Onset potentials
were constant at 0.88 V, 10 mV lower than Pd/C, for both catalysts before and after heat
treatment. In agreement with the improvement of the exchange current density after heat
treating Pd4Co-EG11, a rise from 19 to 23 A g-1
in the MA at 0.75 V was observed. When
the catalyst with low Co content was prepared on Pd/C, the small i0 decrease observed in
Pd4(Co)-EG11-300 with respect to Pd4(Co)-EG11 was accompanied by a sharp decrease
from 26 to 12 A g-1
in the MA at 0.75 V. Specific activity (current density per
electrochemical surface area) reported by Savadogo et al. for palladium-cobalt 28%
atomic cobalt, was considerably higher compared to the observed specific activity for
Pd4(Co)-EG11, 580 μA cm
-2 at 0.80 V compared to 203
μA cm
-2 at 0.75 V [4].
When cobalt was co-deposited with palladium and the catalysts were untreated, Co was
present in an un-alloyed form according to the XRD analyses; its influence in the ORR
activity of the Pd nanoparticles could not be determined. Onset potential, exchange
current density and mass activity were close to Pd/C-EG11 (Table 5-6). This behavior
was common to both untreated co-deposited catalysts with metal ratios Pd:Co 1:0.9 and
1:0.2, PdCo-EG11 and Pd4Co-EG11, respectively. However, un-alloyed Co deposited on
Pd/C seemed to have a detrimental effect on the catalyst ORR activity when the Co
content was high, Pd:Co 1:0.6. The onset potential decreased by 20 mV and i0 and MA at
0.75 V vs NHE were approximately half of the same parameters for Pd/C-EG11. For un-
alloyed Co deposited on Pd/C present in a smaller amount, Pd:Co 1:0.2, the Co influence
could again not be determined and all parameters were very close to those of Pd/C-EG11.
The reason for this behavior remains unknown; it could be due to some amorphous cobalt
phase blocking the Pd sites when deposited on Pd/C, and further studies would be
necessary.
After treatment in H2 at 300 ºC, co-deposited catalyst showed different effects depending
on the Co content as mentioned above. The decrease in the ORR parameters presented by
PdCo-EG11-300 was attributed to the introduction of a relatively large amount of Co
atoms in the Pd lattice. As discussed in the physicochemical characterization section, the
PdCo-EG11-300 Pd-Pd bond distance had the largest decrease compared to Pd/C, 0.2739
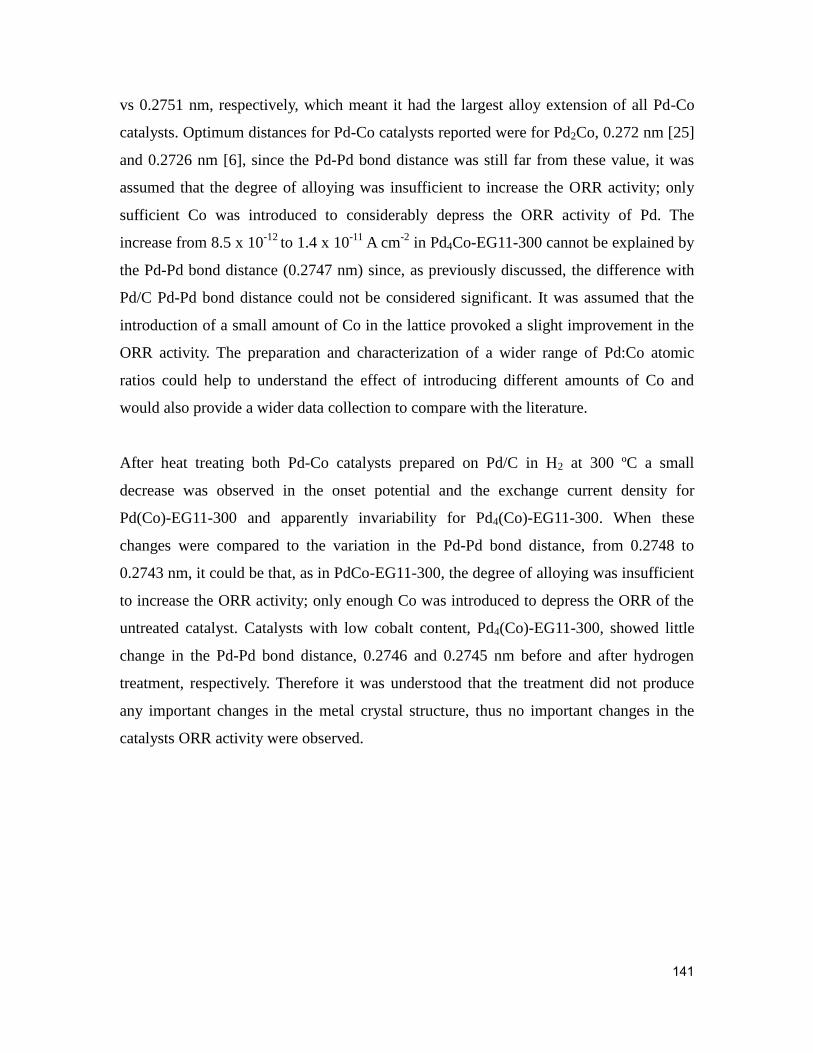
141
vs 0.2751 nm, respectively, which meant it had the largest alloy extension of all Pd-Co
catalysts. Optimum distances for Pd-Co catalysts reported were for Pd2Co, 0.272 nm [25]
and 0.2726 nm [6], since the Pd-Pd bond distance was still far from these value, it was
assumed that the degree of alloying was insufficient to increase the ORR activity; only
sufficient Co was introduced to considerably depress the ORR activity of Pd. The
increase from 8.5 x 10⁻¹²
to 1.4 x 10⁻¹¹
A cm-2
in Pd4Co-EG11-300 cannot be explained by
the Pd-Pd bond distance (0.2747 nm) since, as previously discussed, the difference with
Pd/C Pd-Pd bond distance could not be considered significant. It was assumed that the
introduction of a small amount of Co in the lattice provoked a slight improvement in the
ORR activity. The preparation and characterization of a wider range of Pd:Co atomic
ratios could help to understand the effect of introducing different amounts of Co and
would also provide a wider data collection to compare with the literature.
After heat treating both Pd-Co catalysts prepared on Pd/C in H2 at 300 ºC a small
decrease was observed in the onset potential and the exchange current density for
Pd(Co)-EG11-300 and apparently invariability for Pd4(Co)-EG11-300. When these
changes were compared to the variation in the Pd-Pd bond distance, from 0.2748 to
0.2743 nm, it could be that, as in PdCo-EG11-300, the degree of alloying was insufficient
to increase the ORR activity; only enough Co was introduced to depress the ORR of the
untreated catalyst. Catalysts with low cobalt content, Pd4(Co)-EG11-300, showed little
change in the Pd-Pd bond distance, 0.2746 and 0.2745 nm before and after hydrogen
treatment, respectively. Therefore it was understood that the treatment did not produce
any important changes in the metal crystal structure, thus no important changes in the
catalysts ORR activity were observed.

142
0.50
0.55
0.60
0.65
0.70
0.75
0.80
0.85
0.90
-3.5 -3 -2.5 -2 -1.5 -1 -0.5 0 0.5 1
log (i*iL/iL-i) / mA
E / V
(vs N
HE
)
PdCo-EG11
PdCo-EG11-300
Pd4Co-EG11
Pd4Co-EG11-300
Pd(Co)-EG11
Pd(Co)-EG11-300
Pd4(Co)-EG11
Pd4(Co)-EG11-300
Linear (PdCo-EG11)
Linear (Pd4Co-EG11-300)Linear (PdCo-EG11-300)Linear (Pd4Co-EG11)
Linear (Pd4(Co)-EG11)Linear (Pd(Co)-EG11)
Linear (Pd(Co)-EG11-300)Linear (Pd4(Co)-EG11-300)
Figure 5-24: Tafel plots for palladium-cobalt catalysts.
5.4.3. Evaluation of palladium-iron catalysts
Table 5-7 compares onset potential, Tafel slopes and exchange current density values for
palladium-iron catalysts with the same parameters for the prepared Pd/C-EG11 and Pt/C
from E-Tek.

143
Table 5-7: Onset potential, Tafel slope, transfer coefficient, exchange current density and mass
activity for several carbon-supported palladium-iron catalysts.
Catalyst
Onset
potential
(V vs NHE)
Tafel slope
(mV dec-1
)
Transfer
coefficient
Exchange
current
density
(A cm-2
)
Mass
activity
at 0.75V
(A g-2
Pd)
PdFe-EG11 0.86 65 0.89 1.3 x 10⁻¹¹ 12.7
PdFe-EG11-300 0.81 60 0.97 4.7 x 10⁻¹³ 1.5
Pd3Fe-EG11 0.88 61 0.95 1.7 x 10⁻¹¹ 31.1
Pd3Fe -EG11-300 0.87 62 0.92 1.3 x 10⁻¹¹ 14.6
PdFe-H2-500 0.78 63 0.92 2.5 x 10⁻¹³ 2.1
Pd(Fe)-H2-500 0.86 62 0.94 4.3 x 10⁻¹² 6.8
Pd3Fe-H2-500 0.84 57 1.02 3.1 x 10⁻¹³ 4.3
Pd3(Fe)-H2-500 0.87 60 0.97 4.2 x 10
-
12 12.8
Pt 0.96 64
128
0.91
0.45
1.4 x 10⁻¹⁰
6.1 x 10⁻⁸
45.3
Pd 0.89 59 0.98 1.0 x 10⁻¹¹
29.7
PtFe 3:1[26] 0.94 45 1.29
Onset potentials recorded for PdFe-EG11 and Pd3Fe-EG11 (Figure 5-25) were 0.86 and
0.88 V, which were 30 and 10 mV lower than values for Pd/C, respectively. Because the
decrease in the onset potential was higher for larger Fe content, this decrease was
believed to be caused by the presence of iron, either by introduction of small amounts in
the Pd lattice, unconfirmed by XRD, or by the presence of Fe2+
in the electrolyte or by
the presence of Fe2O3 in the catalyst next to the Pd nanoparticles.
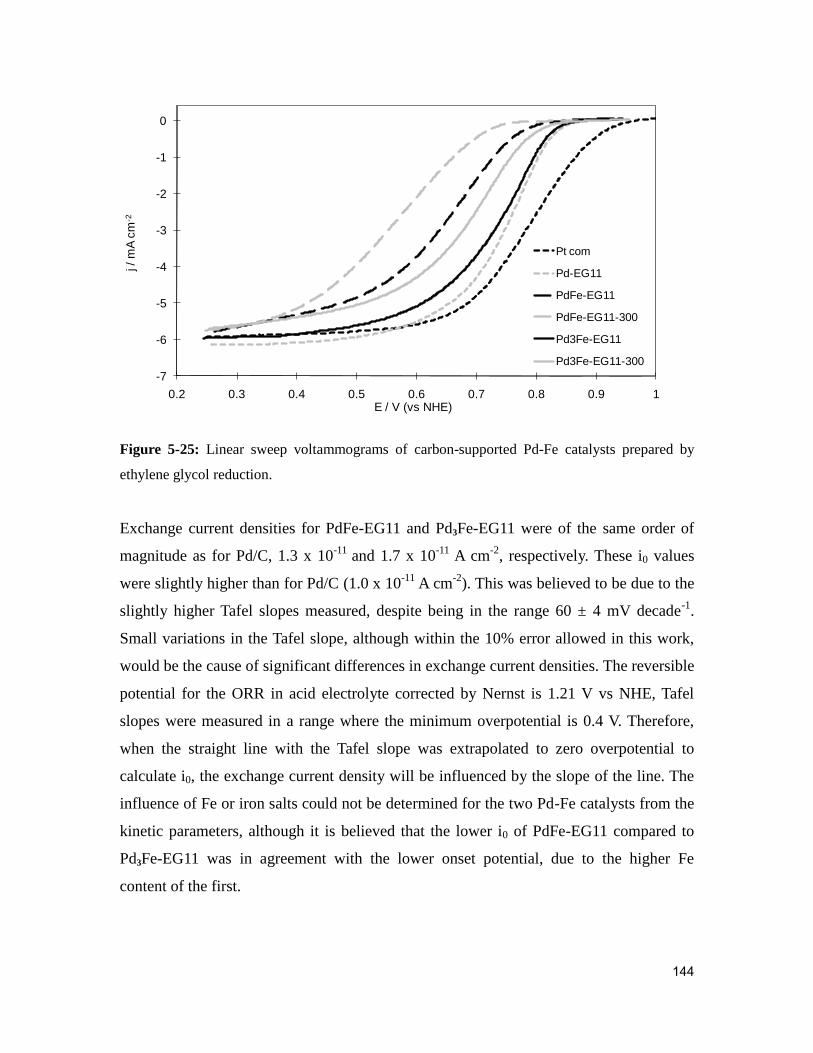
144
-7
-6
-5
-4
-3
-2
-1
0
0.2 0.3 0.4 0.5 0.6 0.7 0.8 0.9 1
j /
mA
cm
-2
E / V (vs NHE)
Pt com
Pd-EG11
PdFe-EG11
PdFe-EG11-300
Pd3Fe-EG11
Pd3Fe-EG11-300
Figure 5-25: Linear sweep voltammograms of carbon-supported Pd-Fe catalysts prepared by
ethylene glycol reduction.
Exchange current densities for PdFe-EG11 and Pd3Fe-EG11 were of the same order of
magnitude as for Pd/C, 1.3 x 10⁻¹¹
and 1.7 x 10⁻¹¹
A cm-2
, respectively. These i0 values
were slightly higher than for Pd/C (1.0 x 10⁻¹¹
A cm-2
). This was believed to be due to the
slightly higher Tafel slopes measured, despite being in the range 60 ± 4 mV decade-1
.
Small variations in the Tafel slope, although within the 10% error allowed in this work,
would be the cause of significant differences in exchange current densities. The reversible
potential for the ORR in acid electrolyte corrected by Nernst is 1.21 V vs NHE, Tafel
slopes were measured in a range where the minimum overpotential is 0.4 V. Therefore,
when the straight line with the Tafel slope was extrapolated to zero overpotential to
calculate i0, the exchange current density will be influenced by the slope of the line. The
influence of Fe or iron salts could not be determined for the two Pd-Fe catalysts from the
kinetic parameters, although it is believed that the lower i0 of PdFe-EG11 compared to
Pd3Fe-EG11 was in agreement with the lower onset potential, due to the higher Fe
content of the first.
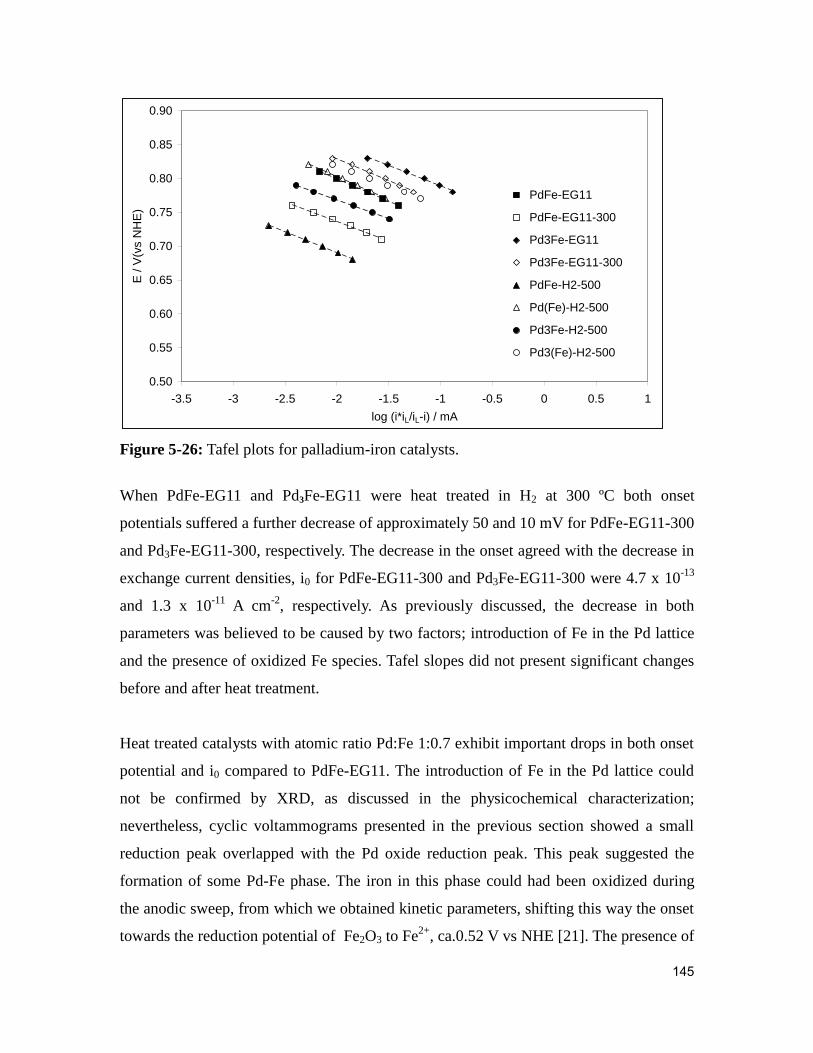
145
0.50
0.55
0.60
0.65
0.70
0.75
0.80
0.85
0.90
-3.5 -3 -2.5 -2 -1.5 -1 -0.5 0 0.5 1
log (i*iL/iL-i) / mA
E / V
(vs N
HE
)
PdFe-EG11
PdFe-EG11-300
Pd3Fe-EG11
Pd3Fe-EG11-300
PdFe-H2-500
Pd(Fe)-H2-500
Pd3Fe-H2-500
Pd3(Fe)-H2-500
Linear (Pd3Fe-EG11-300)Linear (PdFe-EG11-300)Linear (PdFe-EG11)
Linear (Pd3Fe-EG11)
Linear (Pd3Fe-H2-500)Linear (PdFe-H2-500)
Linear (Pd(Fe)-H2-500)
Figure 5-26: Tafel plots for palladium-iron catalysts.
When PdFe-EG11 and Pd3Fe-EG11 were heat treated in H2 at 300 ºC both onset
potentials suffered a further decrease of approximately 50 and 10 mV for PdFe-EG11-300
and Pd3Fe-EG11-300, respectively. The decrease in the onset agreed with the decrease in
exchange current densities, i0 for PdFe-EG11-300 and Pd3Fe-EG11-300 were 4.7 x 10⁻¹³
and 1.3 x 10⁻¹¹
A cm-2
, respectively. As previously discussed, the decrease in both
parameters was believed to be caused by two factors; introduction of Fe in the Pd lattice
and the presence of oxidized Fe species. Tafel slopes did not present significant changes
before and after heat treatment.
Heat treated catalysts with atomic ratio Pd:Fe 1:0.7 exhibit important drops in both onset
potential and i0 compared to PdFe-EG11. The introduction of Fe in the Pd lattice could
not be confirmed by XRD, as discussed in the physicochemical characterization;
nevertheless, cyclic voltammograms presented in the previous section showed a small
reduction peak overlapped with the Pd oxide reduction peak. This peak suggested the
formation of some Pd-Fe phase. The iron in this phase could had been oxidized during
the anodic sweep, from which we obtained kinetic parameters, shifting this way the onset
towards the reduction potential of Fe2O3 to Fe2+
, ca.0.52 V vs NHE [21]. The presence of

146
this un-characterised phase together with the presence of the Fe2+
in the electrolyte, Fe2+
that would have passed to the solution during the electrode conditioning, are believed to
be the causes of the decrease, by over an order of magnitude of i0.
Heat treated catalyst prepared by EG reduction with atomic ratio Pd:Fe 1:0.3 exhibited
milder reductions in both onset potential and i0 compared to PdFe-EG11-300. As
discussed in the physicochemical characterization, the change in the Pd-Pd bond distance
in Pd3Fe-EG11-300 compared to Pd/C could be considered as proof of the introduction of
Fe in the Pd lattice. Two carbon supported metal phases, Pd2Fe/C and PdFe/C, were
reported to have similar Pd-Pd bond distances [14] of ca. 0.2742 nm (Table 5-3). Cyclic
voltammetries for Pd3Fe-EG11-300 showed in the previous section presented a shift in
the palladium oxide reduction peak of ca. 15 mV towards lower potentials. This shift was
considered as a confirmation that changes observed in the XRD and the difference in the
kinetic parameters were due to the introduction, in some extension, of Fe into the Pd
lattice. The ORR activity of the phase or phases combination, Pd-Fe and Pd, in Pd3Fe-
EG11-300 was slightly lower than Pd/C.
Catalysts synthesized by reduction in H2 at 500 ºC and co-deposition of both metals
simultaneously, PdFe-H2-500 and Pd3Fe-H2-500, exhibit onset potentials of 0.78 and 0.84
V, ca. 110 and 50 mV lower than Pd/C, respectively. From XRD analysis and
voltammograms in N2 saturated solution it was concluded that a Pd-Fe alloy was
obtained, in some extension. Onset potentials suggested that the increase in the Fe
content from 1:0.3 to ca. 1:1 Pd:Fe atomic ratio (Table 5-3) resulted in a poorer ORR
activity. Tafel slopes were similar to Pd/C for both PdFe-H2-500 and Pd3Fe-H2-500,
within the 10% error allowed, 63 and 57 mV decade-1
, and exchange current densities
were nearly two orders of magnitude lower than for Pd/C, 2.5 x 10⁻¹³
and 3.1 x 10⁻¹³
A
cm-2
, respectively.

147
-7
-6
-5
-4
-3
-2
-1
0
0.2 0.3 0.4 0.5 0.6 0.7 0.8 0.9 1
j /
mA
cm
-2
E / V (vs NHE)
Pt com
Pd-EG11
PdFe-H2-500
Pd3Fe-H2-500
Pd(Fe)-H2-500
Pd3(Fe)-H2-500
Figure 5-27: Linear sweep voltammograms of carbon-supported Pd-Fe catalysts prepared by
reduction in H2 at 500 ºC.
When Fe was reduced on Pd/C by reduction in H2 at 500 ºC (Pd(Fe)-H2-500 and Pd3 (Fe)-
H2-500) both onset potentials and exchange current densities were higher than when Pd
and Fe were co-deposited. Onset potentials recorded were 0.86 and 0.87 V, ca. 30 and 20
mV lower than Pd/C, respectively; again the larger decrease compared to Pd/C was for
the higher Fe content, 1:0.9 vs 1:0.3 Pd:Fe atomic ratio. Tafel slopes were similar to Pd/C
for both catalysts, 62 and 60 mV decade-1
, and exchange current densities were lower
than i0 for Pd/C, 4.3 x 10⁻¹²
and 4.2 x 10⁻¹²
A cm-2
, respectively. Thus it was concluded
that for catalysts prepared on Pd/C, as for catalysts synthesized by co-deposition, in H2 at
500 ºC, an increase in the Fe content was detrimental for the ORR activity. It was also
concluded that co-deposited metals produced catalysts with lower ORR activities than
catalysts prepared on Pd/C, as previously observed by Shao et al. [14]
Mass activity agreed with the onset potential (Table 5-7), and was higher for catalysts
with lower Fe content and for catalysts prepared on Pd/C. Mass activities for PdFe-H2-
500 and Pd(Fe)-H2-500, 2 and 7 A g-2
Pd, were lower than these of Pd3Fe-H2-500 and
Pd3(Fe)-H2-500, 4 and 13 A g-2
Pd, respectively. Mass activity reported by Shao et al. [14]

148
for carbon-supported Pd3Fe, was ca. 500 A g-2
at 0.8 V, over an order of magnitude higher
than for the synthesized Pd3(Fe)-H2-500.
From the comparison of mass activity it was concluded that co-deposition of Pd and Fe is
detrimental for the ORR compared to the Fe deposition on Pd/C. This agreed with what
was reported by Shao et al. [14]. However, no Pd-Fe catalysts showed an improvement in
the ORR activity compared to Pd/C as was claimed by this group.
5.4.4. Evaluation of palladium- titanium catalysts
Table 5-8 compares onset potential, exchange current density and Tafel slope values for
palladium-titanium catalysts with the same parameters for Pd/C-EG11 prepared catalysts
and Pt/C from E-Tek. Every palladium-titanium catalyst presented Tafel slopes close to
Pd/C-EG11, and all were within the range 60 ± 5 mV decade-1
.

149
Table 5-8: Onset potential, Tafel slope, transfer coefficient, exchange current density and mass
activity for several carbon-supported palladium-titanium catalysts.
Catalyst
Onset
potential
(V vs NHE)
Tafel slope
(mVdec-1
)
Transfer
coefficient
Exchange
current
density
(A cm-2
)
Mass
activity
at 0.75V
(A g-2
Pd)
PdTi-EG11 0.88 60 0.96 6.9 x 10⁻¹² 19.3
PdTi-EG11-300 0.87 62 0.94 8.2 x 10⁻¹² 14.2
Pd9Ti-EG11 0.88 59 0.98 6.5 x 10⁻¹² 27.0
Pd9Ti -EG11-300 0.86 62 0.93 4.5 x 10⁻¹² 5.9
PdTi-H2-900 0.74 65 0.88 3.8 x 10⁻¹³ 0.0
Pd(Ti)-H2-900 0.78 63 0.92 1.1 x 10⁻¹² 0.3
Pd9Ti-H2-900 0.84 58 1.01 1.8 x 10⁻¹² 3.1
Pd9(Ti)-H2-900 0.89 62 0.98 2.8 x 10⁻¹¹ 11.2
Pt 0.96 64
128
0.91
0.45
1.4 x 10⁻¹⁰
6.1 x 10⁻⁸
45.3
Pd 0.89 59 0.98 1.0 x 10⁻¹¹
29.7
Voltammograms of catalysts prepared using ethylene glycol as the reducing agent are
given in Table 5-8. Before heat treatment in H2 at 300 ºC, both PdTi-EG11 and Pd9Ti-
EG11 showed onset potentials and exchange current densities slightly lower than Pd/C,
0.88 V and ca. 7.0 x 10⁻¹²
A cm-2
, respectively. Mass activity was also slightly lower
compared to Pd/C, the values for PdTi-EG11 and Pd9Ti-EG11 were 20 and 27 A g-2
,
respectively, compared to 30 A g-2
(Table 5-8). The closest behavior to Pd/C was
presented by the catalysts with atomic ratio Pd:Ti 1:0.14 before heat treatment. Lower
mass activity for PdTi-EG11, Pd:Ti 1:0.7, was believed to be simply caused by the lower
Pd content of the catalyst, 14% weight compared to 20% weight for PdTi-EG11 and
Pd9Ti-EG11, respectively; since no palladium-titanium catalyst prepared by ethylene
glycol reduction showed any significant shift in the peak positions of XRD diffractions
patterns (Section 5.2.4).

150
-7
-6
-5
-4
-3
-2
-1
0
0.2 0.3 0.4 0.5 0.6 0.7 0.8 0.9 1
j / m
A c
m-2
E / V (vs NHE)
Pt com
Pd-EG11
Pd9Ti-EG11
PdTi-EG11
PdTi-EG11-300
Pd9Ti-EG11-300
Figure 5-28: Linear sweep voltammograms of carbon-supported Pd-Ti catalysts prepared by
ethylene glycol reduction.
After heat treatment in H2 at 300 ºC, small reductions in onset potentials were observed
of 10 and 20 mV in PdTi-EG11-300 and Pd9Ti-EG11-300, respectively. This decrease in
onset potentials was accompanied by a decrease in both mass activities, from 19 and 27 A
g-2
to 14 and 6 A g-2
, respectively. Changes in mass activities were believed to be mainly
a consequence of the increase in the particle size, which induced a significant reduction
in the ECSA. Exchange current density did not exhibit significant changes for PdTi-
EG11-300, 8.2 x 10⁻¹²
A cm-2
, and showed a small decrease in Pd9Ti-EG11-300,
4.5 x 10⁻¹²
A cm-2
. The exchange current density did not show important changes before
and after heat treatment for PdTi-EG11. By contrary, after treating Pd9Ti-EG11 the
exchange current density decreased, this was believed to be due to the introduction of
small amounts of Ti in the Pd lattice. However no references supporting this hypothesis
were found in the literature.
Voltammograms of catalysts prepared by reduction at 900 ºC in hydrogen are shown in
Figure 5-29. These catalysts exhibit onset potentials and exchange current densities lower

151
than Pd/C in every case but one (Table 5-8). Onset potentials and exchange current
densities for PdTi-H2-900, Pd(Ti)-H2-900, Pd9Ti-H2-900 and Pd9(Ti)-H2-900 were 0.74,
0,78, 0.84 and 0.89 V, 3.8 x 10⁻¹³
A cm-2
, 1.1 x 10⁻¹²
A cm-2
, 1.8 x 10⁻¹²
A cm-2
and 2.8 x
10-11
A cm-2
, respectively.
-7
-6
-5
-4
-3
-2
-1
0
0.2 0.3 0.4 0.5 0.6 0.7 0.8 0.9 1
j /
mA
cm
-2
E / V (vs NHE)
Pt com
Pd-EG11
PdTi-H2-900
Pd(Ti)-H2-900
Pd9Ti-H2-900
Pd9(Ti)-H2-900
Figure 5-29: Linear sweep voltammograms of carbon-supported Pd-Ti catalysts prepared by
reduction in H2 at 900 ºC.
A negative effect of large amounts of TiO2 when the catalyst is treated at high
temperatures was seen in both PdTi-H2-900 and Pd(Ti)-H2-900. The higher the titanium
content, Pd:Ti 1:1.9 for PdTi-H2-900 and 1:1.3 Pd(Ti)-H2-900, the lower were the onset
potential and i0. Mass and activity was also extremely low for these catalysts with high
titanium content. MA was reported as zero for both catalysts.
Results were surprising in catalysts prepared by reduction at 900 ºC in hydrogen with low
Ti content. Pd9Ti-H2-900, prepared by co-deposition, exhibits a 50 mV decrease in onset
potential and i0 was one order of magnitude lower compared to the corresponding
parameters for Pd/C. This behavior was somehow expected after studying Pd9Ti-EG11-
300, with similar Ti content, which also presented a depression in the ORR activity after

152
heat treatment. The increase in heat treatment temperature seemed to stress the negative
effect of heat treatment in H2 when TiO2 is present in an atomic percentage just above
10%. By contrary, when the catalyst was prepared on Pd/C at atomic ratio 1:0.13, it was
observed that high temperatures induced a positive effect on the ORR activity. This
catalyst, Pd9(Ti)-H2-900, presented the same onset potential as Pd/C and the exchange
current density was more than the double the value calculated for the latter.
Reports of the influence of titanium oxide in the catalytic activity of Pd and other group
VIII metals were found in the literature [22, 27]. For instance, Diebold reviewed the
structure and properties of titanium oxide and stated that small additions of titania can
modify metal-based catalysts in a profound way [27] due to the so-called Strong Metal-
Support Interaction (SMSI). Traditional criterion for SMSI was a rapid reduction of H2 or
CO adsorption capacity, and this has been proved to occur in anatase supported Pd
catalysts [28]. The effect of different amounts of anatase in the prepared catalysts was not
studied in this piece of work.
0.50
0.55
0.60
0.65
0.70
0.75
0.80
0.85
0.90
-3.5 -3 -2.5 -2 -1.5 -1 -0.5 0 0.5 1
log (i*iL/iL-i) / mA
E /
V(v
s N
HE
)
PdTi-EG11
PdTi-EG11-300
Pd9Ti-EG11
Pd9Ti-EG11-300
PdTi-H2-900
Pd(Ti)-H2-900
Pd9Ti-H2-900
Pd9(Ti)-H2-900
Linear (PdTi-EG11-
300)Linear (Pd9Ti-EG11-
300)Linear (Pd9Ti-EG11)
Linear (PdTi-EG11)
Linear (Pd9Ti-H2-
900)Linear (PdTi-H2-900)
Linear (Pd(Ti)-H2-
900)Linear (Pd9(Ti)-H2-
900)
Figure 5-30: Tafel plots for palladium-titanium catalysts.

153
5.5. Conclusions
Pd-Pd bond distances were estimated from XRD patterns (Scherrer equation) and its
values used to determine whether palladium-metal alloy had been formed. Introduction of
any other metal atoms in the Pd lattice would cause distortion of the crystal structure
since different atoms have different sizes. Pd-Pd bond length for pure carbon-supported
Pd was estimated from a large number of samples and found to have an average value of
0.2751 nm, with an associated error of 0.0003 nm. A bond distance value outside the
interval 0.2751 ± 0.0006 nm (200% of error) was the criterion used to consider weather
palladium-metal alloy had been formed.
Palladium-gold alloys were formed when both metals were co-deposited and reduced in
ethylene glycol at 110 ºC. Subsequent heat treatment 300 ºC under H2 flow increased the
extent of the alloy (more uniform composition). On the other hand, no alloy was obtained
in any of the palladium-gold electrocatalysts prepared by depositing gold on Pd/C, before
or after treating the catalysts at 300 ºC under H2. The only observed difference in XRD
patterns before and after heat treatment was a growth in the Pd particles size. The extent
of the sintering of palladium particles undergoing heat treatment was lower compared to
pure palladium, this was attributed to the presence of gold.
After electrochemical conditioning in acid electrolyte, gold-rich Pd-Au alloy electrodes
present the electrochemical characteristic of a gold electrode. Gold-rich Pd-Au alloy
electrodes exhibited Tafel slopes and onset potentials close to pure gold electrodes. The
increase in the extent of the alloy by heat treatment led to a decrease of the ORR activity
in any case. Also, the vicinity of large amounts of gold nanoparticles decreased the ORR
activity of Pd nanoparticles.
No palladium-cobalt catalyst prepared by ethylene glycol reduction without subsequent
heat treatment showed Pd-Co alloy formation. To form the Pd–Co alloy, heat treatment at
300 ºC under H2 flow was necessary. When palladium and cobalt were co-deposited, the
presence of different concentrations of cobalt salts did not affect the Pd particle size;

154
particle sizes were similar to those of pure Pd/C. On the other hand, the presence of
cobalt depressed particle sintering during heat treatment at 300 ºC under H2; smaller
particle growth was observed for larger Co contents.
Catalysts with a Co content of ca. Pd:Co 1:0.6 or higher exhibit a decrease in the
exchange current density after heat treatment under H2. Alloying large amounts of Co has
a negative impact in the ORR activity. For Co content of ca. Pd:Co 1:0.2, no significant
differences in the activity after the alloying process were observed when the catalyst were
prepared on Pd/C; however a slight improvement in the ORR activity was exhibited when
both metals were co-deposited.
No palladium-iron catalysts prepared by reduction with ethylene glycol showed Pd-Fe
alloy formation before heat treatment. Small amounts of Fe atoms are believed to have
been introduced in the Pd lattice after heat treatment at 300 ºC under H2 based on changes
in the shape of the cyclic voltammograms compared to pure Pd and small changes in the
Pd-Pd bond distance. All Pd-Fe catalysts prepared by reduction under H2 at 500 ºC
showed a typical face-centered cubic pattern with diffraction angles clearly shifted to
higher positions compared to those of Pd/C, indicating the formation of Pd-Fe alloy. The
presence of iron, likewise gold and cobalt, depressed particle sintering during heat
treatment; smaller particle growth was recorded for larger Fe contents. A reduction peak
with its maximum at ca. 0.36 V appeared in every Pd-Fe catalyst during the electrode
conditioning, which according to the Poubaix diagram for iron in aqueous solution was
caused by the reduction of Fe2O3 to Fe2+
. The area under the peak, and therefore the
amount of Fe2O3, was larger in unalloyed catalysts.
All palladium-iron catalysts presented ORR activities lower than Pd/C. Introduction of
iron in the palladium lattice was found to be detrimental to the ORR, contradicting work
published by Shao et al. The highest activities within the Pd-Fe catalysts were exhibited
by those prepared on Pd/C. The biggest drops in ORR activity compared to Pd/C where
exhibited by catalysts with high iron content (Pd:Fe 3:1).

155
No significant changes in the Pd-Pd bond distance, compared to Pd/C, were observed for
palladium-titanium catalyst prepared either by ethylene glycol reduction, before or after
heat treatment at 300 ºC in H2, or by reduction in H2 at 900 ºC. However, the average Pd-
Pd bond distance for catalysts synthesized by reduction in H2 at 900 ºC was 0.2747 nm,
lower than that of Pd/C by 0.0004 nm. Since Fernández et al. claimed the formation of
Pd-Ti alloy based on small shifts in the XRD patterns, the presence of some Pd-Ti alloy
could not be completely discarded. The presence of TiO2 in its anatase form was easily
identified from the XRD patters in all Pd-Ti catalysts with high titanium content;
catalysts with lower Ti content are also believed to include small amounts of anatase. The
presence of TiO2 did not depress the sintering of Pd nanoparticles during heat treatment
in H2.
Pd-Ti catalysts prepared by EG reduction without heat treatment presented ORR
activities close to Pd/C, independently of the amount of TiO2 present. This activity
decreased after heat treatment at 300 ºC in H2, which was believed to introduce some Ti
in the Pd lattice. Catalysts synthesized at high temperatures (900 ºC in H2) presented
lower ORR when the Ti content was high (Pd:Ti 1:1) compared to those with low Ti
content (Pd:Ti 9:1). All Pd-Ti catalysts exhibited lower catalytic activity than Pd/C.
In summary, the presence of Au, Co and Fe decreased the degree of sintering of Pd
nanoparticles; the presence of Ti did not affect Pd particle growth. Only Pd-Au and Pd-
Co exhibited alloy formation using ethylene glycol as reducing agent, in the case of Co
heat treatment at 300 ºC under H2 flow was necessary to form the alloy. Pd-Fe, alloys
were only identifiable after reduction at 500 ºC in H2. No Pd-Ti catalysts exhibited clear
alloy formation under any synthetic conditions. Only Pd-Co alloys with atomic ratio
Pd:Co 4:1, synthesized by ethylene glycol reduction and after heat treatment at 300 ºC
under H2 flow, exhibited improved ORR activity compared to Pd/C.

156
References
1. Damjanovic, A., Mechanism of oxygen reduction related to electronic structure of
gold-palladium alloy. Journal of Physical Chemistry, 1967. 71(8): p. 2741-2742.
2. Obuchi, A., A. Ogata, K. Mizuno, A. Ohi, and H. Ohuchi, Properties of Pd-Au
and Pt-Cu alloy surfaces for the adsorption and catalytic reduction of O2 and NO
by H2. Colloids Surf., A Full Journal Title:Colloids and Surfaces, A:
Physicochemical and Engineering Aspects, 1993. 80(2-3): p. 121-6.
3. Fernández, J.L., V. Raghuveer, A. Manthiram, and A.J. Bard, Pd-Ti and Pd-Co-Au
Electrocatalysts as a Replacement for Platinum for Oxygen Reduction in Proton
Exchange Membrane Fuel Cells. Journal of the American Chemical Society,
2005. 127(38): p. 13100-13101.
4. Savadogo, O., K. Lee, K. Oishi, S. Mitsushima, N. Kamiya, and K.I. Ota, New
palladium alloys catalyst for the oxygen reduction reaction in an acid medium.
Electrochemistry Communications, 2004. 6(2): p. 105-109.
5. Mustain, W.E., K. Kepler, and J. Prakash, CoPdx oxygen reduction
electrocatalysts for polymer electrolyte membrane and direct methanol fuel cells.
Electrochimica Acta, 2006. 52(5): p. 2102-2108.
6. Zhang, L., K. Lee, and J. Zhang, Effect of synthetic reducing agents on
morphology and ORR activity of carbon-supported nano-Pd-Co alloy
electrocatalysts. Electrochim. Acta Full Journal Title:Electrochimica Acta, 2007.
52(28): p. 7964-7971.
7. Suo, Y., L. Zhuang, and J. Lu, First-principles considerations in the design of Pd-
alloy catalysts for oxygen reduction. Angewandte Chemie - International Edition,
2007. 46(16): p. 2862-2864.
8. Liu, H. and A. Manthiram, Controlled synthesis and characterization of carbon-
supported Pd 4Co nanoalloy electrocatalysts for oxygen reduction reaction in fuel
cells. Energy and Environmental Science, 2009. 2(1): p. 124-132.
9. Fernández, J.L., D.A. Walsh, and A.J. Bard, Thermodynamic Guidelines for the
Design of Bimetallic Catalysts for Oxygen Electroreduction and Rapid Screening
by Scanning Electrochemical Microscopy. M-Co (M: Pd, Ag, Au). Journal of the
American Chemical Society, 2004. 127(1): p. 357-365.
157
10. Shao, M., P. Liu, J. Zhang, and R. Adzic, Origin of enhanced activity in palladium
alloy electrocatalysts for oxygen reduction reaction. Journal of Physical
Chemistry B, 2007. 111(24): p. 6772-6775.
11. F*A*C*T and ChemSage/ChemApp, G., Facility for the Analysis of Chemical
Thermodynamics
12. Tarasevich, M.R., G.V. Zhutaeva, V.A. Bogdanovskaya, M.V. Radina, M.R.
Ehrenburg, and A.E. Chalykh, Oxygen kinetics and mechanism at electrocatalysts
on the base of palladium-iron system. Electrochimica Acta, 2007. 52(15): p. 5108-
5118.
13. Cullity, B.D., Elements of X-Ray Diffraction. 1978: Addison-Wesley.
14. Shao, M.-H., K. Sasaki, and R.R. Adzic, Pd-Fe Nanoparticles as Electrocatalysts
for Oxygen Reduction. Journal of the American Chemical Society, 2006. 128(11):
p. 3526-3527.
15. Celzard, A., J.F. Mareche, G. Furdin, V. Fierro, C. Sayag, and J. Pielaszek,
Preparation and catalytic activity of active carbon-supported Mo2C
nanoparticles. Green Chemistry, 2005. 7(11): p. 784-792.
16. Mallát, T., É. Polyánszky, and J. Petró, Electrochemical study of palladium
powder catalysts. Journal of Catalysis, 1976. 44(3): p. 345-351.
17. Łukaszewski, M. and A. Czerwiński, Electrochemical behavior of palladium-gold
alloys. Electrochimica Acta, 2003. 48(17): p. 2435-2445.
18. Hoare, J.P., A Cyclic Voltammetric Study of the Gold-Oxygen System. Journal of
The Electrochemical Society, 1984. 131(8): p. 1808-1815.
19. Damjanovic, A. and V. Brusic, Oxygen reduction at Pt-Au and Pd-Au alloy
electrodes in acid solution. Electrochimica Acta, 1967. 12(9): p. 1171-1184.
20. Rand, D.A.J. and R. Woods, A study of the dissolution of platinum, palladium,
rhodium and gold electrodes in 1 m sulphuric acid by cyclic voltammetry. Journal
of Electroanalytical Chemistry, 1972. 35(1): p. 209-218.
21. Pourbaix, M., Atlas of Electrochemical Equilibria in Aqueous Solutions. 2nd ed.
1974, Houston: National Association of Corrosion Engineers.
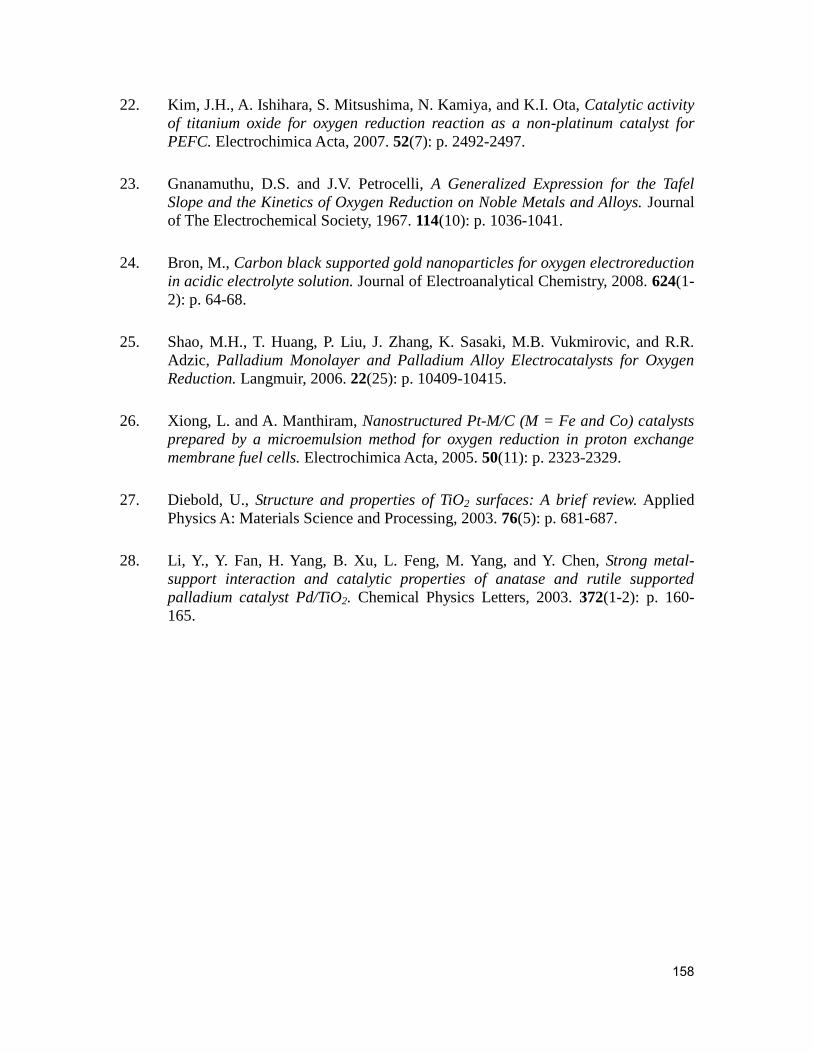
158
22. Kim, J.H., A. Ishihara, S. Mitsushima, N. Kamiya, and K.I. Ota, Catalytic activity
of titanium oxide for oxygen reduction reaction as a non-platinum catalyst for
PEFC. Electrochimica Acta, 2007. 52(7): p. 2492-2497.
23. Gnanamuthu, D.S. and J.V. Petrocelli, A Generalized Expression for the Tafel
Slope and the Kinetics of Oxygen Reduction on Noble Metals and Alloys. Journal
of The Electrochemical Society, 1967. 114(10): p. 1036-1041.
24. Bron, M., Carbon black supported gold nanoparticles for oxygen electroreduction
in acidic electrolyte solution. Journal of Electroanalytical Chemistry, 2008. 624(1-
2): p. 64-68.
25. Shao, M.H., T. Huang, P. Liu, J. Zhang, K. Sasaki, M.B. Vukmirovic, and R.R.
Adzic, Palladium Monolayer and Palladium Alloy Electrocatalysts for Oxygen
Reduction. Langmuir, 2006. 22(25): p. 10409-10415.
26. Xiong, L. and A. Manthiram, Nanostructured Pt-M/C (M = Fe and Co) catalysts
prepared by a microemulsion method for oxygen reduction in proton exchange
membrane fuel cells. Electrochimica Acta, 2005. 50(11): p. 2323-2329.
27. Diebold, U., Structure and properties of TiO2 surfaces: A brief review. Applied
Physics A: Materials Science and Processing, 2003. 76(5): p. 681-687.
28. Li, Y., Y. Fan, H. Yang, B. Xu, L. Feng, M. Yang, and Y. Chen, Strong metal-
support interaction and catalytic properties of anatase and rutile supported
palladium catalyst Pd/TiO2. Chemical Physics Letters, 2003. 372(1-2): p. 160-
165.

159
Chapter 6: Hydrogen fuel cell tests
6.1. Introduction
Two of the synthesized catalysts reported in previous chapters were tested as cathode
materials in a low temperature PEMFC using Nafion®
at different temperatures with
hydrogen. Two catalysts were chosen, the optimised carbon-supported palladium, Pd-
EG11, and a palladium-cobalt catalyst, Pd4Co-EG11-300. Commercial Pt/C from E-Tek
was used as a benchmark.
Pd-EG11 was tested as cathode material at two different metal loadings, 0.6 and 1.0 mg
cm-2
. Since palladium is considerably cheaper than platinum, the use of larger amounts of
Pd in the cell cathode in order to match or surpass the performance of a Pt cathode would
still be economically advantageous. The effect of the thickness of the catalyst layer was
also discussed.
6.2. Low temperature polymer electrolyte membrane fuel cell tests
6.2.1. Evaluation of carbon-supported palladium nanoparticles
The optimized carbon-supported palladium, Pd-EG11, prepared by reduction of the
palladium precursor with ethylene glycol on Vulcan XC-72R, was tested as a cathode
catalyst in a low temperature hydrogen PEM fuel cell at 20, 40 and 60 ºC. Cathode
loading was set to 0.6 mg cm-2
and its performance was compared to that of commercial
Pt/C from E-tek.
Figure 6-1 shows polarization curves at scan rate 5 mV s-1
of the Pd MEA with air fed to
the cathode. At 20 and 40 ºC potential losses due to catalyst activation (occurring in the

160
low current densitity region) were hardly observed in the polarization curve. This kinetic
region was believed to be masked by the overpotential caused by H2 crossover, as
discussed further on in this chapter. Open circuit potential (OCP) for the Pd MEA at 20
and 40 ºC was ca. 0.71 and 0.75 V, repectively. At 60 ºC the OCP decreased to ca. 0.68 V.
This decrease in OCP was attributed to a lower oxygen concentration at the catalyst
surface caused by smaller oxygen permeability in Nafion® with lower water content.
0.0
0.1
0.2
0.3
0.4
0.5
0.6
0.7
0.8
0.9
1.0
0.0 0.5 1.0 1.5
E / V
(vs N
HE
)
i / A cm-2
Pd 20 C air
Pd 40 C air
Pd 60 C air
Figure 6-1: Polarization curves of a low temperature polymer electrolyte membrane fuel cell with
carbon-supported Pd nanoparticles as cathode catalyst at 20, 40 and 60 ºC operating with air.
This lower oxygen permeability at 60 ºC compared to 20 and 40 ºC was suggested by the
limiting current exhibited at 60 ºC. Limiting current density was not observed when tests
were carried out at 20 and 40 ºC but was ca. 0.8 A cm-2
when the temperature was further
increased to 60 ºC. The presence of a limiting current indicates oxygen starvation; this
supports the hypothesis of lower water content in the electrode, which would affect the
oxygen supply. While oxygen permeability in Nafion® increases with temperature up to
80 ºC for a given water content, it decreases sharply with decreasing water content,

161
especially at higher temperatures (the dependence of oxygen permeability in Nafion® on
water content increases with temperature) [1]. For a given relative humidity, water
content in Nafion®
decreases with increasing temperature [2] and for a given water vapor
pressure, relative humidity decreases with increasing temperature [3]. Therefore the water
content in Nafion® was lower at 60 ºC and as a consequence the oxygen permeability was
lower.
Current densities exhibited by the Pd-EG11 MEA with air fed in the cathode (Table 6-1)
increased when the fuel cell operating temperature was raised from 20 to 40 ºC, from
0.06 to 0.13 A cm-2
at 0.65 V. When the temperature was further increased to 60 ºC the
current density decreased to 0.02 A cm-2
at 0.65 V.
Figure 6-2 shows polarization curves obtained with the Pd MEA, at scan rate 5 mV s-1
,
with oxygen fed to the cathode. The effect of the temperature increase was different to the
air fed cathode, the important performance loss at 60 ºC was not observed. In curves at 20
and 40 ºC the activation region was hardly observed. Open circuit potentials at 20, 40 and
60 ºC were ca. 0.75 and 0.80 and 0.79 V, respectively. The smaller decrease in the OCP
and the slight increase in current density at low potentials when the temperature was
increased from 40 to 60 ºC, compared to the air fed cathode, could be explained by a
higher oxygen concentration when pure oxygen was used. Since dryness reduced the
oxygen permeability through the Nafion® in the catalyst layer, and the permeability is
proportional to the concentration [4], the effect would be more dramatic in air because the
O2 concentration is only 21%.

162
0.0
0.1
0.2
0.3
0.4
0.5
0.6
0.7
0.8
0.9
1.0
0.0 0.5 1.0 1.5 2.0 2.5 3.0 3.5 4.0 4.5
E / V
(vs N
HE
)
i / A cm-2
Pd 20 C oxygen
Pd 40 C oxygen
Pd 60 C oxygen
Figure 6-2: Polarization curves of a low temperature polymer electrolyte membrane fuel cell with
carbon-supported Pd nanoparticles as cathode catalyst at 20, 40 and 60 ºC operating with oxygen.
With O2 (Figure 6-2) current densities at 0.65 V increased when the cell temperature
increased from 20 to 40 ºC from 0.24 to 0.59 A cm-2
, and when the temperature was
further increased to 60 ºC the current density slightly decreased to 0.54 A cm-2
. Current
densities exhibited by the different MEAs at 0.65 V are given in Table 6-1.

163
Table 6-1: Current densities at 0.65 V and peak power densities for low temperature PEMFC at
different conditions and with different electrocatalysts in the cathode.
Cathode
catalyst
Temperature
( ºC)
Cathode
fed
Current density
at 0.65 V
(A cm-2
)
Peak power
density
(mW cm-2
)
Pd-EG11 20 Air 0.06 182
Pd-EG11 20 O2 0.24 516
Pd-EG11 40 Air 0.13 183
Pd-EG11 40 O2 0.59 779
Pd-EG11 60 Air 0.02 147
Pd-EG11 60 O2 0.54 782
Pd4Co-EG11-300 20 Air 0.12 188
Pd4Co-EG11-300 20 O2 0.34 538
Pd4Co-EG11-300 40 Air 0.21 233
Pd4Co-EG11-300 40 O2 0.65 790
Pd4Co-EG11-300 60 Air 0.04 120
Pd4Co-EG11-300 60 O2 0.50 671
Pt/C-Etek 20 Air 0.20 255
Pt/C-Etek 20 O2 0.66 667
Pt/C-Etek 40 Air 0.24 336
Pt/C-Etek 40 O2 0.92 913
Pt/C-Etek 60 Air 0.16 255
Pt/C-Etek 60 O2 1.08 1,040
Cell resistance values were measured, using an AC frequency response analyser, for the
Pd-EG11 MEA at 20, 40 and 60 ºC were 92, 73 and 67 mΩ, respectively. Resistance
decreased with increasing temperature as expected, which suggested the poor
performance at 60 ºC was not a resistance issue, but oxygen mass transport.
Failure of the catalyst activity to increase with temperature after 40 ºC, with both air and
oxygen, following Arrhenius behavior, was attributed to electrode dryness. Dryness
would have reduced the oxygen concentration on the catalyst surface and that would
counter the kinetic enhancement due to the temperature increase. Dryness (low water

164
content) decreased oxygen permeability in Nafion®, and since this also depends on the
oxygen concentration, the effect was more severe operating with low oxygen
concentration (air). Since only the anode stream was humidified electrode dryness was
uniquely affecting the cathode; the anode humidification provided enough water to
humidify also the membrane, as concluded from the membrane resistance measurements
(the conductivity of the membrane increased with temperature as expected in a fully
hydrated membrane).
To confirm the hypothesis of the dryness a probe was introduced in the cell to measure
the relative humidity. At 20 ºC (humidifier at 30 ºC), 40 ºC (humidifier at 50 ºC) and 60
ºC (humidifier at 70 ºC) relative humidity was 88, 94 and 73%, respectively. These
measurements illustrated how relative humidity at 60 ºC was lower (causing electrolyte
dryness). This shows the high sensitivity of Nafion® based systems to the system water
management.
To confirm dryness as the cause of the performance loss at 60 ºC further tests were done.
The humidifier temperature was increased from 70 to 80 ºC while the cell temperature
was maintained at 60 ºC and a new polarization curve was recorded (Figure 6-3). The cell
performance at 60 ºC with the humidifier at 80 ºC exhibited higher current densities
compared to that with the humidifier at 70 ºC. The probe introduced to measure the
humidity showed that the relative humidity with the humidifier at 80 ºC increased to 86%
compared to 73%.

165
0.0
0.1
0.2
0.3
0.4
0.5
0.6
0.7
0.8
0.9
1.0
0.0 0.5 1.0 1.5 2.0 2.5 3.0 3.5 4.0 4.5
E /
V (
vs N
HE
)
i / A cm-2
Pt 60ºC oxygen (humidifier at 70ºC)
Pt 60ºC oxygen (humidifier at 80ºC)
Figure 6-3: Polarization curves of a low temperature polymer electrolyte membrane fuel cell with
Pt–Etek as cathode catalyst at 60 ºC operating with oxygen with the humidifier at 70 and 80 ºC.
Figure 6-4 shows cell polarization curves of the MEA prepared using commercial Pt/C as
catalyst for the ORR (Pt/C-Etek MEA) with air fed to the cathode. In all three curves the
activation region could be seen, unlike for the Pd MEA, the smallest activation losses
were at 40 ºC. Open circuit potentials at 20 and 40 ºC were ca. 0.93 V. At 60 ºC the OCP
fell to ca. 0.83 V, in a similar way observed with the Pd-EG11 MEA. The decrease in
open circuit potential when increasing the temperature from 40 to 60 ºC was
accompanied by a decreased performance in the low current density region. The
polarization curve at 40 ºC showed some mass transport limitations at ca. 1.0 A cm-2
whilst at 60 ºC these limitations showed at ca. 0.8 A cm-2
. Decrease in the OCP and
current density also occurred in the Pt/C-Etek MEA consistent with the hypothesis that
the system was suffering from electrode dryness when operated at 60 ºC.
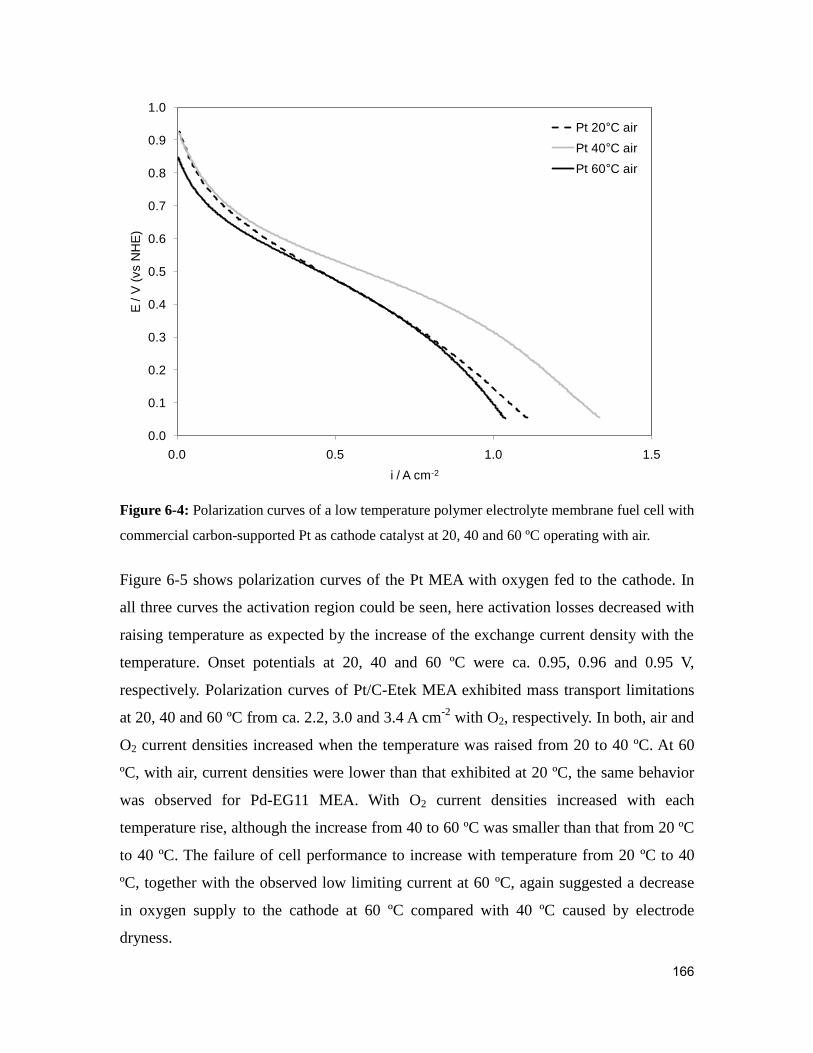
166
0.0
0.1
0.2
0.3
0.4
0.5
0.6
0.7
0.8
0.9
1.0
0.0 0.5 1.0 1.5
E / V
(vs N
HE
)
i / A cm-2
Pt 20 C air
Pt 40 C air
Pt 60 C air
Figure 6-4: Polarization curves of a low temperature polymer electrolyte membrane fuel cell with
commercial carbon-supported Pt as cathode catalyst at 20, 40 and 60 ºC operating with air.
Figure 6-5 shows polarization curves of the Pt MEA with oxygen fed to the cathode. In
all three curves the activation region could be seen, here activation losses decreased with
raising temperature as expected by the increase of the exchange current density with the
temperature. Onset potentials at 20, 40 and 60 ºC were ca. 0.95, 0.96 and 0.95 V,
respectively. Polarization curves of Pt/C-Etek MEA exhibited mass transport limitations
at 20, 40 and 60 ºC from ca. 2.2, 3.0 and 3.4 A cm-2
with O2, respectively. In both, air and
O2 current densities increased when the temperature was raised from 20 to 40 ºC. At 60
ºC, with air, current densities were lower than that exhibited at 20 ºC, the same behavior
was observed for Pd-EG11 MEA. With O2 current densities increased with each
temperature rise, although the increase from 40 to 60 ºC was smaller than that from 20 ºC
to 40 ºC. The failure of cell performance to increase with temperature from 20 ºC to 40
ºC, together with the observed low limiting current at 60 ºC, again suggested a decrease
in oxygen supply to the cathode at 60 ºC compared with 40 ºC caused by electrode
dryness.

167
0.0
0.1
0.2
0.3
0.4
0.5
0.6
0.7
0.8
0.9
1.0
0.0 0.5 1.0 1.5 2.0 2.5 3.0 3.5 4.0 4.5
E / V
(vs N
HE
)
i / A cm-2
Pt 20 C oxygen
Pt 40 C oxygen
Pt 60 C oxygen
Figure 6-5: Polarization curves of a low temperature polymer electrolyte membrane fuel cell with
commercial carbon-supported Pt as cathode catalyst at 20, 40 and 60 ºC operating with oxygen.
Figure 6-6 compares cell polarization curves of Pd-EG11 and Pt/C-Etek MEAs recorded
at 20 ºC with oxygen and air. A difference of approximately 200 mV in the open circuit
potential (OCP) between Pd and Pt was observed in both oxygen and air polarization
curves at room temperature. In the three-electrode cell with liquid electrolyte Pd/C
already presented an onset potential of 0.89 V vs NHE characterization, 70 mV lower
than Pt/C from E-tek prior to any hydrogen crossover effects encountered in the fuel cell
environment.

168
0
0.1
0.2
0.3
0.4
0.5
0.6
0.7
0.8
0.9
1
0 0.5 1 1.5 2 2.5
E / V
(vs N
HE
)
i / mA cm-2
Pt 20ºC air
Pd 20ºC air
Pt 20ºC oxygen
Pd 20ºC oxygen
Figure 6-6: Comparison of polarization curves of a low temperature polymer electrolyte
membrane fuel cell with carbon-supported Pd nanoparticles and commercial Pt/C from E-tek as
cathode catalyst at 20 ºC.
The observed OCP in a fuel cell is always lower than the estimated value from the
thermodynamics (1.23 V for oxygen reduction) due to the effect of crossover and other
phenomena like carbon corrosion [5]. The increased difference in the OCP between Pd
and Pt when tested in the PEM fuel cell compared to the half cell tests can be explained
by H2 crossover through the electrolyte membrane. The impact of this crossover was
higher in Pd due to its lower exchange current density for ORR. This can be explained as
follows:
The crossover effect on OCP has been accounted by modeling the flux of hydrogen
through the membrane and by considering the total current as the sum of the two partial
currents for hydrogen oxidation and oxygen reduction at the cathode:

169
22 ,, HCOCC iii (6.1)
Where iC,O2 is the current density for oxygen reduction at the cathode and iC,H2 is current
density for (crossed-over) hydrogen oxidation in the cathode.
At open circuit conditions the current iC is zero:
022 ,, HCOC ii (6.2)
While iC,H2 is limited by the hydrogen crossover rate through the membrane, adapting
Fick‟s law for diffusion can be written:
tyPermeabili
nFA
i HC2,
(6.3)
Where n is number of electrons involved in hydrogen oxidation (n=2), F faraday
constant, A is cell geometric area (1 cm2) and δ is the Nafion
® membrane thickness
(50μm). Using hydrogen permeability value of 1.8 x 10⁻¹¹
mole cm-1
s-1
[6] a value of 0.7
mA cm-2
for iC,H2 was obtained.
The over potential loss due to crossover, ηcrossover, is the sum of losses of hydrogen
oxidation overpotential, ηC,H2, and oxygen reduction overpotential, ηC,O2, at the cathode at
current iC,H2 = 0.7 mA cm-2
.
The relation between current density and potential loss can be expressed by the Butler-
Volmer equation as:
RT
F
RT
Fii ac expexp0
(6.4)

170
Where η is the overpotential, i is the current density, i0 is the exchange current density
and αa and αc are the transfer coefficients of the anodic and cathodic reactions,
respectively. Assuming αa=αc=α, the hyperbolic sine function can be substituted in
equation 6.1 yielding the following relationship:
22 ,,0, sinh2 OCORROCRT
Fii
(6.5)
22 ,,0, sinh2 HCHORHCRT
Fii
(6.6)
Where iC,H2= iC,O2 at OCP, i0,ORR is the apparent oxygen reduction exchange current
density and i0,HOR is the apparent hydrogen oxidation exchange current density at the
cathode.
The apparent exchange current density for oxygen reduction, i0,ORR, was calculated as the
product of the exchange current density for ORR obtained from the half cell tests, 1.4 x
10-10
A cm-2
, the ECSA, 550 cm2 mg
-1, and the metal loading, 0.6 mg cm
-2, and resulted
4.62 x 10⁻⁸
A cm-2
for platinum. The transfer coefficient α was also taken as 1 (see
chapter 4). Similarly for palladium we can write the product of 7.7 x 10⁻¹²
A cm-2
, the
ECSA, 150 cm2 mg
-1, and the metal loading, 0.6 mg cm
-2, and was 6.93 x 10
-10 A cm
-2.
Substituting the values above into Equation 6.5 obtained values of ηC,O2 were 260 and
373 mV for the Pt and Pd cathodes, respectively.
The hydrogen oxidation overpotential, ηC,H2, could be ignored due to the high value of the
exchange current density of hydrogen oxidation on Pt and Pd (1 and 1.28 mA.cm-2
,
respectively [6]). ηC,H2 values calculated for these exchange current densities were 0.015
and 0.13 mV for Pt and Pd, respectively (considering Tafel slopes of 32 mV dec-1
for Pt
and 100 mV dec-1
for Pd [7]). The calculated ηcrossover for the palladium MEA was 0.113
V larger than for platinum for the same crossover rate.

171
The high value of the overpotential losses caused by the crossover at low current
densities (373 mV) masked the kinetic region of the polarization curve for Pd MEA were
polarization curves started from low OCP of ca. 750 mV with oxygen. This is observed in
Figure 6-6, Figure 6-7 and Figure 6-8, where the activation region could hardly be seen.
Polarization curves of Pd-EG11 and Pt-Etek MEAs have approximately the same slope in
the ohmic region, indicating that the resistance and the transport of reactants are similar
in both. At room temperature and operating with pure O2, recorded current densities at
0.65 V for Pd and Pt MEAs were 0.24 and 0.66 A cm-2
, respectively. For a given current
density of 1 A cm2, cell potentials were 0.46 V for Pd and 0.57 V for Pt. This was
translated into a constant difference of 110 mV in the ohmic region between Pd and Pt.
When air was fed to the cathode, current densities for Pd and Pt MEAs at 0.65 V were
0.06 and 0.20 A cm-2
respectively. Cell potentials at 0.5 A cm-2
were 0.33 V for Pd and at
0.45 for Pt, respectively; therefore a 120 mV difference existed between the polarization
curves.
Figure 6-7 shows cell polarization curves at 40 ºC. At this temperature operating with
pure O2 in the cathode, for Pd and Pt at 0.65 V, the cell exhibited current densities of 0.59
and 0.52 A cm-2
, respectively. For a given current density of 1 A cm-2
, cell potentials were
0.57 V for Pd and 0.63 for Pt. Thus, a constant difference of 60 mV was present in the
ohmic region. When air was fed to the cathode, recorded current densities at 0.65 V were
0.13 and 0.24 A cm-2
for Pd and Pt MEAs. Cell potentials at 0.5 A cm-2
were 0.45 V for
Pd and at 0.52 for Pt, respectively; therefore 70 mV difference existed between the
polarization curves.

172
0.0
0.1
0.2
0.3
0.4
0.5
0.6
0.7
0.8
0.9
1.0
0.0 0.5 1.0 1.5 2.0 2.5 3.0 3.5 4.0 4.5
E / V
(vs N
HE
)
i / A cm-2
Pt 40ºC air
Pd 40ºC air
Pt 40ºC oxygen
Pd 40ºC oxygen
Figure 6-7: Comparison of polarization curves of a low temperature polymer electrolyte
membrane fuel cell with carbon-supported Pd nanoparticles and commercial Pt/C from E-tek as
cathode catalyst at 40 ºC.
The observed decrease in the difference between Pt and Pd performances with
temperature, from 20 to 40 ºC, from 110 to 60 mV could be explained by the higher
activation energy of oxygen reduction reaction on Pd/C, ca. 90 KJ mol-1
[8], compared to
that on Pt, ca. 26 KJ mol-1
[9]. According to the Arrhenius equation (equation 6.1), the
rate of a reaction with higher activation energy will be more dependent on the
temperature. Therefore, for the same increase in the fuel cell temperature there would
have been a larger increase in the activity of Pd, compared to Pt.
Figure 6-8 shows cell polarization curves of Pt and Pd MEAs at 60 ºC. At this
temperature, operating with pure O2 in the cathode, recorded current densities at 0.5 V
were 1.38 and 1.98 A cm-2
for Pd and Pt, respectively. For a given current density, 2 A
cm-2
, cell potentials were 0.39 V for Pd and 0.49 V for Pt. Thus, a constant difference of

173
100 mV was observed in the ohmic region (larger than the difference at 40 ºC). When air
was fed to the cathode, recorded current densities at 0.5 V were, 0.16 and 0.45 A cm-2
for
Pd and Pt MEAs, respectively. Cell potentials at 0.5 A cm-2
were 0.30 V for Pd and at
0.45 V for Pt, respectively; therefore 150 mV difference existed between the polarization
curves. Peak power densities obtained from the Pd-EG11 and Pt-Etek MEAs when O2
was fed to the cathode were 782 and 1040 mW cm-2
, respectively. The increased
difference between Pd and Pt MEA at 60 ºC compared to 40 ºC is caused by
concentration decrease of O2 in the electrode causing higher losses in Pd than Pt because
of its lower exchange current density. This also can be seen by larger difference between
air and oxygen operation of Pd and Pt; the difference was 10 mVat 40 ºC (50 to 60 mV)
and it increased to 50 mV at 60 ºC (100 to 150 mV).
0.0
0.1
0.2
0.3
0.4
0.5
0.6
0.7
0.8
0.9
1.0
0.0 0.5 1.0 1.5 2.0 2.5 3.0 3.5 4.0 4.5
E / V
(vs N
HE
)
i / A cm-2
Pt 60ºC air
Pd 60ºC air
Pt 60ºC oxygen
Pd 60ºC oxygen
Figure 6-8: Comparison of polarization curves of a low temperature polymer electrolyte
membrane fuel cell with carbon-supported Pd nanoparticles and commercial Pt/C from E-tek as
cathode catalyst at 60 ºC.
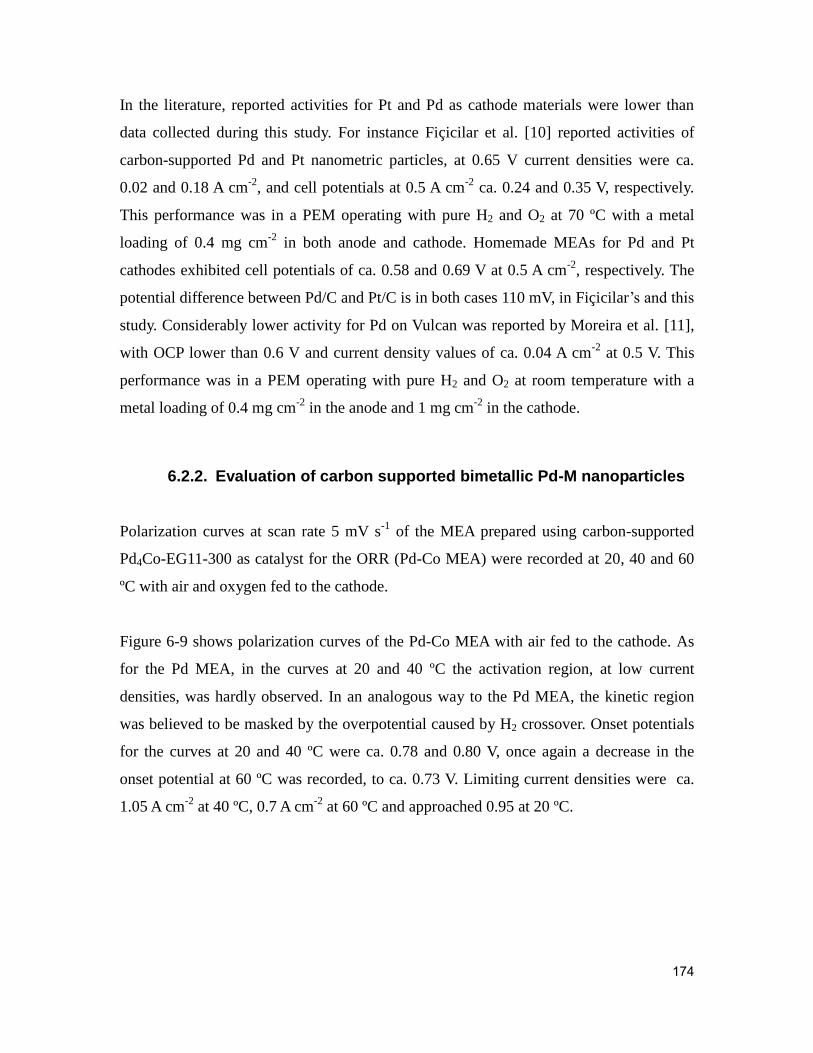
174
In the literature, reported activities for Pt and Pd as cathode materials were lower than
data collected during this study. For instance Fiçicilar et al. [10] reported activities of
carbon-supported Pd and Pt nanometric particles, at 0.65 V current densities were ca.
0.02 and 0.18 A cm-2
, and cell potentials at 0.5 A cm-2
ca. 0.24 and 0.35 V, respectively.
This performance was in a PEM operating with pure H2 and O2 at 70 ºC with a metal
loading of 0.4 mg cm-2
in both anode and cathode. Homemade MEAs for Pd and Pt
cathodes exhibited cell potentials of ca. 0.58 and 0.69 V at 0.5 A cm-2
, respectively. The
potential difference between Pd/C and Pt/C is in both cases 110 mV, in Fiçicilar‟s and this
study. Considerably lower activity for Pd on Vulcan was reported by Moreira et al. [11],
with OCP lower than 0.6 V and current density values of ca. 0.04 A cm-2
at 0.5 V. This
performance was in a PEM operating with pure H2 and O2 at room temperature with a
metal loading of 0.4 mg cm-2
in the anode and 1 mg cm-2
in the cathode.
6.2.2. Evaluation of carbon supported bimetallic Pd-M nanoparticles
Polarization curves at scan rate 5 mV s-1
of the MEA prepared using carbon-supported
Pd4Co-EG11-300 as catalyst for the ORR (Pd-Co MEA) were recorded at 20, 40 and 60
ºC with air and oxygen fed to the cathode.
Figure 6-9 shows polarization curves of the Pd-Co MEA with air fed to the cathode. As
for the Pd MEA, in the curves at 20 and 40 ºC the activation region, at low current
densities, was hardly observed. In an analogous way to the Pd MEA, the kinetic region
was believed to be masked by the overpotential caused by H2 crossover. Onset potentials
for the curves at 20 and 40 ºC were ca. 0.78 and 0.80 V, once again a decrease in the
onset potential at 60 ºC was recorded, to ca. 0.73 V. Limiting current densities were ca.
1.05 A cm-2
at 40 ºC, 0.7 A cm-2
at 60 ºC and approached 0.95 at 20 ºC.

175
0.0
0.1
0.2
0.3
0.4
0.5
0.6
0.7
0.8
0.9
1.0
0.0 0.5 1.0 1.5
E / V
(vs N
HE
)
i / A cm-2
PdCo 20 C air
PdCo 40 C air
PdCo 60 C air
Figure 6-9: Polarization curves of a low temperature polymer electrolyte membrane fuel cell with
carbon-supported Pd-Co nanoparticles as cathode catalyst at 20, 40 and 60 ºC operating with air.
In Figure 6-10 polarization curves of the Pd-Co MEA with O2 fed to the cathode are
shown. At 20 and 40 ºC the activation region was again hardly observed, only some
activation was observed at 60 ºC. Onset potentials for the curves at 20, 40 and 60 ºC were
ca. 0.75 and 0.80 V and 0.79, respectively.

176
0.0
0.1
0.2
0.3
0.4
0.5
0.6
0.7
0.8
0.9
1.0
0.0 0.5 1.0 1.5 2.0 2.5 3.0 3.5 4.0
E /
V (
vs N
HE
)
i / A cm-2
PdCo 20 C oxygen
PdCo 40 C oxygen
PdCo 60 C oxygen
Figure 6-10: Polarization curves of a low temperature polymer electrolyte membrane fuel cell
with carbon-supported Pd-Co nanoparticles as cathode catalyst at 20, 40 and 60 ºC operating with
oxygen.
Current densities exhibited by the Pd-Co MEA with air fed in the cathode (Figure 6-9) at
0.65 V operating at 20 and 40 ºC were 0.12 and 0.21 A cm-2
. When the temperature was
further increased to 60 ºC the observed current density decreased to 0.04 A cm-2
at 0.65 V.
Current densities at 0.65 V increased from 0.34 to 0.65 A cm-2
when the fuel cell
operating temperature was raised from 20 to 40 ºC. When the temperature was further
increased to 60 ºC the current density decreased to 0.50 A cm-2
at 0.65 V. The behavior of
this MEA was very similar to that of Pd-EG11 MEA, and by analogy, this lack of
improvement with temperature, following Arrhenius behavior, was attributed to electrode
dryness.
Figure 6-11 compares cell polarization curves of Pd-Co and Pd MEAs at 20 ºC. Open
circuit potentials were higher for Pd-Co MEA in air, by ca. 70 mV, and oxygen, by ca. 50

177
mV. Kinetic losses were also slightly lower for Pd-Co and, as a consequence differences
in the ohmic region were only 30 mV for air and 10 mV for oxygen. At 20 ºC operating
with pure O2 current densities at 0.65 V were 0.24 and 0.34 A cm-2
for Pd and Pd-Co,
respectively. For a given current density of 1 A cm-2
, cell potentials were 0.46 V for Pd
and 0.47 V for Pd-Co MEA, respectively. With air current densities at 0.65 V were double
for Pd-Co than for pure Pd, 0.06 and 0.12 A cm-2
for Pd and Pd-Co MEAs, respectively.
Cell potentials at 0.5 A cm-2
were 0.36 V for Pd and at 0.37 for Pd-Co, respectively.
Therefore, it could be stated that the addition of Co improved the catalytic activity of Pd,
especially in the kinetic region, as catalyst for oxygen reduction in acidic media at room
temperature.
0.0
0.1
0.2
0.3
0.4
0.5
0.6
0.7
0.8
0.9
1.0
0.0 0.5 1.0 1.5 2.0 2.5 3.0
E / V
(vs N
HE
)
i / A cm-2
Pd 20 C air
PdCo 20 C air
Pd 20 C oxygen
PdCo 20 C oxygen
Figure 6-11: Comparison of polarization curves of a low temperature polymer electrolyte
membrane fuel cell with carbon-supported Pd nanoparticles and carbon-supported Pd-Co
nanoparticles as cathode catalyst at 20 ºC.
Figure 6-12 shows cell polarization curves of Pd-Co and Pd MEAs at 40 ºC. At this
temperature, operating with pure O2 in the cathode, current densities at 0.65 V were 0.59

178
and 0.65 A cm-2
for Pd and Pd-Co, respectively. For a given current density of 2 mA cm-2
,
cell potentials were 0.39 V for both Pd and Pd-Co MEAs. When air was fed to the
cathode, recorded current densities at 0.65 V were, 0.13 and 0.21 A cm-2
for Pd and Pd-
Co MEAs, respectively. Cell potentials at 0.5 A cm-2
were 0.44 V for Pd and at 0.45 for
Pd-Co. Similarly to 20 ºC, an improvement in cell performance, especially in the low
current density region was observed with Pd-Co over pure Pd.
0.0
0.1
0.2
0.3
0.4
0.5
0.6
0.7
0.8
0.9
1.0
0.0 0.5 1.0 1.5 2.0 2.5 3.0 3.5 4.0 4.5
E / V
(vs N
HE
)
i / A cm-2
Pd 40 C air
PdCo 40 C air
Pd 40 C oxygen
PdCo 40 C oxygen
Figure 6-12: Comparison of polarization curves of a low temperature polymer electrolyte
membrane fuel cell with carbon-supported Pd nanoparticles and carbon-supported Pd-Co
nanoparticles as cathode catalyst at 40 ºC.
Figure 6-13 compares polarization curves of Pd-Co and Pd MEAs at 60 ºC. Operating
with pure O2 in the cathode current densities at 0.65 V were 0.54 and 0.50 A cm-2
for Pd
and Pd-Co, respectively. For a given current density of 2 mA cm-2
, cell potentials were
0.38 V for Pd and 0.33 V for Pd-Co MEA, respectively. When air was fed to the cathode,
current densities at 0.65 V were 0.02 and 0.04 A cm-2
for Pd and Pd-Co MEAs,
respectively. Cell potentials at 0.5 A cm-2
were 0.29 V for Pd and at 0.21 V for Pd-Co.

179
0.0
0.1
0.2
0.3
0.4
0.5
0.6
0.7
0.8
0.9
1.0
0.0 0.5 1.0 1.5 2.0 2.5 3.0 3.5 4.0
E / V
(vs N
HE
)
i / A cm-2
Pd 60 C air
PdCo 60 C air
Pd 60 C oxygen
PdCo 60 C oxygen
Figure 6-13: Comparison of polarization curves of a low temperature polymer electrolyte
membrane fuel cell with carbon-supported Pd nanoparticles and carbon-supported Pd-Co
nanoparticles as cathode catalyst at 60 ºC.
Figure 6-14 compares polarization curves of Pd-Co and commercial Pt MEAs operating
with air at 40 ºC. Current densities at 0.70 V were 0.14 and 0.16 A cm-2
for Pd-Co and Pt,
respectively. Peak power densities were 336 and 234 mW cm-2
for Pd-Co and Pt MEAs,
respectively.
180
0
50
100
150
200
250
300
350
400
0.0
0.1
0.2
0.3
0.4
0.5
0.6
0.7
0.8
0.9
1.0
0.0 0.2 0.4 0.6 0.8 1.0 1.2 1.4 1.6
P /
mW
cm
-2
E /
V (
vs N
HE
)
i / mA cm-2
Pt
PdCo
Pt
PdCo
Figure 6-14: Comparison of polarization curves of a low temperature polymer electrolyte
membrane fuel cell with carbon-supported Pd-Co nanoparticles and commercial Pt/C as cathode
catalyst operating with air at 40 ºC.
Several publications reported characterization of Pd-Co catalysts for ORR in half cells,
few PEM fuel cells with Pd-Co cathodes has been reported. Mustain et al. [12] showed
polarization curves of a PEM fuel cell with commercial Pt/C and Pd3Co/C cathodes both
producing ca. 0.25 and 0.21 A cm-2
at 0.65 V, respectively, with pure H2 and O2, at 60 ºC
and with 0.2 mg cm-2
of metal in both anode and cathode. Is not possible to directly
compare with our catalyst due to the lack of information. No Pd-Pd distances were
provided for comparison with Pd4Co-EG11-300. In a later publication [13], the same
group reported the cathodic polarization curves of a cell with Pd5Co/C as catalysts for
ORR. Current densities reported at 0.65 V were A cm-2
at 60 ºC.

181
Table 6-2: Comparison of Pd-Co catalysts performance with published data.
Catalyst
Output
Operating Conditions
Reference
Pd3Co/C 0.21 A cm-2
(cathode) 0.65 V, 60 ºC, H2/O2
0.2 mg cm-2
cathode [12]
Pt/C 0.25 A cm-2
(cathode) 0.65 V, 60 ºC, H2/O2
0.2 mg cm-2
cathode
[12]
Pd5Co/C 0.15 A cm-2
(single cell) 0.65 V, 60 ºC, H2/O2
0.2 mg cm-2
cathode
[13]
Pt/C 0.15 A cm-2
(single cell) 0.65 V, 60 ºC, H2/O2
0.2 mg cm-2
cathode
[13]
Pd4Co/C 0.50 A cm-2
(single cell) 0.65 V, 60 ºC, H2/O2
0.6 mg cm-2
cathode This work
Pt/C 1.1 A cm-2
0.65 V, 60 ºC, H2/O2
0.6 mg cm-2
cathode This work
6.2.3. Evaluation of higher loading palladium electrodes
Since palladium is approximately four times cheaper than platinum (Johnson Matthey
prices), the use of larger amounts of Pd in the cell cathode in order to match or overtake
the performance of a Pt cathode would still be economically advantageous. In this section
a MEA with cathode loading 1.0 mg cm-2
of Pd was compared with MEAs with cathode
loadings of 0.6 mg cm-2
of Pd or Pt.
Figure 6-15 and Figure 6-16 compare polarization curves of palladium MEAs with
different cathode metal loadings at 20 and 40 ºC, respectively. The increase of the
cathode metal loading from 0.6 to 1.0 mg cm-2
produced a large increase in current
density in the kinetic region (low current densities). At 20 ºC operating with air the open
circuit voltage increased by 0.14 V, from ca. 0.71 to 0.85 V. Operating with oxygen at 20
ºC the OCP increase was also 0.14 V. When the operating temperature was 40 ºC a
similar effect was observed in the cell OCP. Cathode metal loading 1.0 mg cm-2
exhibited

182
an OCP 0.15 and 0.13 V higher than loading 0.6 mg cm-2
, with air and oxygen,
respectively. This is in accord with the previous analysis of the crossover impact on Pd,
increasing the loading will increase the ECSA and i0 accordingly leading to a smaller
impact of crossover.
0
0.1
0.2
0.3
0.4
0.5
0.6
0.7
0.8
0.9
1
0 0.5 1 1.5 2 2.5
E /
V (
vs N
HE
)
i / A cm-2
Pd 0.6 mg 20ºC oxygen
Pd 0.6 mg 20ºC air
Pd 1.0 mg 20ºC oxygen
Pd 1.0 mg 20ºC air
Figure 6-15: Comparison of polarization curves of a low temperature PEMFC with cathode
catalyst Pd/C-EG11 and loadings 0.6 and 1.0 mg cm-2
at 20 ºC.
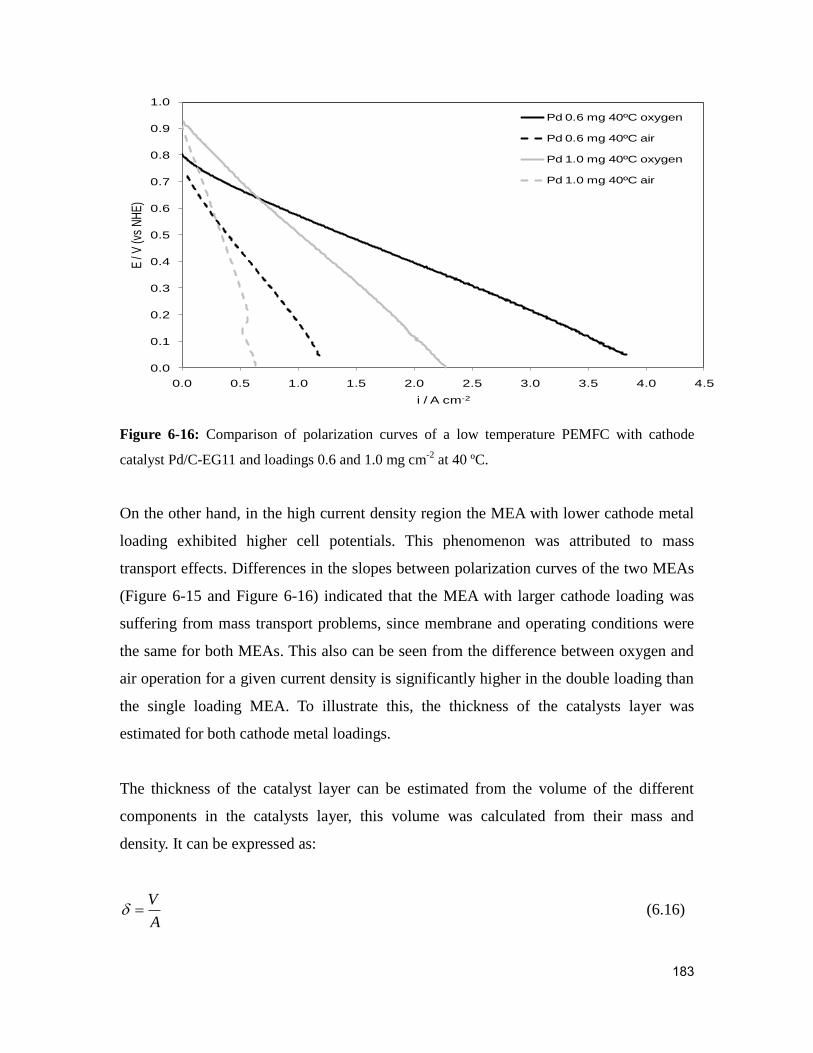
183
0.0
0.1
0.2
0.3
0.4
0.5
0.6
0.7
0.8
0.9
1.0
0.0 0.5 1.0 1.5 2.0 2.5 3.0 3.5 4.0 4.5
E /
V (v
s N
HE
)
i / A cm-2
Pd 0.6 mg 40ºC oxygen
Pd 0.6 mg 40ºC air
Pd 1.0 mg 40ºC oxygen
Pd 1.0 mg 40ºC air
Figure 6-16: Comparison of polarization curves of a low temperature PEMFC with cathode
catalyst Pd/C-EG11 and loadings 0.6 and 1.0 mg cm-2
at 40 ºC.
On the other hand, in the high current density region the MEA with lower cathode metal
loading exhibited higher cell potentials. This phenomenon was attributed to mass
transport effects. Differences in the slopes between polarization curves of the two MEAs
(Figure 6-15 and Figure 6-16) indicated that the MEA with larger cathode loading was
suffering from mass transport problems, since membrane and operating conditions were
the same for both MEAs. This also can be seen from the difference between oxygen and
air operation for a given current density is significantly higher in the double loading than
the single loading MEA. To illustrate this, the thickness of the catalysts layer was
estimated for both cathode metal loadings.
The thickness of the catalyst layer can be estimated from the volume of the different
components in the catalysts layer, this volume was calculated from their mass and
density. It can be expressed as:
A
V (6.16)

184
Where δ is the thickness of the catalyst layer and V is its total volume and A is the
geometric area. The total volume of the catalyst layer can be expressed as:
porCNafPd VVVVV (6.17)
Where VPd, VNaf, VC and Vpor are the volumes of the palladium, Nafion®, carbon and
porous parts in the catalyst layer, respectively. The porosity of the catalyst layer was
considered 30% volume, as reported by Jaouen et al. [14], metal loading was 20% wt
and Nafion®
content was 20% weight of Pd/C. Density of carbon was taken as 1.8 g cm-3
(for Vulcan XC-72R [15]), Nafion®
density was taken as 2.1 g cm-3
[16] and Pd density is
12.0 cm-3
with all three at 25 ºC.
The calculated thickness for cathodes with 0.6 and 1.0 mg cm-2
of Pd were 24 and 40 µm,
respectively. This shows how the catalysts layer thickness with 1.0 mgPt cm-2
was almost
twice that with 0.6 mgPt cm-2
, this would cause worse oxygen mass transport and greater
potential losses (ohmic losses). It must be also pointed out that both values are greatly
larger than those considered as optimal in low temperature PEMFC: Jeng et al. used a 5
µm catalyst layer in their study of the oxygen mass transport [17] and Jaouen et al. used a
10 µm thick catalyst layer [14]. Thus future investigations on Pd electrocatalysts would
look into the synthesis of Pd/C with higher metal content in order to reduce the thickness
of the catalyst layer. The effect of catalyst layer thickness and oxygen mass transport
losses was further discussed in section.
Figure 6-17 and Figure 6-18 compare polarization curves of palladium MEA with
cathode metal loading 1.0 mg cm-2
with the Pt MEA with cathode loading 0.6 mg cm-2
at
20 and 40 ºC, respectively. The same behavior discussed earlier for the two Pd MEAs is
also seen, in the high current densities region the lower loading MEAs exhibited
considerably higher potential, whilst in the kinetic region (low current density) the Pd
MEAs matched and sometimes even surpassed the performance of the Pt MEA.
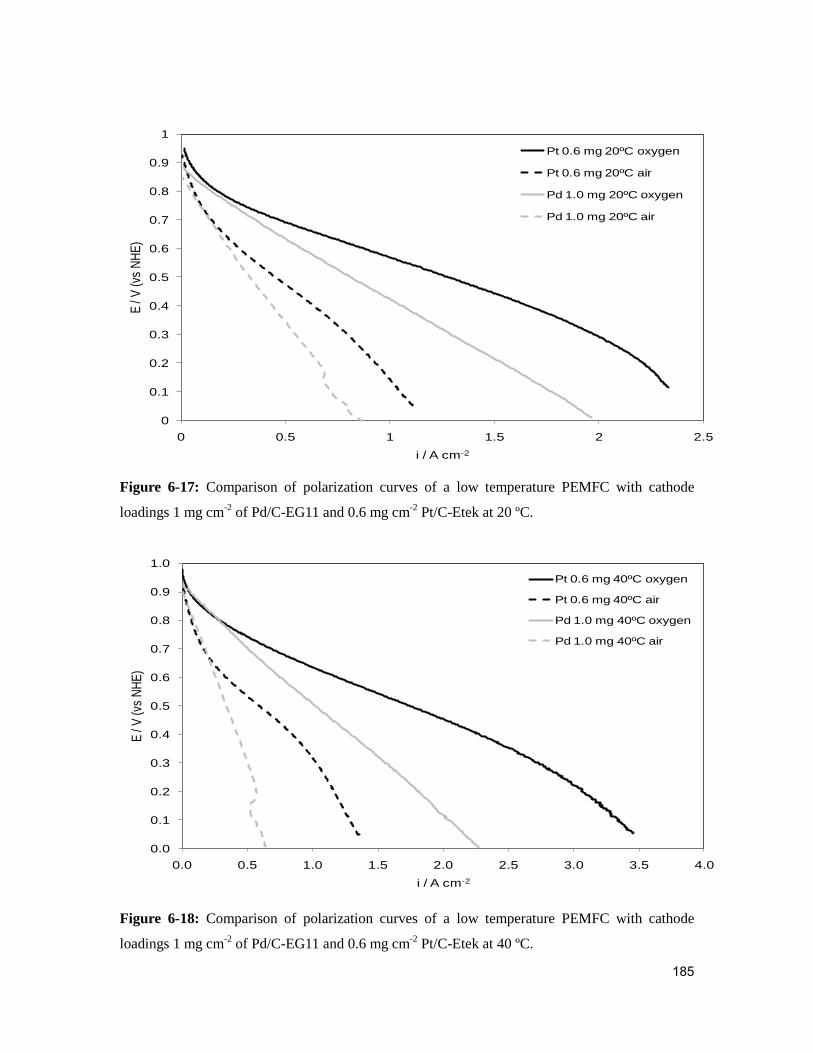
185
0
0.1
0.2
0.3
0.4
0.5
0.6
0.7
0.8
0.9
1
0 0.5 1 1.5 2 2.5
E /
V (
vs N
HE
)
i / A cm-2
Pt 0.6 mg 20ºC oxygen
Pt 0.6 mg 20ºC air
Pd 1.0 mg 20ºC oxygen
Pd 1.0 mg 20ºC air
Figure 6-17: Comparison of polarization curves of a low temperature PEMFC with cathode
loadings 1 mg cm-2
of Pd/C-EG11 and 0.6 mg cm-2
Pt/C-Etek at 20 ºC.
0.0
0.1
0.2
0.3
0.4
0.5
0.6
0.7
0.8
0.9
1.0
0.0 0.5 1.0 1.5 2.0 2.5 3.0 3.5 4.0
E /
V (
vs N
HE
)
i / A cm-2
Pt 0.6 mg 40ºC oxygen
Pt 0.6 mg 40ºC air
Pd 1.0 mg 40ºC oxygen
Pd 1.0 mg 40ºC air
Figure 6-18: Comparison of polarization curves of a low temperature PEMFC with cathode
loadings 1 mg cm-2
of Pd/C-EG11 and 0.6 mg cm-2
Pt/C-Etek at 40 ºC.

186
With the cell operating with air at 20 ºC at 0.75 V (ca. 60% efficiency) both platinum and
palladium produced current densities of 0.10 A cm-2
. When the cell operating temperature
was raised to 40 ºC Pd overtook Pt, with a current density of 0.14 compared to
0.12 A cm-2
, respectively. These operating conditions are favourable for economic and
practical reasons (it is easier and cheaper to operate the cell with air than with pure
oxygen). Therefore, the use of Pd, four times cheaper than platinum, even on a higher
loading is highly desirable; the price of the novel metal for the cathode would be
approximately 2.4 times cheaper.
6.3. High temperature polymer electrolyte membrane fuel cell tests
High temperature PEMFC tests were conducted at 120, 150 and 175 ºC with Pd-EG11 as
cathode catalyst and compared with those with a 20% weight commercial Pt/C.
Membrane Electrode Assemblies (MEA) were prepared using the phosphoric acid doped
PBI. Metal loading on the electrodes was 0.2 mg cm-2
of Pt in the anode and 0.3 mg cm-2
of Pd or Pt in the cathode.
Figure 6-19 compares polarization curves at 120 ºC for Pd and Pt MEAs operating with
oxygen and air. In all four polarization curves, potential loses due to the catalyst
activation in the low current density region can be observed. This activation region was
not observed in low temperature PEMFC for the Pd MEA. Exchange current densities for
the ORR depend on the oxygen concentration at the catalyst surface. No PBI was added
to the catalyst layer, polytetrafluoroethylene (PTFE) was used as a binder as this was
found to provide higher oxygen permeability as reported by Mamlouk and Scott [18];
therefore the oxygen concentration at the catalyst surface can be taken as the oxygen
concentration in pure phosphoric acid. Oxygen solubility in Nafion® at 30 ºC was
reported to be 9.3 x 10⁻³
mol dm-3
[19] whilst oxygen solubility in phosphoric acid at 125
ºC was reported to be 9.7 x 10⁻⁵
mol dm-3
[20]. Thus the oxygen concentration in the PBI

187
based cell would be approximately two orders of magnitude lower at high temperature
conditions as reported by Mamlouk and Scott [21].
0
0.1
0.2
0.3
0.4
0.5
0.6
0.7
0.8
0.9
1
0 0.2 0.4 0.6 0.8 1 1.2 1.4 1.6 1.8 2 2.2 2.4
E / V
(vs N
HE
)
i / A cm-2
Pt 120ºC oxygen
Pt 120ºC air
Pd 120ºC oxygen
Pd 120ºC air
Figure 6-19: Comparison of polarization curves of a high temperature PEMFC with cathode
catalysts Pd/C-EG11 and Pt/C-Etek at 120 ºC.
At 120 ºC current densities at 0.65 V with oxygen fed to the cathode for Pd and Pt MEAs
were 0.12 and 0.27 A cm-2
, respectively. Operating with air current densities for Pd and Pt
MEAs were 0.04 and 0.09 A cm-2
, respectively. Cell potentials compared at 0.2 A cm-2
were ca. 70 mV higher for Pt than Pd when the cell was operated with oxygen and
approximately 140 mV when air was used (Table 6-3).

188
Table 6-3: Current densities at 0.65 V and cell potentials at 0.2 A cm-2
for high temperature PEM
fuel cell at different conditions and with different electrocatalysts in the cathode.
Cathode
Catalyst
Temperature
( ºC)
Cathode
fed
Current density
at 0.65 V
(A cm-2
)
Cell potential
at 0.2 A cm-2
(V)
Pd-EG11 120 Air 0.035 424
Pd-EG11 120 O2 0.123 606
Pd-EG11 150 Air 0.026 385
Pd-EG11 150 O2 0.081 568
Pd-EG11 175 Air 0.009 341
Pd-EG11 175 O2 0.048 530
Pt/C-Etek 120 Air 0.089 570
Pt/C-Etek 120 O2 0.274 674
Pt/C-Etek 150 Air 0.089 572
Pt/C-Etek 150 O2 0.258 667
Pt/C-Etek 175 Air 0.089 571
Pt/C-Etek 175 O2 0.267 675
Figure 6-20 compares polarization curves at 150 ºC for Pd and Pt MEAs operating with
oxygen and air. Current densities exhibited by the Pt MEA at 0.65 V were almost
identical to those at 150 ºC (0.09 and 0.26 A cm-2
for air and oxygen, respectively). On
the other hand, current densities showed by the Pd MEA at 0.65 V were lower than at 120
ºC (0.03 and 0.08 A cm-2
for air and oxygen, respectively). Similar behavior was
observed when the operating temperature was further increased to 175 ºC: the
performance of the Pt MEA did not increase with temperature and Pd MEA showed lower
current densities at higher operating temperatures (Table 6-3).

189
0
0.1
0.2
0.3
0.4
0.5
0.6
0.7
0.8
0.9
1
0 0.2 0.4 0.6 0.8 1 1.2 1.4 1.6 1.8 2 2.2 2.4
E /
V (
vs N
HE
)
i / A cm-2
Pt 150ºC oxygen
Pt 150ºC air
Pd 150ºC oxygen
Pd 150ºC air
Figure 6-20: Comparison of polarization curves of a high temperature PEMFC with cathode
catalysts Pd/C-EG11 and Pt/C-Etek at 150 ºC.
0
0.1
0.2
0.3
0.4
0.5
0.6
0.7
0.8
0.9
1
0 0.2 0.4 0.6 0.8 1 1.2 1.4 1.6 1.8 2 2.2 2.4
E /
V (
vs N
HE
)
i / A cm-2
Pt 175ºC oxygen
Pt 175ºC air
Pd 175ºC oxygen
Pd 175ºC air
Figure 6-21: Comparison of polarization curves of a high temperature PEMFC with cathode
catalysts Pd/C-EG11 and Pt/C-Etek at 175 ºC.
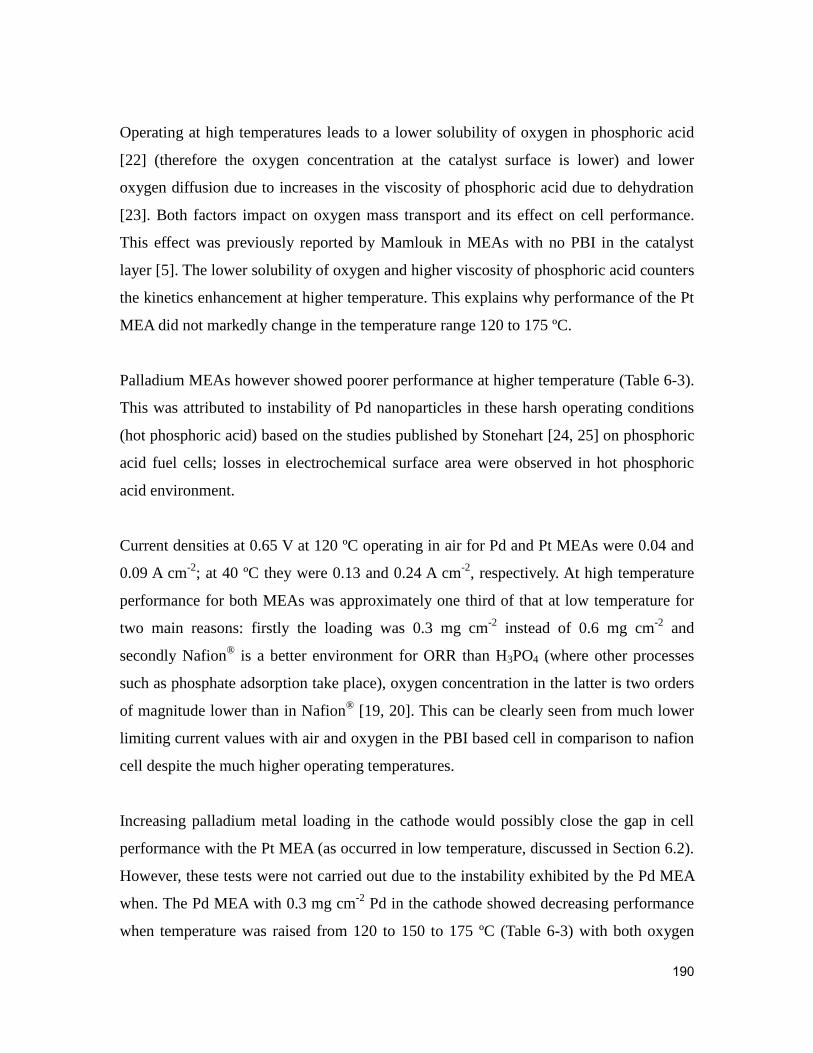
190
Operating at high temperatures leads to a lower solubility of oxygen in phosphoric acid
[22] (therefore the oxygen concentration at the catalyst surface is lower) and lower
oxygen diffusion due to increases in the viscosity of phosphoric acid due to dehydration
[23]. Both factors impact on oxygen mass transport and its effect on cell performance.
This effect was previously reported by Mamlouk in MEAs with no PBI in the catalyst
layer [5]. The lower solubility of oxygen and higher viscosity of phosphoric acid counters
the kinetics enhancement at higher temperature. This explains why performance of the Pt
MEA did not markedly change in the temperature range 120 to 175 ºC.
Palladium MEAs however showed poorer performance at higher temperature (Table 6-3).
This was attributed to instability of Pd nanoparticles in these harsh operating conditions
(hot phosphoric acid) based on the studies published by Stonehart [24, 25] on phosphoric
acid fuel cells; losses in electrochemical surface area were observed in hot phosphoric
acid environment.
Current densities at 0.65 V at 120 ºC operating in air for Pd and Pt MEAs were 0.04 and
0.09 A cm-2
; at 40 ºC they were 0.13 and 0.24 A cm-2
, respectively. At high temperature
performance for both MEAs was approximately one third of that at low temperature for
two main reasons: firstly the loading was 0.3 mg cm-2
instead of 0.6 mg cm-2
and
secondly Nafion®
is a better environment for ORR than H3PO4 (where other processes
such as phosphate adsorption take place), oxygen concentration in the latter is two orders
of magnitude lower than in Nafion® [19, 20]. This can be clearly seen from much lower
limiting current values with air and oxygen in the PBI based cell in comparison to nafion
cell despite the much higher operating temperatures.
Increasing palladium metal loading in the cathode would possibly close the gap in cell
performance with the Pt MEA (as occurred in low temperature, discussed in Section 6.2).
However, these tests were not carried out due to the instability exhibited by the Pd MEA
when. The Pd MEA with 0.3 mg cm-2
Pd in the cathode showed decreasing performance
when temperature was raised from 120 to 150 to 175 ºC (Table 6-3) with both oxygen

191
and air. This behavior was attributed to the loss of electrochemical surface area in hot
phosphoric acid environment, as discussed above.
6.4. Conclusions
Carbon supported Pd nanoparticles prepared by reduction by ethylene glycol at pH 11
were tested in a low temperature fuel cell as cathode material and its performance
compared to the state of the art commercial Pt/C. For the same metal loading, Pt cathode
performed better than Pd, although due to its higher activation energy Pd performance
was closer to Pt at higher temperature. Operating with air at 40 ºC current densities at
0.65 V (53% efficiency) for Pd and Pt MEAs were 0.13 and 0.24 A cm-2
, respectively.
Since Pd is considerably cheaper than platinum, the use of larger amounts of Pd in the
cathode would still be economically advantageous. MEA with Pd loading in the cathode
of 1.0 mg cm-2
was prepared and compared with MEAs with cathode loadings of 0.6 mg
cm-2
of Pd and Pt. The increase of the catalyst loading led to a sharp increase on the
kinetics of the ORR and therefore of the cell performance, although severe mass transport
effects were observed in the high current density region due to the thickness of the
catalyst layer. At feasible operating conditions, 40 ºC and operating with air, Pd MEA
(1.0 mg cm-2
) overtook Pt MEA (0.6 mg cm-2
), showing current densities at 0.65 V of
0.14 and 0.12 A cm-2
, respectively.
Pd4Co-EG11-300, presented an increased OCP and smaller kinetic losses compared to the
Pd-EG11 when it was used as cathode material. Overall, the Pd-Co MEA presented
improved performance at 20 and 40 ºC compared to the Pd MEA. Operating with air at
40 ºC current densities at 0.65 V for Pd and PdCo MEAs were 0.13 and 0.21 A cm-2
,
respectively.
Pd/C prepared by reduction by ethylene glycol at pH 11 was also tested as the cathode
catalyst in a high temperature fuel cell and its performance compared to commercial Pt/C.

192
Operating with air at 120 ºC current densities at 0.65 V for Pd and Pt MEAs were 0.04
and 0.09 A cm-2
, respectively. In the temperature range from 120 to 175 ºC the Pt MEA
performance failed to increase due to phosphoric acid properties: decrease of the oxygen
solubility and increase of its viscosity. Pd MEA showed declining performance in the
same temperature range due to instability of palladium nanoparticles in these harsh
operating conditions.

193
References
1. Sakai, T., H. Takenaka, N. Wakabayashi, Y. Kawami, and E. Torikai, Gas
Permeation Properties of Solid Polymer Electrolyte (SPE) Membranes. Journal of
The Electrochemical Society, 1985. 132(6): p. 1328-1332.
2. Broka, K. and P. Ekdunge, Oxygen and hydrogen permeation properties and
water uptake of Nafion® 117 membrane and recast film for PEM fuel cell. Journal
of Applied Electrochemistry, 1997. 27(2): p. 117-124.
3. Steam Tables. Smith son Ian 2006 [cited; Available from: www.knovel.com.
4. Ayad, A., J. Bouet, and J.F. Fauvarque, Comparative study of protonic conducting
polymers incorporated in the oxygen electrode of the PEMFC. Journal of Power
Sources, 2005. 149(1-2): p. 66-71.
5. Mamlouk, M., Investigation of High Temperature Polymer Electrolyte Membrane
Fuel Cells, in Chemical Engineering and Advanced Materials. 2008, Newcastle
University: Newcastle upon Tyne.
6. Broka, K. and P. Ekdunge, Oxygen and hydrogen permeation properties and
water uptake of Nafion® 117 membrane and recast film for PEM fuel cell. Journal
of Applied Electrochemistry, 1997. 27(2): p. 117-123.
7. Conway, B.E. and B.V. Tilak, Interfacial processes involving electrocatalytic
evolution and oxidation of H2, and the role of chemisorbed H. Electrochimica
Acta, 2002. 47(22-23): p. 3571-3594.
8. Mustain, W.E. and J. Prakash, Kinetics and mechanism for the oxygen reduction
reaction on polycrystalline cobalt-palladium electrocatalysts in acid media.
Journal of Power Sources, 2007. 170(1): p. 28-37.
9. Paulus, U.A., T.J. Schmidt, H.A. Gasteiger, and R.J. Behm, Oxygen reduction on
a high-surface area Pt/Vulcan carbon catalyst: a thin-film rotating ring-disk
electrode study. Journal of Electroanalytical Chemistry, 2001. 495(2): p. 134-145.
10. Ficicilar, B., A. Bayrakceken, and I. Eroglu, Effect of Pd loading in Pd-Pt
bimetallic catalysts doped into hollow core mesoporous shell carbon on
performance of proton exchange membrane fuel cells. Journal of Power Sources,
2009. 193(1): p. 17-23.

194
11. Moreira, J., P. del Angel, A.L. Ocampo, P.J. Sebastian, J.A. Montoya, and R.H.
Castellanos, Synthesis, characterization and application of a Pd/Vulcan and Pd/C
catalyst in a PEM fuel cell. International Journal of Hydrogen Energy, 2004.
29(9): p. 915-920.
12. Mustain, W.E., K. Kepler, and J. Prakash, Investigations of carbon-supported
CoPd3 catalysts as oxygen cathodes in PEM fuel cells. Electrochemistry
Communications, 2006. 8(3): p. 406-410.
13. Mustain, W.E., K. Kepler, and J. Prakash, CoPdx oxygen reduction
electrocatalysts for polymer electrolyte membrane and direct methanol fuel cells.
Electrochimica Acta, 2007. 52(5): p. 2102-2108.
14. Jaouen, F., S. Marcotte, J.-P. Dodelet, and G. Lindbergh, Oxygen Reduction
Catalysts for Polymer Electrolyte Fuel Cells from the Pyrolysis of Iron Acetate
Adsorbed on Various Carbon Supports. Journal of Physical Chemistry B, 2003.
107(6): p. 1376-1386.
15. Cabot. [cited; Available from: http://www.cabot-corp.com/Specialty-Carbon-
Blacks.
16. Ma, Y.L., J.S. Wainright, M.H. Litt, and R.F. Savinell, Conductivity of PBI
membranes for high-temperature polymer electrolyte fuel cells. Journal of the
Electrochemical Society, 2004. 151(1).
17. Jeng, K.T., S.F. Lee, G.F. Tsai, and C.H. Wang, Oxygen mass transfer in PEM fuel
cell gas diffusion layers. Journal of Power Sources, 2004. 138(1-2): p. 41-50.
18. Mamlouk, M. and K. Scott, Phosphoric acid-doped electrodes for a PBI polymer
membrane fuel cell. International Journal of Energy Research, 2010.
19. Parthasarathy, A., C.R. Martin, and S. Srinivasan, Investigations of the O2
reduction reaction at the platinum Nafion interface using a solid-state
electrochemical cell. Journal of The Electrochemical Society, 1991. 138(4): p.
916-921.
20. McBreen, J., W.E.O. Grady, and R. Richter, A Rotating Disk Electrode Apparatus
for the Study of Fuel Cell Reactions at Elevated Temperatures and Pressures.
Journal of the Electrochemical Society, 1984. 131(5): p. 1215-1216.
21. Mamlouk, M. and K. Scott, The effect of electrode parameters on performance of
a phosphoric acid-doped PBI membrane fuel cell. International Journal of
Hydrogen Energy. 35(2): p. 784-793.
195
22. Klinedinst, K., J.A.S. Bett, J. Macdonald, and P. Stonehart, Oxygen solubility and
diffusivity in hot concentrated H3PO4. Journal of Electroanalytical Chemistry,
1974. 57(3): p. 281-289.
23. Ma, Y.L., The Fundamental Studies of Polybenzimidazole/Phosphoric Acid
Polymer Electrolyte For Fuel Cells, in Case Western Reserve University. 2004.
24. Stonehart, P., Development of alloy electrocatalysts for phosphoric acid fuel cells
(PAFC). Journal of Applied Electrochemistry, 1992. 22(11): p. 995-1001.
25. Stonehart, P., ldquoDevelopment of Advanced Noble Metal-Alloy Electrocatalysts
for Phosphoric Acid Fuel Cells (PAFC)rdquo. Berichte der Bunsengesellschaft für
physikalische Chemie, 1990. 94(9): p. 913-921.
196
Chapter 7: Direct methanol fuel cell
7.1. Introduction
Optimized carbon-supported palladium catalyst, Pd-EG11, was considered as a candidate
because of its high activity towards oxygen reduction. Pd-EG11 was tested as a cathode
catalyst in a direct methanol fuel cell. Cell performance with Pd/C in the cathode was
compared with the performance when using commercial Pt/C as cathode catalyst. Cell
potentials at low current densities were compared (5 mA cm-2
) and current densities at
400 mV were chosen for the purpose. A constant methanol flow rate of 7 mL min-1
was
used in every test; this flow rate was chosen for being the optimum for 1M methanol [1].
The effect of methanol concentration on cell performance was studied using methanol
solutions of 1 to 7 M. Temperature was studied in the range of 20, 40 and 60 ºC.
Measured exchange current densities at room temperature for the oxygen reduction
reaction (ORR) on platinum and palladium electrodes were 1.4 x 10⁻¹⁰
and 7.7 X 10⁻¹²
A
cm-2
metal (Chapter 4). Considering the activation energy of the oxygen reduction reaction
on Pd/C, ca. 90 KJ mol-1
[2], and on Pt/C, ca. 26 KJ mol-1
[3], the exchange current
density for ORR at 50 ºC on platinum can be estimated to be 3.2 x 10⁻¹⁰
in comparison to
1.3 x 10⁻¹⁰
A cm-2
ESA for palladium. In other words, at 50 ºC platinum is 2.5 times more
active than palladium for ORR. On the other hand, the exchange current density for the
methanol oxidation reaction (MOR) at 50 ºC is reported [4] to be ca. 3 x 10⁻⁸
A.cm-2
metal
on platinum and ca. 10-11
A.cm-2
metal on palladium. This means at 50 ºC platinum is
approximately 3000 times more active than palladium for the methanol oxidation
reaction. Calculating the ratio of i0(MOR)/i0(ORR) for both catalyst at 50 ºC, we obtain ca.
100 and 0.1 for Pt and Pd, respectively. This suggests that platinum is approximately 100
times more active (o more selective) for methanol oxidation than for oxygen reduction,
and therefore the effects of any crossed-over methanol would be severe. On the contrary,
palladium is approximately 10 times less active for MOR in comparison to ORR, thus

197
palladium is a more selective catalyst for ORR than MOR. Therefore it can be concluded
that palladium is a good candidate for methanol fuel cell cathodes (DMFCs) especially at
higher methanol concentration and higher operating temperatures.
7.2. Effect of methanol concentration on fuel cell performance
7.2.1. Cell polarizations
Figure 7-1, Figure 7-2 and Figure 7-3 compare potential-current curves for the palladium
electrocatalyst and commercial Pt/C cathode materials using 1M methanol fed to the
cathode at 20, 40 and 60 ºC, respectively, operating with air and oxygen. The discussion
of the experimental data is mainly focused on the low current density region because it is
the region where the effect of methanol crossover is more evident and because fuel cells
would be ideally operating in this range, at high efficiency.
0
100
200
300
400
500
600
700
800
900
0 20 40 60 80 100
E / m
V
i / mA cm-2
Pt 20ºC oxygen 1M
Pt 20ºC air 1M
Pd 20ºC oxygen 1M
Pd 20ºC air 1M
Figure 7-1: Comparison of polarization curves of a direct methanol fuel cell with Pd/C and
commercial Pt/C from E-tek as cathode catalyst at 20 ºC and 1M methanol.

198
0
100
200
300
400
500
600
700
800
900
0 50 100 150 200
E / m
V
i / mA cm-2
Pt 40ºC oxygen 1M
Pt 40ºC air 1M
Pd 40ºC oxygen 1M
Pd 40ºC air 1M
Figure 7-2: Comparison of polarization curves of a direct methanol fuel cell with Pd/C and
commercial Pt/C from E-tek as cathode catalyst at 40 ºC and 1M methanol.
0
100
200
300
400
500
600
700
800
900
0 50 100 150 200 250 300
E / m
V
i / mA cm-2
Pt 60ºC oxygen 1M
Pt 60ºC air 1M
Pd 60C oxygen 1M
Pd 60ºC air 1M

199
Figure 7-3: Comparison of polarization curves of a direct methanol fuel cell with Pd/C and
commercial Pt/C from E-tek as cathode catalyst at 60 ºC and 1M methanol.
Cell voltages at 5 mA cm-2
in different conditions, summarised in Table 7-1, were larger
for the Pt MEA in every case. The difference in cell voltage between Pt and Pd MEAs
was similar when the cell was operating with air or oxygen. For example, at 20 ºC the
difference was 116 mV for air and 107 mV for oxygen, decreasing to 88 mV for air and
81 mV for oxygen at 40 ºC and 67 mV for air and 63 mV for oxygen at 60 ºC. This
tendency was also observed at higher current densities; comparing cell potentials at 20
mA cm-2
, at 20 ºC the difference between Pt and Pd was 188 mV for air and 187 mV for
oxygen, decreasing to 124 mV for air both air and oxygen at 40 ºC and 95 mV for air and
101 mV for oxygen at 60 ºC. The decreasing difference with increasing temperature
between Pd and Pt cell potentials at low current densities would indicate that the
activation energy of the oxygen reduction reaction on Pd is higher than on Pt; which was
already shown for hydrogen PEM fuel cells (chapter 6).
Table 7-1: Current densities at 0.4 V, cell voltage at 5 mA cm-2
and peak power densities for a
direct methanol fuel cell with 1 M methanol solution fed to the anode.
Cathode
catalyst
Temperature
( ºC)
Cathode
fed
Voltage at
5 mA cm-2
(mV)
Current
density
at 0.4 V (mA
cm-2
)
Peak power
density
(mW cm-2
)
Pd-EG11 20 Air 335 3.0 2.3
Pt/C-Etek 20 Air 451 8.2 6.4
Pd-EG11 20 O2 390 4.5 3.4
Pt/C-Etek 20 O2 497 13.8 10.0
Pd-EG11 40 Air 448 7.6 5.4
Pt/C-Etek 40 Air 536 16.8 13.2
Pd-EG11 40 O2 482 10.0 6.9
Pt/C-Etek 40 O2 563 25.5 17.0
Pd-EG11 60 Air 500 12.8 8.3
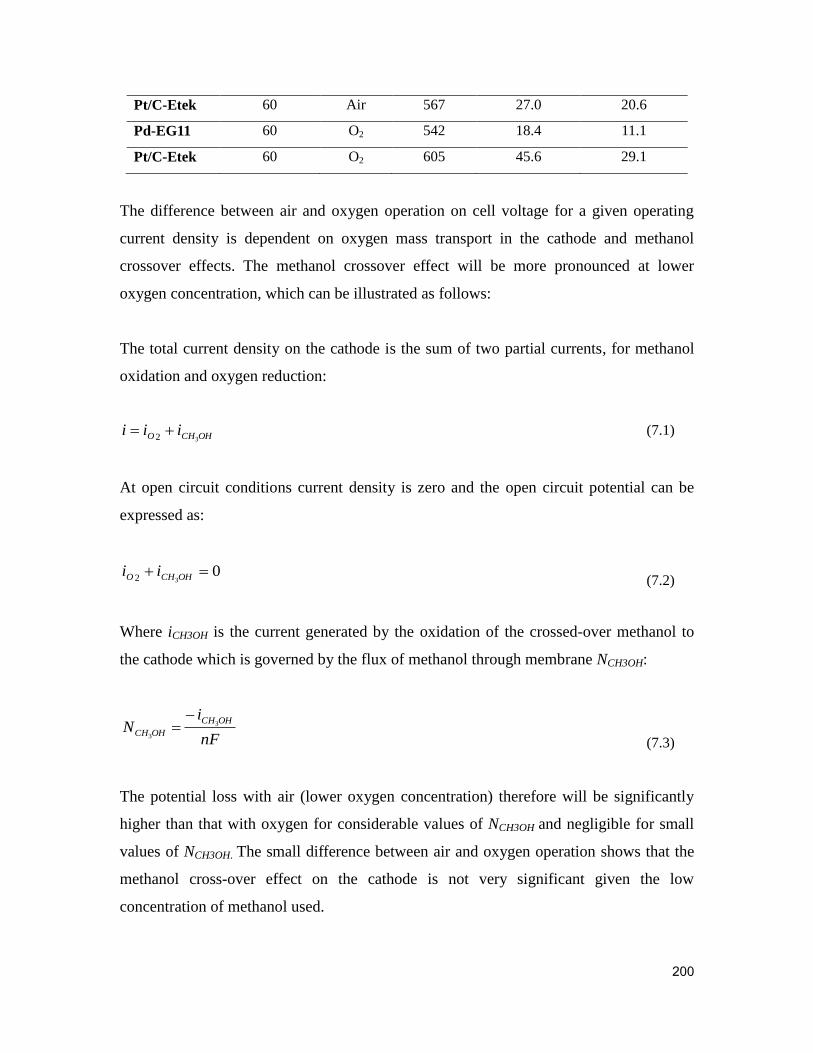
200
Pt/C-Etek 60 Air 567 27.0 20.6
Pd-EG11 60 O2 542 18.4 11.1
Pt/C-Etek 60 O2 605 45.6 29.1
The difference between air and oxygen operation on cell voltage for a given operating
current density is dependent on oxygen mass transport in the cathode and methanol
crossover effects. The methanol crossover effect will be more pronounced at lower
oxygen concentration, which can be illustrated as follows:
The total current density on the cathode is the sum of two partial currents, for methanol
oxidation and oxygen reduction:
OHCHO iii32
(7.1)
At open circuit conditions current density is zero and the open circuit potential can be
expressed as:
032
OHCHO ii (7.2)
Where iCH3OH is the current generated by the oxidation of the crossed-over methanol to
the cathode which is governed by the flux of methanol through membrane NCH3OH:
nF
iN
OHCH
OHCH3
3
(7.3)
The potential loss with air (lower oxygen concentration) therefore will be significantly
higher than that with oxygen for considerable values of NCH3OH and negligible for small
values of NCH3OH. The small difference between air and oxygen operation shows that the
methanol cross-over effect on the cathode is not very significant given the low
concentration of methanol used.

201
No reports for pure Pd cathodes in direct methanol fuel cells were found in the literature;
however some palladium alloys have been tested as cathode materials in DMFC. Mustain
et al. tested a DMFC with a Pd3Co cathode and Pt anode at 60 ºC operating with oxygen
and 0.5M methanol solution [5]. They observed current densities of ca. 20 mA cm-2
in
these conditions, close to the 18 mA cm-2
exhibited with Pd-EG11 with 1M methanol.
Figure 7-4 and Figure 7-5 show cell polarization curves for a DMFC with Pd and Pt
cathode catalysts fed with 3M methanol solution, operating with air and oxygen,
respectively. The performance with Pd as with Pt cathodes improved significantly with an
increase in temperature. The performance of the Pd MEA improved more with
temperature increase than Pt when operating with air or oxygen due to combined effect of
larger activation energy and higher methanol tolerance (methanol permeability increases
with temperature).
0
100
200
300
400
500
600
700
800
900
0 50 100 150 200 250 300
E /
mV
i / mA cm-2
Pt 20ºC
Pt 40ºC
Pt 60ºC
Pd 20ºC
Pd 40ºC
Pd 60ºC
Figure 7-4: Comparison of polarization curves of a direct methanol fuel cell operating with air
and 3M methanol with Pd/C and commercial Pt/C from E-tek as cathode catalyst at 20, 40 and 60
ºC.
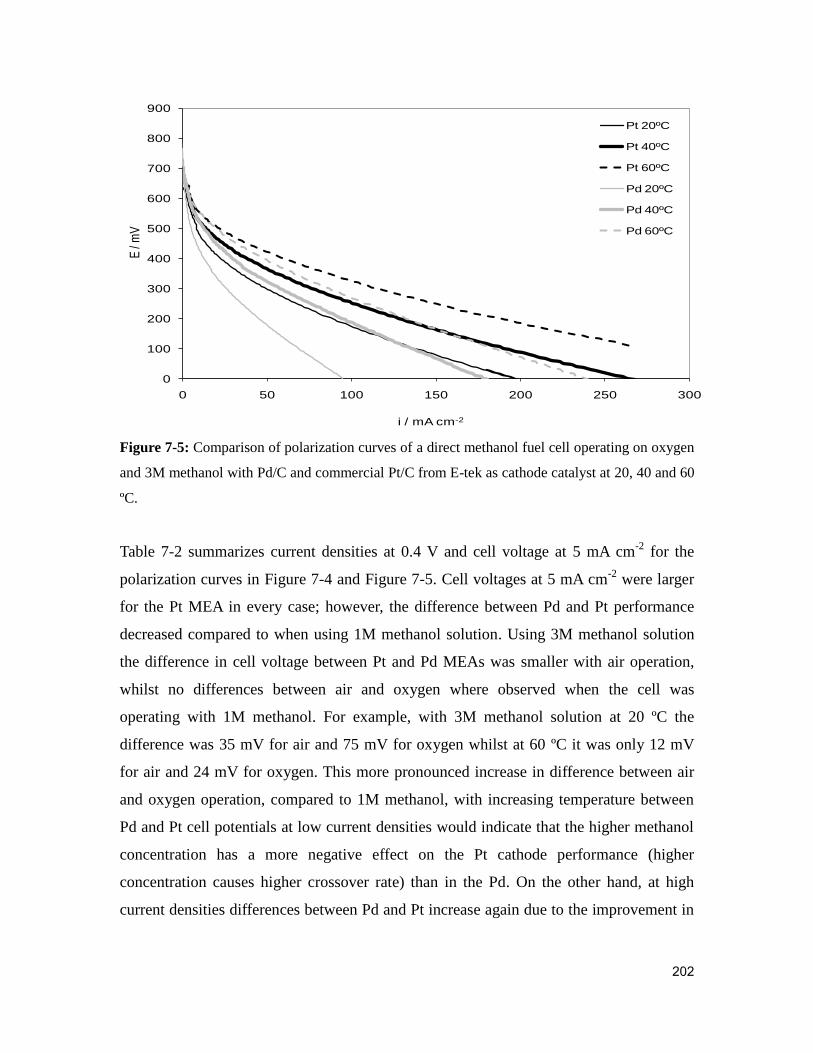
202
0
100
200
300
400
500
600
700
800
900
0 50 100 150 200 250 300
E /
mV
i / mA cm-2
Pt 20ºC
Pt 40ºC
Pt 60ºC
Pd 20ºC
Pd 40ºC
Pd 60ºC
Figure 7-5: Comparison of polarization curves of a direct methanol fuel cell operating on oxygen
and 3M methanol with Pd/C and commercial Pt/C from E-tek as cathode catalyst at 20, 40 and 60
ºC.
Table 7-2 summarizes current densities at 0.4 V and cell voltage at 5 mA cm-2
for the
polarization curves in Figure 7-4 and Figure 7-5. Cell voltages at 5 mA cm-2
were larger
for the Pt MEA in every case; however, the difference between Pd and Pt performance
decreased compared to when using 1M methanol solution. Using 3M methanol solution
the difference in cell voltage between Pt and Pd MEAs was smaller with air operation,
whilst no differences between air and oxygen where observed when the cell was
operating with 1M methanol. For example, with 3M methanol solution at 20 ºC the
difference was 35 mV for air and 75 mV for oxygen whilst at 60 ºC it was only 12 mV
for air and 24 mV for oxygen. This more pronounced increase in difference between air
and oxygen operation, compared to 1M methanol, with increasing temperature between
Pd and Pt cell potentials at low current densities would indicate that the higher methanol
concentration has a more negative effect on the Pt cathode performance (higher
concentration causes higher crossover rate) than in the Pd. On the other hand, at high
current densities differences between Pd and Pt increase again due to the improvement in

203
the Pt cathode performance caused by the consumption of the crossed-over methanol
when the cell is polarized [6] discussed further in this chapter (Section 6.2).
Table 7-2: Current densities at 0.4 V, cell voltage at 5 mA cm-2
and peak power densities for a
direct methanol fuel cell with 3M methanol solution fed to the anode at 20, 40 and 60 ºC.
Cathode
catalyst
Temperature
( ºC)
Cathode
fed
Voltage at
5 mA cm-2
(mV)
Current
density
at 0.4 V
(mA cm-2
)
Peak power
density
(mW cm-2
)
Pd-EG11 20 Air 455 8.7 6.2
Pt/C-Etek 20 Air 490 14.8 14.2
Pd-EG11 20 O2 472 9.4 6.9
Pt/C-Etek 20 O2 547 22.2 17.6
Pd-EG11 40 Air 485 11.5 9.3
Pt/C-Etek 40 Air 514 23 26.6
Pd-EG11 40 O2 503 14.5 10.3
Pt/C-Etek 40 O2 590 38 25.8
Pd-EG11 60 Air 507 16.7 19.1
Pt/C-Etek 60 Air 519 26.4 25.7

204
Pd-EG11 60 O2 566 40 26
Pt/C-Etek 60 O2 590 59.4 37.8
Figure 7-6 and Figure 7-7 show polarization curves for a DMFC with Pd and Pt cathode
catalysts fed with 5M methanol solution, operating with air and oxygen, respectively.
When 5M methanol was fed to the anode the advantage of using Pd instead of Pt in the
cathode, with lower activity towards the methanol oxidation reaction, became evident.
DMFC would be ideally operating at 60 ºC or higher, to enhance both anode and cathode
reactions, and with air at atmospheric pressure, to reduce operating cost and energy
consumption. On these operating conditions Pd advantaged Pt as cathode catalyst.
0
100
200
300
400
500
600
700
800
900
0 50 100 150 200 250 300
E /
mV
i / mA cm-2
Pt 20ºC
Pt 40ºC
Pt 60ºC
Pd 20ºC
Pd 40ºC
Pd 60ºC
Figure 7-6: Comparison of polarization curves of a direct methanol fuel cell operating with air
and 5M methanol with Pd/C and commercial Pt/C from E-tek as cathode catalyst at 20, 40 and 60
ºC.

205
0
100
200
300
400
500
600
700
800
900
0 50 100 150 200 250 300
E /
mV
i / mA cm-2
Pt 20ºC
Pt 40ºC
Pt 60ºC
Pd 20ºC
Pd 40ºC
Pd 60ºC
Figure 7-7: Comparison of polarization curves of a direct methanol fuel cell operating with
oxygen and 5M methanol with Pd/C and commercial Pt/C from E-tek as cathode catalyst at 20,
40 and 60 ºC.
At low current densities with 5M methanol the palladium MEA exhibited slightly
enhanced performance with increasing temperature with both oxygen and air, as
expected. However, the performance of the Pt MEA only increased with the temperature
operating with oxygen; with air current densities decreased in the kinetic region when the
temperature was raised from 40 to 60 ºC. At 5 mA cm-2
with air operation at 20, 40 and
60 ºC cell potentials for the Pd MEA were virtually identical to those corresponding to
the Pt MEA. However, with oxygen operation Pt exhibited slightly higher cell potentials
than Pd at 20, 40 and 60 ºC (42, 26 and 29 mV). On the other hand, at larger current
densities, larger than ca. 20 mA cm-2
, the Pt MEA also showed improved performance
with the temperature. This effect is caused, as discussed for the 3M methanol solution, by
the methanol crossed-over to the cathode, which decreases the cathode performance at
low current densities but is consumed during the polarization decreasing this way its
effect as the current density increases.
Table 7-3: Current densities at 0.4 V, cell voltage at 5 mA cm-2
and peak power densities for a
direct methanol fuel cell with 5M methanol solution fed to the anode at 20, 40 and 60 ºC.

206
Cathode
catalyst
Temperature
( ºC)
Cathode
fed
Voltage at
5 mA cm-2
(mV)
Current
density
at 0.4 V
(mA cm-2
)
Peak power
density
(mW cm-2
)
Pd-EG11 20 Air 498 14 11.5
Pt/C-Etek 20 Air 497 14.5 14.9
Pd-EG11 20 O2 510 28.7 26.5
Pt/C-Etek 20 O2 562 26.2 20.3
Pd-EG11 40 Air 505 18 15.3
Pt/C-Etek 40 Air 514 24 26.6
Pd-EG11 40 O2 540 35.1 22
Pt/C-Etek 40 O2 566 36.3 26
Pd-EG11 60 Air 507 25.2 20.6
Pt/C-Etek 60 Air 508 19.6 19
Pd-EG11 60 O2 559 43.8 30
Pt/C-Etek 60 O2 588 65.1 40.5
At 60 ºC and with air fed to the cathode (suitable operating conditions for a DMFC)
current density using Pt in the cathode decreased from 26 to 20 mA cm-2
when methanol
concentration was increased from 3 to 5M. The opposite effect was exhibited by the MEA
with Pd in the cathode, which performance was enhanced from 17 to 25 mA cm-2
.
Figures 7-8 and 7-9 compare polarization curves of Pd and Pt MEAs at 60 ºC using
methanol concentrations of 3, 5 and 7 M using air and oxygen, respectively. When the
cell was operating with air, platinum exhibited a small decrease in current density when
changing from methanol 1M to 3M to 5M (from 27 to 26 to 20 mA cm-2
at 400 mV) and
its performance fell sharply with a concentration of 7 M; to 5 mA cm-2
. However, when
the platinum MEA was operated with oxygen, the current density increased by 12.5 and 6
mA cm-2
at 400 mV when changing from 1M to 3M and from 3M to 5M, respectively.
While with O2 the current density decreased at 7M less dramatically than air (from 65 to
50 mA cm-2
). The overall cell performance is a balance between improved anode kinetics
and greater methanol crossover causing greater cathode losses, when methanol feed

207
concentration is increased. The cross-over influence is more evident with air due to the
lower O2 concentration as discussed earlier.
0
100
200
300
400
500
600
700
800
0 50 100 150 200 250 300
E /
mV
i / mA cm-2
Pt 3M
Pt 5M
Pt 7M
Pd 3M
Pd 5M
Pd 7M
Figure 7-8: Comparison of polarization curves of a direct methanol fuel cell operating with air
with Pd/C and commercial Pt/C from E-tek as cathode catalyst at 60 ºC and 3, 5 and 7M
methanol.
0
100
200
300
400
500
600
700
800
0 50 100 150 200 250 300
E /
mV
i / mA cm-2
Pt 3M
Pt 5M
Pt 7M
Pd 3M
Pd 5M
Pd 7M
Figure 7-9: Comparison of polarization curves of a direct methanol fuel cell operating with
oxygen with Pd/C and commercial Pt/C from E-tek as cathode catalyst at 60 ºC and 3, 5 and 7M
methanol.

208
Table 7-4: Current densities at 0.4 V, cell voltage at 5 mA cm-2
and peak power densities for a
direct methanol fuel cell with 3, 5 and 7M methanol solution fed to the anode at 60 ºC.
Cathode
catalyst
Methanol
concentration
(mol L-1
)
Cathode
fed
Voltage at
5 mA cm-2
(mV)
Current
density
at 0.4 V
(mA cm-2
)
Peak power
density
(mW cm-2
)
Pd-EG11 3 Air 503 14.7 19.1
Pt/C-Etek 3 Air 519 26.4 25.7
Pd-EG11 3 O2 566 40 26
Pt/C-Etek 3 O2 590 59.4 37.8
Pd-EG11 5 Air 507 25.2 20.6
Pt/C-Etek 5 Air 508 19.6 19
Pd-EG11 5 O2 559 43.8 30
Pt/C-Etek 5 O2 588 65.1 40.5
Pd-EG11 7 Air 503 24.9 17.2
Pt/C-Etek 7 Air 400 5.0 12.8
Pd-EG11 7 O2 558 44.6 30.9
Pt/C-Etek 7 O2 556 50.1 38.5
7.2.2. Cathode polarizations
The amount of methanol crossing from anode to cathode through the electrolyte
membrane (methanol cross-over) in a DMFC, increases with increasing methanol
concentration and temperature. The presence of methanol in the cathode decreases its
performance by hindering the access of the oxygen molecules to the catalyst sites and, in
some cases, by the “mixed potential” effect [7]. On the other hand, methanol oxidation
reaction improves with increasing methanol concentration and temperature. Therefore the
overall cell performance is a balance of the two factors. In this section the influence of
the methanol concentration on the cathode performance was studied at 60 ºC.
Cathode polarization curves were obtained by adding cell (operating with oxygen) and
anode potential-current curves; since a cell potential-current curve can be obtained by

209
subtracting the anode from the cathode polarization curve [8]. To record anodic
polarization curves H2 flowed through the cathode, this way the latter behaves like a
Normal Hydrogen Electrode (NHE) [7]. The obtained cathode data were IR-free since the
anode data inherently includes the IR losses in it. Figure 7-10 shows anode polarization
curves at 60 ºC with different methanol concentrations fed to the anode. Anodic current
densities increased as expected with increasing methanol concentration. Currents
densities produced by the anode at 400 mV and 60 ºC for 1, 3, 5 and 7M methanol
concentration were 23.2, 26.1, 30.2 and 38.5 mA cm-2
, respectively.
0
100
200
300
400
500
600
700
800
0 50 100 150 200 250 300
E /
mV
i / mA cm-2
1M
3M
5M
7M
Figure 7-10: Anode polarization curves for a fuel cell with PtRu/C from E-tek anode catalyst
and Pd-EG11 cathode catalyst at 60 ºC fed with methanol 1, 3, 5 and 7M with air operation.
These anode polarization curves demonstrated how anode performance increased with
fuel concentration. However this does not apply to the overall cell performance mainly
due to the effect of methanol crossover. There is an optimum methanol concentration at
which the cell would exhibit its maximum performance. This optimum methanol
concentration depends on various parameters, including temperature and cathode catalyst.
Ko et al. built a dynamic model to study the influence of different parameters on cell
performance, and according to their model, the optimal methanol concentration using

210
Pt/C in the cathode and at 60 ºC was ca. 1M [9]. Since the activity of Pd/C towards the
methanol oxidation reaction is lower than that of Pt/C, the optimal methanol
concentration when using Pd/C as cathode material is expected to be higher.
Figure 7-11 shows cathode polarization curves for the Pt MEA at different methanol
concentration. Data is compared to polarization curves, in the corresponding current
range, obtained from a hydrogen PEM fuel cell. Cathode polarization curves with 1, 3
and 5M methanol solution exhibited a raising potential with increasing current densities;
this behavior is attributed to the improvement of cell performance with the oxidation of
the methanol present in the cathode (methanol crossed-over is oxidized when the cell is
polarized), as discussed in the work of Gurau et al. [6]. Using 7M methanol there was a
sharp decrease in the rest potential (i = 0), of approximately 150 mV, compared to 5M. A
great decrease at low current densities (10 mA cm-2
), of ca. 150 mV, in the cathode
potential was observed when the methanol concentration was further increased to 7M.
This confirms the decreased cathode performance with increased methanol concentration.
0
100
200
300
400
500
600
700
800
900
1,000
0.0 20.0 40.0 60.0 80.0 100.0
E /
V (v
s N
HE
)
i / mA cm-2
Pt 60C air 7M
Pt 60C air 5M
Pt 60C air 3M
Pt 60C air 1M
Pt PEM 0.6 mg
Pt PEM 2.0 mg
Figure 7-11: Cathode polarization curves for Pt MEA for a DMFC at 60 ºC fed with 1, 3, 5 and
7M methanol solution with air operation compared to experimental (0.6 mg) and predicted (2.0
mg) data from a H2 PEM fuel cell.
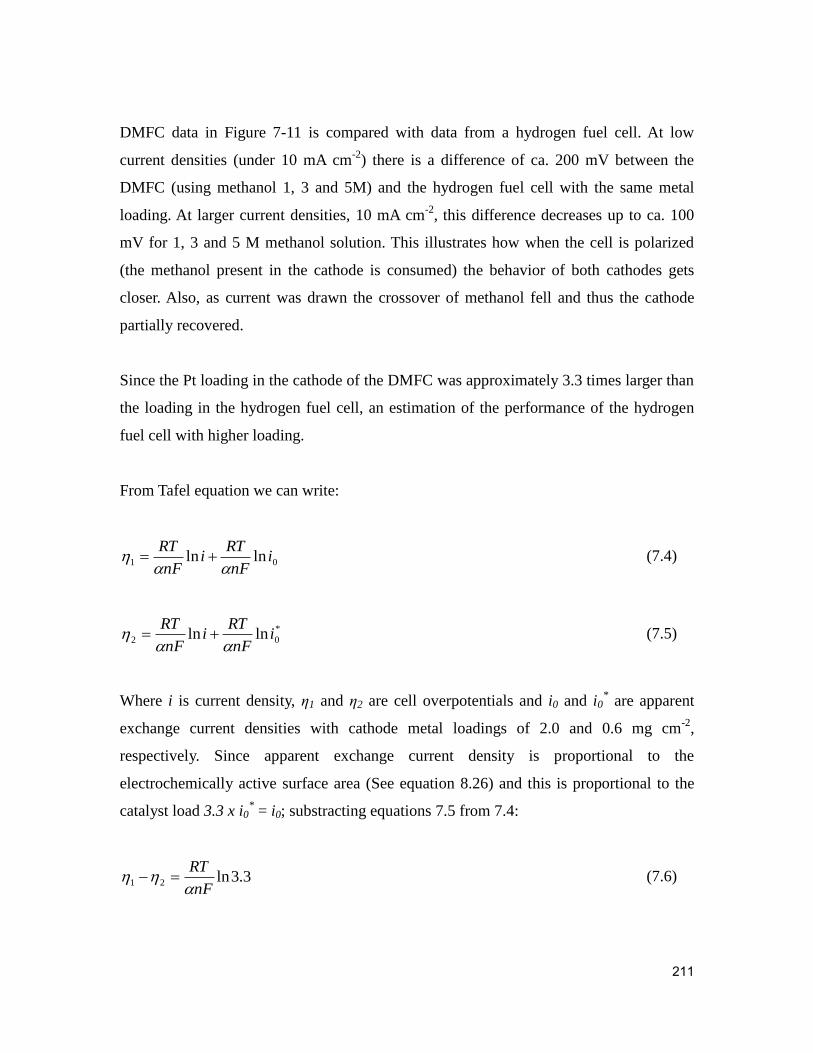
211
DMFC data in Figure 7-11 is compared with data from a hydrogen fuel cell. At low
current densities (under 10 mA cm-2
) there is a difference of ca. 200 mV between the
DMFC (using methanol 1, 3 and 5M) and the hydrogen fuel cell with the same metal
loading. At larger current densities, 10 mA cm-2
, this difference decreases up to ca. 100
mV for 1, 3 and 5 M methanol solution. This illustrates how when the cell is polarized
(the methanol present in the cathode is consumed) the behavior of both cathodes gets
closer. Also, as current was drawn the crossover of methanol fell and thus the cathode
partially recovered.
Since the Pt loading in the cathode of the DMFC was approximately 3.3 times larger than
the loading in the hydrogen fuel cell, an estimation of the performance of the hydrogen
fuel cell with higher loading.
From Tafel equation we can write:
01 lnln inF
RTi
nF
RT
(7.4)
*
02 lnln inF
RTi
nF
RT
(7.5)
Where i is current density, η1 and η2 are cell overpotentials and i0 and i0* are apparent
exchange current densities with cathode metal loadings of 2.0 and 0.6 mg cm-2
,
respectively. Since apparent exchange current density is proportional to the
electrochemically active surface area (See equation 8.26) and this is proportional to the
catalyst load 3.3 x i0* = i0; substracting equations 7.5 from 7.4:
3.3ln21nF
RT
(7.6)
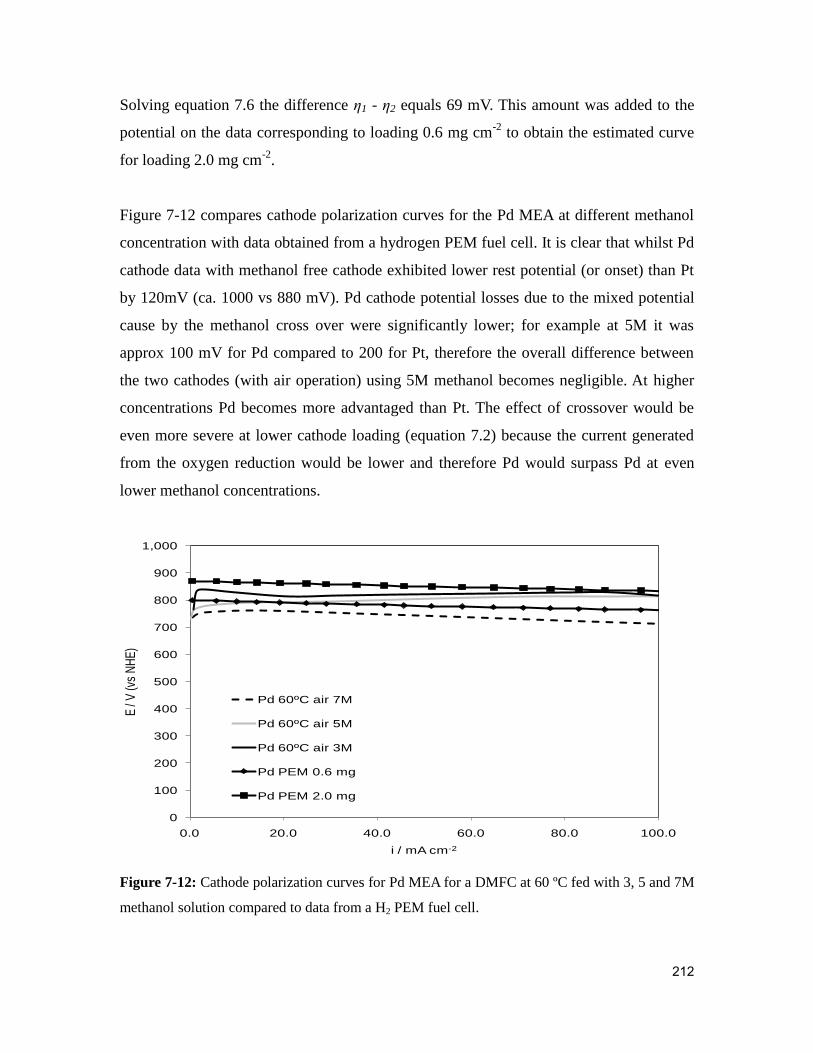
212
Solving equation 7.6 the difference η1 - η2 equals 69 mV. This amount was added to the
potential on the data corresponding to loading 0.6 mg cm-2
to obtain the estimated curve
for loading 2.0 mg cm-2
.
Figure 7-12 compares cathode polarization curves for the Pd MEA at different methanol
concentration with data obtained from a hydrogen PEM fuel cell. It is clear that whilst Pd
cathode data with methanol free cathode exhibited lower rest potential (or onset) than Pt
by 120mV (ca. 1000 vs 880 mV). Pd cathode potential losses due to the mixed potential
cause by the methanol cross over were significantly lower; for example at 5M it was
approx 100 mV for Pd compared to 200 for Pt, therefore the overall difference between
the two cathodes (with air operation) using 5M methanol becomes negligible. At higher
concentrations Pd becomes more advantaged than Pt. The effect of crossover would be
even more severe at lower cathode loading (equation 7.2) because the current generated
from the oxygen reduction would be lower and therefore Pd would surpass Pd at even
lower methanol concentrations.
0
100
200
300
400
500
600
700
800
900
1,000
0.0 20.0 40.0 60.0 80.0 100.0
E /
V (v
s N
HE
)
i / mA cm-2
Pd 60ºC air 7M
Pd 60ºC air 5M
Pd 60ºC air 3M
Pd PEM 0.6 mg
Pd PEM 2.0 mg
Figure 7-12: Cathode polarization curves for Pd MEA for a DMFC at 60 ºC fed with 3, 5 and 7M
methanol solution compared to data from a H2 PEM fuel cell.
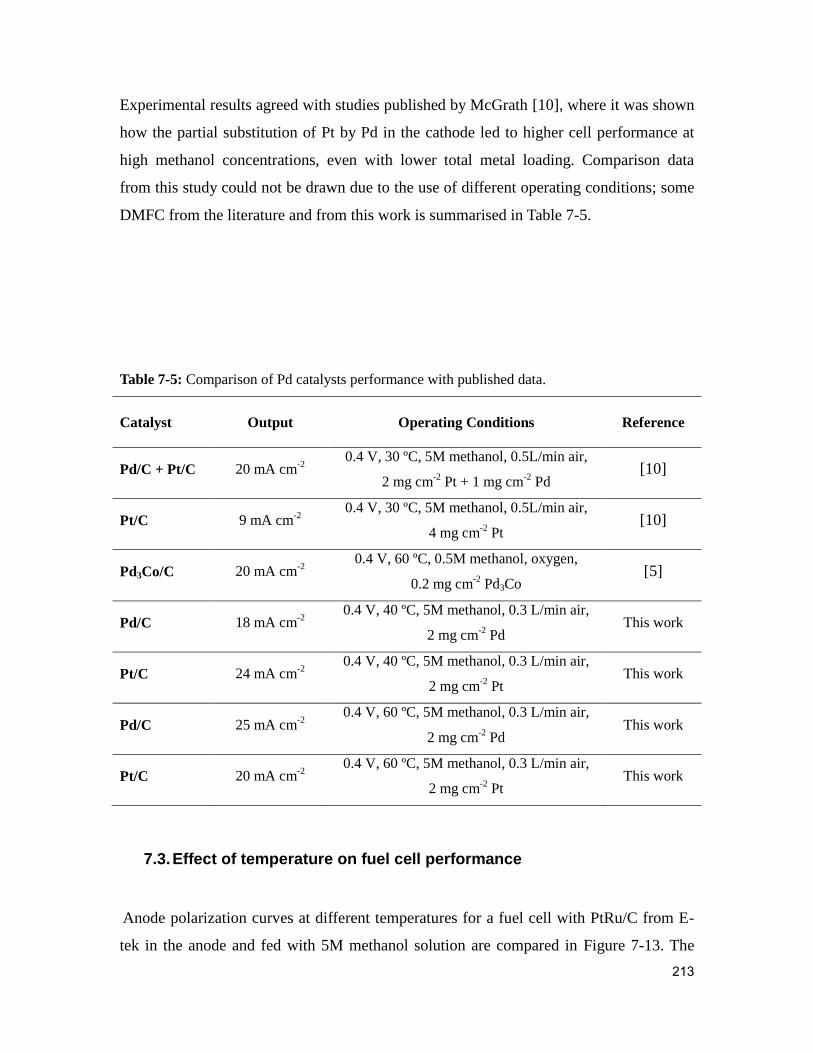
213
Experimental results agreed with studies published by McGrath [10], where it was shown
how the partial substitution of Pt by Pd in the cathode led to higher cell performance at
high methanol concentrations, even with lower total metal loading. Comparison data
from this study could not be drawn due to the use of different operating conditions; some
DMFC from the literature and from this work is summarised in Table 7-5.
Table 7-5: Comparison of Pd catalysts performance with published data.
Catalyst
Output
Operating Conditions
Reference
Pd/C + Pt/C 20 mA cm-2
0.4 V, 30 ºC, 5M methanol, 0.5L/min air,
2 mg cm-2
Pt + 1 mg cm-2
Pd [10]
Pt/C 9 mA cm-2
0.4 V, 30 ºC, 5M methanol, 0.5L/min air,
4 mg cm-2
Pt [10]
Pd3Co/C 20 mA cm-2
0.4 V, 60 ºC, 0.5M methanol, oxygen,
0.2 mg cm-2
Pd3Co [5]
Pd/C 18 mA cm-2
0.4 V, 40 ºC, 5M methanol, 0.3 L/min air,
2 mg cm-2
Pd This work
Pt/C 24 mA cm-2
0.4 V, 40 ºC, 5M methanol, 0.3 L/min air,
2 mg cm-2
Pt This work
Pd/C 25 mA cm-2
0.4 V, 60 ºC, 5M methanol, 0.3 L/min air,
2 mg cm-2
Pd This work
Pt/C 20 mA cm-2
0.4 V, 60 ºC, 5M methanol, 0.3 L/min air,
2 mg cm-2
Pt This work
7.3. Effect of temperature on fuel cell performance
Anode polarization curves at different temperatures for a fuel cell with PtRu/C from E-
tek in the anode and fed with 5M methanol solution are compared in Figure 7-13. The

214
increase of temperature increased the anode performance by increasing the kinetics of the
methanol oxidation reaction. Anodic currents at 400 mV at 20, 40 and 60 ºC were 10.2,
17.8 and 30.2 mA cm-2
, respectively.
0
100
200
300
400
500
600
700
800
0 20 40 60 80 100 120 140 160 180 200
E /
mV
i / mA cm-2
20ºC
40ºC
60ºC
Figure 7-13: Anode polarization curves for a fuel cell with PtRu/C from E-tek anode catalyst
and Pd-EG11 cathode catalyst at 20, 40 and 60 ºC fed with methanol 5M.
Anode performance increased with temperature; however, with an increase in
temperature methanol crossover to the cathode may increase due to faster diffusion. The
dependence of methanol permeability on temperature through Nafion® has been reported
to follow Arrhenius behavior: for Nafion® 117 at 20, 40 and 60 ºC values were ca. 14 x
10-7
, 22 x 10-7
and 34 x 10-7
cm2 s
-1, respectively [11]. A greater crossover rate when the
temperature was increased from 40 to 60 ºC is the main cause of the lack of significant
increase in cell performance with temperature at low current densities.
Figure 7-14 shows cathode polarization curves for the Pt MEA fed with 5M methanol
solution at 20, 40 and 60 ºC. The highest cathode potential at low current densities (10
mA cm-2
) was exhibited at 20 ºC, ca. 830 mV, and remained constant up to 100 mA cm-2
.
When the temperature was raised to 40 ºC, the cathode potential at low current densities
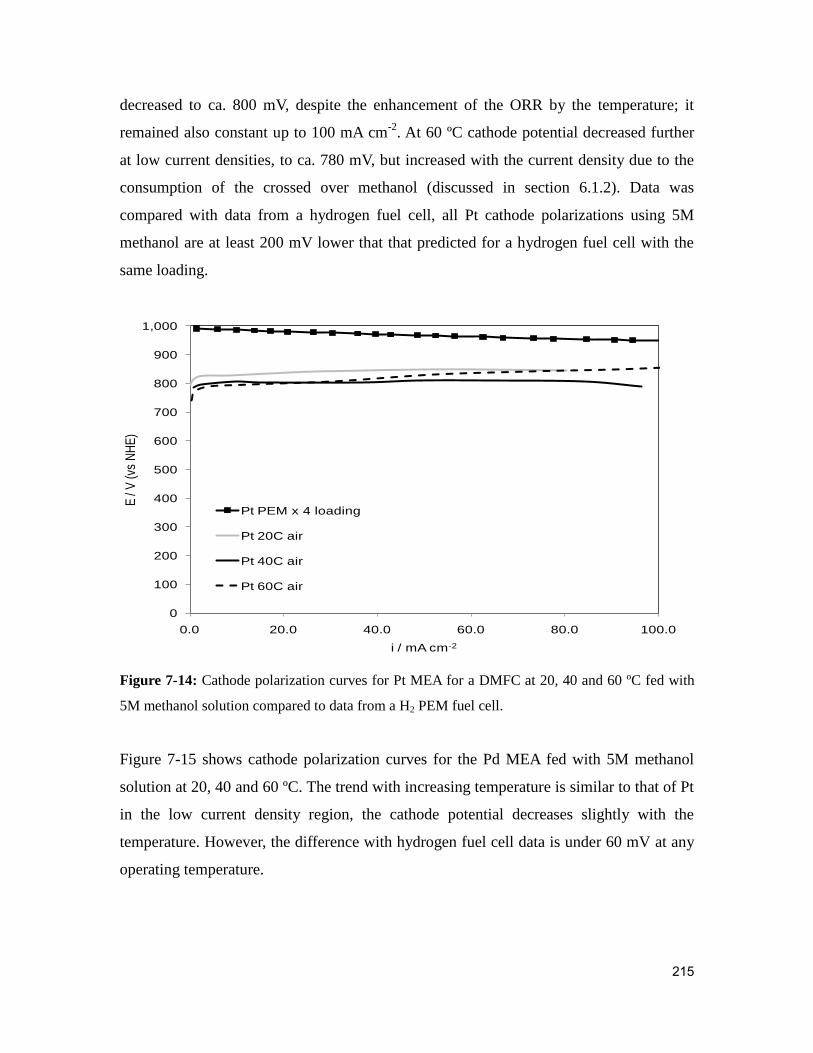
215
decreased to ca. 800 mV, despite the enhancement of the ORR by the temperature; it
remained also constant up to 100 mA cm-2
. At 60 ºC cathode potential decreased further
at low current densities, to ca. 780 mV, but increased with the current density due to the
consumption of the crossed over methanol (discussed in section 6.1.2). Data was
compared with data from a hydrogen fuel cell, all Pt cathode polarizations using 5M
methanol are at least 200 mV lower that that predicted for a hydrogen fuel cell with the
same loading.
0
100
200
300
400
500
600
700
800
900
1,000
0.0 20.0 40.0 60.0 80.0 100.0
E /
V (
vs N
HE
)
i / mA cm-2
Pt PEM x 4 loading
Pt 20C air
Pt 40C air
Pt 60C air
Figure 7-14: Cathode polarization curves for Pt MEA for a DMFC at 20, 40 and 60 ºC fed with
5M methanol solution compared to data from a H2 PEM fuel cell.
Figure 7-15 shows cathode polarization curves for the Pd MEA fed with 5M methanol
solution at 20, 40 and 60 ºC. The trend with increasing temperature is similar to that of Pt
in the low current density region, the cathode potential decreases slightly with the
temperature. However, the difference with hydrogen fuel cell data is under 60 mV at any
operating temperature.
216
0
100
200
300
400
500
600
700
800
900
1,000
0.0 20.0 40.0 60.0 80.0 100.0
E /
V (
vs N
HE
)
i / mA cm-2
Pd PEM x 3.3 loading
20ºC
40ºC
60ºC
Figure 7-15: Cathode polarization curves for Pd MEA for a DMFC at 20, 40 and 60 ºC fed with
5M methanol solution compared to data from a H2 PEM fuel cell.
At 60 ºC with air operation (suitable operating conditions for a DMFC), and at low
current densities Pd cathodes match the performance of a Pt cathode with the same metal
loading when 5M methanol is fed to the anode.
7.4. Conclusions
Pd-EG11 was tested as a cathode catalyst in a direct methanol fuel cell and its
performance was compared to a commercial Pt/C. Cell performance was compared at
methanol concentrations of 1, 3, 5 and 7M and at temperatures 20, 40 and 60 ºC.
Anode potential vs current density curves showed how anode performance increased with
increasing temperature and methanol concentration. This did not always reflect on the
overall cell performance due to methanol crossover to the cathode. The effect of
methanol crossover was more severe for the Pt cathode due to its higher activity towards
the methanol oxidation reaction.
217
Despite its lower electrochemical surface area palladium overtook platinum as cathode
catalyst at high methanol concentrations. Current densities at 400 mV exhibited by the
palladium MEA were higher than for platinum at 60 ºC with methanol concentrations 5M
or higher, suitable operating conditions for DMFC. This makes Pd an adequate substitute
to Pt due to its lower price. Moreover, since the effect of crossover would be more severe
for Pt at lower cathode loadings (lower ORR current) the performance of a Pd cathode
would be higher than that of a Pt cathode even lower than 5M (equal performance at low
current densities with 2 mg cm-1
cathode loading).

218
References
1. Lin, J., A. Trivisonno, R. Wycisk, and P.N. Pintauro, Optimized DMFC
Performance Comparison for Modified and Unmodified Nafion Membranes. ECS
210th Meeting.
2. Mustain, W.E. and J. Prakash, Kinetics and mechanism for the oxygen reduction
reaction on polycrystalline cobalt-palladium electrocatalysts in acid media.
Journal of Power Sources, 2007. 170(1): p. 28-37.
3. Paulus, U.A., T.J. Schmidt, H.A. Gasteiger, and R.J. Behm, Oxygen reduction on
a high-surface area Pt/Vulcan carbon catalyst: a thin-film rotating ring-disk
electrode study. Journal of Electroanalytical Chemistry, 2001. 495(2): p. 134-145.
4. Kadirgan, J.F., Beden, B., Leger, J.M. and Lamy, Synergistic effect in the
electrocatalytic oxidation of methanol on platinum+palladium alloy electrode.
Journal of Electroanalytical Chemistry, 1981. 125(1): p. 89-103.
5. Mustain, W.E., K. Kepler, and J. Prakash, CoPdx oxygen reduction
electrocatalysts for polymer electrolyte membrane and direct methanol fuel cells.
Electrochimica Acta, 2007. 52(5): p. 2102-2108.
6. Gurau, B. and E.S. Smotkin, Methanol crossover in direct methanol fuel cells: A
link between power and energy density. Journal of Power Sources, 2002. 112(2):
p. 339-352.
7. Electrocatalysis of Direct Methanol Fuel Cells, ed. H. Liu and J. Zhang. 2009,
Weinheim: WILEY-VCH.
8. Vielstich, W., H. Gasteiger, and A. Lamm, Handbook of fuel cells : fundamentals,
technology and applications. 2003, Chichester: Wiley. 4 v.
9. Ko, D., M. Lee, W.H. Jang, and U. Krewer, Non-isothermal dynamic modelling
and optimization of a direct methanol fuel cell. Journal of Power Sources, 2008.
180(1): p. 71-83.
10. McGrath, K., High Concentration Direct Methanol Fuel Cell Using QSI-Nano®
Pd. Energy Research Laboratory, QuantumSphere Inc., 2008.
11. Tricoli, V., N. Carretta, and M. Bartolozzi, A Comparative Investigation of Proton
and Methanol Transport in Fluorinated Ionomeric Membranes. Journal of the
Electrochemical Society, 2000. 147(4): p. 1286-1290.

219
220
Chapter 8: Modeling of low temperature polymer electrolyte
membrane fuel cell
8.1. Introduction
A model for low temperature hydrogen polymer electrolyte membrane fuel cells
(PEMFCs) has been developed using thermodynamics, transport and kinetic equations.
The model considers mass transport through a thin film electrolyte and through porous
media. Available experimental physical and chemical properties data for PEMFCs have
been used, when appropriated, in the construction of this model. In this chapter a pseudo
one dimensional model is described for a fuel cell made up of a Nafion® membrane
sandwiched between two gas diffusion electrodes. The model is used to simulate the
influence of cathode catalyst loading, thickness and materials and the operating
conditions on the cell voltage and current density output.
8.2. Mathematical model
The mathematical model built in this study was a pseudo one dimensional model since
the gas flow channels of the cell were not considered. The parts of the fuel cell
considered for the construction of the model were a Nafion® membrane, cathode catalyst
layer with gas diffusion layer. Assumptions made in the model were:
- Single vapor phase operation, i.e. no liquid water formation in the pores of the catalyst
layer [1, 2, 3].
- Steady state and isothermal operation of the system.
- Ideal gas behavior.
- Mass transport is solely due to diffusion, convection effect is negligible.
- Negligible contact resistances between components.

221
- No membrane swelling.
- Isotropic macro-homogeneous porous regions.
- Catalyst layer treated as interface rather than a region (zero dimensional).
- Anode losses in PEMFCs with the loading used are negligible and therefore not
considered.
Since the cell temperature is controlled by electrical heaters during tests, the isothermal
operation was considered a realistic assumption. Ideal gas behavior was suitable because
the fuel cell was not pressurised. The conditions at the boundary between flow channels
and the diffusion layer were taken as those of the feed gas, this assumption was justified
by the excess of gas flow applied.
The macrohomogeneous model was used for the catalyst layer [4]. This model considers
the porous electrode as an „average‟ of the solid electrode and the electrolyte. Thus, the
effective conductivity of the porous electrode is the weighted volume average of the
respective conductivities. Diffusion coefficients and other properties are similarly
averaged.
The objective of this model is to determine the effect of cathode catalyst and operating
conditions on the cell voltage of the Nafion® based low temperature PEMFC. The overall
cell voltage is obtained by subtracting from the thermodynamic cell potential (reversible
potential) voltage losses, associated with ohmic resistances through membrane and
electrodes, and kinetic losses at the cathode.
iREE crevcell (8.1)
Where Ecell is the overall cell voltage, Erev is the reversible cell potential, η is the potential
losses induced by the polarization and iR is the ohmic resistance losses.

222
8.3. Thermodynamic equilibrium potential
The overall electrochemical reaction in a low temperature polymer electrolyte membrane
fuel cell operating with H2 as fuel and O2 as oxidant can be expressed as:
)(2)(2)(2 21
lgg OHOH (8.2)
The thermodynamic equilibrium potential for the above stated reaction can be determined
by the Nernst equation:
5.000
05.00
,
22
2
2
22ln
OH
OH
OH
OHTrev
PT
PP
PP
nF
RT
nF
GE
(8.3)
Where PX is the partial pressure of the species X. ∆H0 is the standard enthalpy and ∆S
0 is
the standard entropy of the reaction at temperature T and activity 1. αH2O is the water
activity at temperature T. P0
O2, P0
H2 and α0
H2O are the standard values of oxygen and
hydrogen partial pressure and water activity, respectively, at temperature T. The last three
values equal 1.
In order to calculate the change in the standard Gibbs free energy with temperature, ∆G0
T,
for Equation 8.3 the following equation was proposed by Scharifker et al. [5]:
263290.039925 - 24T0.19341309 + 92T0.00004877- . 210 molkJGT (8.4)
The cell reversal potential calculated from Equation 8.3 would diverge from the standard
reversal potential depending on the water activity and oxygen and hydrogen partial
pressures.

223
The water activity is given by [6]:
100
%/ *
222
RHPPa OHOHOH (8.5)
Where PH2O is the water vapor pressure in equilibrium with the acid electrolyte, P*
H2O is
the saturation vapor pressure of pure water at the same temperature.
Saturated water vapor pressures were obtained from steam tables [7]. To present water
vapor pressures in the temperature range of 273-500 K, data was plotted and the
following function was build:
10
234
* 1045.80112318884918471.31595337563
11584.7801363812676.17102607682.1422
T
TTTP sat
OH (8.6)
Where P is in atmospheres and T is in kelvin.
This model considers the catalyst surface covered by a thin electrolyte film; therefore
partial pressures were replaced by activities in the electrolyte. Activities of hydrogen and
oxygen could be replaced by their concentration in the thin film by considering their
activity coefficients to be close to 1 (applicable at low concentrations). Thus Equation 8.3
can be expressed as:
5.000
05.05.1
0
22
2
2
22)(
ln
OH
OH
OH
OH
revrev
PP
a
a
CCRT
nF
RTEE (8.7)
Where the solubility (concentration) of the reactants was obtained using Henry‟s law:
2
2
2
,
H
CT
H
H
NafionH
PC (8.8)

224
2
2
2
,
O
CT
O
O
NafionH
PC (8.9)
Where CH2, CO2 are the concentration of dissolved hydrogen and oxygen Nafion®, Px is
the equilibrium partial pressure of species x in atmosphere Hx is Henry‟s constant for
species x in Nafion® electrolyte in atmosphere cm
3 mol
-1 at a given temperature T. The
term RT included in the logarithm in Equation 8.7 was introduced in order to convert the
concentration, Cx, into pressure units (atmosphere).
The observed open circuit potential (OCP) for the cell was lower than the value estimated
from thermodynamics, Erev, this is due to the effect of cross-over and other phenomena
such as carbon corrosion, etc. The hydrogen crossover through the membrane leads to an
overvoltage, ηcross-over, which can be expressed as:
2
,0,0 21
2ln
c
overcross
c
overcrossovercross
i
i
i
i
F
RT
(8.10)
Where α is the transfer coefficient and io is the exchange current density.
The observed OCP would be lower than the theoretical Erev, 1.23 V, by ηcross-over. The
effect of cross-over on polarization curves is only important at small current densities and
becomes negligible, i is much larger than icross-over (Equation 8.11):
2
,0,0
2
,0,0
21
2
21
2ln
cc
c
overcross
c
overcross
overcross
i
i
i
i
i
ii
i
ii
F
RT
(8.11)

225
8.4. Gas transport through porous media
Since the cathode is normally the limiting electrode in hydrogen polymer electrolyte
membrane fuel cells, due to the fast kinetics of the hydrogen oxidation reaction [8], the
anode was not considered in the construction of this model.
To build this model a one-dimensional diffusion, perpendicular to the electrode surface,
was considered. The diffusion of multi-component gas streams (three species are present
in the cathode gas stream: O2, N2 and H2O) through the porous carbon electrode can be
described by the Stefan-Maxwell equation:
jeff
ij
ijjii
D
NXNX
P
RT
z
X (8.12)
Where Xi is the molar fraction of species i, Ni is the molar flux of species i and Dijeff
is the
effective binary diffusion coefficient for the pair i-j in the porous medium.
Dijeff
was calculated using the Slattery-Bird [9] correlation and corrected afterwards to
take into account porosity and tortuosity effects as in the work published by Scott et al.
[10].
2/1
12/5
,,
3/1
,,
,,
11
ji
jcicjcic
b
jcic
eff
ijMM
TTPPTT
T
P
aD (8.13)
Where Tc and Pc are gas critical temperature and pressure, respectively, M is the gas
molecular weight, is the porosity, is the tortuosity and a and b are constants. a is
0.0002745 for di-atomic gases and 0.000364 for water vapor and b is 1.832 for di-atomic
gases and 2.334 for water vapor.
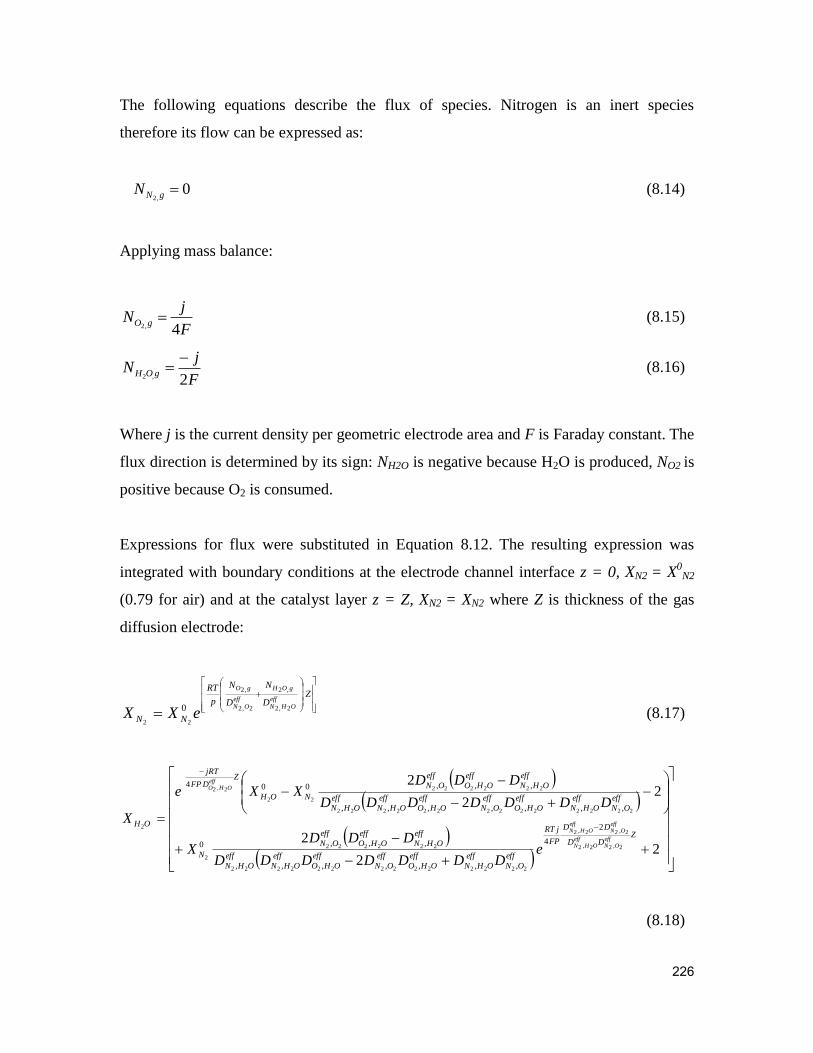
226
The following equations describe the flux of species. Nitrogen is an inert species
therefore its flow can be expressed as:
0,2gNN (8.14)
Applying mass balance:
F
jN gO
4,2 (8.15)
F
jN gOH
2,2
(8.16)
Where j is the current density per geometric electrode area and F is Faraday constant. The
flux direction is determined by its sign: NH2O is negative because H2O is produced, NO2 is
positive because O2 is consumed.
Expressions for flux were substituted in Equation 8.12. The resulting expression was
integrated with boundary conditions at the electrode channel interface z = 0, XN2 = X0
N2
(0.79 for air) and at the catalyst layer z = Z, XN2 = XN2 where Z is thickness of the gas
diffusion electrode:
ZD
N
D
N
p
RT
NN
effOHN
gOH
effON
gO
eXX2,2
,2
2,2
,2
22
0 (8.17)
22
2
22
2
2,22,2
2,22,2
22222222222222
222222
2
22222222222222
222222
22
2,2
2 2
4
,,,,,,,
,,,0
,,,,,,,
,,,004
ZDD
DD
FP
jRT
eff
ON
eff
OHN
eff
OHO
eff
ON
eff
OHO
eff
OHN
eff
OHN
eff
OHN
eff
OHO
eff
ON
N
eff
ON
eff
OHN
eff
OHO
eff
ON
eff
OHO
eff
OHN
eff
OHN
eff
OHN
eff
OHO
eff
ON
NOH
ZDFP
jRT
OH
effON
effOHN
effON
effOHN
effOHO
eDDDDDDD
DDDX
DDDDDDD
DDDXXe
X
(8.18)

227
The oxygen molar fraction is given by:
OHNO XXX222
1 (8.19)
8.5. Gas transport through thin film electrolyte
The macro-homogeneous model for the catalyst layer assumes that each catalytic site or
specific area in the catalyst layer is an „average‟ of the whole electrolyte and solid
electrode. Accordingly, the effective diffusion coefficient through the catalyst layer was
calculated as the pondered volume average of the respective diffusion coefficients.
Oxygen transport from the porous layer to the catalyst surface occurs through a thin
polymer electrolyte film covering the catalyst particles. The oxygen dissolves at the
boundary gaseous phase-thin film, and then diffuses through the thin electrolyte film to
reach the catalytic site. The film also allows protons to move from the catalytic active
sites to the membrane and vice versa. The average film thickness, δ, can be estimated by
the following expression:
PtC
NafionNafion
SS
m
(8.20)
Where mNafion is the mass of Nafion® per unit area, is the density of Nafion
® and Sc
and SPt are the specific surface area of carbon and platinum (or other metallic
electrocatalyst), respectively, per unit area.
The concentration of oxygen at the catalyst surface was determined by deriving from
Fick‟s law for diffusion:
cathode
dissolvedOPtO
Nafion
O
cathodePt
O CCD
S
N
)(,,
,
2222
(8.21)

228
Where N is the molar flux, CPt is the reactant concentration on the catalyst surface and
Cdissolved is the equilibrium reactant concentration in the polymer electrolyte thin film at a
given temperature.
Concentration values of oxygen in the electrolyte (solubility) were obtained using
Henry‟s law for solubility (Equation 8.8 and Equation 8.9).
Parthasarathy et al. studied variation of oxygen solubility and diffusion with temperature
in Nafion®
[11]. Two first order polynomials were built to fit their data for oxygen
diffusion (Equation 8.22) and concentration in the thin film layer (Equation 8.23). Plots
of T-1
(K-1
) vs ln CO2 (in mol dm-3
) and T-1
(K-1
) vs ln DO2 (in m2 s
-1) are shown in Figure
8-1 and the respective polynomial functions displayed in the plots.
442.1216.2983 T
C (8.23)
2805.7150.662ln T
D (8.24)
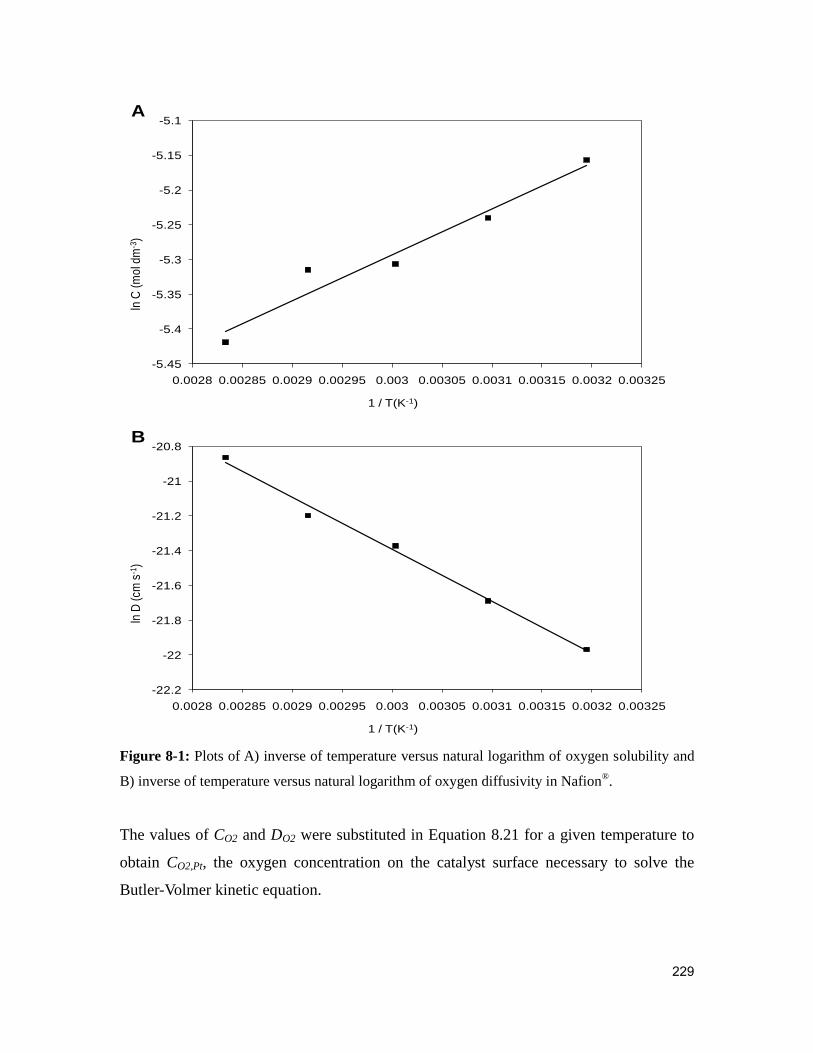
229
-5.45
-5.4
-5.35
-5.3
-5.25
-5.2
-5.15
-5.1
0.0028 0.00285 0.0029 0.00295 0.003 0.00305 0.0031 0.00315 0.0032 0.00325
ln C
(m
ol d
m-3
)
1 / T(K-1)
A
-22.2
-22
-21.8
-21.6
-21.4
-21.2
-21
-20.8
0.0028 0.00285 0.0029 0.00295 0.003 0.00305 0.0031 0.00315 0.0032 0.00325
ln D
(cm
s-1
)
1 / T(K-1)
B
Figure 8-1: Plots of A) inverse of temperature versus natural logarithm of oxygen solubility and
B) inverse of temperature versus natural logarithm of oxygen diffusivity in Nafion®.
The values of CO2 and DO2 were substituted in Equation 8.21 for a given temperature to
obtain CO2,Pt, the oxygen concentration on the catalyst surface necessary to solve the
Butler-Volmer kinetic equation.

230
8.6. Kinetics
The relation between current density and potential loss can be expressed by the widely
known Butler-Volmer equation as:
RT
F
RT
Fii ac expexp0
(8.25)
Where η is the overpotential, i is the current density, i0 is the exchange current density
and αa and αc are the transfer coefficients of the anodic and cathodic reactions,
respectively. Assuming αa = α c= α, the hyperbolic sine function can be substituted in
Equation 8.25 yielding the following relationship:
RT
Fii sinh2 0 (8.26)
The transfer coefficient calculated from half cell tests (Chapter 4) for Pt was 0.45 in the
high current density region. This value was used in the construction of the model as it is
close to 0.5 employed in most models such as the ones from Liu, Min and Wang [12-14].
Exchange current density was calculated from the following equation:
ref
C
ref
Pt
Ptcc
ref
T
T
RT
E
C
CLaii 1exp00
(8.27)
Where i0 is the apparent exchange current density in A cm-2
(current density per electrode
geometric area), i0ref
is the exchange current density in A cmPt-2
measured at a reference
temperature, Tref, and at a reference dissolved oxygen concentration, Cref, and EC is the
activation energy. CPt is the oxygen concentration on the catalyst surface calculated from
equation 8.21 and ac is the catalyst electrochemical surface area in m2 g
-1 of Pt, measured
using cyclic voltammetry (Chapter 4). Lc is the catalyst loading in mg cm-2
and the

231
product ac x Lc is the roughness factor, which is the Pt electrochemical surface area
divided by the electrode geometric area. is the reaction order with respect to oxygen in
acid media, reported as 1 in the literature by Paulus et al. [15] and Mukerjee et al. [16].
However, different values of were used to fit experimental data in the range from 1 to
2, as discussed in Section 8.8.2. Kinetic parameters employed in the construction of this
model were obtained from this work, or if unavailable, were taken from the literature;
these parameters are summarised in Table 8.6.
Table 8-6: Kinetic parameters used in the construction of the model.
Parameter Pt/C-Etek Pd/C-EG11 Reference
α 0.45 0.45 This work
ioref
(A cm-2
) 1.4 x 10⁻¹⁰
1.0 x 10⁻¹¹
This work
Lc (g metal cm-2
) 0.6 0.6, 1.0, 1.8 This work
CPtref
(mol dm-3
) 2.03 x 10⁻⁴
2.03 x 10⁻⁴
[17]
γ 1, 1.75, 2 1, 1.75, 2 [15, 18] and this
work
ε 0.3 0.3 [19]
τ 1.5 1.5 [20]
Z (µm) 200 200 [21]
8.7. Conductivity and IR losses
To calculate the proton conductivity of Nafion® 112 at different temperatures the
following expression has been suggested by Sun et al. [22]:
T
1
303
11268exp)00326.0005139.0( (8.28)
Where σ is the conductivity in S cm-1
, T is the operating temperature and λ is the water
content (number of water molecules per sulfonic acid group in the membrane). To
calculate the water content Zawodzinski et al. [23] suggested the expression:
232
32 3639.85a-17.18a0.043 a (8.29)
Where a is the water activity, defined as RH%/100 i, where RH is the relative humidity at
given temperature. It was assumed that the vapor phase was fully saturated; therefore
water activity was considered as 1.
Nafion® resistance was obtained from conductivity using Equations 8.30 and 8.31:
1 (8.30)
l
AR (8.31)
Where σ is the conductivity in S cm-1
, is the resistivity in Ω cm, R is the resistance in Ω,
A is cross-section area of the electrode (1 cm2) and l is the thickness of the membrane (50
µm for Nafion® 112).
The overall cell voltage is given by:
IREU crevcell || (8.32)
The iR potential losses were calculated from Equations 8.28, 8.30 and 8.31 using Ohm‟s
law, cathode potential losses were calculated from Equation 8.25, and thermodynamic
cell reversible potential from Equation 8.3.
233
8.8. Results and discussion
Matlab® V.7.3 and Simulink
® V.6.5 equipped with Ordinary Differential Equation solver
(ODE 45) were used to solve the model governing equations. The results predicted by the
model are compared to experimental data obtained from a low temperature polymer
electrolyte membrane fuel cell. Experimental data include tests using Pd/C-EG11 and
commercial Pt/C as cathode catalysts; metal loadings were 0.6 and 1.0 mg cm-2
in
cathode and 0.2 mg cm-2
Pt/C in the anode. Model predictions are compared to the anodic
sweep at 5 mV s-1
.
8.8.1. Mass transport losses
This model considers mass transport through a thin film electrolyte as well as through the
porous media. This assumption was necessary for the model to predict the mass transport
limitations with air operation observed in the experimental results. In this section
diffusion through the porous media and through the electrolyte thin film are analyzed.
8.8.1.1. Mass transport in porous media
Figure 8-2 shows the effect of current density on oxygen, water and nitrogen gas partial
pressures at the catalysts surface for 30% porosity [19] and diffusion length of 200 μm
[21]; the existence of the electrolyte thin film was not taken into account. Limiting
current would be observed when the oxygen partial pressure reaches zero (PO2 = 0), this
did not occurred even at high current densities of 4 A cm-2
using air. This confirms what
was previously discussed in the literature review (Chapter 2), concerning the failure of
models with no electrolyte thin film consideration to explain experimentally observed
limiting current densities (below 1.5 A cm-2
) with air operation.

234
0
0.1
0.2
0.3
0.4
0.5
0.6
0.7
0.8
0.9
1
0 0.5 1 1.5 2 2.5 3 3.5 4 4.5
Px
/ atm
i / A cm-2
oxygen
water
nitrogen
Figure 8-2: Predicted effect of operating current density on the cathode gas mixture operating
with air at 40 ºC.
This illustrates why considering that mass transport occurs only through the porous media
fails to predict mass transport limitations with air operation and consequently over
estimates the cell performance at high current densities.
8.8.1.2. Mass transport in thin film
In reality, in the catalyst layer, a thin film of electrolyte surrounds the catalyst
nanoparticles and mass transport of reactants through this phase needs to be considered.
Reactants have to dissolve in this phase and diffuse through it to reach the catalytic sites.
Diffusion through the porous media is faster than through the polymer electrolyte and this
explains the experimentally observed mass transport behavior.
Figure 8-3 shows the effect of current density on oxygen concentration at the catalysts
surface with air and oxygen operation. In this case the presence of an electrolyte thin film
has been considered. When O2 diffusion through the electrolyte thin film was considered,

235
the model predicted limiting current (oxygen concentration equal to zero) of ca.
1.5 A cm-2
at 40 ºC with air operation. This value is close to the limiting currents
observed in fuel cell tests and therefore supports the addition of the electrolyte thin film
to the model.
0
1
2
3
4
5
6
7
0 0.5 1 1.5 2 2.5 3 3.5 4 4.5
C o
nc.O
2 / m
mol
dm
-3
i / A cm-2
oxygen fed
air fed
Figure 8-3: Predicted effect of operating current density on the oxygen concentration in the thin
film with air and oxygen at 40 ºC.
8.8.2. Model predictions and limitations
Figures 8-4 and 8-5 compare current-potential curves obtained from fuel cell tests with
model predictions. For both Pt and Pd model predictions matched closely fuel cell
experimental data for oxygen, however, it overestimated performance with air operation,
especially at high current densities. This limitation was attributed to oxygen starvation,
which was not considered in simple one-dimensional models like the macro-homogenous
model used. On a thick electrode (using a catalysts with low metal to carbon ratio and
relatively high metal loadings, 0.6 mg cm-2
) the oxygen concentration will decrease
sharply as the cell is polarized, as illustrated in Figure 8-3.
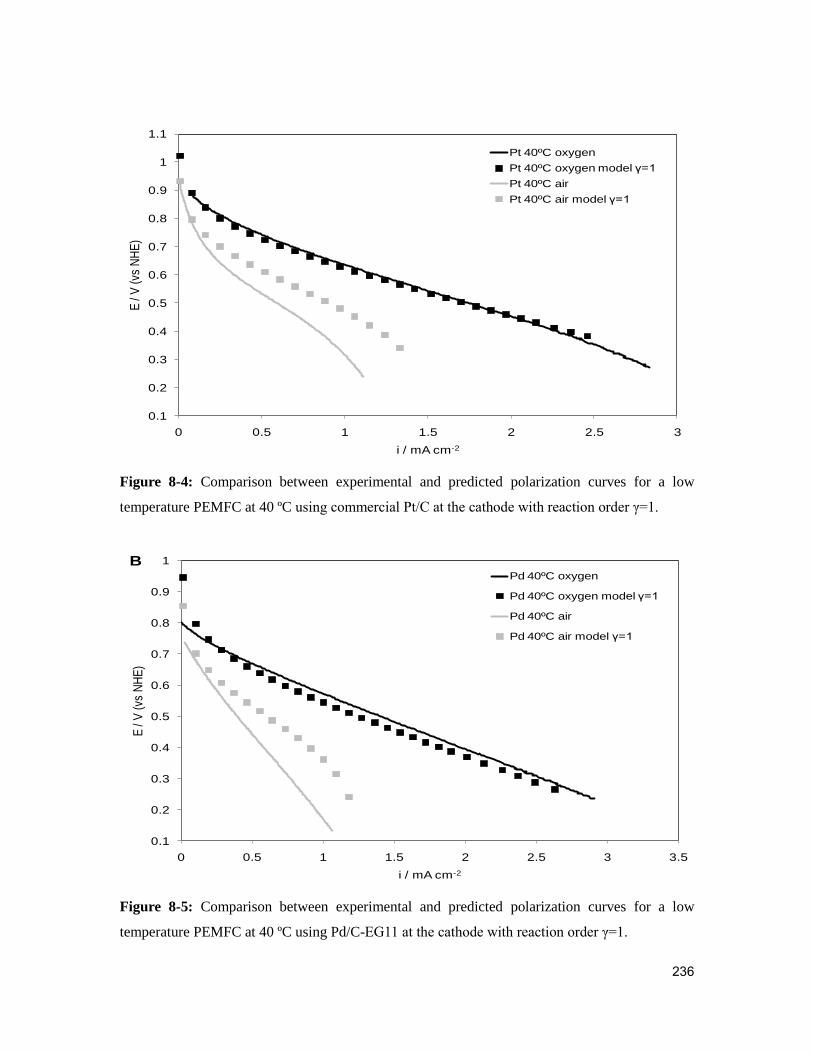
236
0.1
0.2
0.3
0.4
0.5
0.6
0.7
0.8
0.9
1
1.1
0 0.5 1 1.5 2 2.5 3
E /
V (
vs N
HE
)
i / mA cm-2
Pt 40ºC oxygen
Pt 40ºC oxygen model γ=1
Pt 40ºC air
Pt 40ºC air model γ=1
Figure 8-4: Comparison between experimental and predicted polarization curves for a low
temperature PEMFC at 40 ºC using commercial Pt/C at the cathode with reaction order γ=1.
0.1
0.2
0.3
0.4
0.5
0.6
0.7
0.8
0.9
1
0 0.5 1 1.5 2 2.5 3 3.5
E /
V (
vs N
HE
)
i / mA cm-2
Pd 40ºC oxygen
Pd 40ºC oxygen model γ=1
Pd 40ºC air
Pd 40ºC air model γ=1
B
Figure 8-5: Comparison between experimental and predicted polarization curves for a low
temperature PEMFC at 40 ºC using Pd/C-EG11 at the cathode with reaction order γ=1.
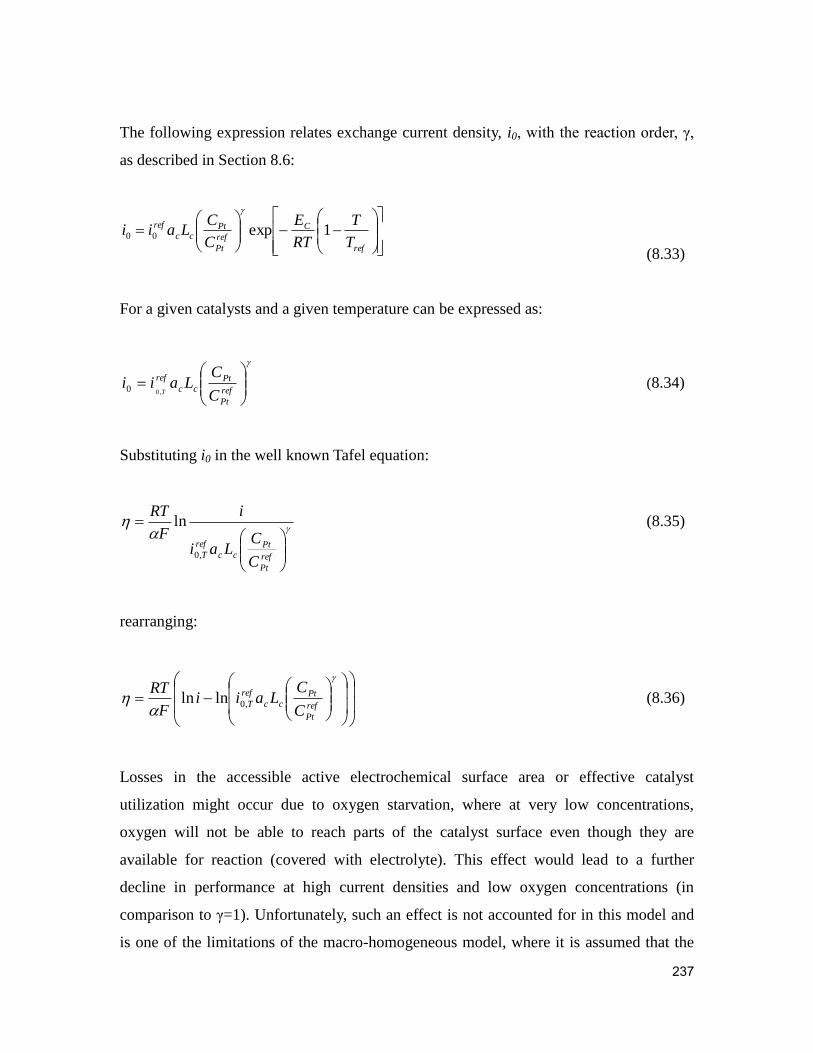
237
The following expression relates exchange current density, i0, with the reaction order, γ,
as described in Section 8.6:
ref
C
ref
Pt
Ptcc
ref
T
T
RT
E
C
CLaii 1exp00
(8.33)
For a given catalysts and a given temperature can be expressed as:
ref
Pt
Pt
cc
ref
C
CLaii
T,00 (8.34)
Substituting i0 in the well known Tafel equation:
ref
Pt
Pt
cc
ref
TC
CLai
i
F
RT
,0
ln (8.35)
rearranging:
ref
Pt
Pt
cc
ref
TC
CLaii
F
RT,0lnln (8.36)
Losses in the accessible active electrochemical surface area or effective catalyst
utilization might occur due to oxygen starvation, where at very low concentrations,
oxygen will not be able to reach parts of the catalyst surface even though they are
available for reaction (covered with electrolyte). This effect would lead to a further
decline in performance at high current densities and low oxygen concentrations (in
comparison to γ=1). Unfortunately, such an effect is not accounted for in this model and
is one of the limitations of the macro-homogeneous model, where it is assumed that the
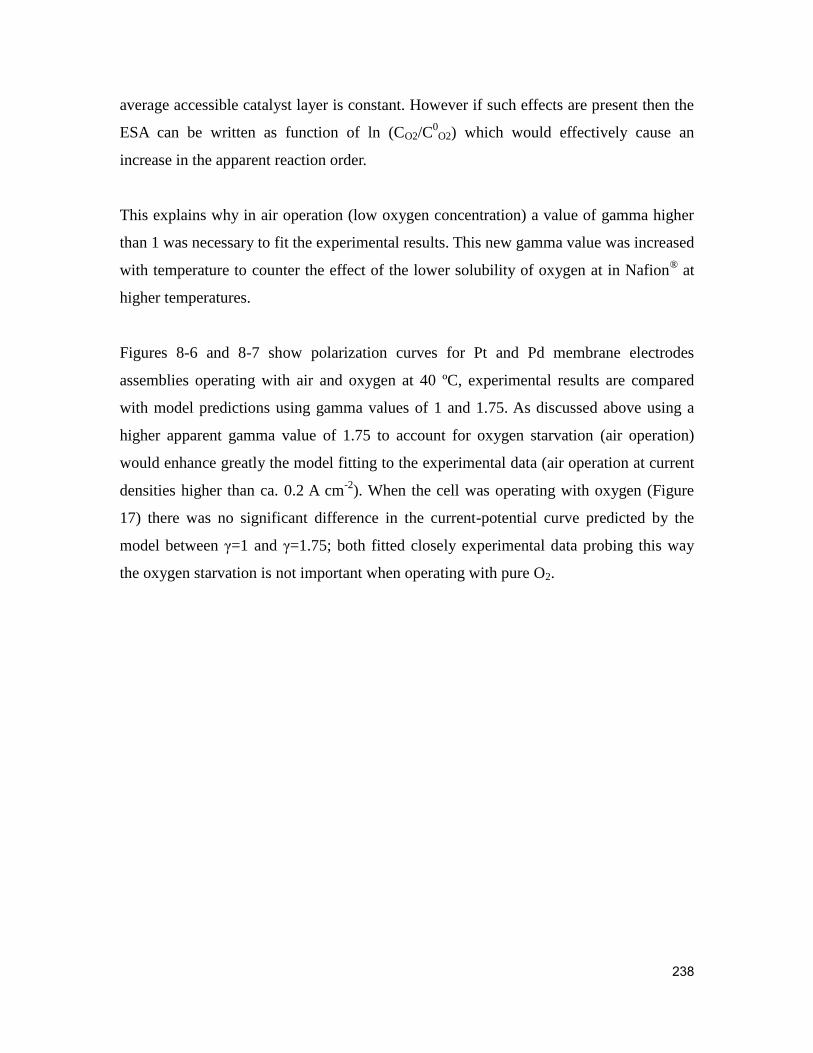
238
average accessible catalyst layer is constant. However if such effects are present then the
ESA can be written as function of ln (CO2/C0O2) which would effectively cause an
increase in the apparent reaction order.
This explains why in air operation (low oxygen concentration) a value of gamma higher
than 1 was necessary to fit the experimental results. This new gamma value was increased
with temperature to counter the effect of the lower solubility of oxygen at in Nafion® at
higher temperatures.
Figures 8-6 and 8-7 show polarization curves for Pt and Pd membrane electrodes
assemblies operating with air and oxygen at 40 ºC, experimental results are compared
with model predictions using gamma values of 1 and 1.75. As discussed above using a
higher apparent gamma value of 1.75 to account for oxygen starvation (air operation)
would enhance greatly the model fitting to the experimental data (air operation at current
densities higher than ca. 0.2 A cm-2
). When the cell was operating with oxygen (Figure
17) there was no significant difference in the current-potential curve predicted by the
model between γ=1 and γ=1.75; both fitted closely experimental data probing this way
the oxygen starvation is not important when operating with pure O2.
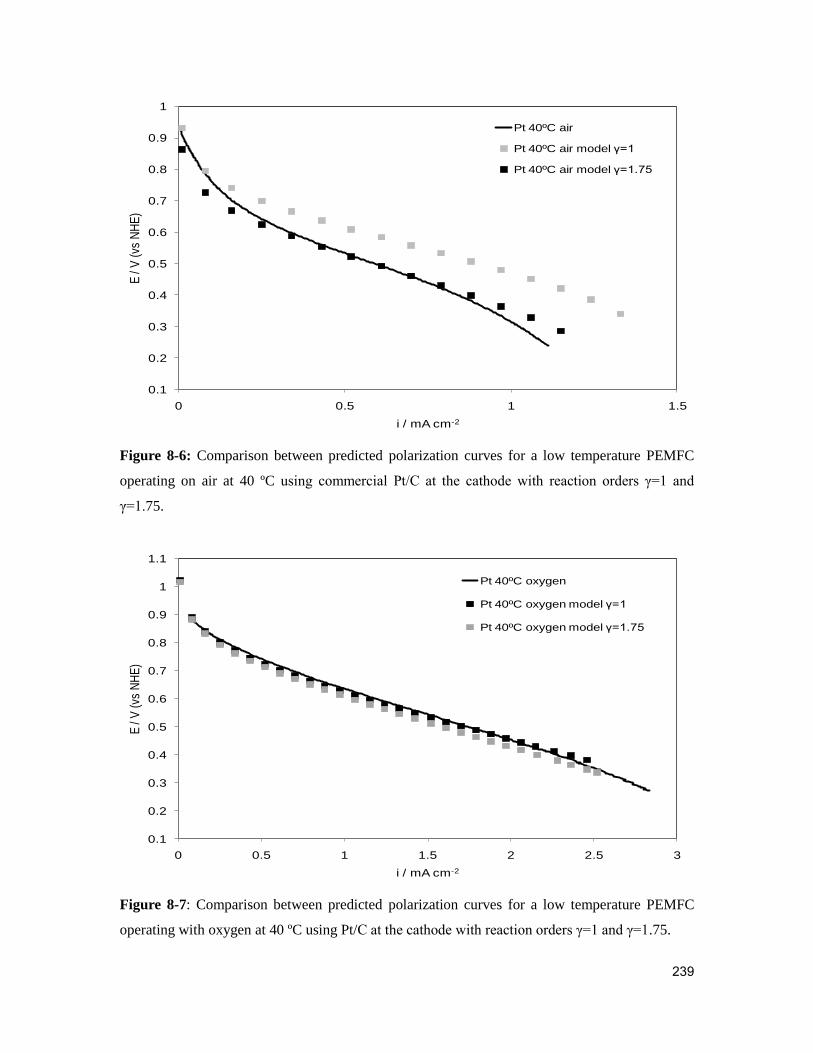
239
0.1
0.2
0.3
0.4
0.5
0.6
0.7
0.8
0.9
1
0 0.5 1 1.5
E /
V (
vs N
HE
)
i / mA cm-2
Pt 40ºC air
Pt 40ºC air model γ=1
Pt 40ºC air model γ=1.75
Figure 8-6: Comparison between predicted polarization curves for a low temperature PEMFC
operating on air at 40 ºC using commercial Pt/C at the cathode with reaction orders γ=1 and
γ=1.75.
0.1
0.2
0.3
0.4
0.5
0.6
0.7
0.8
0.9
1
1.1
0 0.5 1 1.5 2 2.5 3
E /
V (
vs N
HE
)
i / mA cm-2
Pt 40ºC oxygen
Pt 40ºC oxygen model γ=1
Pt 40ºC oxygen model γ=1.75
Figure 8-7: Comparison between predicted polarization curves for a low temperature PEMFC
operating with oxygen at 40 ºC using Pt/C at the cathode with reaction orders γ=1 and γ=1.75.

240
8.8.3. Temperature effect
Figures 8-8 and 8-9 compare model predictions and polarization curves for Pt and Pd
membrane electrodes assemblies operating with air and oxygen at 20 and 40 ºC,
respectively. At both temperatures the model fits closely with the obtained fuel cell data
for the two electrocatalysts.
0.1
0.2
0.3
0.4
0.5
0.6
0.7
0.8
0.9
1
1.1
0 0.5 1 1.5 2 2.5
E /
V (v
s N
HE
)
i / mA cm-2
Pt 20ºC oxygen
Pt 20ºC oxygen model
Pt 20ºC air
Pt 20ºC air model
A
0.1
0.2
0.3
0.4
0.5
0.6
0.7
0.8
0.9
1
0 0.5 1 1.5 2 2.5
E /
V (v
s N
HE
)
i / mA cm-2
Pd 20ºC oxygen
Pd 20ºC oxygen model
Pd 20ºC air
Pd 20ºC air model
B
Figure 8-8: Comparison between predicted and experimental data for a low temperature PEMFC
operating with air (γ=1.5) and O2 (γ=1) at 20 ºC using A) commercial Pt/C and B) Pd/C-EG11 as
cathode catalysts.

241
0.1
0.2
0.3
0.4
0.5
0.6
0.7
0.8
0.9
1
1.1
0 0.5 1 1.5 2 2.5 3
E /
V (
vs N
HE
)
i / mA cm-2
Pt 40ºC oxygen
Pt 40ºC oxygen model
Pt 40ºC air
Pt 40ºC air model
A
0.1
0.2
0.3
0.4
0.5
0.6
0.7
0.8
0.9
1
0 0.5 1 1.5 2 2.5 3 3.5
E /
V (
vs N
HE
)
i / mA cm-2
Pd 40ºC oxygen
Pd 40ºC oxygen model
Pd 40ºC air
Pd 40ºC air model
B
Figure 8-9: Comparison between predicted and experimental data for a low temperature PEMFC
operating with air (γ=1. 75) and O2 (γ=1) at 40 ºC using A) commercial Pt/C and B) Pd/C-EG11
as cathode catalysts.
Oxygen solubility in Nafion® decreases with increasing temperature as shown in Section
8.6 [24] and this was taken into account in the construction of the model. Oxygen
permeability in Nafion®
also depends on the water content. Measured cathode relative

242
humidity values were close to 100% at 20, 40 ºC and only 73% at 60 ºC (Chapter 6).
Takamura et al. studied the influence of the relative humidity on the oxygen permeability
through Nafion® [25]. They found that oxygen permeability at 70% relative humidity was
approximately half of that at 100% relative humidity at 50 ºC, ca 1.3 and 2.5 x 10⁻¹²
mol
cm-1
s-1
. At 60 ºC oxygen permeability for a 90% relative humidity was ca. 3.0 x 10⁻¹²
mol cm-1
s-1
. Since permeability decreases with decreasing water content [26] and for a
given relative humidity water content decreases with increasing temperature [27], the
difference between oxygen permeability at 100% and at 70% relative humidity will be
higher at 60 ºC than at 50 ºC. Oxygen permeability therefore was considered 2.5 times
lower at 70% RH in comparison to 100% RH at 60 ºC. This assumption seems reasonable
as the estimated limiting current from the model with air operation is very close to that
obtained from the experimental data.

243
0.1
0.2
0.3
0.4
0.5
0.6
0.7
0.8
0.9
1
1.1
0 0.5 1 1.5 2 2.5 3 3.5
E /
V (
vs N
HE
)
i / mA cm-2
Pt 60ºC oxygen
Pt 60ºC oxygen model
Pt 60ºC air
Pt 60ºC air model
A
0.1
0.2
0.3
0.4
0.5
0.6
0.7
0.8
0.9
1
0 0.5 1 1.5 2 2.5 3
E /
V (
vs N
HE
)
i / mA cm-2
Pd 60ºC oxygen
Pd 60ºC oxygen model
Pd 60ºC air
Pd 60ºC air model
B
Figure 8-10: Comparison between predicted and experimental data for a low temperature
PEMFC operating with air (γ=2) and O2 (γ=1) at 60 ºC using A) commercial Pt/C and B) Pd/C-
EG11 as cathode catalysts.
To illustrate how the oxygen concentration at the catalysts surface is affected by the
decrease in oxygen permeability through Nafion®
, predicted oxygen concentration in the
cathode versus current density were plotted for Pt with air operation at 40 and 60 ºC
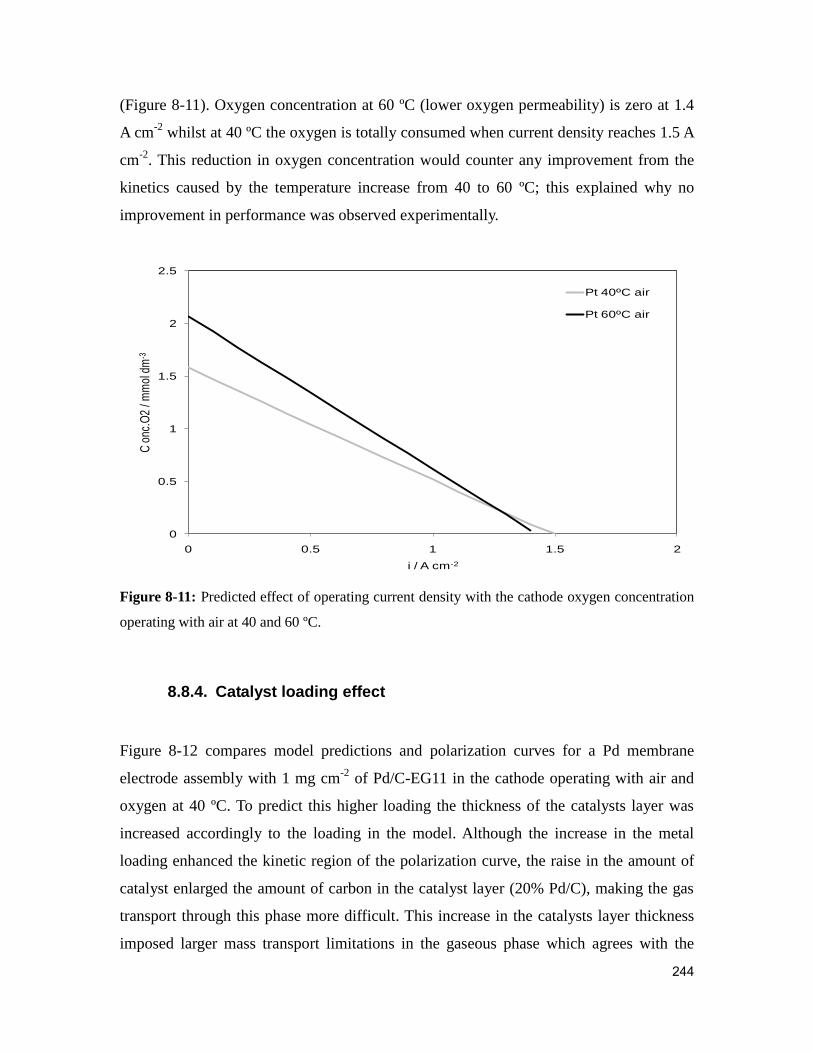
244
(Figure 8-11). Oxygen concentration at 60 ºC (lower oxygen permeability) is zero at 1.4
A cm-2
whilst at 40 ºC the oxygen is totally consumed when current density reaches 1.5 A
cm-2
. This reduction in oxygen concentration would counter any improvement from the
kinetics caused by the temperature increase from 40 to 60 ºC; this explained why no
improvement in performance was observed experimentally.
0
0.5
1
1.5
2
2.5
0 0.5 1 1.5 2
C o
nc.O
2 / m
mol
dm
-3
i / A cm-2
Pt 40ºC air
Pt 60ºC air
Figure 8-11: Predicted effect of operating current density with the cathode oxygen concentration
operating with air at 40 and 60 ºC.
8.8.4. Catalyst loading effect
Figure 8-12 compares model predictions and polarization curves for a Pd membrane
electrode assembly with 1 mg cm-2
of Pd/C-EG11 in the cathode operating with air and
oxygen at 40 ºC. To predict this higher loading the thickness of the catalysts layer was
increased accordingly to the loading in the model. Although the increase in the metal
loading enhanced the kinetic region of the polarization curve, the raise in the amount of
catalyst enlarged the amount of carbon in the catalyst layer (20% Pd/C), making the gas
transport through this phase more difficult. This increase in the catalysts layer thickness
imposed larger mass transport limitations in the gaseous phase which agrees with the
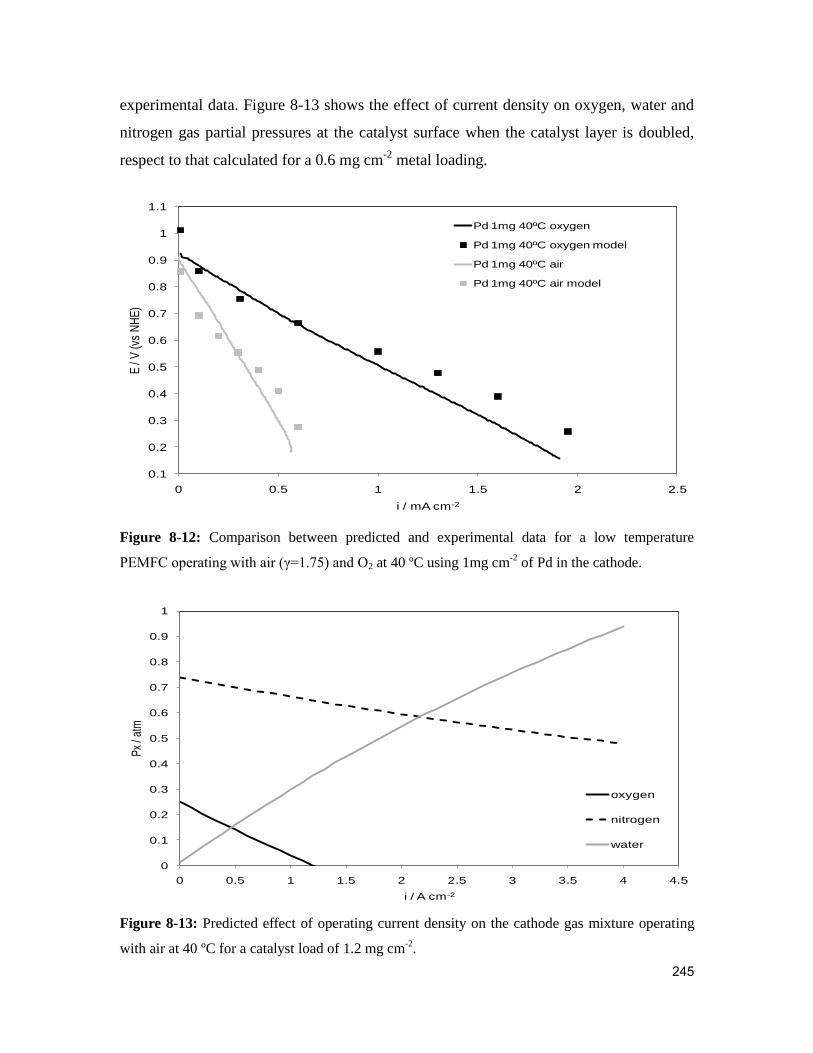
245
experimental data. Figure 8-13 shows the effect of current density on oxygen, water and
nitrogen gas partial pressures at the catalyst surface when the catalyst layer is doubled,
respect to that calculated for a 0.6 mg cm-2
metal loading.
0.1
0.2
0.3
0.4
0.5
0.6
0.7
0.8
0.9
1
1.1
0 0.5 1 1.5 2 2.5
E /
V (
vs N
HE
)
i / mA cm-2
Pd 1mg 40ºC oxygen
Pd 1mg 40ºC oxygen model
Pd 1mg 40ºC air
Pd 1mg 40ºC air model
Figure 8-12: Comparison between predicted and experimental data for a low temperature
PEMFC operating with air (γ=1.75) and O2 at 40 ºC using 1mg cm-2
of Pd in the cathode.
0
0.1
0.2
0.3
0.4
0.5
0.6
0.7
0.8
0.9
1
0 0.5 1 1.5 2 2.5 3 3.5 4 4.5
Px
/ atm
i / A cm-2
oxygen
nitrogen
water
Figure 8-13: Predicted effect of operating current density on the cathode gas mixture operating
with air at 40 ºC for a catalyst load of 1.2 mg cm-2
.

246
Increasing the catalyst loading showed enhancement in the kinetic region of the
polarization curves. With 1 mg cm-2
Pd the performance in the low current density region
matches that of commercial Pt/C, as discussed in Chapter 6. The model seems to provide
a close estimate to that of the experimental data when higher loading was used. Model
predictions were also obtained with a cathode loading of 1.8 mg cm-2
Pd (Figure 8-14).
The model predicts an enhanced performance in the low current density region
(overtaking that of Pt) but also shows severe mass transport, with limiting currents close
to 1 A cm-2
with oxygen operation.
0.1
0.2
0.3
0.4
0.5
0.6
0.7
0.8
0.9
1
1.1
1.2
0 0.5 1 1.5 2 2.5
E /
V (
vs N
HE
)
i / mA cm-2
Pd 1mg 40ºC oxygen model
Pd 1.8mg 40ºC oxygen model
Pd 1mg 40ºC air model
Pd 1.8mg 40ºC air model
Figure 8-14: Comparison between predicted polarization curves for a low temperature PEMFC
operating with air (γ=1.75) and O2 at 40 ºC with 1.0 and 1.8 mg Pd in the cathode.
Since the main issue with using high metal loading was the gas diffusion through the
porous media a possible solution would be to increase the metal percentage in the carbon-
supported palladium nanoparticles. To support this idea, model predictions were obtained
with metal loadings of 1 mg cm-2
Pd/C but catalyst layer thickness corresponding to a
loading of 0.6 mg cm-2
Pd/C of Pd/C 20% was considered (Figure 8-15). This way the
enhancement in the low current density region was accompanied by a raised performance
in the high current density region. While it is necessary to use 1 mg cm-2
for Pd/C to be

247
good substitute to Pt, a higher metal loading would be required (40% weight Pd/C) to
overcome mass transport losses (and worse oxygen starvation) at high current densities.
0.1
0.2
0.3
0.4
0.5
0.6
0.7
0.8
0.9
1
1.1
0 0.5 1 1.5 2 2.5 3 3.5 4 4.5
E /
V (
vs N
HE
)
i / mA cm-2
Pd 1mg 40ºC oxygen model
Pd 1mg 40ºC oxygen model thin
Pd 1mg 40ºC air model
Pd 1mg 40ºC air model thin
Figure 8-15: Comparison between predicted polarization curves for a low temperature PEMFC
operating with air (γ=1.75) and O2 at 40 ºC with different catalysts layer thickness.
8.9. Conclusions
A model of a low temperature PEMFc has been applied to low temperature hydrogen
polymer electrolyte membrane fuel cells to simulate the influence of cathode catalyst
loading, thickness and materials and the operating conditions on the cell voltage and
current density. The assumption of the existence of an electrolyte thin film was necessary
for the model to predict the mass transport limitations with air operation observed in the
experimental results.
The model closely matched the fuel cell experimental data with oxygen operation;
however it overestimated performance with air, especially at high current densities. This
failure of the model was attributed to oxygen starvation, and was explained by losses in

248
the active electrochemical surface area. To enhance the model accuracy a new concept,
the apparent reaction order (Γ), was introduced to explain the need of a higher reaction
order to fit experimental data. Apparent reaction order was taken for air operation at 20,
40 and 60 ºC as 1.5, 1.75 and 2, respectively.
The model predicted closely experimental results at 20 and 40 ºC. At 60 ºC, a lower
permeability value was employed according with the lower humidity measured
experimentally. Above 40 ºC cell performance did not improve experimentally and this
was predicted by the model. This lack of improvement was attributed to the decrease of
oxygen permeability through Nafion® and the consequent decrease of the oxygen
concentration at the catalyst surface, which countered any kinetic enhancement with the
temperature increase.
The increase of the metal loading in the cathode enhanced fuel cell performance in the
low current density range; however severe mass transport limitation appeared. Predicted
results showed that this could be solved by increasing the loading without increasing the
catalyst layer thickness, which can be practically achieved by increasing the metal
content of the carbon-supported catalyst.

249
References
1. Yi, J. and T. Nguyen, Multicomponent transport in porous electrodes of proton
exchange membrane fuel cells using the interdigitated gas distributors. Journal of
The Electrochemical Society, 1999. 146 (1): p. 38-45. |
2. A. Kazim, H. Liu and P. Forges, Modelling of performance of PEM fuel cells with
conventional and interdigitated flow fields. Journal of Applied Electrochemistry,
1999. 29 (12): p. 1409-1416.
3. A. Kulikovsky, J. Divisek and A. Kornyshev. Modeling the cathode compartment
of polymer electrolyte fuel cells: Dead and active reaction zones. Journal of The
Electrochemical Society, 1999. 146 (1): p. 3981-3991.
4. Hampson, N.A.a.A.J.S.M., The Electrochemistry of Porous Electrodes: Flooded,
Static (Natural) Electrodes, in Electrochemistry, ed. D. Pletcher. 1983, London:
Royal Society of Chemistry (RSC).
5. Scharifker, B.R., P. Zelenay, and J.O.M. Bockris, The Kinetics of Oxygen
Reduction in Molten Phosphoric Acid at High Temperatures. Journal of The
Electrochemical Society, 1987. 134(11): p. 2714-2725.
6. Weng, D., J.S. Wainright, U. Landau, and R.F. Savinell, Electro-osmotic drag
coefficient of water and methanol in polymer electrolytes at elevated
temperatures. Journal of The Electrochemical Society, 1996. 143(4): p. 1260-
1263.
7. Steam Tables. Smith son Ian 2006 [cited; Available from: www.knovel.com.
8. Vielstich, W., H. Gasteiger, and A. Lamm, Handbook of fuel cells : fundamentals,
technology and applications. 2003, Chichester: Wiley. 4 v.
9. Slattery, J.C. and R.B. Bird, Calculation of the Diffusion Coefficient of Dilute
Gases and of the Self-diffusion Coefficient of Dense Gases. J. A.I.Ch.E, 1958.
4(2): p. 137-142.
10. Scott, K., S. Pilditch, and M. Mamlouk, Modelling and experimental validation of
a high temperature polymer electrolyte fuel cell. Journal of Applied
Electrochemistry, 2007. 37(11): p. 1245-1259.
11. Parthasarathy, A., S. Srinivasan, A.J. Appleby, and C.R. Martin, Temperature
dependence of the electrode kinetics of oxygen reduction at the platinum/nafion®

250
interface - a microelectrode investigation. Journal of The Electrochemical
Society, 1992. 139(9): p. 2530-2537.
12. Liu, Z., Z. Mao, and C. Wang, A two dimensional partial flooding model for
PEMFC. Journal of Power Sources, 2006. 158(2 SPEC. ISS.): p. 1229-1239.
13. Min, C.H., Y.L. He, X.L. Liu, B.H. Yin, W. Jiang, and W.Q. Tao, Parameter
sensitivity examination and discussion of PEM fuel cell simulation model
validation. Part II: Results of sensitivity analysis and validation of the model.
Journal of Power Sources, 2006. 160(1): p. 374-385.
14. Wang, H., P. Cao, and Y. Wang, Monte Carlo simulation of the PEMFC catalyst
layer. Frontiers of Chemical Engineering in China, 2007. 1(2): p. 146-150.
15. Paulus, U.A., T.J. Schmidt, H.A. Gasteiger, and R.J. Behm, Oxygen reduction on
a high-surface area Pt/Vulcan carbon catalyst: a thin-film rotating ring-disk
electrode study. Journal of Electroanalytical Chemistry, 2001. 495(2): p. 134-145.
16. Mukerjee, S. and S. Srinivasan, Enhanced electrocatalysis of oxygen reduction on
platinum alloys in proton exchange membrane fuel cells. Journal of
Electroanalytical Chemistry, 1993. 357(1-2): p. 201-224.
17. McBreen, J., W.E.O. Grady, and R. Richter, A Rotating Disk Electrode Apparatus
for the Study of Fuel Cell Reactions at Elevated Temperatures and Pressures.
Journal of the Electrochemical Society, 1984. 131(5): p. 1215-1216.
18. Mukerjee, S. and J. McBreen, Effect of particle size on the electrocatalysis by
carbon-supported Pt electrocatalysts: An in situ XAS investigation. Journal of
Electroanalytical Chemistry, 1998. 448(2): p. 163-171.
19. Jaouen, F., G. Lindbergh, and G. Sundholm, Investigation of mass-transport
limitations in the solid polymer fuel cell cathode. I. Mathematical model. Journal
of The Electrochemical Society, 2002. 149(4): p. A437-A447.
20. Barbir, F., PEM Fuel Cells:Theory and Practice, ed. R.C. Dorf. 2005.
21. Sousa, T., M. Mamlouk, and K. Scott, An isothermal model of a laboratory
intermediate temperature fuel cell using PBI doped phosphoric acid membranes.
Chemical Engineering Science. 65(8): p. 2513-2530.
22. Sun, Y.-P. and K. Scott, An analysis of the influence of mass transfer on porous
electrode performance. Chemical Engineering Journal, 2004. 102(1): p. 83-91.

251
23. Zawodzinski Jr, T.A., T.E. Springer, J. Davey, R. Jestel, C. Lopez, J. Valerio, and
S. Gottesfeld, Comparative study of water uptake by and transport through
ionomeric fuel cell membranes. Journal of the Electrochemical Society, 1993.
140(7): p. 1981-1985.
24. Parthasarathy, A., B. Dave, S. Srinivasan, A. Appleby, and C. Martin, Platinum
microelectrode/Nafion interface: an electrochemical impedance spectroscopic
analysis of oxygen reduction kinetics and Nafion characteristics. Journal of The
Electrochemical Society, 1992. 139(6): p. 1634-1641.
25. Takamura, Y., E. Nakashima, H. Yamada, A. Tasaka, and M. Inaba. Effects of
temperature and relative humidity on Oxygen permeation in nation® and
sulfonated poly(arylene ether sulfone). in ECS Transactions. 2008.
26. Sakai, T., H. Takenaka, N. Wakabayashi, Y. Kawami, and E. Torikai, Gas
Permeation Properties of Solid Polymer Electrolyte (SPE) Membranes. Journal of
The Electrochemical Society, 1985. 132(6): p. 1328-1332.
27. Broka, K. and P. Ekdunge, Oxygen and hydrogen permeation properties and
water uptake of Nafion® 117 membrane and recast film for PEM fuel cell. Journal
of Applied Electrochemistry, 1997. 27(2): p. 117-124.

252
Chapter 9: Conclusions and future work
9.1. Conclusions
A systematic study of the synthesis and optimization of carbon-supported palladium and
palladium alloys nanoparticles is reported. A comprehensive comparative study of Pd and
state of the art Pt catalyst for ORR in polymer electrolyte membrane fuel cells is reported
in this piece of work: low and high temperature hydrogen PEMFCs and direct methanol
fuel cells.
Palladium nanoparticles supported on pre-treated Vulcan XC-72R synthesized by
reduction of ammonium tetrachloropalladate (II) with ethylene glycol in alkaline
conditions, between 10 and 13 pH units, yielded Pd particles of approximately 6 nm. The
pH, within this alkaline region, had no apparent effect on the Pd particle size.
Nanoparticles synthesized without pH control had an average size of 11 nm. Exchange
current densities estimated for all Pd/C catalysts prepared by EG reduction were all
similar and were in the interval 7.7 x 10⁻¹²
to 1.0 x 10⁻¹¹
A cm-2
Pd. Therefore, it was
concluded that the particle size, within the studied range, did not affect the ORR activity
of Pd nanoparticles prepared by EG reduction.
On the other hand, the pH of the reaction system induced a change in the dispersion of
palladium nanoparticles on the carbon surface. Dispersion of the Pd nanoparticles was
higher in basic pH, as indicated by higher ECSA and mass activity values. TEM analysis
showed particle agglomeration for all the Pd/C catalysts analysed. The least severe
agglomeration was observed for Pd/C-EG11 as evidenced in its higher mass activity, 20 A
g-2
Pd, than for Pd/C-EG, Pd/C-EG10, Pd/C-EG12 or Pd/C-EG13. A pH value of 11 was
chosen in further catalyst preparations by EG reduction, both for Pd or palladium-based
bimetallic catalysts. Carbon-supported palladium nanoparticles were also prepared on as-
received Vulcan XC-72R using ethylene glycol as a reducing agent at pH 11.

253
Characterization of this catalyst, Pd/C-untr, showed that its particle size of 7 nm its ECSA
of 15 m2 g
-1 and its exchange current density of 1.0 x 10
-11 A cm
-2 Pd were similar to
those calculated for Pd/C-EG11.
All carbon-supported palladium catalysts exhibited only one Tafel slope, in the low
current density region, with values ranging from 59 to 64 mV decade-1
. In the high
current density region a constantly changing Tafel slope was observed. This change in
Tafel slope was believed to be due to the change of the oxygen coverage of the catalyst
surface with the potential.
Heat treatment in H2 at 300 ºC caused particle growth on all carbon-supported palladium
nanocatalysts. The extension of the sintering increased with increasing temperature, in the
range from room temperature to 300 ºC, and it was more severe for smaller palladium
particles. Heat treatment caused an important loss of ECSA in each catalyst and therefore
a decrease in its mass activity. Heat treatment did not affect the activity towards ORR of
the Pd catalyst: kinetic parameters calculated for Pd/C-EG-300 did not differ significantly
from those of Pd/C-EG.
The Pd-Pd bond distance was estimated from XRD patterns (Scherrer equation) and its
values used to determine whether a palladium-metal alloy had been formed. Introduction
of any other metal atoms in the Pd lattice would cause distortion of the crystal structure
since different atoms have different sizes. The Pd-Pd bond length for pure carbon-
supported Pd was estimate from a large number of samples and found to have an average
value of 0.2751 nm, with an associated error of 0.0003 nm. A bond distance value outside
the interval 0.2751 ± 0.0006 nm (200% of error) was the criterion used to consider that
palladium-metal alloy was formed.
Palladium-gold alloys were formed only when both metals were co-deposited and
reduced in ethylene glycol at 110 ºC, no when Au was reduced on Pd/C. Subsequent heat
treatment at 300 ºC under H2 flow increased the extent of the alloy in co-deposited
catalysts. In electrocatalysts prepared by depositing gold on Pd/C, it was observed that
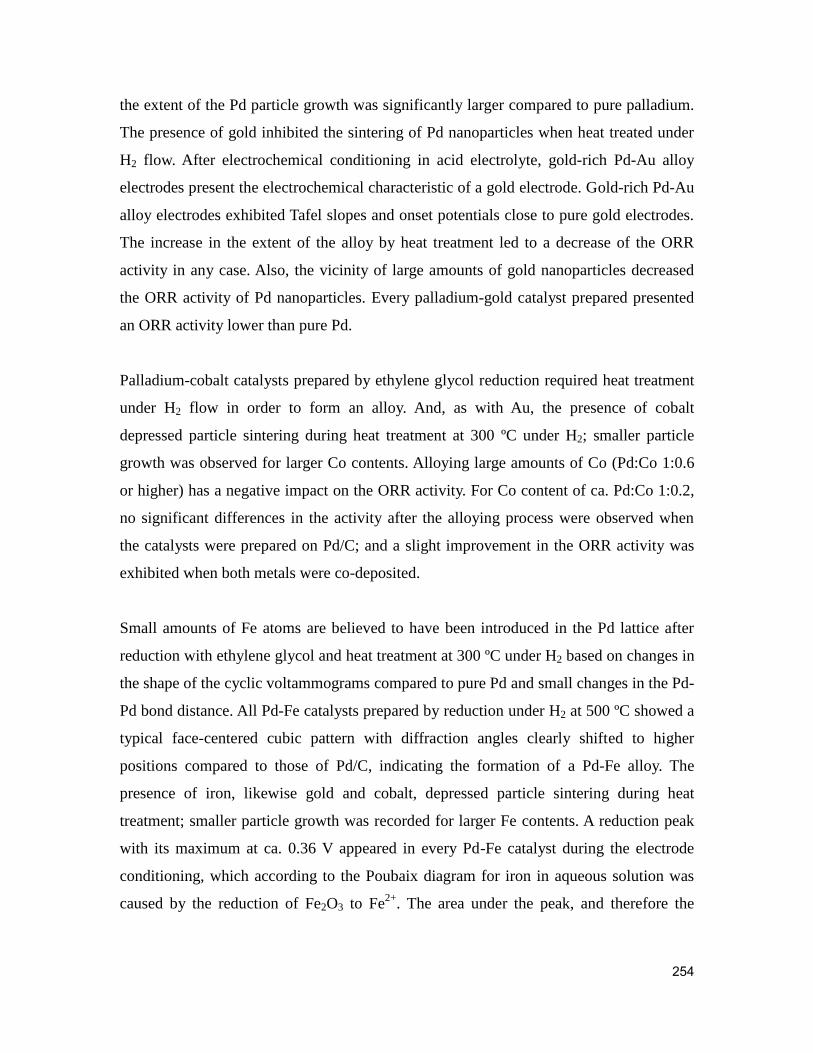
254
the extent of the Pd particle growth was significantly larger compared to pure palladium.
The presence of gold inhibited the sintering of Pd nanoparticles when heat treated under
H2 flow. After electrochemical conditioning in acid electrolyte, gold-rich Pd-Au alloy
electrodes present the electrochemical characteristic of a gold electrode. Gold-rich Pd-Au
alloy electrodes exhibited Tafel slopes and onset potentials close to pure gold electrodes.
The increase in the extent of the alloy by heat treatment led to a decrease of the ORR
activity in any case. Also, the vicinity of large amounts of gold nanoparticles decreased
the ORR activity of Pd nanoparticles. Every palladium-gold catalyst prepared presented
an ORR activity lower than pure Pd.
Palladium-cobalt catalysts prepared by ethylene glycol reduction required heat treatment
under H2 flow in order to form an alloy. And, as with Au, the presence of cobalt
depressed particle sintering during heat treatment at 300 ºC under H2; smaller particle
growth was observed for larger Co contents. Alloying large amounts of Co (Pd:Co 1:0.6
or higher) has a negative impact on the ORR activity. For Co content of ca. Pd:Co 1:0.2,
no significant differences in the activity after the alloying process were observed when
the catalysts were prepared on Pd/C; and a slight improvement in the ORR activity was
exhibited when both metals were co-deposited.
Small amounts of Fe atoms are believed to have been introduced in the Pd lattice after
reduction with ethylene glycol and heat treatment at 300 ºC under H2 based on changes in
the shape of the cyclic voltammograms compared to pure Pd and small changes in the Pd-
Pd bond distance. All Pd-Fe catalysts prepared by reduction under H2 at 500 ºC showed a
typical face-centered cubic pattern with diffraction angles clearly shifted to higher
positions compared to those of Pd/C, indicating the formation of a Pd-Fe alloy. The
presence of iron, likewise gold and cobalt, depressed particle sintering during heat
treatment; smaller particle growth was recorded for larger Fe contents. A reduction peak
with its maximum at ca. 0.36 V appeared in every Pd-Fe catalyst during the electrode
conditioning, which according to the Poubaix diagram for iron in aqueous solution was
caused by the reduction of Fe2O3 to Fe2+
. The area under the peak, and therefore the

255
amount of Fe2O3, was larger in unalloyed catalysts. This indicated leaching of the iron
under potential cycling conditions.
All palladium-iron catalysts presented ORR activities lower than Pd/C. Introduction of
iron in the palladium lattice was found to be detrimental to the ORR, contradicting work
published by Shao et al. The highest activities within the Pd-Fe catalysts were exhibited
by those prepared on Pd/C. The biggest losses in ORR activity compared to Pd/C where
exhibited by catalysts with high iron content (Pd:Fe 3:1).
No significant changes in the Pd-Pd bond distance, compared to Pd/C, were observed for
palladium-titanium catalyst prepared either by ethylene glycol reduction, before or after
heat treatment at 300 ºC in H2, or by reduction in H2 at 900 ºC. However, the average Pd-
Pd bond distance for catalysts synthesized by reduction in H2 at 900 ºC was 0.2747 nm,
lower than that of Pd/C by 0.0004 nm. Since Fernández et al. claimed the formation of
Pd-Ti alloy based on small shifts in the XRD patterns, the presence of some Pd-Ti alloy
could not be completely discarded. The presence of TiO2 in its anatase form was easily
identified from the XRD patters in all Pd-Ti catalysts with high titanium content;
catalysts with lower Ti content are also believed to include small amounts of anatase. The
presence of TiO2 did not depress the sintering of Pd nanoparticles during heat treatment
in H2.
Pd-Ti catalysts prepared by EG reduction without heat treatment presented ORR
activities close to Pd/C, independently of the amount of TiO2 present. This activity
decreased after heat treatment at 300 ºC in H2, which was believed to introduce some Ti
in the Pd lattice. Catalysts synthesized at high temperatures (900 ºC in H2) presented
lower ORR when the Ti content was high (Pd:Ti 1:1) compared to those with low Ti
content (Pd:Ti 9:1). All Pd-Ti catalysts exhibited lower catalytic activity than Pd/C.
In summary, the presence of Au, Co and Fe decrease the degree of sintering of Pd
nanoparticles; the present of Ti did not affect Pd particle growth. Only Pd-Au and Pd-Co
exhibited alloy formation using ethylene glycol as the reducing agent, in the case of Co

256
heat treatment at 300 ºC under H2 flow was necessary to form the alloy. Pd-Fe alloys
were only identifiable after reduction at 500 ºC in H2. No Pd-Ti catalysts exhibited clear
alloy formation with any synthetic conditions. Only Pd-Co alloys with atomic ratio Pd:Co
4:1, synthesized by ethylene glycol reduction and after heat treatment at 300 ºC under H2
flow, exhibited improved ORR activity compared to Pd/C.
Carbon supported Pd nanoparticles prepared by reduction by ethylene glycol at pH 11
were tested in a low temperature fuel cell as cathode material and its performance
compared to the state of the art commercial Pt/C. For the same metal loading, the Pt
cathode performed better than the Pd, although due to its higher activation energy Pd
performance was closer to Pt at higher temperature. Operating on air at 40 ºC the current
densities at 0.65 V (53% efficiency) for Pd and Pt MEAs were 0.13 and 0.24 A cm-2
,
respectively.
Since Pd is considerably cheaper than platinum, the use of larger amounts of Pd in the
cathode would still be economically advantageous. MEA with Pd loading in the cathode
of 1.0 mg cm-2
was prepared and compared with MEAs with cathode loadings of 0.6 mg
cm-2
of Pd and Pt. The increase of the catalyst loading led to a sharp increase on the
kinetics of the ORR and therefore of the cell performance, although severe mass transport
effects were observed in the high current density region due to the thickness of the
catalyst layer. At feasible operating conditions, 40 ºC and operating on air, Pd MEA (1.0
mg cm-2
) overtook Pt MEA (0.6 mg cm-2
), showing current densities at 0.65 V of 0.14
and 0.12 A cm-2
, respectively.
Pd4Co-EG11-300, presented an increased OCP and smaller kinetic losses compared to the
Pd-EG11 when it was used as cathode material. Overall, the Pd-Co MEA presented
improved performance at 20 and 40 ºC compared to the Pd MEA. Operating on air at 40
ºC current densities at 0.65 V for Pd and PdCo MEAs were 0.13 and 0.21 A cm-2
,
respectively.
Pd/C prepared by reduction by ethylene glycol at pH 11 was also tested as the cathode

257
catalyst in a high temperature fuel cell and its performance compared to commercial Pt/C.
Operating on air at 120 ºC current densities at 0.65 V for Pd and Pt MEAs were 0.04 and
0.09 A cm-2
, respectively. In the temperature range from 120 to 175 ºC the Pt MEA
performance failed to increase due to phosphoric acid properties: decrease of the oxygen
solubility and increase of its viscosity. Pd MEA showed declining performance in the
same temperature range due to instability of palladium nanoparticles in these harsh
operating conditions.
Pd-EG11 was tested as a cathode catalyst in a direct methanol fuel cell and its
performance was compared to a commercial Pt/C. Cell performance was compared at
methanol concentrations of 1, 3, 5 and 7M and temperatures 20, 40 and 60 ºC.
Anode potential vs current density curves showed how anode performance increased with
increasing temperature and methanol concentration. This did not always reflect on the
overall cell performance due to methanol crossover to the cathode. The effect of
methanol crossover was more severe for the Pt cathode due to its higher activity towards
the methanol oxidation reaction.
Despite its lower electrochemical surface area palladium overtook platinum as cathode
catalyst at suitable operating conditions for a DMFC. Current densities at 400 mV
exhibited by the palladium MEA were higher than for platinum at 60 ºC with a methanol
concentration 5M or higher. This makes Pd an adequate substitute to Pt due to its lower
price. Moreover, since the effect of crossover would be more severe for Pt at lower
cathode loadings (lower ORR current) Pd would advantage Pt at methanol concentrations
even lower than 5M obtained (equal performance at low current densities with 2 mg cm-1
cathode loading).
The assumption of the existence of an electrolyte thin film was necessary for the model to
predict the mass transport limitations with air operation observed in the experimental
results.

258
The model closely matched fuel cell experimental data with oxygen operation; however it
overestimated performance with air operation, especially at high current densities. This
failure of the model was attributed to oxygen starvation, and was explained by losses in
the active electrochemical surface area. To enhance the model accuracy a new concept,
apparent reaction order (Γ), was introduced to explain the need of a higher reaction order
to fit experimental data. Apparent reaction order was taken for air operation at 20, 40 and
60 ºC as 1.5, 1.75 and 2, respectively.
The model closely predicted experimental results at 20 and 40 ºC. At 60 ºC a lower
permeability value was employed according with the lower humidity measured
experimentally. Above 40 ºC cell performance did not improve experimentally and that
was predicted by the model. This lack of improvement was attributed to the decrease of
oxygen permeability through Nafion® and consequent reduced oxygen concentration at
the catalyst surface, which countered any kinetic enhancement with the temperature
increase.
The increase of the metal loading in the cathode enhanced fuel cell performance in the
low current density range; however, severe mass transport limitation appeared. Predicted
results showed that this could be solved by increasing the loading without increasing the
catalyst layer thickness, which can be practically achieved by increasing the metal
content of the carbon-supported catalyst.
In summary, Pd/C prepared by ethylene glycol reduction at pH 11 is a suitable substitute
for Pt in low temperature PEMFC and in DMFC applications. In PEMFCs a higher
cathode loading is required to match Pt performance, however, this is still advantageous
due to the significant lower cost of Pd. In DMFCs Pd cathodes overtake Pt cathodes with
the same loading at methanol concentrations equal or higher than 5M with air operation
at 60 ºC.

259
9.2. Future work
Palladium is a very promising cathode catalyst for DMFC since the effect of crossover is
less severe than in platinum. Pd has shown advantage over Pt at methanol concentrations
of 5M and above with metal loading of 2 mg cm-2
. At lower metal loading the methanol
crossover effect would become more severe and palladium should outperform Pt at
methanol concentrations lower than 5M.
While studies on palladium used as a membrane composite for DMFC to reduce
crossover through the membrane have been published [1, 2], there is no solid study of its
use as DMFC cathode materials. Future comparative studies of Pd and Pt cathodes with
lower metal content and long term stability would be beneficial to support Palladium use
in DMFC. Numerous studies investigated the use of platinum bimetallic alloys in DMFC
cathodes and reported higher methanol tolerance in comparison with pure platinum [3],
however, there is a limited amount of literature available on the use of palladium alloys
for DMFC [4, 5] and therefore further studies are needed to investigate their potential and
methanol tolerance.
The use of alternative Pd precursors, e.g. PdCl2, might lead to a better dispersion of Pd
nanoparticles on the carbon support and thus to a higher catalytic active area. The
investigation might lead to a substitute to ammonium tetrachloropalladate (II) resulting in
Pd nanoparticles with less agglomeration on the carbon surface. The effect of catalyst
support should also be considered (different carbon, carbon pre-treatment, alternative
materials, etc), since catalyst-support interaction influences its catalytic activity, and
support type affects Pd crystallography and particle size.
Based on the model predictions for low temperature PEMFC, a thinner cathode catalyst
layer would provide higher cell performance over a wider current range when high metal
loading was used. This can be achieved by using a catalyst with a higher metal to carbon
ratio. It would therefore be interesting to explore the synthesis and characterization of
carbon-supported Pd nanoparticles with higher metal content, 40 or 50% weight metal.

260
Pd activity towards the ORR did not always increase with deceasing particle size, rather
it showed instability at particle sizes of approximately 3 nm (Pd/C commercial). An
optimum particle size is believed to exist for electrocatalysts, this has already been
reported for Pt to be ca. 3.5 nm for ORR [6], a future study would be needed to determine
similar value for Pd. It also would be important to determine which crystal type is the
most active for the ORR in palladium in acid media (for Pt crystal (110) has been
reported to have the highest activity in sulphuric and phosphoric acid solutions [7, 8]).
Carbon-supported Pd nanoparticles could also be tested in other types of fuel cells such
as alkaline or microbial fuel cells.

261
References
1. Choi, W.C., J.D. Kim, and S.I. Woo, Modification of proton conducting
membrane for reducing methanol crossover in a direct-methanol fuel cell. Journal
of Power Sources, 2001. 96(2): p. 411-414.
2. Ma, Z.Q., P. Cheng, and T.S. Zhao, A palladium-alloy deposited Nafion
membrane for direct methanol fuel cells. Journal of Membrane Science, 2003.
215(1-2): p. 327-336.
3. Baglio, V., A. Stassi, A. Di Blasi, C. D'Urso, V. Antonucci, and A.S. Aricò,
Investigation of bimetallic Pt-M/C as DMFC cathode catalysts. Electrochimica
Acta, 2007. 53(3): p. 1360-1364.
4. Mustain, W.E., K. Kepler, and J. Prakash, CoPdx oxygen reduction
electrocatalysts for polymer electrolyte membrane and direct methanol fuel cells.
Electrochimica Acta, 2007. 52(5): p. 2102-2108.
5. Sarkar, A., A.V. Murugan, and A. Manthiram, Synthesis and Characterization of
Nanostructured Pd−Mo Electrocatalysts for Oxygen Reduction Reaction in Fuel
Cells. The Journal of Physical Chemistry C, 2008. 112(31): p. 12037-12043.
6. Sattler, M.L. and P.N. Ross, The surface structure of Pt crystallites supported on
carbon black. Ultramicroscopy, 1986. 20(1-2): p. 21-28.
7. El Kadiri, F., R. Faure, and R. Durand, Electrochemical reduction of molecular
oxygen on platinum single crystals. Journal of Electroanalytical Chemistry, 1991.
301(1-2): p. 177-188.
8. Gasteiger, H.A. and P.N. Ross, Oxygen Reduction on Platinum Low-Index Single-
Crystal Surfaces in Alkaline Solution: Rotating Ring DiskPt(hkl) Studies. The
Journal of Physical Chemistry, 1996. 100(16): p. 6715-6721.

262
Appendix A
Carbon-supported Pd-Co-Au was prepared by a reverse microemulsion method following
the synthetic method reported in the publication of Fernández et al. [1]. The catalyst was
used to prepare a gas diffusion electrode which was evaluated for oxygen reduction
reaction in O2 saturated 0.5M H2SO4 solution. The catalyst layer was sprayed on a
commercial gas diffusion layer, a low temperature microporous layer (GDL LT 1200-W,
from E-Tek). The catalyst ink was prepared by mixing in an ultrasonic bath the carbon-
supported catalyst with Nafion® in a water-ethanol (66% volume of ethanol) solution for
0.5 hours. The amount of Nafion® in the catalyst ink was 20% of the catalyst weight. 0.5
mg of metal where deposited per cm2 of electrode. A gas diffusion electrode with
commercial Pt/C as catalysts was prepared following the same procedure; potential-
current curves exhibited by both electrodes are compared in Figure A-31.
-45
-40
-35
-30
-25
-20
-15
-10
-5
0
0.2 0.3 0.4 0.5 0.6 0.7 0.8 0.9 1
j / m
A c
m-2
E / V (vs NHE)
PdCoAu/C
Pt/C-Etek
Figure A-31: Linear sweep voltammograms of gas diffusion electrodes of commercial Pt/C from
E-tek and homemade PdCoAu/C.
Onset potentials were 0.97 V for commercial Pt/C and 0.83 V vs NHE for PdCoAu/C.
Current density compared at 0.6 V was four times bigger for commercial Pt/C than for
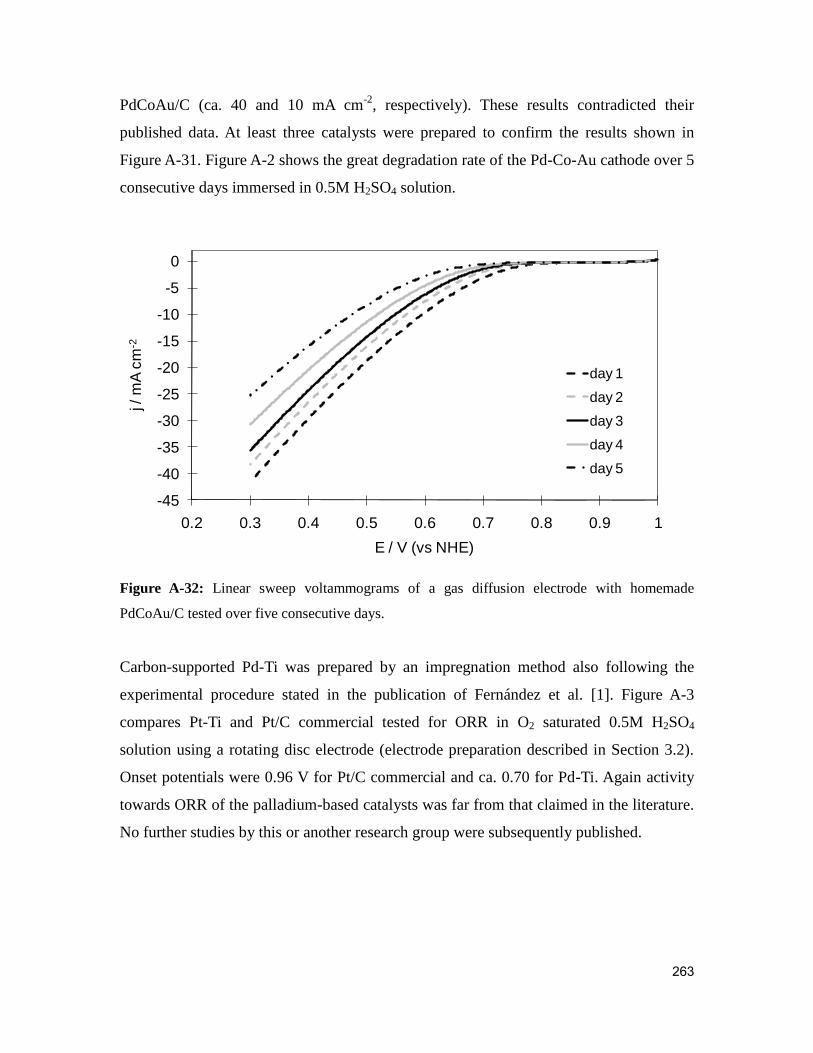
263
PdCoAu/C (ca. 40 and 10 mA cm-2
, respectively). These results contradicted their
published data. At least three catalysts were prepared to confirm the results shown in
Figure A-31. Figure A-2 shows the great degradation rate of the Pd-Co-Au cathode over 5
consecutive days immersed in 0.5M H2SO4 solution.
-45
-40
-35
-30
-25
-20
-15
-10
-5
0
0.2 0.3 0.4 0.5 0.6 0.7 0.8 0.9 1
j / m
A c
m-2
E / V (vs NHE)
day 1
day 2
day 3
day 4
day 5
Figure A-32: Linear sweep voltammograms of a gas diffusion electrode with homemade
PdCoAu/C tested over five consecutive days.
Carbon-supported Pd-Ti was prepared by an impregnation method also following the
experimental procedure stated in the publication of Fernández et al. [1]. Figure A-3
compares Pt-Ti and Pt/C commercial tested for ORR in O2 saturated 0.5M H2SO4
solution using a rotating disc electrode (electrode preparation described in Section 3.2).
Onset potentials were 0.96 V for Pt/C commercial and ca. 0.70 for Pd-Ti. Again activity
towards ORR of the palladium-based catalysts was far from that claimed in the literature.
No further studies by this or another research group were subsequently published.

264
-7
-6
-5
-4
-3
-2
-1
0
0.2 0.3 0.4 0.5 0.6 0.7 0.8 0.9 1E / V (vs NHE)
j /
mA
cm
-2
Pt/C-Etek
PdTi-H2-900
Figure A-33: Linear sweep voltammograms of a rotating disk electrode with commercial Pt/C
and PdTi-H2-900.
References
1. Fernández, J.L., V. Raghuveer, A. Manthiram, and A.J. Bard, Pd-Ti and Pd-Co-Au
Electrocatalysts as a Replacement for Platinum for Oxygen Reduction in Proton
Exchange Membrane Fuel Cells. Journal of the American Chemical Society,
2005. 127(38): p. 13100-13101.

265
Appendix B
List of publications
Oral presentations:
1. Scientific Advances in Fuel Cell Systems, Confederation of Danish Industries,
Copenhagen, Denmark, 8-9 October 2008
2. International Energy Agency Meeting, ICT Pfinztal, Germany, 8-9 December 2008
3. Supergen Fuel Cell Symposium, Notingham University, UK, 13 November 2008
4. Postgraduate Research Conference, Newcastle University, UK 10-11 April 2008
5. International Energy Agency Meeting, TU Graz, Austria, 22-23 November 2007
6. Supergen Fuel Cell Annual Meeting, St. Andrews University, UK, 12-13 November
2007
7. Supergen Fuel Cell Symposium, Notingham University, UK, April 2007
8. Supergen Fuel Cell Symposium, Imperial College London, UK, 13 November 2006
Poster presentations:
9. Sustainable Energy UK: Meeting the science and engineering challenge, St Anne‟s
College, Oxford, UK, 13 May 2008
10. Hydrogen and fuel cells: for a low carbon future, National Exhibition Centre,
Birmingham, UK, 2 April 2008
11. Industrial Advisory Board Meeting, Newcastle University, UK, 30 October 2007
12. Electrochem 07, Imperial College London, UK, 3-4 September 2007