palletization method for oversized part stacking with an
TRANSCRIPT

i
Palletization Method for Oversized Part Stacking with an Industrial Robotic Arm
by
Matthew Driedger
A Thesis submitted to the Faculty of Graduate Studies of
The University of Manitoba
in partial fulfilment of the requirements of the degree of
MASTER OF SCIENCE
Department of Mechanical Engineering
University of Manitoba
Winnipeg
Copyright © 2017 by Matthew Driedger

i
Abstract
This work explores a novel palletization strategy for an industrial robot that allows parts to
overhang from the edges of a bin while maintaining stack stability. This allows the palletizing of
a larger number of parts than non-overhang methods and for palletizing parts larger than the
pallets themselves. An increased emphasis was placed on stack stability and new methods of
stability analysis were developed. The resulting methodology was applied to the palletization of
cut-lumber parts for a wooden truss manufacturer. The method was simulated in Unity and tested
on a robotic cell at the University of Manitoba Automation Laboratory. Based on these tests, the
method was found to be capable of volume utilization efficiencies of over 105% +/- 5% when
using traditional metrics, or 71%+/-3% when using in-bin volume utilization: a new metric
developed in this thesis. The results of this work, as reported in this thesis, are very promising.

Palletization Method for Oversized Part Stacking with an Industrial Robotic Arm
ii
Acknowledgements
Firstly, I would like to express my sincere gratitude to my advisor Dr. Subramaniam
Balakrishnan for allowing me to be a part of his research at the University of Manitoba and for
his mentorship and support during my studies and research.
I would like to acknowledge All Fab Building Components and the National Research Council,
who jointly funded this work.
I would also like to thank:
• The other members of my thesis committee, Dr. Qingjin Peng and Dr. Ruppa Thulasiram
• David Tataryn, who’s guidance and tireless work was critical to the success of this project.
• Erik Johnson, for his patience and help in tutoring me in programming.
• Viridiana Ureña Ramírez, for her help in editing and guidance during the writing of this
thesis.
• Andrew Gadsby Pauls, Adam Roscoe, and Curtis Matthews for their support and friendship.
• To the entire UMSATS team, including Greg Linton, David Stewart, Sean Iftody, Jon Duran,
Chantelle Dubois, Valorie Platero, Aleksa Svitlica, Isaac Malo, Graham Rigby, Morgan
Taverner and many more for the adventures, late nights, learning and discoveries that we
have shared.
• Finally, I would like to thank my parents for their encouragement, love, and support
throughout my masters degree and my life in general.

Palletization Method for Oversized Part Stacking with an Industrial Robotic Arm
iii
Dedication To my parents Fred and Lori, for their encouragement and love throughout my life.

Palletization Method for Oversized Part Stacking with an Industrial Robotic Arm
iv
Contents Abstract ............................................................................................................................................ i
Acknowledgements ......................................................................................................................... ii
Dedication ...................................................................................................................................... iii
List of Tables .................................................................................................................................. v
List of Figures ................................................................................................................................. v
Chapter 1. Problem Statement ................................................................................................ 1
Chapter 2. Introduction ............................................................................................................... 3
2.1. Background ...................................................................................................................... 3
2.1.1. Programming of Industrial Robots............................................................................ 6
2.2. Palletizing ......................................................................................................................... 7
2.2.1. Bin Packing ............................................................................................................... 7
2.2.2. Verification and Assessment..................................................................................... 9
2.2.1. Bin Packing Assessment Methods .......................................................................... 11
2.2.2. Stability Assessment ............................................................................................... 15
2.3. Case Study: Truss Manufacturing .................................................................................. 17
Chapter 3. Methodology ........................................................................................................... 20
3.1. Assumptions and Design Choices: ................................................................................. 21
3.1.1. Minimum Contact Numbers ................................................................................... 23
3.2. Placement Algorithm...................................................................................................... 24
3.2.1. Collision Detection ................................................................................................. 26
3.3. Stability Algorithm ......................................................................................................... 29
3.3.1. Stability Assessment ............................................................................................... 29
3.3.2. Local and Global Stability ...................................................................................... 34
3.3.3. Two-Dimensional Stability ..................................................................................... 35
3.3.4. Stability Method...................................................................................................... 37
Chapter 4. Implementation ....................................................................................................... 40
4.1. Simulation ...................................................................................................................... 40
4.2. Assessment Methods ...................................................................................................... 43
4.3. Physical Testing ............................................................................................................. 44
Chapter 5. Results ..................................................................................................................... 47

Palletization Method for Oversized Part Stacking with an Industrial Robotic Arm
v
5.1. Statistical Data Set Simulation Results .......................................................................... 47
5.2. Published Data Set Simulations ..................................................................................... 54
5.3. Physical Testing Results................................................................................................. 60
Chapter 6. Discussion ............................................................................................................... 62
6.1. Overall System Performance .......................................................................................... 62
6.1. Optimizing the Stability Threshold: ............................................................................... 63
6.2. Effects of Varying Minimum Contact Numbers ............................................................ 65
6.2.1. Effectiveness vs Previous Works ............................................................................ 65
Chapter 7. Conclusion and Recommendations ......................................................................... 69
7.1. Conclusion ...................................................................................................................... 69
7.2. Recommendations .......................................................................................................... 70
References ..................................................................................................................................... 72
List of Tables
Table 1: Common Types of Robotic Arms ..................................................................................... 4
Table 2: Benchmark Data Sets ...................................................................................................... 12
Table 3: Bischoff Ratcliff and Davies Bischoff Algorithm Results with Stability (%)................ 13
Table 4: Bischoff Ratcliff and Davies Bischoff Algorithm Results without Stability (%) .......... 14
Table 5: Summarized Simulation Results for Stacking Efficiency .............................................. 48
Table 6: Experimental Results Using BR Data Sets ..................................................................... 55
List of Figures
Figure 1: Common Motion Types................................................................................................... 5
Figure 2: KUKA Teach Pendant ..................................................................................................... 6
Figure 3: No Overhang vs Overhang ............................................................................................ 17
Figure 4: Roof Trusses .................................................................................................................. 18
Figure 5: Cell Setup (Not to Scale) ............................................................................................... 18
Figure 6: Algorithm Process Flow Chart ...................................................................................... 20
Figure 7: Part Bounding Box Simplification ................................................................................ 22
Figure 8: Left Side Placement Search ........................................................................................... 24
Figure 9: Right Side Placement Search ........................................................................................ 25

Palletization Method for Oversized Part Stacking with an Industrial Robotic Arm
vi
Figure 10: Packing Algorithm Flowchart ..................................................................................... 26
Figure 11: Collision Avoidance .................................................................................................... 27
Figure 12: Effect of a Vertical Disturbance Force ........................................................................ 30
Figure 13: Laterally Disturbed Partially Supported Part .............................................................. 30
Figure 14: Stability, Distance, and Area ....................................................................................... 31
Figure 15: Two-Quadrant One Dimensional Stability .................................................................. 32
Figure 16: Maximum One Dimensional Stability Factor ............................................................. 33
Figure 17: Global vs Local Stability ............................................................................................. 34
Figure 18: Two Dimensional Stability .......................................................................................... 36
Figure 19: Two Dimensional Maximum Stability Factor ............................................................. 37
Figure 20: Stacking Algorithm Flowchart .................................................................................... 38
Figure 21: Six Simulated Part Stacks in Unity ............................................................................. 41
Figure 22: Octopuz Path Planning Simulation.............................................................................. 41
Figure 23: Part Histogram ............................................................................................................. 42
Figure 24: Test Cell Layout .......................................................................................................... 45
Figure 25: Three Palletized Part Assemblies ................................................................................ 46
Figure 26: Average Volume Utilization ....................................................................................... 50
Figure 27: Average In Bin Volume Utilization ............................................................................ 51
Figure 28: Average Bin Density Utilization ................................................................................. 52
Figure 29: Average In Bin Density Utilization ............................................................................. 53
Figure 30: BR Volume Efficiency ................................................................................................ 57
Figure 31: BR In-Bin Volume Efficiency ..................................................................................... 58
Figure 32: BR In-Bin Density Efficiency ..................................................................................... 58
Figure 33: BR Density Efficiency................................................................................................. 59
Figure 34: Completed Truss Assemblies in Test Cell .................................................................. 60
Figure 35: Simulated (Left) and Physically Tested (Right) Truss Assembly ............................... 61
Figure 36: Part Count vs Computation Time ................................................................................ 63
Figure 37: Average Volume Efficiencies for BR Literature with Stability Methods ................... 66
Figure 38: Average Volume Efficiencies for BR Literature without Stability Methods .............. 67

1
Chapter 1. Problem Statement
Past palletization solutions have not considered palletizing parts larger than the pallet itself or
placing parts outside of the pallet boundaries. In fact, this gap extends to published research on
bin packing as a whole. As discussed in the case study described in Chapter 2, there is a clear
need for this form of palletization that has not yet been addressed. To this end, this research aims
to develop a novel palletization method to stack oversized parts (i.e. with dimensions larger than
the bin itself) and to allow parts to overhang beyond bin boundaries to increase the allowable
usage of the bin itself. To achieve these goals, the following works were undertaken:
• Develop a bin packing algorithm that allows parts to exceed bin boundaries while
maintaining a compact stack in which at least 30 parts can be placed. To meet the needs
of the case study, the algorithm must be capable of stacking parts for multiple trusses on
different bins based on their parent assembly.
• Develop a method of assessing placement stability for the above algorithm to ensure
placed parts will not shift or fall.
• Simulate the combined bin packing and stability method in a virtual environment to
validate the method’s performance and to create a path file that is readable by an
industrial robotic arm.
• Test the above algorithms using a scaled physical implementation to confirm the
method’s effectiveness.
Chapter three of this thesis introduces the methodology developed for the palletization solution,
including the assumptions and design choices made to perform bin packing and how stability is
assessed. Chapter four details the implementation of the palletization method, including
simulations, assessment, and the physical testing apparatus. The results of these tests are

Palletization Method for Oversized Part Stacking with an Industrial Robotic Arm
2
presented in Chapter five and discussed in Chapter six. Finally, Chapter seven summarizes and
concludes this thesis and highlights areas for future work.

Palletization Method for Oversized Part Stacking with an Industrial Robotic Arm
3
Chapter 2. Introduction
2.1. Background
Industrial automation has become a cornerstone of modern manufacturing; increasing
productivity, quality, and uniformity while reducing labour costs by replacing human operators
with autonomous machines. These machines can take many shapes and automated systems can
include both custom-designed and commercially available elements. Of these commercial
systems, industrial robotic arms are one of the most common solutions in industrial automation
[1]. With sales consistently increasing internationally from 2012 to 2016, industrial robotic arms
are becoming increasingly prevalent in manufacturing environments [2]. These arms are most
commonly used to automate processes that are highly repeatable and repetitive with little to no
possible variation, such as painting automobiles on an assembly line or unloading/loading of
parts from a variety of machines.
Industrial robots come in a number of different configurations and are classified based on the
number and types of articulated joints, which are used to control the position and orientation of
its hand (commonly referred to as an end effector or gripper). Each joint adds an additional
degree of freedom to the robot and can be characterized as revolute or prismatic. Revolute (or
rotary) joints allow an arm to rotate along a single axis while prismatic (or linear) joints allow an
arm to translate or slide along an axis. Common types of industrial robots are summarized in
Table 1 below [3]. Of these types of arms, articulated robots with 6 rotary joints are the most
commonly used in industry.

Palletization Method for Oversized Part Stacking with an Industrial Robotic Arm
4
Table 1: Common Types of Robotic Arms
Type Minimum
Number of
Joints
Types of Joints
Cartesian/
Gantry
3 Prismatic
Cylindrical 3 Revolute base and two second
prismatic joints
Spherical/
Polar
3 Revolute base with one
prismatic and a second revolute
joint
SCARA 3 A prismatic joint at the end of
two revolute joints
Articulated 2 Revolute
Based on the robots joint configuration, a set of parameters can be defined for each linkage
which describes a reference frame at each joint. These parameters, known as Denavit–
Hartenberg (DH) parameters, can then be used to create the specific forward and inverse
kinematic equations for a robot [3]. Forward kinematics are used to calculate the position and
orientation of an arm’s end effector based on a given set of joint positions. Conversely, reverse

Palletization Method for Oversized Part Stacking with an Industrial Robotic Arm
5
kinematics can be used to determine the required joint states to position the end effector at a
desired position and orientation. For commercial robots, the DH parameters are already defined
and the resulting forward and inverse kinematic equations are processed by the robots control
unit. To control these robots, input commands are given which define points that the robot must
move to and the types of motions used to move between these points, as seen in Figure 1
below.
Motion Motion Type
P1-P2 Point-to-Point/Joint
P2-P3 Linear
P3-P4 Circular Interpolated
P4+ Continuous Path
Figure 1: Common Motion Types
As seen in Figure 1, point-to-point motions move in a smooth path from the starting to end
positions based on a number of parameters including allowable joint speed, maximum allowable
joint motion, and travel time. These motions tend to be faster and have a low risk of singularities
(i.e., points along a motion-path that are not reachable by the arm). Conversely, linear motions
have a higher risk of singularities and are typically slower as the arm moves in a straight path
from the start to end positions. Circularly interpolated paths follow an arc from the start to end
positions as defined by a centre position. In addition to these motion types, continuous path
motions can also be implemented. For these motions, a user defines the path trajectory which the
robotic controller then segments into many intermediate points [4]. Any motion path developed
for an industrial arm will utilize these motion types.

Palletization Method for Oversized Part Stacking with an Industrial Robotic Arm
6
2.1.1. Programming of Industrial Robots
In most automation solutions, a technologist will manually pre-program a robotic arm’s required
path planning using a teach pendant, such as the one seen in Figure 2 below. These fixed path
programs are then called upon as needed using a second script that is run on a programmable
logic controller (PLC).
Figure 2: KUKA Teach Pendant
However, not all automated tasks can use these pre-programmed path solutions. In situations
where the location, size, quantity, or destination of objects are not fixed, fixed path planning
becomes less ideal. Multiple pre-programmed paths may be able to accommodate these

Palletization Method for Oversized Part Stacking with an Industrial Robotic Arm
7
scenarios, where a small amount of variation is present. As variation increases, pre-programmed
path planning becomes untenable. One common target of automation that can have a large
degree of variation is palletizing.
2.2. Palletizing
In automation, palletizing refers to the loading goods onto a pallet or cart for shipping or for
transport to a different area of a facility [5]. Palletization problems are subcategorized as
‘Manufacturer’s Pallet Packing’ and ‘Distributor’s Pallet Packing’ based on part homogeneity.
Manufacturer’s Pallet Packing problems consider only boxes with the same dimensions, often
seen when a manufacturer is loading a single type of product onto a pallet for shipping.
Meanwhile, the distributor problem considers parts with multiple possible dimensions. This
scenario often occurs when a distribution centre packages a variety of products for shipping to a
retailer. Manufacturer problems tend to be easier to automate as there is no variation and a single
solution can be applied to all loading instances. On the contrary, an optimized solution for a
distributor problem often cannot be used for subsequent bins due to part dimension variability
[6].
In instances with constant quantity, size, and placements of parts, palletization path planning can
be programmed manually. However, even for manufacturers problems, manual programming can
be impractical for large quantities of parts.
2.2.1. Bin Packing
When a palletization problem cannot be solved through manual programming, a mathematically
based solution is required. These solutions are one application of bin packing problems: the
challenge of fitting many objects into a set volume -referred to as a bin- with a minimum amount
of wasted space. It is not possible to develop an exact algorithm to optimally solve a given bin

Palletization Method for Oversized Part Stacking with an Industrial Robotic Arm
8
packing problem for objects with more than one dimension. As such, a multitude of
approximation methods have been developed.
Bin packing is a non-deterministic polynomial-time hard (NP hard) problem, meaning that an
exact solution is typically too computationally intensive to be practically implemented. As such,
a multitude of placement methods have been developed. These methods usually use at least one
of the following optimization techniques: guillotine cuts, knapsacking, simulated annealing, and
heuristic methods [7] [8] [9].
Guillotine Cuts repeatedly break bins down into smaller areas, allowing for more comprehensive
searches for optimal solutions within each cut, thereby increasing packing efficiency.
Knapsacking assigns weights and values to objects to pack the most value within a bin as
possible, increasing packing efficiency and also allowing for object prioritization [10]. Simulated
annealing uses semi-random search methods to find globally optimum solutions. Hyper-
heuristics select the best object placement choice from several concurrently running heuristic
methods, as shown by Lopez-Camacho et al. and Hong et al. [11] [9]. By choosing the best
results from multiple methods, a higher average packing efficiency is produced but the
processing time required to find a solution is also increased.
Some of the most commonly used heuristic methods include layer building, wall building, corner
placements, and maximal space placements [12]. Layer building focuses on building incremental
layers starting on the bottom of the bin. Once a layer is filled, the method focuses on building a
new layer on top of the highest existing layer. While this method can be used for strongly
heterogeneous parts, it is best implemented when parts have uniform heights [12]. In contrast,
wall building techniques focus on creating multiple walls upward on the base of the bin. The
wall method is better able to pack parts with heterogeneous heights than the layer method but can

Palletization Method for Oversized Part Stacking with an Industrial Robotic Arm
9
be less stable. The corner method focuses on adding parts to corners formed by existing parts
and the bin boundaries [13]. As additional parts are placed, the new corner positions are added
and filled corners are removed from a directory which the method searches through. Using
maximal space placement, empty spaces in the bin are measured as cuboids and a part will be
placed in the smallest cuboid that it fits within. Maximal space placement can be used as a
standalone method or alongside other strategies for more optimal placements.
When placing parts in multiple bins, first fit, best fit, or worst fit heuristics can be used to
improve placements. First fit solutions select the first available bin to place an object while best
fit techniques choose the bin which leaves the minimum amount of unused space. Conversely,
worst fit chooses the bin which leaves the maximum amount of remaining bin area [14] [11].
Decreasing and increasing sorting heuristics are modified versions of the above methods, which
sort the objects to be packed from largest to smallest or vice versa before being placed into the
bins. Best and worst fit solutions will produce better overall packing efficiencies than first fit
solutions but take more time to calculate. Using a decreasing or increasing sorting heuristic will
also improve packing efficiencies but may not be possible to implement depending on the
application.
It should be noted that bin packing solutions have been applied to a diverse set of optimization
problems beyond just palletization. Different challenges including abstract scheduling such as
operating room scheduling and computer processing have used these optimization solutions [15].
2.2.2. Verification and Assessment
Regardless of the method selected for solving a bin packing problem, it must be verified to
ensure that the algorithm functions as intended and without errors. This verification typically
includes simulating the method and often includes a graphical model and/or physical testing.

Palletization Method for Oversized Part Stacking with an Industrial Robotic Arm
10
During verification, the developer must be careful to monitor for object collisions and, if the
problem is three dimensional, the stability of the stack must also be monitored. Collisions
indicate errors in the algorithm resulting in objects intersecting each other, while stack stability
issues are caused by placing objects such that they are at risk of falling [16] [10]. Both issues can
be resolved by verifying the solution with a graphical simulation, including a physics engine for
the second issue. Several previous works, including Balakisky, Kramer and Proctor, Demisse et
al., and Lim et al., have described visual simulation environments for verifying their methods.
[17] [18] [19]
Lim implemented a Visual C++ based simulation tool to verify their palletization method and
simulate part stacking with a robotic arm. Using this tool, Lim’s group focused on developing
techniques to optimize the arm’s trajectory planning and to prevent collisions between the arm
and previously placed parts but did not assess the stability of components during or after the
palletization process.
Balakisky’s group used Pallet Viewer, a palletizing simulation program developed by the
Georgia Institute of Technology and improved by the National Institute of Standards and
Technology. This program assesses the stability, packing efficiency, detection of part collisions,
and other metrics but the program does not include dynamic physics to show how parts would
shift or fall. Rather, the program only provides text based output data. To overcome these
challenges, Balakisky et al. describe the use of the Unified System of Automation and Robot
Simulation (USARSim) [17]. USARSim is a robotics simulation tool with a three-dimensional
physics environment, based on the Unreal Engine video game engine. Using this environment,
users can assess the performance of their methods; visualizing problems such as parts shifting,
tipping, or falling. In their 2012 publication, Balakisky and Kootbally describe integrating

Palletization Method for Oversized Part Stacking with an Industrial Robotic Arm
11
USARSim with Robot Operating System (ROS) to more accurately simulate mobile robots and
robotic arms [20]. Demisse et al. and Schuster et al. both applied USARSim and ROS in their
verification methods for part palletization using robotic arms [21] [18].
2.2.1. Bin Packing Assessment Methods
There are several commonly used methods to assess a bin packing method’s effectiveness after it
has been verified. Volume utilization, packing density, and percentage of parts packed are three
of the most common methods used to assess the performance of a bin packing algorithm. [12]
The volume utilization method, as shown below, is the percentage of a bin’s area that contains
parts.
𝑉𝑢 =∑ 𝑃𝑖
𝑛𝑖
𝐵𝐵𝑖𝑛
( 1 )
Where Vu is the volume utilization, Pi are the part volumes, and Bbin is the bin volume. In
contrast, packing density ρ considers the smallest bounding box, Bbounds, that fits all parts instead
of the bin’s area.
𝜌 =∑ 𝑃𝑖
𝑛𝑖
𝐵𝐵𝑜𝑢𝑛𝑑𝑠
( 2 )
Finally, the percentage of parts packed is simply the number of parts packed divided by the total
number of parts.
Of these methods, bin utilization is the most common [12]. However, the density method can
prove useful when the total part volume is much less than the available bin area or the bin has a
variable area. In these scenarios, density is a better metric for measuring the volume efficiency of
a stack.
Palletization Method for Oversized Part Stacking with an Industrial Robotic Arm
12
To use these metrics to effectively compare the performance of a bin packing method with
previous work, it is critical that the data inputted into both methods are similar [15] [10].
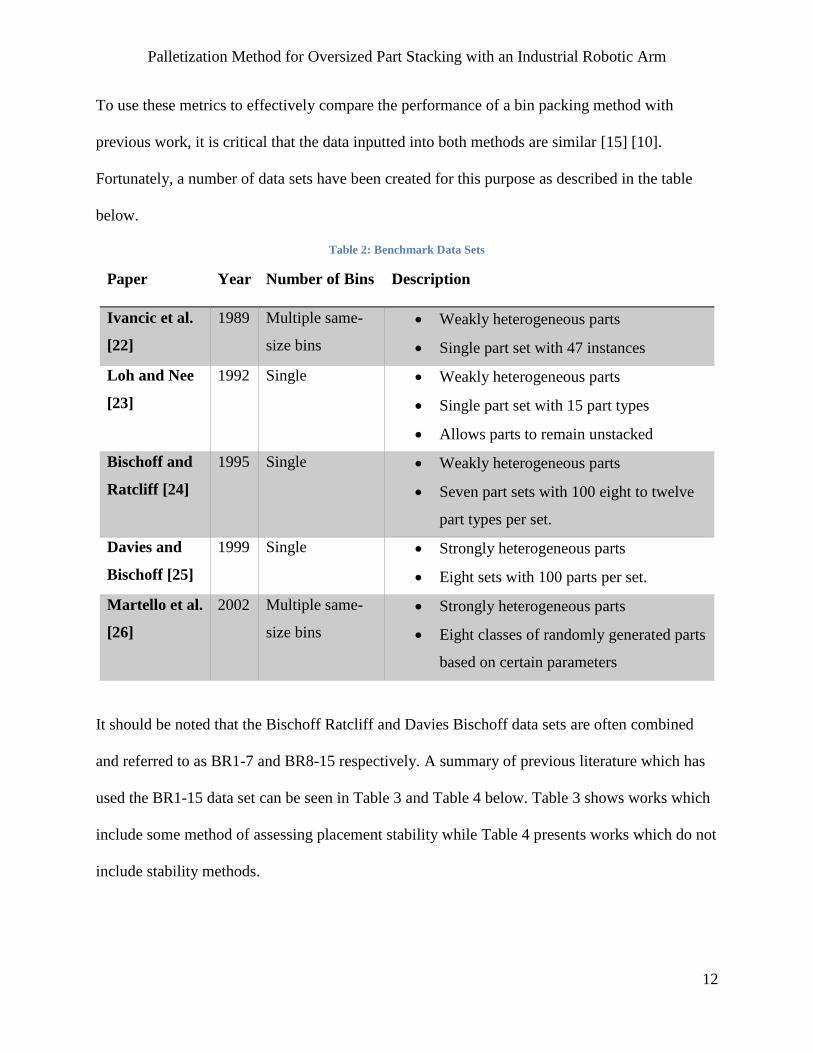
Fortunately, a number of data sets have been created for this purpose as described in the table
below.
Table 2: Benchmark Data Sets
Paper Year Number of Bins Description
Ivancic et al.
[22]
1989 Multiple same-
size bins
• Weakly heterogeneous parts
• Single part set with 47 instances
Loh and Nee
[23]
1992 Single • Weakly heterogeneous parts
• Single part set with 15 part types
• Allows parts to remain unstacked
Bischoff and
Ratcliff [24]
1995 Single • Weakly heterogeneous parts
• Seven part sets with 100 eight to twelve
part types per set.
Davies and
Bischoff [25]
1999 Single • Strongly heterogeneous parts
• Eight sets with 100 parts per set.
Martello et al.
[26]
2002 Multiple same-
size bins
• Strongly heterogeneous parts
• Eight classes of randomly generated parts
based on certain parameters
It should be noted that the Bischoff Ratcliff and Davies Bischoff data sets are often combined
and referred to as BR1-7 and BR8-15 respectively. A summary of previous literature which has
used the BR1-15 data set can be seen in Table 3 and Table 4 below. Table 3 shows works which
include some method of assessing placement stability while Table 4 presents works which do not
include stability methods.

13
Table 3: Bischoff Ratcliff and Davies Bischoff Algorithm Results with Stability (%)
Da
ta S
et
Bo
rtf
eld
t a
nd
Geh
rin
g (
19
98
) [2
7]
Bo
rtf
eld
t a
nd
Geh
rin
g (
20
01
) [
28
]
Geh
rin
g a
nd
Bo
rtf
eld
t (2
00
2)
[29
]
Mo
ura
an
d O
liv
eir
a
(20
05
) [3
0]
Bo
rtf
eld
t (2
00
0)
[31
]
Fa
nsl
au
an
d
Bo
rtf
eld
t (2
01
0)
[32
]
Liu
et
al.
(2
01
1)
[33
]
Ren
et
al.
(2
01
1)
[34
]
Go
nca
lves
an
d
Rese
nd
e (
20
12
) [3
5]
Zh
an
g e
t a
l. (
20
12
)
[36
]
Zh
u e
t a
l. (
20
12
)
[37
]
Zh
u a
nd
Lim
(2
01
2)
[38
]
Ara
ya
an
d R
iff
(20
14
) [3
9]
BR1 92.63 87.81 88.10 89.07 90.57 94.51 88.14 93.90 94.34 94.43 93.57 94.40 94.50
BR2 92.70 89.40 89.56 90.43 90.84 94.73 89.52 94.54 94.88 94.89 93.89 94.85 95.03
BR3 92.31 90.48 90.77 90.86 91.43 94.74 90.53 94.35 95.05 95.06 94.14 95.10 95.17
BR4 91.62 80.63 91.03 90.42 92.21 94.41 90.75 94.08 94.75 94.89 93.86 94.81 94.97
BR5 90.86 90.73 91.23 89.57 91.25 94.13 90.87 94.17 94.58 94.68 93.51 94.52 94.80
BR6 90.04 90.72 91.28 89.71 91.05 93.85 90.74 93.48 94.39 94.53 93.39 94.33 94.65
BR7 88.63 90.65 91.04 88.05 90.81 93.20 90.07 92.82 93.74 93.96 92.68 9.59 94.09
BR8 87.11 89.73 90.26 86.13
92.26 88.89
92.65 93.27
92.56 93.15
BR9 85.76 89.06 89.50 85.08
91.48 88.51
91.90 92.60
92.11 92.53
BR10 84.73 88.40 88.73 84.21
90.86 87.76
91.28 92.05
91.60 92.04
BR11 83.55 87.53 87.87 83.98
90.11 87.06
90.39 91.46
90.64 91.40
BR12 82.79 86.94 87.18 83.64
89.51 86.97
89.81 90.91
90.35 90.92
BR13 82.29 86.25 86.70 83.54
88.98 86.90
89.27 90.43
89.69 90.51
BR14 81.33 85.55 85.81 83.25
88.26 86.40
88.57 89.80
89.07 89.93
BR15 80.85 85.23 85.48 83.21
87.57 86.23
87.96 89.24
88.36 89.33
BR1-7 Average 91.26 88.63 90.43 89.73 91.17 94.22 90.09 93.91 94.53 94.63 93.58 82.51 94.74
BR8-15 Average 83.55 87.34 87.69 84.13
89.88 87.34
90.23 91.22
90.55 91.23
BR1-15 Average 87.15 87.94 88.97 86.74 91.17 91.91 88.62 93.91 92.24 92.81 93.58 86.80 92.87

Palletization Method for Oversized Part Stacking with an Industrial Robotic Arm
14
Table 4: Bischoff Ratcliff and Davies Bischoff Algorithm Results without Stability (%) D
ata
Set
Bis
ch
off
an
d R
atc
liff
(19
95
c)
[6
]
Geh
rin
g a
nd
Bo
rtf
eld
t
(19
97
N)
[40
]
Bo
rtf
eld
t et
al.
(2
00
3)
[41
]
Bo
rtf
eld
t et
al.
(2
00
3)
(se
t b
) [4
1]
Lim
et
al.
(2
00
5)
[4
2]
Mac
k e
t al
. (2
00
4)
[43
]
Lim
et
al.
(2
00
5)
[42
]
Pa
rren
o e
t a
l. (
20
08
)
[44
]
Fa
nsl
au
an
d B
ortf
eld
t
(20
10
)
[45
]
He
an
d H
ua
ng
(2
01
0)
[46
]
Pa
rren
o e
t a
l. (
20
10
)
[47
]
De
reli
and
Das
(2
01
1)
[48
]
He
an
d H
uan
g (2
01
1)
[49
]
Lim
et
al.
(2
01
2)
[50
]
Go
nca
lve
s an
d
Re
sen
de
(2
01
2)
[35
]
Zhu
an
d L
im (
20
12
)
[38
]
Zhu
et
al.
(2
01
2)
[51
]
Zhu
et
al.
20
12
) [5
2]
Zhu
an
d L
im (
20
12
)
[38
]
Ara
ya a
nd
Rif
f (2
01
4)
[39
]
BR1 83.4 86.8 93.2 93.5 88.7 93.7 87.4 93.3 95.1 92.3 94.9 83.4 92.9 91.6 95.3 94.9 94.2 95.5 95.6 95.7
BR2 83.6 88.1 93.3 93.8 88.2 94.3 88.7 93.4 95.4 92.7 95.2 84.6 93.9 92.0 95.9 95.5 94.5 96.0 96.1 96.2
BR3 83.6 88.9 92.9 93.6 87.5 94.5 89.3 93.4 95.5 93.3 95.0 85.4 93.7 92.3 96.1 95.7 94.7 96.1 96.3 96.5 BR4 84.2 88.7 92.4 93.1 87.6 84.3 89.7 92.2 95.2 93.2 94.7 85.2 93.7 92.4 96.0 95.5 94.6 95.9 96.2 96.3 BR5 83.9 88.8 91.6 92.3 87.3 93.8 89.7 92.9 95.0 92.9 94.3 85.1 93.7 91.9 95.8 95.4 94.2 95.7 96.0 96.2 BR6 82.9 88.5 90.9 91.7 86.9 83.3 89.7 92.6 94.8 92.9 94.0 84.7 93.6 91.5 95.7 95.4 94.2 95.6 95.8 96.1 BR7 82.1 88.4 89.7 90.6 87.2 92.5 89.4 91.9 94.2 92.7 93.5 84.0 93.1 91.0 95.3 95.0 93.7 95.1 95.4 95.8
BR8 80.1 87.5 91.0 93.7 92.0 92.9 92.9 94.8 94.7 94.6 94.8 95.3
BR9 78.0 84.5 90.5 93.4 91.8 92.2 92.5 94.4 94.3 94.4 94.5 95.1
BR10 76.5 85.5 89.9 93.1 91.4 91.9 92.2 93.9 94.1 94.1 94.4 95.0
BR11 75.1 84.8 89.4 92.8 91.1 91.5 91.9 93.6 93.9 93.8 94.1 94.8
BR12 74.4 84.3 89.0 92.7 90.8 91.2 91.8 93.2 93.7 93.7 94.1 94.6
BR13 73.6 83.7 88.6 92.5 90.3 91.1 91.6 93.0 93.5 93.5 93.9 94.6
BR14 73.4 83.0 88.5 92.4 90.0 90.6 91.3 92.7 93.3 93.4 93.8 94.5
BR15 73.4 82.5 88.4 92.4 89.5 90.4 91.0 92.5 93.1 93.3 93.8 94.4 BR1-7 Average 83.4 88.3 92.0 92.6 87.6 90.9 89.1 92.8 95.0 92.8 94.5 84.6 93.5 91.8 95.7 95.3 94.3 95.7 95.9 96.1 BR8-15 Average 75.6 84.5 89.4 92.9 90.9 91.5 91.9 93.5 93.8 93.8 94.2 94.8 BR1-15 Average 79.2 86.3 92.0 92.6 87.6 90.9 89.1 91.0 93.9 91.8 92.9 84.6 92.7 91.8 94.5 94.5 94.3 94.7 95.0 95.4

15
2.2.2. Stability Assessment
While the above assessment methods can be used to evaluate the volume-performance of a bin
backing method, they cannot be used to determine its stability. Therefore, separate assessment
methods are required. Whenever physically stacking or palletizing parts, it is very important to
ensure that the resulting part stack does not shift or fall.
Previous research has focused on either supporting the base area of a part or the part’s edges.
Edge support is typically used for applications that rely on a box’s structural integrity rather than
the boxes contents to support weight. Meanwhile, area support is used for applications in which a
part or its contents can provide structural support [17]. Many authors, including all authors
included in Table 3, have required full area support for part placements. Sorensen et al. use a
corner support method to ensure stability in components where the centre of gravity is not in the
geometric centre of the part. This method requires all four base corners of a component to be
supported for a placement to be valid [53]. Other methods, such as Schuster et al. require each
part to be supported on two opposite edges by components below it, or a certain percentage of
the base area to be in contact with lower components [21]. Similarly, Carpenter and Dowsland
developed three criteria: a part’s base must be in contact with at least two parts below it, the base
must have a threshold percentage of its area in contact with the layer below it, and straight or
jagged guillotine cuts must not cut more than a certain maximum bin length or width [54]. The
first of these criteria ensures that parts will interlock and provide mutual support while the
second ensures that the part will be supported over most of its base area. The third criterion
prevents the guillotine cutting packing method from forming separate stacks in the bin. Carpenter
and Dowsland’s second criterium, the area support percentage, is the most commonly used
method.

Palletization Method for Oversized Part Stacking with an Industrial Robotic Arm
16
Previous methods only consider the part layer directly below the part placement when
determining part stability, and do not consider the effects of layers further below the new part.
When a layer’s packing density is great enough, the impact of further layers is minimal.
However, if a significant amount of part overhang is allowed, a locally stable region may not be
supported by the base layer and can become globally unstable. Additionally, the distance from
the supporting layer to the new part’s centre of gravity is only considered by edge support
methods. If a part is supported only near its centre of gravity, it becomes more vulnerable to
forces exerted near its edges.
2.2.2.1. Overhang
Understandably, most bin packing and palletizing algorithms do not allow parts to exceed the bin
boundaries and overhang is not commonly considered during stability analysis. When it is
considered, as previously described by Takahara, it is commonly defined as the percentage of the
base area that is unsupported by lower parts, including gaps in between supported areas [13].
None of the methods reported in the literature permitted parts to overhang outside of the bin
boundaries.
However, as seen in Figure 3, it is possible to stack more parts in a bin and to stack parts larger
than the bin itself by allowing the bin boundaries to be exceeded through overhang. By allowing
boundary overhang, parts larger than the pallet itself can be palletized, and the overall efficiency
of the pallet may be increased.

Palletization Method for Oversized Part Stacking with an Industrial Robotic Arm
17
Figure 3: No Overhang vs Overhang
As mentioned earlier, previous stability methods have only considered local part stability and do
not differentiate supporting areas based on their distance to a part’s centre of gravity. However,
an overhang-based bin packing method can predictably require an enhanced method to ensure
that parts do not shift or fall when placed towards the edges of the bin.
2.3. Case Study: Truss Manufacturing
A local truss manufacturing company produces wooden roof trusses of numerous designs such as
those shown in Figure 4 below. These trusses are often customized for clients and can contain
between four and thirty individual truss members ranging from three inches to twenty feet in
length, depending on the size and complexity of the truss. Truss parts are cut using a computer
numerical control (CNC) saw in batches of five trusses at a time; cut in a seemingly random
order which optimizes stock usage. This optimization is performed by the saw software and
cannot be altered by the user.

Palletization Method for Oversized Part Stacking with an Industrial Robotic Arm
18
Figure 4: Roof Trusses
Once a cut file has been loaded into the saw and optimized, the cutting process can begin. First,
parts are loaded into the saw using an automated part buffer and cut to size. Parts exit the saw
through a gravity feed and workers must unload and sort parts onto carts based on their parent
trusses. Once fully loaded, the carts are moved to another area of the factory for assembly. The
floor plan for this process is shown in Figure 5 below. Given that parts can be up to 20 feet long,
they often overhang the edges of the 6 foot carts considerably. As such, the workers must
consider transport and stacking stability when they load parts.
Figure 5: Cell Setup (Not to Scale)

Palletization Method for Oversized Part Stacking with an Industrial Robotic Arm
19
Recently, the company has improved their production line with a faster CNC saw. The new saw
produces parts faster than can be manually unloaded by one worker and so two workers must be
devoted to unloading and sorting duties. To minimize labour input, and to speed production, the
company wishes to automate this process. However, part shapes, sizes, and order are highly
variable due to the wide variety of trusses cut. Traditional automation, such as manually
programming a robot with path movements for every part to be loaded onto the carts, is not
feasible for this task as the number of preprogrammed paths would be impractically large. As
such, conventional industrial robots do not possess the intelligence for optimal stacking of parts
in these operations.
To provide this required intelligence, a control algorithm is required to provide a robotic arm
with path planning instructions based on calculated part placements. These placement positions
must be based on stack density and stability. Stack density is required to ensure that all parts of a
truss can be placed within a minimal volume, reducing factory footprints. Meanwhile, part
stability must be considered to ensure that parts do not fall from or shift within the stack. An
unstable stack may require time to restack, prevent the robot from stacking the whole truss, or
cause other hazards in the factory. All previous bin packing algorithms reported in literature have
limited themselves to placing parts wholly within the bin; however, these solutions are not
suitable for this operation. As such, a new bin packing algorithm must hence be developed.

Palletization Method for Oversized Part Stacking with an Industrial Robotic Arm
20
Chapter 3. Methodology
To develop the boundary overhang palletizing method outlined in Section Chapter 1, the system
was broken into two primary sub-algorithms: the packing algorithm and a stability verification
algorithm. The packing algorithm identifies potential part placement locations while the stability
algorithm evaluates each location to determine how stable the part would be if placed there.
As detailed in Figure 6, the part sorting process begins when a new part enters the system. The
part is allocated to a bin based on its parent truss and the packing and stability algorithms attempt
to find a suitable stacking location within that bin. If no such spot exists, the system attempts to
stack the part into an intermediate buffer. After placing a part within a truss bin, the algorithm
checks to see if any parts in the buffer bin that belong to the same parent truss can now be
stacked.
Figure 6: Algorithm Process Flow Chart

Palletization Method for Oversized Part Stacking with an Industrial Robotic Arm
21
3.1. Assumptions and Design Choices:
Based on the literature reviewed, the following assumptions and design choices were made in the
development of the palletization method.
Layer building placement and corner placement heuristics: A layer building placement
strategy was chosen as this method increases the stack stability. Layer building works especially
well for this application since all parts have uniform heights. To improve the per-layer stacking
density, a corner placement heuristic was implemented as well.
Single Bin* Packing: As parts must be separated into their parent trusses for later assembly,
each collection of truss-parts must be stacked into its own separate bin.
Exceptions are made for un-stackable parts, which are placed into an intermediary buffer. After
another part has been placed into the truss bin, the algorithm will check to see if the un-stackable
part can now be stacked. This process is outlined in Figure 6.
No Pre-Sorting: A greedy algorithm, which does not pre-sort parts for optimal stacking, was
determined to be the best choice for this application as part order is optimized independently by
the saw to minimize stock material usage. Pre-sorting would require too much of the robot’s
operating envelope and decrease the rate at which parts can be stacked.
No Part Rotations: Part rotation was not considered in the algorithm, as all of the parts are long
and narrow. Rotating a part would greatly reduce the available bin area for future parts.
Simplified Part Shapes: While truss components typically have one or two angled cuts on each
end, all components were modelled as bounding box rectangles in the algorithm to reduce
computation time. This simplification, seen in Figure 7 below, adversely affects stack stability as

Palletization Method for Oversized Part Stacking with an Industrial Robotic Arm
22
parts may be placed in areas where no physical part exists however, based on physical testing,
the impact of the simplification on stability was found to be minimal.
Figure 7: Part Bounding Box Simplification
Unity Development Environment: Unity, a video-game engine developed by Unity
Technologies, was chosen as the development environment due to its built-in physics engine,
large development community, and ease of access. In particular, the physics engine allowed the
inclusion of gravitational and frictional effects to better simulate part instability.
Octopuz Verification Environment: Octopuz, an industrial robotics planning and simulation
environment developed by Octopuz Inc., was chosen to verify path planning and to output path
files to the robotic arm due to its ease of integration with the robot, large amount of developer
support, and excellent path simulation ability.
Performance Assessment using the Bischoff Ratcliff and Davies Bischoff (BR) Data Sets:
The BR data sets were chosen as the best published data set to compare the effectiveness of the
palletization method with previous literature as it is one of the most commonly used metrics and
because of its large number of weakly heterogeneous parts. However, it should be noted that it
still does not closely resemble the data set that this method was developed for; this method was
developed specifically for very narrow parts, with length to width ratios of up to 60.
Additionally, while the parts used for this method are weakly heterogeneous in width and
homogenous in height, parts can be very strongly heterogeneous in length with lengths between

Palletization Method for Oversized Part Stacking with an Industrial Robotic Arm
23
3.5 and 240 inches. This contrasts with the BR data, which is weakly homogenous in all axis and
contains length to width ratios closer to 5:1. Finally, the BR data set contains trials of over 600
parts per bin but this method has been developed for up to 30 parts per bin. Due to these
differences, caution should be taken when comparing the performance of this method with the
literature described.
3.1.1. Minimum Contact Numbers
Carpenter and Dowsland’s first stability criterium, which requires parts to be in contact with at
least two parts below itself, was implemented on a trial basis to determine the resulting effects on
system performance and stability. While this minimum contact number method was
implemented, the bin was first searched for suitable locations that had the desired number of
contacts beneath it. If no such position was found, the algorithm was repeated for n-1 contacts
until either a placement was found or no placements were found with a single supporting contact.
While increasing local part stability, this method increases computation time by a significant
amount, as parts may go through up to three position and stability searches per bin before a
placement is found. Additionally, due to the greedy nature of the overall palletization method,
there was some concern that using this method to increase local placement stability may reduce
overall stability. As such, trials were performed using minimum contact numbers of 3, 2, and 1.
For the results of these trials, please see Section 6.2.

Palletization Method for Oversized Part Stacking with an Industrial Robotic Arm
24
3.2. Placement Algorithm
A heuristics based bin packing algorithm was developed to determine part placements within
each bin. This method selects placements so that a corner of the new part will be coincident with
a pre-existing corner, either one of the bin corners or the corner of a previously placed part. This
ensures that parts will be placed compactly, limiting the amount of wasted space. This method is
similar to that used by Wu et al, which also prioritizes corner placements. [55] However, the
method developed here utilizes a sliding search mechanic to ensure that the space outside of the
bin boundaries is heavily utilized, minimizing the amount of in-bin space used.
This sliding method, as shown in Figure 8, selects the leftmost available bin corner or point
along a previously placed part. Next, the part is placed so that its upper right corner is at point in
and collision and stability checks are performed. If the placement is valid then the part is placed
at this location. However, if either check fails, the placement location is advanced forward in the
y-direction by a fraction of the part’s length and re-checked. The process continues until a valid
placement is found or the bottom right part corner has been placed at point in and failed.
Figure 8: Left Side Placement Search

Palletization Method for Oversized Part Stacking with an Industrial Robotic Arm
25
If the part cannot be placed to the left of point in, then the process is repeated for the right side of
the point as shown in Figure 9 below. If no valid position along the point can be found then the
process is repeated for point in+1.
Figure 9: Right Side Placement Search
Once the part has been placed, the part’s corners, and points along the part’s length, are added to
the bin’s point searching directory for future placements.
A process flow chart for the overall algorithm is described in Figure 6 below. The algorithm
checks each point i in the bin, starting by placing the new part’s top right corner at point i and
moving the part forward until a valid and stable position is found or point i is at the part’s bottom
right corner. If no spot is found, the process is repeated for the part’s left side. If no spot is found
for either side then the next point is tried. Spots are considered valid if they do not collide with
existing parts and stable if they have a stability factor greater than the threshold stability factor.
(Please see Section 3.3 for more information on the Stability Algorithm.)

Palletization Method for Oversized Part Stacking with an Industrial Robotic Arm
26
Figure 10: Packing Algorithm Flowchart
3.2.1. Collision Detection
An important aspect of part placement is ensuring that a proposed location has not been filled by
previously placed parts. Without the ability to check to see if a location is occupied, referred to
as collision detection, the algorithm would attempt to place parts into areas that were occupied
by previous parts. While possible in a simulated environment, these collisions would cause a
robot to crash parts into each other during physical implementation.
To ensure that any two parts i and j do not intersect, at least one of the following equations must
be true for each pair of parts.
𝑥𝑖 + 𝑤𝑖 ≤ 𝑥𝑗 ( 2a ) 𝑥𝑗 + 𝑤𝑗 ≤ 𝑥𝑖 ( 2b )
𝑦𝑖 + 𝑙𝑖 ≤ 𝑦𝑗 ( 3a ) 𝑦𝑗 + 𝑙𝑗 ≤ 𝑦𝑖 ( 3b )
𝑧𝑖 + 𝑑𝑖 ≤ 𝑧𝑗 (4a ) 𝑧𝑗 + 𝑑𝑗 ≤ 𝑧𝑖 ( 4b )

Palletization Method for Oversized Part Stacking with an Industrial Robotic Arm
27
A simplified example, neglecting the z axis, can be seen in Figure 11 below. As long as at least
one of the above equations is true, the two objects will not collide. However, the red rectangles
have collided. In this case, all of the above equations are false.
Figure 11: Collision Avoidance
This collision detection method was also used during stability analysis to determine the overlap
between a part and the parts directly below it. In this application, overlap is beneficial to ensure
that parts are adequately supported.
Finally, collision detection is used to determine if a part lies within the boundaries of a bin. The
following six equations are used to ensure that parts do not exceed the bin boundaries [56].
𝑏𝑥 ≤ 𝑥𝑖 ( 5a )
𝑥𝑖 + 𝑤𝑖 ≤ 𝑏𝑥 + 𝑊 ( 5b )

Palletization Method for Oversized Part Stacking with an Industrial Robotic Arm
28
𝑏𝑦 ≤ 𝑦𝑖 ( 6a )
𝑦𝑖 + 𝑙𝑖 ≤ 𝑏𝑦 + 𝐿 ( 6b )
𝑏𝑧 ≤ 𝑧𝑖 ( 7a )
𝑧𝑖 + 𝑑𝑖 ≤ 𝑏𝑧 + 𝐷 ( 7b )
Where (xi, yi, zi) is the bottom left corner of part i, (wi, li, di) are the width, length, and depth of
part i, (bx, by, bz) is the bottom left corner of the bin, and (W, L, D) are the width, length, and
depth of the bin.
However, in this new method, parts must be allowed to exceed the boundaries of the bin by some
margin. As such, the bin collision detection equations ( 5a ) – (7b) were as shown below:
𝑏𝑥 ≤ 𝑥𝑖 − 𝑚𝑥𝑤𝑖 ( 8a ) 𝑥𝑖 + 𝑤𝑖 + 𝑚𝑥𝑤𝑖 ≤ 𝑏𝑥 + 𝑊 ( 8b )
𝑏𝑦 ≤ 𝑦𝑖 − 𝑚𝑦𝑙𝑖 ( 9a ) 𝑦𝑖 + 𝑙𝑖 + 𝑚𝑦𝑙𝑖 ≤ 𝑏𝑦 + 𝐿 ( 9b )
𝑏𝑧 ≤ 𝑧𝑖 (10a ) 𝑧𝑖 + 𝑑𝑖 ≤ 𝑏𝑧 + 𝐷 ( 10b )
Where mx and my are the acceptable overhangs for each part, as a percentage of total part length.

Palletization Method for Oversized Part Stacking with an Industrial Robotic Arm
29
3.3. Stability Algorithm
While the bin packing method described above in Section 3.2 is capable of placing parts
compactly in each bin, it does not consider the likelihood that a specific part placement will shift
or fall. Left alone, this results in parts with a large amount of their footprint left unsupported. If
the level of support below a part is insufficient, then the part is likely to shift or fall; this will
affect the stability of all future and previously stacked parts and cause a hazard for anyone
nearby.
Previous stability methods have evaluated part placement stability based on the supporting parts
directly below a proposed location, either based on the amount of supported part edges or the
overall supported area. However, these methods have not considered the effects of parts below
the supports themselves. Given the increased instability caused by extending parts outside of the
bin boundaries, a more advanced stability assessment mechanic is required that can measure the
full stability of supporting material to the base of the bin.
As such, to ensure that the palletization process and resulting stack are stable, an enhanced
stability assessment method was developed which addresses both global stability, the stability of
all parts below a proposed placement to the bin surface, as well as evaluating both the amount of
supported area and its relation to the part’s centre of gravity.
3.3.1. Stability Assessment
To develop a more advanced stability measurement metric, it is important to identify the factors
which affect stability. Clearly, one factor is the amount of surface area below the part. However,
the location of the supporting area is important as well.

Palletization Method for Oversized Part Stacking with an Industrial Robotic Arm
30
First, consider a part located at the edge of a bin such that its centre of gravity is at a distance a
from the bin’s edge, and applies a disturbance force F at distance b from the bin’s edge (as
shown in Figure 12 below). This force will create a moment about the edge of the bin which is
countered by the moment caused by the effect of gravity on the part.
Figure 12: Effect of a Vertical Disturbance Force
If the moment caused by the disturbance force is greater than the gravity-moment, then the part
will begin to rotate. Increasing distance a, the furthest supported edge, proportionally increases
the disturbance force F required to shift the part.
Similarly, consider a lateral disturbance applied to a partially supported part, as shown in Figure
13 below:
Figure 13: Laterally Disturbed Partially Supported Part

Palletization Method for Oversized Part Stacking with an Industrial Robotic Arm
31
Each supported area will impart a reactionary force, caused by the friction between the part and
its supported area, such that their resultant moments about the part’s pivot point p resist the
disturbance moment. Again, we can see that disturbance force required to shift the part increases
as the distance between the part’s pivot and the supported areas increase.
Based on these disturbance scenarios, we can see that distance from the part’s centre of mass is
also an important factor to the new part’s stability. By spreading the reaction forces over larger
contact areas, and by moving these reaction forces further from the centre of gravity, the overall
part stability is improved.
To account for both factors, a combined stability factor, equal to the contact area A multiplied by
its distance to the part’s centre of gravity d, was created to characterize the impact of each lower
part on the new part’s stability.
𝑆 = 𝐴𝑑
( 11 )
To explore this new stability factor, let us first consider stability as a single dimension, as shown
in Figure 14 below. For part P3, the stability factors imparted by parts 1 and 2 would be 𝑆1 =
𝐴1𝑑1 and 𝑆2 = 𝐴2𝑑2 respectively.
Figure 14: Stability, Distance, and Area

Palletization Method for Oversized Part Stacking with an Industrial Robotic Arm
32
However, a support area may cross the new part’s centroid and support both sides. To address
this, the new part is broken down into two quadrants: one to the right of the part’s centroid and
one to the left. As seen in Figure 15 below, Part P1 is within both quadrants Q1 and Q2 of the new
part P4. As such, P1 is broken down into separate segments for each quadrant, denoted by the
superscripts. Additionally, part P2 extends out beyond the new part and so only the portion below
the new part is considered.
Figure 15: Two-Quadrant One Dimensional Stability
Using the new stability factor, the total stability for each quadrant is the sum of all of the part
stability factors it contains:
𝑆𝑄𝑛 = ∑ 𝐴𝑖𝑑𝑖
( 12 )
With this in mind; the stability of part P4 for each quadrant in Figure 15 is:
Palletization Method for Oversized Part Stacking with an Industrial Robotic Arm
33
𝑆4𝑄1 = 𝐴1
𝑄1𝑑1𝑄1 + 𝐴2
𝑄1𝑑2𝑄1 + 𝐴3
𝑄1𝑑3𝑄1
𝑆4𝑄2 = 𝐴1
𝑄2𝑑1𝑄2
While these may be adequate metrics to determine the stability of parts with the same
dimensions as part P4, these stability factors cannot be directly compared to parts with varying
sizes. As such, the above stability factor must be non-dimensionalized by dividing it by the
maximum possible stability factor for the specific part.
For a one-dimensional analysis, the maximum stability factor is the total length of the part in the
quadrant multiplied by half of the distance from the centre of mass to the edge of the part, as
seen in Figure 16.
𝑆𝑚𝑎𝑥 =𝐿
2
𝐿
4= [
𝐿2
8]
Figure 16: Maximum One Dimensional Stability Factor
As such, the percentage stability factor can be written as:
𝑆%𝑄𝑛 =
𝑆𝑄𝑛
[𝐿2
8 ]=
∑ 𝐴𝑖𝑑𝑖
[𝐿2
8 ]
( 13 )
This dimensionless stability factor can now be easily compared to a minimum stability threshold
to determine if these stability factors are sufficient for the part to be stable. The value of this
threshold, a fraction of the maximum possible stability factor for each specific part was
determined experimentally, as discussed in Section 6.1.

Palletization Method for Oversized Part Stacking with an Industrial Robotic Arm
34
3.3.2. Local and Global Stability
If the proposed placement for part P4 from Figure 15 is valid, the new part will inherit a stable
area, equal to the maximum extent of the contact areas directly below it. This stable area, shown
in red in Figure 17, will be used for new stability searches to ensure that future parts are placed
in globally stable locations.
Figure 17: Global vs Local Stability
As seen in Figure 17, part P4 has stable extents in quadrants 1 and 2 extending distances EQ1 and
EQ2 from P4’s centroid respectively. These extents, and those inherited from parts below it,
define the part’s globally stable area.
To explore the difference between local and global stability, consider parts P5 and P6 in Figure
17. Part P5 is entirely above the previously placed part and is fully supported locally. However, it
is outside of P4’s stable area and has no column of supporting material beneath P4. As such, it is
locally stable but globally instable. If further parts are placed above P5, they may cause the parts
below it to shift or collapse.

Palletization Method for Oversized Part Stacking with an Industrial Robotic Arm
35
In contrast, part P6, despite overhanging the edge of P4, has its centroid within P4’s stable area
and has supports down to the bin base. As such it can be considered globally stable. If placed
here, it will have its own stable area from its left extent to its furthest supported extent at y = EQ1.
Any future parts placed on top of P6 within this stable area will be supported by a stable column
all the way to the bin surface and can be considered to be globally stable (assuming they satisfy
the stability threshold).
3.3.3. Two-Dimensional Stability
The stability methods previously introduced can now be easily extended into two dimensions,
considering stability in both the X and Y axis. The primary difference between this method and
the previous one-dimensional metric is that now four quadrants must be considered for each part.
Each quadrant will have its own stability factors and stable extents in both X and Y axes as
shown in the equations below:
𝑆𝑥𝑄𝑛 = ∑ 𝐴𝑝𝑖
𝑄𝑛𝑑𝑝𝑖𝑥𝑄𝑛
( 14a )
𝑆𝑦𝑄𝑛 = ∑ 𝐴𝑝𝑖
𝑄𝑛𝑑𝑝𝑖𝑦𝑄𝑛
( 14b )
Where A is the area of part pi within quadrant n, and d is the distance from the centroid of this
area to the new part’s centroid in x and y respectively.
Similarly, the overall stable area, as seen in Figure 18, for a placed part is the rectangular area
(pink) formed by the maximum shared extents of supporting surfaces (dotted lines) in each axis.

Palletization Method for Oversized Part Stacking with an Industrial Robotic Arm
36
Figure 18: Two Dimensional Stability
Finally, to non-dimensionalize the new two-dimensional stability factors (14a and 14b), the new
two-dimensional maximum stability factors must first be created. For a given part with width w
and length l, such as in Figure 19 the maximum stability factors are as follows:

Palletization Method for Oversized Part Stacking with an Industrial Robotic Arm
37
Figure 19: Two Dimensional Maximum Stability Factor
In this case, the x and y stabilities are:
𝑆𝑦𝑄1 = (
𝑙𝑤
4) (
𝑙
4) =
𝑤𝑙2
16
( 15a )
𝑆𝑥𝑄1 = (
𝑙𝑤
4) (
𝑤
4) =
𝑙𝑤2
16
( 15b )
A percentage stability factor can be found by dividing a quadrant’s stability factor by this value.
𝑆𝑦%𝑄𝑛 = 𝑆𝑦
𝑄𝑛 ⌈𝑙2𝑤
16⌉
−1
( 16a )
𝑆𝑥%𝑄𝑛 = 𝑆𝑥
𝑄𝑛 ⌈𝑤2𝑙
16⌉
−1
( 16b )
3.3.4. Stability Method
Now that the stability assessment method has been developed, it can be implemented into a
stability assessment algorithm and integrated with the placement method. After the placement
algorithm has found a potential placement location, the stability method is used to determine if
the part will be stable in the proposed location. This assessment is performed by checking all
previously placed parts in the bin to see if they are directly below the new part. If the lower parts

Palletization Method for Oversized Part Stacking with an Industrial Robotic Arm
38
do provide support, this support is quantified using the stability factor and if the overall stability
factor is above the stability threshold the part is placed. A flowchart of this process can be seen
in Figure 20 below.
Figure 20: Stacking Algorithm Flowchart
As shown above, when a new stability search is performed for a potential placement, the
algorithm first checks if the part is to be placed on the base layer of the bin. If the placement is
on the base layer the placement stability is calculated, and based on the resulting stability factor,
the placement is either validated or invalidated. This branch is performed separately to the main
stability algorithm to speed calculation times.
If the part placement is not on the base layer, the algorithm searches all parts already placed
within the bin for parts directly below the placement position. If a part is in this layer, the

Palletization Method for Oversized Part Stacking with an Industrial Robotic Arm
39
algorithm performs an X/Y collision detection check with the existing part’s stable area. If a
collision is detected, the resulting stability factors are calculated and added to the total for each
respective quadrant. Additionally, the extents of the contact area are compared with the previous
maximum extents for each quadrant and will replace the old extents if they are larger. This is
done to determine the stable area of the new placement.
This process is repeated for each part within the bin and the final stability factors are compared
to the stability threshold for each quadrant. If the stability factors are greater than the threshold,
the position is validated and the part is placed. Otherwise, the stability method signals that the
position has failed and the placement algorithm will check the next potential placement location.

Palletization Method for Oversized Part Stacking with an Industrial Robotic Arm
40
Chapter 4. Implementation Once the placement and stability strategies were developed, they were developed into a unified
program and simulated using the Unity engine. The resulting palletization program was then
tested using three datasets: statistical data based on manufacturer provided part files, the
previously published BR dataset, and the actual manufacturer part files themselves. The results
of these tests were analyzed using the assessment methods discussed here and then physically
tested using a small robotic arm to validate its performance.
The code used for these simulations and physical implementation can be acquired as a separate
document from the author.
4.1. Simulation
The palletization method was developed in Unity, using C# as the programming language. Unity
was chosen as the development environment because of its built-in physics and collision
detection capabilities, as well as the ability to directly export a standalone executable .exe file.
These capabilities allowed for easy evaluation of stack stability and verification of the collision
detection element of the algorithm. One set of these simulated stacks can be seen in Figure 21
below, where each coloured stack represents a different truss assembly.

Palletization Method for Oversized Part Stacking with an Industrial Robotic Arm
41
Figure 21: Six Simulated Part Stacks in Unity
In addition to graphically simulating the palletization of incoming data sets, the program was
designed to output a robot path file so that the palletization process can be physically tested.
Before being physically tested, path planning was verified in Octopuz to ensure that the paths
created were valid and did not result in singularities or crashes. One such path can be seen in
Figure 22, where the blue lines are the path trajectories themselves.
Figure 22: Octopuz Path Planning Simulation

Palletization Method for Oversized Part Stacking with an Industrial Robotic Arm
42
To verify the simulation’s performance, three test trials were performed. The first trial tested the
expected performance under factory conditions, as outlined in Section 2.3. In these tests a series
of 30-part trusses were randomly generated using a histogram of aggregate part data from the
truss manufacturer (Shown in Figure 23). This part quantity per truss was chosen based on the
maximum number of parts in a truss, as provided by the manufacturer, to ensure that the
algorithm was capable of maintaining stability and stack density for large trusses.
Figure 23: Part Histogram
The second trial set consisted of testing the simulation using the data sets developed by Bischoff
and Ratcliff and by Davies and Bischoff. These tests were performed to allow a more direct
comparison of the performance of this method with previous works. Once the algorithm was
determined to perform adequately for randomized trusses it was provided with actual batch data
from the manufacturer, containing truss and part data as provided to the CNC saw, for validation.

Palletization Method for Oversized Part Stacking with an Industrial Robotic Arm
43
4.2. Assessment Methods
Traditionally, bin packing efficiency is measured using volume utilization (Equation 1) and
packing density (Equation 2). However, as this algorithm extensively utilizes space outside of
the bin to place, these metrics can be misleading for this application as they only measure
internal bin usage. To help address this issue, three other metrics, In-Bin Volume Utilization
(IBVU), In-Bin Packing Density (IBPD), and Overhang Ratio were developed.
The first, In-Bin Volume Utilization, a modified form of the traditional Table space usage
density, is the measure of the ratio between the volume of parts within the bin boundaries and the
total bin volume (BBin).
𝑉𝑢∗ =
∑ 𝑃𝑖𝐵𝑖𝑛𝑛𝑖
𝑋𝐵𝑖𝑛𝑌𝐵𝑖𝑛𝑍𝑚𝑎𝑥
( 17 )
Where V*u is the in-bin volume utilization, PiBin are the part volumes within the bin boundaries,
and 𝑋𝐵𝑖𝑛𝑌𝐵𝑖𝑛𝑍𝑚𝑎𝑥 (Bbin) is the bin volume. The maximum part height Zmax is used, along with
the bin’s X and Y extents, when calculating the bin volume as the bins used in this method do
not have pre-defined bin heights.
Packing Density metric was similarly modified to measure only the volume usage within the bin
can be similarly shown to be:
𝜌∗ =∑ 𝑃𝑖𝐵𝑖𝑛
𝑛𝑖
(𝑋𝑚𝑎𝑥 − 𝑋𝑚𝑖𝑛)(𝑌𝑚𝑎𝑥 − 𝑌𝑚𝑖𝑛)𝑍𝑚𝑎𝑥
( 18 )
Where 𝜌∗ is the In-Bin Packing Density, Xmin and Ymin are the minimum utilized extents and
Xmax and Ymax are the maximum utilized extents within the bin boundaries.
Palletization Method for Oversized Part Stacking with an Industrial Robotic Arm
44
An additional metric, the overhang ratio, is the ratio between part volume overhanging from the
table volume 𝑃𝑖𝑂𝑣𝑒𝑟ℎ𝑎𝑛𝑔 and total part volume 𝑃𝑖𝐵𝑖𝑛. This ratio helps to provide insight into how
the table volume was utilized.
𝑂𝑣𝑒𝑟ℎ𝑎𝑛𝑔 𝑅𝑎𝑡𝑖𝑜 = ∑ 𝑃𝑖𝐵𝑖𝑛
𝑛𝑖
∑ 𝑃𝑖𝑂𝑣𝑒𝑟ℎ𝑎𝑛𝑔𝑛𝑖
( 19 )
To further assess stability, the percentage average supported part area, measured as the ratio
between the portion of the part inside and outside of the bin boundaries, as well as the average
number of supporting parts were also measured.
4.3. Physical Testing
After the algorithm was validated in the Unity environment, it was physically tested using an
industrial robotic arm in a test cell. This cell, seen in Figure 24 below, included angled input
buffer for incoming parts, six placement bins, one buffer bin, and a KUKA KR6 R700 SIXX
robot. This robot has approximately one quarter of the reach of the arm selected for a full-scale
implementation (706.7mm vs 3095mm). As such, the cell was built to this scale, approximately
1:4.4, to accommodate for the smaller arm. The layout of this test cell was first modelled in
Octopuz to ensure that bins and the input buffer were placed within the robot’s work envelope.

Palletization Method for Oversized Part Stacking with an Industrial Robotic Arm
45
Figure 24: Test Cell Layout
Before running the path file created by the Unity-based program, the path file was simulated in
Octopuz to ensure that all positions were within the working envelope of the robot and did not
result in path singularities or other errors.
After the path files were verified in Octopuz, the file was loaded into the Kuka controller, scale
parts were loaded in the correct order on the input buffer, and then palletized using path program.
For these tests, a two suction cup pneumatic gripper was used to handle parts. Stack stability and
density were qualitatively measured as the arm palletized the parts and the resulting part stacks
were compared to a simulated trail for each part-set. A representative palletized assembly can be
seen in Figure 25 below. An actual demonstration of a run will be shown during presentation.

Palletization Method for Oversized Part Stacking with an Industrial Robotic Arm
46
Figure 25: Three Palletized Part Assemblies

Palletization Method for Oversized Part Stacking with an Industrial Robotic Arm
47
Chapter 5. Results
The following chapter details the experimental results of both the bin packing simulation and
physical testing. Simulations were first performed using the statistically representative data for
varying minimum stability thresholds and minimum contact numbers. The best performing
stability thresholds and minimum contact numbers were then used to test performance using the
BR data set and part sets from the manufacturer.
5.1. Statistical Data Set Simulation Results
Multiple test trials were first performed using the statistically derived part data, shown
previously in Figure 23. Trials were performed for increasingly high stability thresholds until the
number of rejected parts exceeded 1%. Three trails were performed for each stability threshold,
with minimum contact numbers varying from 1 to 3, and each trial included ninety tests using
thirty-part trusses.
These tests were used to validate the bin stacking method, to provide quantitative data on the
method’s stacking efficiencies, and to determine optimal values for the stability threshold and to
assess the effect of including the minimum contact number. The results of these tests,
summarized in Table 5 below, show the average in-bin and cumulative packing density, volume
utilization, overhang ratios, contact numbers, and area usages with their respective standard
deviations and confidence intervals.

48
Table 5: Summarized Simulation Results for Stacking Efficiency
Min. Initial Contacts
Stability Threshold
Nu
mb
er
of
Par
ts
Par
ts in
Bu
ffe
r
Un
pla
ced
Par
ts
Nu
mb
er
of
Par
ts
Ab
ove
Bin
Su
rfac
e
Bin
Vo
lum
e
Uti
lizat
ion
In B
in V
olu
me
Uti
lizat
ion
In B
in D
en
sity
Bin
De
nsi
ty
Ove
rhan
g R
atio
Are
a U
sage
Ab
ove
Bin
Are
a U
sage
Co
nta
ct N
um
be
rs
Ab
ove
Bin
Co
nta
cts
3 0% Average: 30.00 0.00 0 25.0 117.1% 73.1% 49.4% 30.8% 169.0% 52.2% 49.2% 1.30 1.37
Standard Deviation: 0.00 0.00 0 1.2 17.8% 11.0% 5.5% 3.7% 26.4% 5.1% 6.1% 0.14 0.18
Confidence Interval (95%):
0.2 3.7% 2.3% 1.1% 0.7% 5.3% 1.0% 1.2% 0.03 0.03
3 5% Average: 29.03 0.04 0 23.9 112.2% 73.1% 48.7% 31.5% 191.4% 56.0% 53.6% 1.27 1.34
Standard Deviation: 5.09 0.25 0 4.6 18.5% 12.1% 11.0% 5.8% 35.0% 5.0% 5.3% 0.13 0.16
Confidence Interval (95%):
0.9 3.8% 2.5% 2.2% 1.2% 7.1% 1.0% 1.1% 0.03 0.03
3 10% Average: 29.79 0.21 0 24.7 103.5% 70.3% 42.6% 29.0% 218.0% 58.5% 56.9% 1.26 1.32
Standard Deviation: 0.58 0.58 0 1.4 18.8% 12.2% 6.7% 5.1% 39.9% 4.4% 5.0% 0.11 0.13
Confidence Interval (95%):
0.3 3.8% 2.5% 1.4% 1.0% 8.1% 0.9% 1.0% 0.02 0.03
3 20% Average: 28.76 1.24 0 23.3 95.0% 67.3% 40.7% 29.0% 255.0% 63.6% 62.2% 1.24 1.30
Standard Deviation: 1.27 1.27 0 1.6 14.8% 9.9% 7.6% 6.0% 60.0% 3.8% 4.6% 0.13 0.17
Confidence Interval (95%):
0.3 3.1% 2.1% 1.6% 1.3% 12.5% 0.8% 1.0% 0.03 0.04
3 30% Average: 27.42 2.58 0.53 21.5 87.0% 63.6% 26.9% 20.4% 293.7% 67.1% 68.2% 1.19 1.27
Standard Deviation: 1.99 1.99 0.77 2.4 18.6% 11.8% 16.5% 13.1% 77.8% 4.9% 4.5% 0.11 0.13
Confidence Interval (95%):
0.7 5.6% 3.5% 4.9% 3.9% 23.3% 1.5% 1.3% 0.03 0.04
2 0% Average: 30.00 0.00 0 24.8 118.4% 74.0% 48.3% 30.2% 171.1% 52.7% 49.5% 1.30 1.37
Standard Deviation: 0.00 0.00 0 1.3 20.9% 12.1% 6.4% 4.0% 31.1% 5.5% 6.4% 0.13 0.17
Confidence Interval (95%):
0.2 3.1% 1.8% 0.9% 0.6% 4.5% 0.8% 0.9% 0.02 0.02
2 5% Average: 28.97 0.05 0 24.0 111.2% 72.3% 47.8% 30.8% 192.8% 55.7% 53.7% 1.28 1.35
Standard Deviation: 5.24 0.26 0 4.7 19.6% 13.0% 11.0% 5.1% 41.8% 5.4% 5.8% 0.13 0.16
Confidence Interval (95%):
0.7 2.9% 1.9% 1.6% 0.7% 6.1% 0.8% 0.8% 0.02 0.02
2 10% Average: 29.61 0.39 0 24.3 104.8% 70.9% 42.7% 29.0% 217.8% 58.6% 56.8% 1.25 1.31
Standard Deviation: 1.00 1.00 0 1.4 20.4% 12.6% 7.0% 4.6% 42.1% 4.8% 5.4% 0.13 0.17
Confidence Interval (95%):
0.3 4.4% 2.7% 1.5% 1.0% 9.2% 1.0% 1.2% 0.03 0.04

Palletization Method for Oversized Part Stacking with an Industrial Robotic Arm
49
Min. Initial Contacts
Stability Threshold
Nu
mb
er
of
Par
ts
Par
ts in
Bu
ffe
r
Un
pla
ced
Par
ts
Nu
mb
er
of
Par
ts
Ab
ove
Bin
Su
rfac
e
Bin
Vo
lum
e
Uti
lizat
ion
In B
in V
olu
me
Uti
lizat
ion
In B
in D
en
sity
Bin
De
nsi
ty
Ove
rhan
g R
atio
Are
a U
sage
Ab
ove
Bin
Are
a U
sage
Co
nta
ct N
um
be
rs
Ab
ove
Bin
Co
nta
cts
2 20% Average: 28.28 1.73 0 23.1 90.3% 64.5% 39.9% 28.6% 264.6% 63.2% 62.2% 1.24 1.29
Standard Deviation: 1.78 1.78 0 1.9 14.9% 9.4% 7.5% 5.5% 64.7% 3.8% 4.4% 0.11 0.14
Confidence Interval (95%):
0.3 2.5% 1.6% 1.2% 0.9% 10.7% 0.6% 0.7% 0.02 0.02
2 30% Average: 27.15 2.85 0.94 21.0 92.6% 65.5% 20.7% 14.9% 255.6% 65.7% 68.4% 1.19 1.29
Standard Deviation: 1.91 1.91 0.90 2.4 16.2% 10.4% 14.4% 10.7% 66.8% 4.0% 4.4% 0.13 0.17
Confidence Interval (95%):
0.6 4.0% 2.6% 3.6% 2.7% 16.5% 1.0% 1.1% 0.03 0.04
1 0% Average: 29.77 0.02 0 24.8 115.2% 72.1% 48.2% 30.3% 171.7% 52.1% 49.0% 1.27 1.33
Standard Deviation: 2.43 0.17 0 2.5 19.0% 11.7% 7.3% 5.0% 31.4% 5.8% 6.6% 0.13 0.15
Confidence Interval (95%):
0.4 3.2% 2.0% 1.2% 0.8% 5.3% 1.0% 1.1% 0.02 0.03
1 5% Average: 28.85 0.05 0 23.9 113.2% 73.6% 48.7% 31.3% 191.6% 56.0% 54.3% 1.28 1.35
Standard Deviation: 5.50 0.26 0 5.0 19.1% 13.1% 11.4% 5.1% 42.0% 5.3% 5.7% 0.14 0.17
Confidence Interval (95%):
0.8 3.3% 2.2% 1.9% 0.9% 7.2% 0.9% 1.0% 0.02 0.03
1 10% Average: 29.72 0.28 0 24.6 105.1% 71.1% 44.4% 30.1% 216.6% 59.4% 57.5% 1.26 1.32
Standard Deviation: 0.70 0.70 0 1.4 15.5% 9.8% 6.3% 4.4% 44.8% 4.7% 5.6% 0.13 0.16
Confidence Interval (95%):
0.2 2.7% 1.7% 1.1% 0.8% 7.7% 0.8% 1.0% 0.02 0.03
1 20% Average: 28.32 1.68 0 23.2 92.3% 65.5% 39.6% 28.2% 262.9% 62.8% 61.8% 1.23 1.28
Standard Deviation: 1.88 1.88 0 2.2 15.8% 8.9% 7.0% 5.0% 69.8% 4.0% 4.7% 0.11 0.14
Confidence Interval (95%):
0.4 2.7% 1.5% 1.2% 0.9% 11.9% 0.7% 0.8% 0.02 0.02
1 30% Average: 27.43 2.57 0.67 21.4 91.2% 67.0% 24.4% 18.4% 291.2% 67.5% 69.4% 1.21 1.31
Standard Deviation: 1.75 1.75 0.70 2.4 14.2% 8.9% 17.1% 13.2% 66.1% 4.3% 4.3% 0.13 0.19
Confidence Interval (95%):
0.5 2.7% 1.7% 3.3% 2.5% 12.6% 0.8% 0.8% 0.03 0.04
This data can be seen summarized in Figure 26 to Figure 29 below:

50
As shown in Figure 26, the overall volume usage decreases with increasing stability factors. This
is to be expected, as higher stability thresholds limit the potential placement locations. Volume
utilizations for stability thresholds above 10% are consistently above 100% utilization as this
metric compares the full volume of parts against the volume of the bin, rather than only the
portion of parts within the bin boundaries. The results for minimum contacts of 1, 2, and 3 are
shown and as can be seen, the results of all three are very similar.
Figure 26: Average Volume Utilization
In bin volume utilization, as seen in Figure 27 below, considers only the portion of a part within
the bin boundaries when calculating volume utilization. As such, the resulting efficiencies are
lower than those in Figure 26. Again, utilization decreases with increasing stability factors and
the results for minimum contact numbers of 1, 2, and 3 are highly similar.
80%
85%
90%
95%
100%
105%
110%
115%
120%
125%
0% 5% 10% 20% 30%
Vo
lum
e Fi
lled
(%
)
Minimum Stability Factor
Average Volume Utilization
Min3 BVU
Min2 BVU
Min1 BVU

Palletization Method for Oversized Part Stacking with an Industrial Robotic Arm
51
Figure 27: Average In Bin Volume Utilization
The average density of parts within the bin, as seen in Figure 28 below, is also inversely
proportional to the stability factor used and the effect of varying minimum contact numbers on
density is minimal. Like volume utilization, the packing density below uses the full volume of
parts but only the extents of the bin that have been utilized. This results in an over-reporting of
bin usage.
60%
62%
64%
66%
68%
70%
72%
74%
76%
0% 5% 10% 20% 30%
Vo
lum
e Fi
lled
(%
)
Minimum Stability Factor
Average In Bin Volume Utilization
Min3 IBVU
Min2 IBVU
Min1 IBVU

Palletization Method for Oversized Part Stacking with an Industrial Robotic Arm
52
Figure 28: Average Bin Density Utilization
In-bin density, as summarized in Figure 29, corrects for the under-reporting of packing density
by considering only the volume used within the bin boundaries and neglecting the overhanging
areas. As such, the packing density shown is higher.
10%
15%
20%
25%
30%
35%
0% 5% 10% 20% 30%
Vo
lum
e Fi
lled
(%
)
Minimum Stability Factor
Average Bin Density Utilization
MIN3 IBDU
Min2 IBDU
Min1 IBDU

Palletization Method for Oversized Part Stacking with an Industrial Robotic Arm
53
Figure 29: Average In Bin Density Utilization
As shown in Table 5 above, tests were performed for minimum stability thresholds from 0 to
30% and for minimum initial part contacts of three, two, and one. Attempts to utilize higher
minimum stability factors resulted in an unacceptably high number of un-stackable parts.
It should be noted that while tests using a 0% stability threshold had the most volume efficient
packing arrangements, numerous stacking failures were observed, caused by shifting and falling
parts. No such errors were observed for stability thresholds greater than 5%.
Based on the above statistical data tests, a 10% stability threshold was determined to be an
optimal value as it minimized the number of parts placed into the buffer bin while also creating
stable part stacks. While varying the minimum contact number did not have a noticeable effect
on the resulting stack efficiency, as seen by the overlapping confidence intervals in Figure 26 to
Figure 29, higher contact numbers did visually improve the stability of the stack.
15%
20%
25%
30%
35%
40%
45%
50%
55%
0% 5% 10% 20% 30%
Vo
lum
e Fi
lled
(%
)
Minimum Stability Factor
Average In Bin Density Utilization
Min3 BDU
Min2 BDU
Min1 BVU

Palletization Method for Oversized Part Stacking with an Industrial Robotic Arm
54
5.2. Published Data Set Simulations
After determining an optimal stability threshold using the statistical data trials, a new series of
trials were performed using the data sets created by Bischoff and Ratcliff and by Davies and
Bischoff. Fifteen trails of 100 tests were performed using the BR data sets. Due to the high
computation times caused by the very large number of parts in each test, occasionally over 600
parts per test, trials were performed using only a minimum contact number of 1.
The resulting data for each trial can be found in Table 6 below.

55
Table 6: Experimental Results Using BR Data Sets
Da
ta S
et
Nu
mb
er o
f P
arts
Par
ts in
Bu
ffer
Bin
Vo
lum
e U
tiliz
atio
n
In-B
in V
olu
me
U
tiliz
atio
n
In B
in D
en
sity
Bin
De
nsi
ty
Ove
rhan
g R
atio
1 139.2 3.6 74.7% 64.1% 64.8% 55.0% 280.0%
Standard Deviation
77.2 9.3 19.0% 16.2% 33.5% 20.7% 198.6%
Confidence Interval
15.1 1.8 3.7% 3.2% 6.6% 4.1% 38.9%
2 135.2 1.5 80.8% 69.2% 64.7% 55.4% 245.5%
St Dev 37.5 2.4 6.1% 4.9% 5.0% 4.4% 50.6%
Conf Int 7.4 0.5 1.2% 1.0% 1.0% 0.9% 9.9%
3 133.2 1.1 81.9% 70.0% 64.1% 54.8% 237.9%
St Dev 33.9 4.2 5.6% 4.5% 3.9% 3.4% 42.2%
Conf Int 6.6 0.8 1.1% 0.9% 0.8% 0.7% 8.3%
4 131.2 1.2 81.9% 69.8% 64.1% 54.7% 238.1%
St Dev 30.8 2.6 5.7% 4.8% 4.4% 3.9% 42.8%
Conf Int 6.0 0.5 1.1% 0.9% 0.9% 0.8% 8.4%
5 132.1 0.8 82.2% 69.9% 63.6% 54.1% 236.2%
St Dev 26.6 1.4 5.3% 4.2% 4.2% 3.5% 37.6%
Conf Int 5.2 0.3 1.0% 0.8% 0.8% 0.7% 7.4%
6 130.5 0.9 83.4% 70.8% 64.4% 54.7% 234.8%
St Dev 22.0 1.8 5.6% 4.4% 4.3% 3.5% 30.8%
Conf Int 4.3 0.3 1.1% 0.9% 0.8% 0.7% 6.0%
7 129.4 1.0 82.6% 70.1% 63.6% 54.0% 233.9%
St Dev 19.4 1.6 4.8% 3.9% 3.9% 3.3% 29.0%
Conf Int 3.8 0.3 0.9% 0.8% 0.8% 0.6% 5.7%

Palletization Method for Oversized Part Stacking with an Industrial Robotic Arm
56
Da
ta S
et
Nu
mb
er o
f P
arts
Par
ts in
Bu
ffer
Bin
Vo
lum
e U
tiliz
atio
n
In-B
in V
olu
me
U
tiliz
atio
n
In B
in D
en
sity
Bin
De
nsi
ty
Ove
rhan
g R
atio
8 129.8 0.9 83.1% 70.5% 63.8% 54.1% 231.2%
St Dev 16.4 1.3 4.5% 3.7% 3.5% 3.0% 23.8%
Conf Int 3.2 0.3 0.9% 0.7% 0.7% 0.6% 4.7%
9 127.9 1.0 83.7% 71.1% 64.0% 54.4% 229.8%
St Dev 14.9 1.3 4.5% 3.7% 3.4% 2.9% 20.5%
Conf Int 2.9 0.2 0.9% 0.7% 0.7% 0.6% 4.0%
10 129.2 1.0 83.1% 70.5% 63.5% 53.9% 229.9%
St Dev 14.1 1.7 4.8% 4.0% 3.8% 3.3% 17.9%
Conf Int 2.8 0.3 0.9% 0.8% 0.7% 0.6% 3.5%
11 128.7 0.8 82.6% 70.0% 63.2% 53.6% 230.4%
St Dev 13.0 1.4 5.0% 4.1% 3.7% 3.1% 19.0%
Conf Int 2.5 0.3 1.0% 0.8% 0.7% 0.6% 3.7%
12 129.7 0.6 83.9% 71.2% 64.1% 54.5% 229.3%
St Dev 12.1 1.2 4.8% 3.9% 3.7% 3.2% 16.8%
Conf Int 2.4 0.2 0.9% 0.8% 0.7% 0.6% 3.3%
13 129.7 0.7 84.4% 71.6% 64.4% 54.6% 230.6%
St Dev 11.4 1.3 4.4% 3.4% 3.5% 2.8% 15.8%
Conf Int 2.2 0.2 0.9% 0.7% 0.7% 0.6% 3.1%
14 129.3 0.7 83.5% 71.0% 63.8% 54.2% 229.2%
St Dev 10.4 1.0 4.6% 3.8% 3.7% 3.1% 13.6%
Conf Int 2.0 0.2 0.9% 0.7% 0.7% 0.6% 2.7%
15 129.2 0.7 84.5% 71.6% 64.7% 54.8% 229.7%
St Dev 9.5 1.3 4.3% 3.6% 3.4% 3.0% 13.1%
Conf Int 1.9 0.2 0.8% 0.7% 0.7% 0.6% 2.6%

57
A summary of these results can be seen summarized in the graphs shown in Figure 30 to Figure 33
below. These results include both the average utilization and the utilization +/- the standard
deviation for each test. The results for all tests are stable across all BR data sets, with a slight
increase in volume utilization and in-bin volume utilization as part variation increases in the higher
numbered data sets. A significantly large standard deviation can be observed in BR dataset 1 as this
dataset includes a number of tests with extremely high numbers of parts (>500) which affect the
performance of this method.
Figure 30: BR Volume Efficiency
50.0%
55.0%
60.0%
65.0%
70.0%
75.0%
80.0%
85.0%
90.0%
95.0%
100.0%
0 1 2 3 4 5 6 7 8 9 10 11 12 13 14 15
% U
tiliz
atio
n
BR Test
BR Volume Utilization
-sDev
Average
+sDev

Palletization Method for Oversized Part Stacking with an Industrial Robotic Arm
58
Figure 31: BR In-Bin Volume Efficiency
Figure 32: BR In-Bin Density Efficiency
40.0%
45.0%
50.0%
55.0%
60.0%
65.0%
70.0%
75.0%
80.0%
85.0%
0 1 2 3 4 5 6 7 8 9 10 11 12 13 14 15
% U
tiliz
atio
n
BR Test
BR In-Bin Volume Utilization
-sDev
Average
+sDev
20.0%
30.0%
40.0%
50.0%
60.0%
70.0%
80.0%
90.0%
100.0%
0 1 2 3 4 5 6 7 8 9 10 11 12 13 14 15
% U
tiliz
atio
n
BR Test
BR In-Bin Density Utilization
-sDev
Average
+sDev

Palletization Method for Oversized Part Stacking with an Industrial Robotic Arm
59
Figure 33: BR Density Efficiency
30.0%
35.0%
40.0%
45.0%
50.0%
55.0%
60.0%
65.0%
70.0%
75.0%
80.0%
0 1 2 3 4 5 6 7 8 9 10 11 12 13 14 15
% U
tiliz
atio
n
BR Test
Bin Density Utilization
-sDev
Average
+sDev

60
5.3. Physical Testing Results
After completing the simulation trials, physical tests of the system performance was performed
using the scaled test cell as described in Section 4.3 and shown in Figure 34 below, to ensure that
the system’s collision detection, path planning, and stability algorithms performed as intended.
Figure 34: Completed Truss Assemblies in Test Cell
Tests were performed at 30% path profile speed to ensure that parts did not shift due to
vibrations in the table caused by rapid robot movements. If the profile was run at 100% speed, an
average stacking rate of 13.5s-1 can be expected.
For physical testing, six sets of parts based on manufacturer-provided cut files were used,
varying in quantity from 10-21 parts per truss. To determine the validity of the part
simplifications made for simulations, parts included the same angled cuts on their ends that
would be applied during manufacturing.

Palletization Method for Oversized Part Stacking with an Industrial Robotic Arm
61
During the physical testing, minimal part shifting was observed and, as seen in Figure 35 below,
the results obtained during physical testing matched their simulated counterparts. The
simplification of parts for simulation did not appear to negatively impact the overall stability of
the process and both the stacking and path planning algorithms functioned as intended.
Figure 35: Simulated (Left) and Physically Tested (Right) Truss Assembly

Palletization Method for Oversized Part Stacking with an Industrial Robotic Arm
62
Chapter 6. Discussion
As seen in Figure 26 to Figure 29, the overall performance of the algorithm decreased as the
stability factor was increased. This was to be expected, as prioritizing part stability and rejecting
potential placement points is likely to lead to more unused space. As such, the stability threshold
must be carefully balanced to ensure that a stack is both adequately stable and efficiently uses the
bin volume.
6.1. Overall System Performance
Overall, the bin packing method developed in this thesis performed well: successfully fitting the
desired number of parts within and overhanging from the bin area in stable stacks with a
computation time of 8.7 seconds for a 30-part truss. However, as seen in Figure 36, the
calculation time increases logarithmically as the number of parts is increased and very large
assemblies can take more than 10 minutes to process. Note that these tests were performed using
a 3.40GHz i7-2600 processor.

Palletization Method for Oversized Part Stacking with an Industrial Robotic Arm
63
Figure 36: Part Count vs Computation Time
The average bin volume utilization, as seen in Figure 26, was often above 100% for lower
minimum stability factors. This is to be expected for an efficiently packed bin, where the volume
of parts is greater than the volume of the bin itself. However, the overall and in-bin density
utilizations, as seen in Figure 28 and Figure 29, were significantly lower than the total volume
utilization. These lower densities can be in part attributed to the large bounding box lengths
caused by parts longer than the bins themselves.
6.1. Optimizing the Stability Threshold:
Through both simulations and physical testing, it was found that a 10% stability threshold was
adequate for a stack to be stable in a static environment. This may appear insufficient at first
glance. However, let us consider the following:

Palletization Method for Oversized Part Stacking with an Industrial Robotic Arm
64
For a given stability factor, a centrally supported part is at the greatest risk of shifting due to an
external disturbance, as an external disturbance applied to either end will result in an unbalanced
moment. As an object’s supports move towards its extents, the object becomes more resistant to
these disturbances. Therefore, for a given stability factor, a centrally supported object will be the
least stable. The stability factor for an object that is centrally supported in one quadrant is:
𝑆 = 𝑛𝑊𝐿2
16=
𝑤𝑙2
4
Where S is the part’s stability factor, n is the percentage stability threshold, W and L are the
overall width and length of the part, and w and l are the supported width and length. The
minimum supported length l in the quadrant will occur when the supported width is at its
maximum: half of the part’s overall width (W/2 = w). As such, the minimum length of a
centrally supported part quadrant is as follows:
√𝑛𝐿2
4= 𝑙 = √𝑛
𝐿
2
Or, written as a fraction of the part’s overall length:
𝑙/𝐿 = √𝑛
2
If both sides of the part’s centroid are supported this way, the overall supported length will be the
square root of the percentage stability factor. The x-stability can be found in a same manner. As
such a centrally supported part with a 10% stability factor will be supported along 31.6% of its
surface area.

Palletization Method for Oversized Part Stacking with an Industrial Robotic Arm
65
6.2. Effects of Varying Minimum Contact Numbers
The differences in bin utilization caused by varying minimum contact number tests was
relatively small and, as seen in Figure 26 to Figure 29, lie within each other’s confidence
intervals. This result was unexpected and suggests that the improved stack stability has not
negatively affected the space utilization of the bin. As such, a larger initial minimum contact
number is desirable to increase stack stability.
6.2.1. Effectiveness vs Previous Works
As seen in Figure 37 and Figure 38 below, the packing method did not perform as well as
previous works using the BR data sets. Figure 37 compares the performance of this work
(referred to as ‘Driedger’) with previous works that employed some method of stability control
while Figure 38 compares this work to methods that did not consider stability.

Palletization Method for Oversized Part Stacking with an Industrial Robotic Arm
66
Figure 37: Average Volume Efficiencies for BR Literature with Stability Methods
80.00
82.00
84.00
86.00
88.00
90.00
92.00
94.00
96.00
Vo
lum
e U
tiliz
atio
n (
%)
Comparative Volume Utilization for Stability Methods
BR1-7
BR8-15
BR1-15

Palletization Method for Oversized Part Stacking with an Industrial Robotic Arm
67
Figure 38: Average Volume Efficiencies for BR Literature without Stability Methods
This lower performance can be attributed to the differences between the BR data and the
manufacturer data used to develop this method. This method was developed for parts with
identical heights while the BR data trials employ parts of varying height. This variation reduces
the effectiveness of the layer based stacking approach developed in this work.
75.0
80.0
85.0
90.0
95.0
100.0
Bis
cho
ff a
nd
Rat
clif
f (1
99
5c)
[1
]
Ge
hri
ng
and
Bo
rtfe
ldt
(19
97
N)
[34
]
Bo
rtfe
ldt
et a
l. (2
00
3)
[3
5]
Bo
rtfe
ldt
et a
l. (2
00
3)
(set
b)
[35
]
Lim
et
al. (
20
05
) [
36
]
Mac
k et
al.
(20
04
) [3
7]
Lim
et
al. (
20
05
) [3
6]
Par
ren
o e
t al
. (2
00
8)
[3
8]
Fan
slau
an
d B
ort
feld
t (2
01
0)
[3
9]
He
and
Hu
ang
(20
10
) [4
0]
Par
ren
o e
t al
. (2
01
0)
[41
]
Der
eli a
nd
Das
(2
01
1)
[42
]
He
and
Hu
ang
(20
11
) [4
3]
Lim
et
al. (
20
12
) [4
4]
Go
nca
lves
an
d R
esen
de
(20
12
) [4
1]
Zhu
an
d L
im (
20
12
) [3
2]
Zhu
et
al. (
20
12
) [4
2]
Zhu
et
al. 2
01
2)
[42
]
Zhu
an
d L
im (
20
12
) [3
2]
Ara
ya a
nd
Rif
f (2
01
4)
[33
]
Dri
edge
r
Vo
lum
e U
tiliz
atio
n (
%)
Comparative Volume Utilization for Non-Stability Methods
BR1-7 Average
BR8-15 Average
Average

Palletization Method for Oversized Part Stacking with an Industrial Robotic Arm
68
Additionally, while parts within the BR data have length to width ratios of up to 5:1, parts in the
manufacturer’s data set can have ratios of up to 60:1. The smaller ratios shown in the BR data
sets do not allow the method described here to take advantage of part overhang in the same
manner.

69
Chapter 7. Conclusion and Recommendations
The palletization method described here is capable of repeatedly fitting the desired number of
parts, including parts larger than the bin dimensions themselves, into stable stacks within an
acceptable computation time of 8.7 seconds while allowing significant overhang outside of the
bin boundaries. The stability assessment method developed, the stability threshold, proved to be
an effective predictor of part stability, and the method performed as expected in both simulations
and physical testing.
The ability to accommodate overhanging parts means this method may be beneficial for other bin
packing and palletizing applications where overhang is an acceptable variable. Meanwhile, the
stability assessment method utilized here can be applied to a wide range of applications to better
quantify part stability.
7.1. Conclusion
Based on the literature reviewed, this thesis is the first attempt to produce a bin packing method
that allows parts to overhang beyond the bin boundaries. Accepting overhang allows this method
to exceed 100% volume utilization, 105%+/-5% for a 10% stability threshold, and to allow
packing of parts with dimensions greater than those of the bin themselves. Allowing these
overhangs required a greater emphasis on stack stability and so a novel stability assessment tool,
the stability threshold, was developed. This assessment metric is more robust than previous edge
usage or area usage metric as it is able to account for multiple causes of instability and consider
global stability rather than just the area directly beneath a new placement.
Overall, this thesis has satisfied the objectives put forth in the problem statement; developing a
palletization method capable of consistently stacking highly heterogeneous narrow parts into

Palletization Method for Oversized Part Stacking with an Industrial Robotic Arm
70
stable and dense stacks while allowing parts to overhang from the bin and verifying this
method’s performance through simulations and physical testing. This work has demonstrated that
overhang methods can be effectively implemented to solve bin packing problems and introduced
new methods of ensuring palletization stability.
7.2. Recommendations
Based on the work developed in this thesis, several areas have been identified for future work.
Broadly, this work can be separated into improving the bin packing algorithm and improving the
overall palletization system.
While the overall volume utilization for this method was very high, the in-bin volume utilization
was approximately 71% for a 10% Stability threshold. This leaves significant room for
improvement which may be achieved by adapting the bin packing method described here into a
non-greedy algorithm. By considering how individual placements will impact the overall usage
efficiency, more global optimum placements can be made and the packing density and volume
utilization can be improved.
More broadly, the overall palletizing system can be improved by converting it into a closed loop
system. The path planning method as implemented is currently open loop, relying on external
mechanisms to ensure that parts are placed in the correct order and orientation in the input
buffer. As is, the system cannot detect in-feed errors or shifted parts that may cause the robot to
crash or incorrectly place parts. As such, it is strongly recommended that the current system be
augmented with computer vision and other sensors to create a closed loop system. If these
sensors are included, there is the additional opportunity to convert to a real-time system which
would allow the palletization process to adapt path planning based on parts as they enter the
system.
Palletization Method for Oversized Part Stacking with an Industrial Robotic Arm
71
An additional area for future work is to explore alternative uses for this method and overhang
based bin packing solutions in general where it can be permissible to allow a certain portion of a
process to occur outside of set bounds. One such usage may be in labour scheduling, where
allowing a smaller portion of work to fall outside of normal operating hours may improve overall
schedule efficiencies.

Palletization Method for Oversized Part Stacking with an Industrial Robotic Arm
72
References
[1] H. Gruschinski, “The Future of the Industrial Robotics Market,” in 2015 IEEE 20th
Conference on Emerging Technologies & Factory Automation (ETFA), Luxembourg,
2015.
[2] International Federation of Robotics (IFR), “World Robotics 2017: Industrial Robots,”
VDMA Verlag GmbH, Frankfurt am Main, 2017.
[3] S. B. Niku, Introduction to Robotics: Analysis, Control, Applications, John Wiley & Sons,
2010.
[4] C. Zhou, ISYE 4256 SUPPLEMENTAL MATERIAL, Atlanta: School of Industrial and
Systems Engineering Georgia Institute of Technology, 1999.
[5] R. Krug, T. Stoyanov, V. Tincani, H. Andreasson, R. Mosberger, G. Fantoni and A. J.
Lilienthal, “The Next Step in Robot Commissioning: Autonomous Picking and
Palletizing,” IEEE Robotics and Automation Letters, vol. 1, no. 1, pp. 546-553, 2016.
[6] E. E. Bischoff and M. Ratcliff, “Loading Multiple Pallets,” The Journal of Operational
Research Society, vol. 46, no. November, pp. 1322-1336, 1995.
[7] K. Fleszar, “Three Insertion Heuristics and a Justification Improvement Heuristic for Two-
dimensional Bin Packing with Guillotine Cuts,” Computers & Operations Research, vol.
10, no. 1, pp. 463-474, 2012.
[8] Y.-P. Cui, Y. Cui and T. Tang, “Sequential Heuristic for the Two-Dimensional Bin-
Packing Problem,” European Journal of Operational Research, vol. 240, no. 1, pp. 43-53,
2015.
[9] S. Hong, D. Zhang, H. C. Lau, X. Zeng and Y.-W. Si, “A Hybrid Heuristic Algorithm for
the 2D Variable-Sized Bin Packing Problem,” European Journal of Operational Research,
vol. 238, no. 1, pp. 95-103, 2014.
[10] N. Mustafee and E. Bischoff, “Analysing Trade-offs in Container Loading: Combining
Load Plan Construction Heuristics with Agent-based Simulation,” International
Transactions in Operational Research, vol. 20, no. 4, p. 471–491, 2013.
[11] E. Lopez-Camacho, H. Terashima-Marin, P. Ross and G. Ochoa, “A Unified Hyper-
Heuristic Framework for Solving Bin Packing Problems,” Expert Systems with
Applications, vol. 41, no. 15, pp. 6876-6889, 2014.

Palletization Method for Oversized Part Stacking with an Industrial Robotic Arm
73
[12] X. Zhao, J. A. Bennel, T. Bektas and K. Dowsland, “A Comparative Review of 3D
Container Loading Algorithms,” International Transactions In Operational Research, vol.
23, pp. 287-320, 2016.
[13] S. Takahara, “A Multi-start Local Search Approach to the Multiple Container Loading
Problem,” in Greedy Algorithms, Witold Bednorz (Ed.), InTech, 2008, pp. 55-68.
[14] G. Stavrinides and H. Karatza, “Scheduling Multiple Task Graphs in Hetrogeneous
Distributed Real-Time Systems by Exploiting Schedule Holes with Bin Packing
Techniques,” Simulation Modelling Practice and Theory, vol. 19, no. 1, pp. 540-552, 2011.
[15] K. Glowacka and Y. Tjader, “An Emperical Study of Three Packing Heuristics for Bins
with Adjustable Capacity - An Application to Operating Room Scheduling,” in 35th
Annual Meeting of the Decision Sciences Institute, Boston, 2004.
[16] E. Dube and L. Kanavathy, “Optimizing Three-Dimensional Bin Packing Through
Simulation,” in Sixth IASTED International Conference Modelling, Simulation, and
Optimization, Gaborone, Botswana, 2006.
[17] S. Balakirsky, T. Kramer and F. Proctor, “Metrics for Mixed Palet Stacking,” Proceedings
of the 10th Performance Metrics for Intelligent Systems Workshop, pp. 54-61, 2010.
[18] G. Demisse, R. Mihalyi, B. Okal, D. Poudel, J. Schauer and A. Nuchter, “Mixed Palletizing
and Task Completion for Virtual Warehouses,” Virtual Manufacturing and Automation
Competition (VMAC) Workshop at the Int. Conference of Robotics and Automation (ICRA),
2012.
[19] S. Lim, S. Yu, C. Han and M. Kang, “Palletizing Simulator Using Optimized Pattern and
Trajectory Generation Algorithm,” in Mechatronic Systems Applications, Shanghai,
INTECH, 2010, pp. 281-300.
[20] S. Balakrisky and Z. Kootbally, “USARSIM/ROS: A COMBINED FRAMEWORK FOR
ROBOTIC CONTROL AND SIMULATION,” in Proceedings of the ASME 2012
International Symposium On Flexible Automation, St. Louis, 2012.
[21] M. Schuster, R. Bormann, D. Steidl, S. Reynolds-Haertle and M. Stilman, “Stable Stacking
for the Distributor’s Pallet Packing Problem,” in International Conference on Intelligent
Robots and Systems, Taipei, 2010.

Palletization Method for Oversized Part Stacking with an Industrial Robotic Arm
74
[22] N. Ivancic, “An integer programming based heuristic approach to the three-dimensional
packing problem,” Journal of Manufacturing and Operations Management, vol. 2, no. 4,
pp. 268-298, 1989.
[23] T. Loh and A. Nee, “A packing algorithm for hexahedral boxes,” in Proceedings of
theConference of Industrial Automation, pp. 115-126, Singapore, 1992.
[24] E. Bischoff and M. Ratcliff, “Issues in the Development of Approaches to Container
Loading,” Omega, vol. 23, no. 4, pp. 377-390, 1995.
[25] A. P. Davies and E. E. Bischoff, “Weight Distribution Considerations in Container
Loading,” European Journal of Operational Research, vol. 114, no. 3, pp. 509-527, 1999.
[26] S. Martello, D. Pisinger and D. Vigo, “The Three-Dimensional Bin Packing Problem,”
Operations research, vol. 48, no. 2, pp. 256-267, 2000.
[27] A. Bortfeldt and H. Gehring, “Applying tabu search to container loading problems,”
Operations Research Proceedings, vol. 1997, pp. 533-538, 1998.
[28] A. Bortfedt and H. Gehring, “A hybrid genetic algorithm for the container loading
problem,” European Journal of Operational Research, vol. 131, pp. 143-161, 2001.
[29] H. Gehring and A. Bortfeldt, “A parallel genetic algorithm for solving the container
loading problem,” International Transactions in Operational Research, no. 9, pp. 497-511,
2002.
[30] A. Moura and J. Oliveira, “A GRASP approach to the container-loading problem,” IEEE
Intelligent Systems 20,, vol. 20, pp. 50-57, 2005.
[31] A. Bortfeldt, “Eine Heuristik fur Multiple Containerladeprobleme,” OR Spektrum, vol. 22,
pp. 239-261, 2000.
[32] T. Fanslau and A. Bortfeldt, “A tree search algorithm for solving the container loading
problem,” INFORMS Journal on Computing, vol. 22, pp. 222-235, 2010.
[33] J. Liu, Y. Yue, Z. Dong, C. Maple and M. Keech, “A novel hybrid tabu search approach to
container loading,” Computers & Operations Research, vol. 38, pp. 797-807, 2011.
[34] J. Ren and T. Sawaragi, “A tree search method for the container loading problem with
shipment priority,” European Journal of Operational Research 214,, vol. 214, pp. 526-535,
2011.
Palletization Method for Oversized Part Stacking with an Industrial Robotic Arm
75
[35] J. Goncalves and M. Resende, “A parallel multi-population biased random-key genetic
algorithm for a container loading problem,” Computers & Operations Research, vol. 39,
pp. 179-190, 2012.
[36] D. Zhang, Y. Peng and S. Leung, “A heuristic block-loading algorithm based on multi-
layer search for the container loading problem,” Computers & Operations Research, vol.
39, pp. 2267-2276, 2012.
[37] Z. W., W. Huang and A. Lim, “A prototype column generation strategy for themultiple
container loading problem,” European Journal of Operational Research, vol. 223, pp. 27-
39, 2012.
[38] W. Zhu and A. Lim, “A new iterative-doubling Greedy-Lookahead algorithm for the single
container loading problem,” European Journal of Operational Research, vol. 222, pp. 408-
417, 2012.
[39] I. Araya and M. Riff, “A beam search approach to the container loading problem,”
Computers & Operations Research, vol. 44, pp. 100-107, 2014.
[40] H. Gehring and A. Bortfeldt, “Agenetic algorithm for solving the container loading
problem,” International Transactions in Operational Research, vol. 4, pp. 401-418, 1997.
[41] A. Bortfeldt, H. Gehring and D. Mack, “A parallel tabu search algorithm for solving the
container loading problem,” Parallel Computing, vol. 29, pp. 641-662, 2003.
[42] A. Lim, B. Rodrigues and Y. Yang, “3-D container packing heuristics,” Applied
Intelligence 22,, vol. 22, pp. 125-134, 2005.
[43] D. Mack, A. Bortfeldt and H. Gehring, “A parallel hybrid local search algorithm for the
container loading problem,” International Transactions in Operational Research 11,, vol.
11, pp. 511-533, 2004.
[44] F. Parreno, R. Alvarez-Valdes, J. Tamarit and J. Oliveira, “A maximal-space algorithm for
the container loading problem,” INFORMS Journal on Computing, vol. 20, pp. 412-422,
2008.
[45] T. Fanslau and A. Bortfeldt, “A tree search algorithm for solving the container loading
problem,” INFORMS Journal on Computing, vol. 22, pp. 222-235, 2010.
[46] K. He and W. Huang, “A caving degree based flake arrangement approach for the
container loading problem,” Computers & Industrial Engineering, vol. 59, pp. 344-351,
2010.

Palletization Method for Oversized Part Stacking with an Industrial Robotic Arm
76
[47] F. Parreno, R. Alvarez-Valdes, J. Oliveira and J. Tamarit, “Neighborhood structures for the
container loading problem: a VNS implementation,” Journal of Heuristics, vol. 16, pp. 1-
22, 2010.
[48] T. Dereli and G. Das, “A hybrid bee(s) algorithm for solving container loading problems,”
Applied Soft Computing, vol. 11, pp. 2854-2862, 2011.
[49] K. He and W. Huang, “An efficient placement heuristic for three-dimensional rectangular
packing,” Computers & Operations Research, vol. 38, pp. 227-233, 2011.
[50] A. Lim, H. Ma, J. Xu and X. Zhang, “An iterated construction approach with dynamic
prioritization for solving the container loading problems,” Expert Systems with
Applications, vol. 39, pp. 4292-4305, 2012.
[51] W. Zhu, W. Huang and A. Lim, “Aprototype column generation strategy for themultiple
container loading problem,” European Journal of Operational Research, vol. 223, pp. 27-
39, 2012.
[52] W. Zhu, W. Oon, A. Lim and Y. Weng, “The six elements to block-building approaches
for the single container loading problem,” Applied Intelligence, vol. 37, pp. 431-445, 2012.
[53] T. Sørensen, S. Foged, J. M. Gravers, M. N. Janardhanan, P. Nielsen and O. Madsen, “3D
Pallet Stacking with Rigorous Vertical Stability,” Distributed Computing and Artificial
Intelligence, 13th International Conference, vol. 474, pp. 535-544, 2016.
[54] H. Carpenter and D. B., “Practical Considerations of the Pallet-Loading Problem,” The
Journal of the Operational Research Society, vol. 36, no. 6, pp. 489-497, 1985.
[55] Y.-L. Wu, W. Huang, S.-c. Lau, C. Wong and G. Young, “An effective quasi-human based
heuristic for solving the rectangle packing problem,” European Journal of Operational
Research, vol. 141, no. 2, pp. 341-358, 2002.
[56] J. Egeblad and D. Pisinger, “Heuristic approaches for the two- and three dimensional
knapsack packing problems,” Computers & Operations Research, vol. 36, no. 4, pp. 1026-
1049, 2006.
[57] A. Schyja and B. Kuhlenkotter, “Realistic Simulation of Industrial Bin-Picking Systems,”
in 6th International Conference on Automation, Robotics, and Applicaitons, Queenstown,
2015.
Palletization Method for Oversized Part Stacking with an Industrial Robotic Arm
77
[58] R. Sarraj, E. Ballot, S. Pan, D. Hakimi and B. Montreuil, “Interconnected Logistic
Networks and Protocols: Simulation-Based Efficiency Assessment,” International Journal
of Production Research, vol. 52, no. 11, pp. 3185-3208, 2013.
[59] M. Reynolds, D. Hulce, K. Hopkinson, M. Oxley and B. Mullins, “A Bin Packing Heuristic
for On-Line Service Placement and Performance Control,” IEEE Transactions on Network
and Service Management, vol. 10, no. 3, pp. 326 - 339, 2013.
[60] J. Ghaderi, Y. Zhong and R. Srikant, “Asymptotic Optimality of Best-Fit for Stochastic Bin
Packing,” ACM SIGMETRICS Performance Evaluation Review, vol. 42, no. 2, pp. 64-66,
2014.
[61] H. Gehring and A. Bortfeldt, “A parallel genetic algorithm for solving the container
loading problem,” InternationalTransactions in Operational Research, vol. 9, pp. 497-511,
2002.