palo verde, units 1, 2, and 3 - annual radioactive …offsite dose calculation manual palo verde...
TRANSCRIPT

QapsTechnical Specification 5.6.3
Technical Requirements Manual 3.7.102.4
Palo VerdeNuclear Generating StationPO Box 52034Phoenix, Arizona 85072-2034 Maii Station 7636
102-07491 TNW/MDD/TMJ April 21, 2017
ATTN: Document Control Desk U.S. Nuclear Regulatory Commission Washington, DC 20555-0001
Dear Sirs:
Subject: Palo Verde Nuclear Generating Station (PVNGS)Units 1, 2, 3 and Independent Spent Fuel Storage Installation Docket Nos. STN 50-528/529/530 and 72-44 Annual Radioactive Effluent Release Report 2016
In accordance with Technical Specification 5.6.3, the annual radioactive effluent release report for 2016 is enclosed.
PVNGS Technical Requirement Manual section 3.7.102.4 requires an annual report to be prepared and submitted if sealed source or fission detector leakage tests reveal the presence of greater than or equal to 0.005 micro curies of removable radiation. There were no events in 2016 that met this reporting threshold.
No new commitments are being made to the NRC by this letter. Should you need further information regarding this submittal, please contact Michael DiLorenzo, Licensing Section Leader, at (623) 393-3495.
Sincerely,
Weber, Thomas N(Z00499) DN: cn=Weber, Thomas N(Z00499)
Reason: l am approving this document Date: 2017.04.21 14:47:11 -07'00'
Thomas N. WeberDepartment Leader, Regulatory Affairs
TNW/MDD/TMJ/sma
Enclosure: Palo Verde Nuclear Generating Station Units 1, 2 and 3 2016 Annual Radioactive Effluent Release Report
cc: K. M. KennedyS. P. Lingam M. M. Watford C. A. Peabody A. V. GodwinT. Morales
NRC Region IV Regional Administrator NRC NRR Project Manager for PVNGS NRC NRR Project Manager NRC Senior Resident Inspector for PVNGS Arizona Radiation Regulatory Agency (ARRA) Arizona Radiation Regulatory Agency (ARRA)
A member of the STARS Alliance LLC Callaway • Diablo Canyon • Palo Verde • Wolf Creek

Enclosure Palo Verde Nuclear Generating Station
Units 1, 2, & 3 2016 Annual Radioactive Effluent Release Report

PALO VERDE NUCLEAR GENERATING STATION UNITS 1,2 AND 3
2016
ANNUAL RADIOACTIVE EFFLUENT RELEASE REPORT
USNRC Docket No. STN 50-528/529/530 RCTSA11566
e 4McDowell,Joshua
Prepared by: (Z08270)
Routolo,Reviewed by: Robert
M(Z99739)Approved by:
Carl(Z09119)
Digitally signed by McDowell, Joshua (Z08270)DN: cn=McDowel(. Joshua (Z08270)Reason; I am the author of this documentDate; 2017.04.14 17:42:41 -OT-OO*
Oigtially signed by RouUilo, Robert M(Z99739)
ON: cneRoototo, Robert M(Ze9739) Reason: t have reviewed trtls document Date: 2017.04,15 05:55:37 -07W
Digitally signed by Moeller, Carl (Z09119) DN: cn=Moeller, Carl (Z09119)Date: 2017.04.15 07:46:51 -07'00'
PVNGS 2016 ARERR Page 2
TABLE OF CONTENTS
SECTION PAGE
INTRODUCTION ........................................................................................................................................... 5
BIBLIOGRAPHY ............................................................................................................................................ 6
APPENDIX A SOURCE TERMS AND EFFLUENT AND WASTE DISPOSAL REPORTS........................... 7
APPENDIX B METEOROLOGY .................................................................................................................. 61
APPENDIX C DOSE CALCULATIONS ....................................................................................................... 84
APPENDIX D NEI 07-07 GROUNDWATER PROTECTION INITIATIVE SAMPLING ................................ 93
LIST OF TABLES
TABLE PAGE
1 Evaporation Pond Data ..................................................................................................................................... 17
2 Batch Release Data .......................................................................................................................................... 17
3 Units 1, 2 & 3 Gaseous Effluents Average Lower Limit Of Detection ............................................................... 18
4 Unit 1 Gaseous Effluents - Summation of All Releases .................................................................................... 19
5 Unit 1 Gaseous Effluents - Ground Level Releases - Continuous - Fission Gases and Iodines ...................... 20
6 Unit 1 Gaseous Effluents - Ground Level Releases - Continuous - Particulates .............................................. 21
7 Unit 1 Gaseous Effluents - Ground Level Releases - Batch - Fission Gases and Iodines ............................... 22
8 Unit 1 Gaseous Effluents - Ground Level Releases - Batch - Particulates ....................................................... 23
9 Unit 1 Gaseous Effluents - Continuous and Batch - Fission Gases and Iodines .............................................. 24
10 Unit 1 Gaseous Effluents - Continuous and Batch - Particulates ..................................................................... 25
11 Unit 1 Radiation Doses at and Beyond the Site Boundary ............................................................................... 26
PVNGS 2016 ARERR Page 3
LIST OF TABLES
TABLE PAGE
12 Unit 2 Gaseous Effluents - Summation of All Releases ................................................................................... 27
13 Unit 2 Gaseous Effluents - Ground Level Releases - Continuous - Fission Gases and Iodines ..................... 28
14 Unit 2 Gaseous Effluents - Ground Level Releases - Continuous - Particulates ............................................. 29
15 Unit 2 Gaseous Effluents - Ground Level Releases - Batch - Fission Gases and Iodines ............................... 30
16 Unit 2 Gaseous Effluents - Ground Level Releases - Batch - Particulates ...................................................... 31
17 Unit 2 Gaseous Effluents - Continuous and Batch - Fission Gases and Iodines ............................................. 32
18 Unit 2 Gaseous Effluents - Continuous and Batch - Particulates ..................................................................... 33
19 Unit 2 Radiation Doses at and Beyond the Site Boundary ............................................................................... 34
20 Unit 3 Gaseous Effluents - Summation of All Releases ................................................................................... 35
21 Unit 3 Gaseous Effluents - Ground Level Releases - Continuous - Fission Gases and Iodines ..................... 36
22 Unit 3 Gaseous Effluents - Ground Level Releases - Continuous - Particulates ............................................. 37
23 Unit 3 Gaseous Effluents - Ground Level Releases - Batch - Fission Gases and Iodines ............................... 38
24 Unit 3 Gaseous Effluents - Ground Level Releases - Batch - Particulates ...................................................... 39
25 Unit 3 Gaseous Effluents - Continuous and Batch - Fission Gases and Iodines ............................................. 40
26 Unit 3 Gaseous Effluents - Continuous and Batch - Particulates ..................................................................... 41
27 Unit 3 Radiation Doses at and Beyond the Site Boundary ............................................................................... 42

PVNGS 2016 ARERR Page 4
LIST OF TABLES
TABLE PAGE
28 Units 1, 2, and 3 Gaseous Effluents - Continuous - Fission Gases and Iodines - Total By Quarter ................ 43
29 Units 1, 2, and 3 Gaseous Effluents - Continuous - Particulates - Total By Quarter ........................................ 44
30 Units 1, 2, and 3 Gaseous Effluents - Batch - Fission Gases and Iodines - Total By Quarter .......................... 45
31 Units 1, 2, and 3 Gaseous Effluents - Batch - Particulates - Total By Quarter ................................................. 46
32 Units 1, 2, and 3 Gaseous Effluents - Continuous and Batch - Fission Gases and Iodines - Total By Quarter 47
33 Units 1, 2, and 3 Gaseous Effluents - Continuous and Batch - Particulates - Total By Quarter ....................... 48
34 Units 1, 2 and 3 Gaseous Effluents- Continuous - Fission Gases and Iodine - Total By Unit .......................... 49
35 Units 1, 2 and 3 Gaseous Effluents- Continuous - Particulates - Total By Unit ................................................ 50
36 Units 1, 2 and 3 Gaseous Effluents- Batch - Fission Gases and Iodine - Total By Unit ................................... 51
37 Units 1, 2 and 3 Gaseous Effluents- Batch - Particulates - Total By Unit ......................................................... 52
38 Units 1, 2 and 3 Gaseous Effluents- Continuous and Batch - Fission Gases and Iodine - Total By Unit ......... 53
39 Units 1, 2 and 3 Gaseous Effluents - Continuous and Batch - Particulates - Total By Unit .............................. 54
40 Estimation of Total Percent Error ...................................................................................................................... 55
41 Effluent Monitoring Instrumentation Out of Service Greater than 30 Days ...................................................... 56
42 Solid Waste Summary ...................................................................................................................................... 57
43 Doses To Special Locations For 2016 .............................................................................................................. 87
44 Integrated Population Dose for 2016 ................................................................................................................ 88
45 Summary of Individual Doses for 2016 ............................................................................................................ 92

PVNGS 2016 ARERR Page 5
INTRODUCTION
This report summarizes effluent and waste disposal source term data, meteorological data, and doses from radioactive effluents for the Palo Verde Nuclear Generating Station (PVNGS) for the period of January through December 2016. The data presented meets the reporting requirements of Regulatory Guide 1.21 (Revision 1, June 1974) of the U.S. Nuclear Regulatory Commission and the PVNGS Technical Specifications.

PVNGS 2016 ARERR Page 6
BIBLIOGRAPHY U.S. Nuclear Regulatory Commission, Regulatory Guide 1.21, “Measuring, Evaluating, and Reporting Radioactivity in Solid Wastes and Releases of Radioactive Materials in Liquid and Gaseous Effluents from Light-Water-Cooled Nuclear Power Plants,” Revision 1, 1974.
U.S. Nuclear Regulatory Commission, Regulatory Guide 1.23 (Safety Guide 23), “Onsite Meteorological Programs,” 1972.
U.S. Nuclear Regulatory Commission, NUREG/CR-2919, “XOQDOQ: Computer Program for the Meteorological Evaluation of Routine Effluent Releases at Nuclear Power Stations,” 1982.
U.S. Nuclear Regulatory Commission, NUREG-0579, “Users Guide to GASPAR Code,” June 1980.
U.S. Nuclear Regulatory Commission, Regulatory Guide 1.109, “Calculations of Annual Doses to Man from Routine Releases of Reactor Effluents for the Purpose of Evaluating Compliance with 10 CFR 50, Appendix I,” Revision 1, 1977.
U.S. Nuclear Regulatory Commission, NUREG-0172, “Age-specific Radiation Dose Commitment Factors for a One-Year Chronic Intake,” 1977.
U.S. Nuclear Regulatory Commission, NUREG-0133, “Preparation of Radiological Effluent Technical Specifications for Nuclear Power Plants,” 1978.
Technical Specifications, Palo Verde Nuclear Generating Station, Units 1, 2 and 3, Docket No. 50-528/529/530.
Bechtel Power Corp., “Cooling Tower Blowdown System Solar Evaporation Pond,” Sept. 1980.
Generation Engineering, “Geotechnical Exploration for Evaporation Pond #2,” Oct. 1986
Letter No. 212-00789-WFQ/RHM, “1989 PVNGS Evaporation Pan Data,” Jan. 1989.
Offsite Dose Calculation Manual Palo Verde Nuclear Generating Station Units 1, 2 and 3, Rev. 27.
NEI 07-07, Nuclear Energy Institute, Industry Ground Water Protection Initiative – Final Guidance Document, August 2007.
Calculation 13-NC-CH-0200, Rev 7,FSAR - Primary Coolant Activities (PCA)
PVNGS 2016 ARERR Page 7
APPENDIX A
SOURCE TERMS
AND EFFLUENT AND WASTE DISPOSAL REPORTS

PVNGS 2016 ARERR Page 8
Supplemental Information
1.0 REGULATORY LIMITS
1.1 Liquid Releases
1.1.1 PVNGS ODCM Requirement 3.2
The concentration of radioactive material discharged from secondary system liquid waste to the circulating water system shall be limited to:
5.0E-07 μCi/ml for principal gamma-emitters (except Ce-144)
3.0E-06 μCi/ml for Ce-144
1.0E-06 μCi/ml for I-131.
1.0E-03 μCi/ml for H-3
The concentration of radioactive material discharged from secondary system liquid waste to the onsite evaporation ponds shall be limited to:
2.0E-06 μCi/ml for Cs-134
2.0E-06 μCi/ml for Cs-137
The concentrations specified in 10 CFR Part 20.1001-20.2402, Appendix B, Table 2, Column 2, for all other isotopes
1.1.2 PVNGS ODCM Requirement 4.4
The dose or dose commitment to a MEMBER OF THE PUBLIC from radioactive materials in liquid effluents released, from each reactor, to areas at and beyond the SITE BOUNDARY shall be limited:
a. During any calendar quarter to less than or equal to 1.5 mrem to the
total body and to less than or equal to 5 mrem to any organ, and
b. During any calendar year to less than or equal to 3 mrem to the total body and to less than or equal to 10 mrem to any organ.
PVNGS 2016 ARERR Page 9
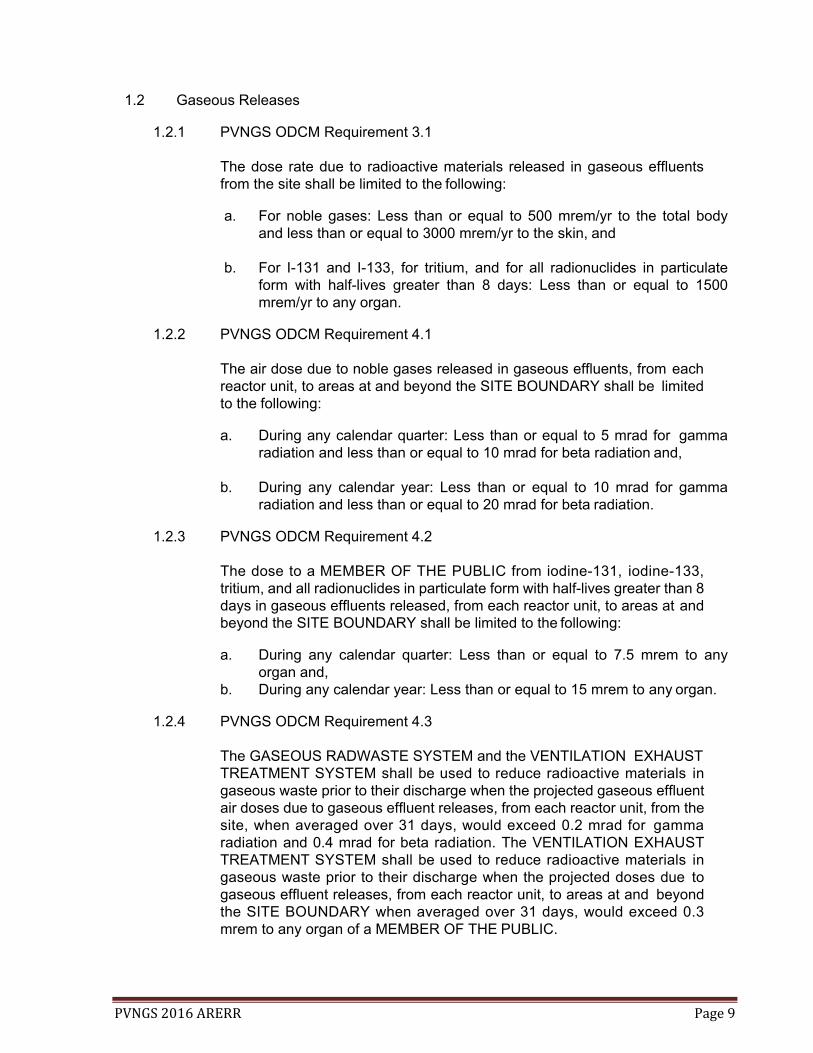
1.2 Gaseous Releases
1.2.1 PVNGS ODCM Requirement 3.1
The dose rate due to radioactive materials released in gaseous effluents from the site shall be limited to the following:
a. For noble gases: Less than or equal to 500 mrem/yr to the total body
and less than or equal to 3000 mrem/yr to the skin, and
b. For I-131 and I-133, for tritium, and for all radionuclides in particulate form with half-lives greater than 8 days: Less than or equal to 1500 mrem/yr to any organ.
1.2.2 PVNGS ODCM Requirement 4.1
The air dose due to noble gases released in gaseous effluents, from each reactor unit, to areas at and beyond the SITE BOUNDARY shall be limited to the following:
a. During any calendar quarter: Less than or equal to 5 mrad for gamma
radiation and less than or equal to 10 mrad for beta radiation and,
b. During any calendar year: Less than or equal to 10 mrad for gamma radiation and less than or equal to 20 mrad for beta radiation.
1.2.3 PVNGS ODCM Requirement 4.2
The dose to a MEMBER OF THE PUBLIC from iodine-131, iodine-133, tritium, and all radionuclides in particulate form with half-lives greater than 8 days in gaseous effluents released, from each reactor unit, to areas at and beyond the SITE BOUNDARY shall be limited to the following:
a. During any calendar quarter: Less than or equal to 7.5 mrem to any
organ and, b. During any calendar year: Less than or equal to 15 mrem to any organ.
1.2.4 PVNGS ODCM Requirement 4.3
The GASEOUS RADWASTE SYSTEM and the VENTILATION EXHAUST TREATMENT SYSTEM shall be used to reduce radioactive materials in gaseous waste prior to their discharge when the projected gaseous effluent air doses due to gaseous effluent releases, from each reactor unit, from the site, when averaged over 31 days, would exceed 0.2 mrad for gamma radiation and 0.4 mrad for beta radiation. The VENTILATION EXHAUST TREATMENT SYSTEM shall be used to reduce radioactive materials in gaseous waste prior to their discharge when the projected doses due to gaseous effluent releases, from each reactor unit, to areas at and beyond the SITE BOUNDARY when averaged over 31 days, would exceed 0.3 mrem to any organ of a MEMBER OF THE PUBLIC.
PVNGS 2016 ARERR Page 10
1.3 Total Dose
1.3.1 PVNGS ODCM Requirement 5.1
The annual (calendar year) dose or dose commitment to any MEMBER OF THE PUBLIC due to releases of radioactivity and to direct radiation from uranium fuel cycle sources shall be limited to less than or equal to 25 mrem to the total body or any organ, except the thyroid, which shall be limited to less than or equal to 75 mrem.
2.0 MAXIMUM PERMISSIBLE CONCENTRATIONS
Air: Release Concentrations are limited to dose rate limits described in section 1.2.1 of this report.
3.0 AVERAGE ENERGY
The average energy (E) of the radionuclide mixture in releases of fission and activation gases is not applicable to PVNGS.
4.0 MEASUREMENTS AND APPROXIMATIONS OF TOTAL RADIOACTIVITY IN
GASEOUS EFFLUENTS
For continuous releases, sampling is in accordance with PVNGS ODCM Table 3-1. Particulate and iodine radionuclides are sampled continuously at the Plant Vent and Fuel Building exhaust points. The particulate filters and charcoal cartridges are exchanged for analysis at least four times per month. Noble gas and tritium are sampled at least once per 31 days. The hourly average Radiation Monitoring System (RMS) effluent monitor readings are used, when available, to account for increases and decreases in noble gas concentrations between noble gas grab samples. The tritium concentration is assumed constant between sampling periods.
For batch releases, sampling is also in accordance with PVNGS ODCM Table 3-1. For containment purges, the noble gas concentration may be adjusted to account for decreases or increases in concentration during the purge using RMS readings. The volume of air released during the purge is determined using the exhaust fan rated flow rate. For Waste Gas Decay Tank releases, the volume released is corrected to standard pressure.
Effective January 1, 2004, Containment Purge release permits are updated by removing the permit pre-release particulate and iodine activity. This eliminates double accounting for the Containment Purge particulate and iodine activity at the Plant Vent but allows the particulate and iodine activity to be included in the Containment Purge pre-release dose projection.
The Lower Limit of Detection (LLD) of a measurement system is defined in Table 3 - 1 of the PVNGS ODCM. An average LLD for each radionuclide is provided in Table 3.

PVNGS 2016 ARERR Page 11
5.0 BATCH RELEASES
5.1 Gaseous
Batch release durations are presented in Table 2.
5.2 Liquid
None.
6.0 ABNORMAL RELEASES
None 7.0 OFFSITE DOSE CALCULATION MANUAL AND PROCESS CONTROL PROGRAM
(PCP) REVISIONS
7.1 The Offsite Dose Calculation Manual (ODCM) was revised in 2016. A complete copy of the ODCM is attached as Appendix E of this report. Revision 27 of the ODCM went effective on 3/25/2016.
7.1 There were no revisions to the Process Control Program (PCP) in 2016.
8.0 EFFLUENTS AND SOLID WASTES
8.1 Gaseous Effluents
Gaseous effluent information is presented in Table 1 through Table 41. Included in these tables are summaries of the effluents and estimated total error.
8.2 Liquid Effluents
There were no liquid effluent releases beyond the Site Boundary from PVNGS.
8.3 Solid Waste
Solid waste shipments are summarized in Table 42.

PVNGS 2016 ARERR Page 12
9.0 MISCELLANEOUS INFORMATION
9.1 EVAPORATION PONDS
Releases made to the Evaporation Ponds are limited to the concentrations specified in PVNGS ODCM Requirement 3.2. The Evaporation Ponds were monitored in accordance with PVNGS ODCM Requirement 6.1.
The average historical evaporation is approximately 12 inches, per pond, for each of the first and fourth quarters, and 33 inches, per pond, for each of the second and third quarters. Evaporation Pond One is approximately 250 acres. This equates to 3.08E+11 cc evaporated from Pond One for each of the first and fourth quarters and 8.48E+11 cc evaporated from Pond One for each of the second and third quarters. Evaporation Pond Two is approximately 235 acres. The amount evaporated from Pond Two is 2.90E+11 cc for each of the first and fourth quarters and 7.97E+11 cc for each of the second and third quarters.
Evaporation Pond Three is constructed of two smaller ponds of 90 acres each (3A and 3B). The amount evaporated from each section of Pond Three is 1.11E+11 cc for each of the first and fourth quarters and 3.05E+11 cc for each of the second and third quarters.
Using a site boundary X/Q of 5.0E-05 sec/m3 for the evaporation ponds and equation 4-3 from the ODCM, the dose from the evaporation ponds to a hypothetical individual at the site boundary, for all pathways, is summarized in Table 1.
9.2 RADIATION MONITORING SYSTEM SETPOINT VERIFICATION
Current effluent monitor noble gas channel alert alarm setpoints are based on an assumed one percent failed fuel source term. The current method used for the setpoint values are more reliable than basing the setpoints upon the constantly varying values of the actual noble gas source term presented in Table 38.
9.3 RCS RADIOIODINE (TRM T5.0.600)
There were no cases where primary coolant specific activity exceeded the Technical Specification 3.4.17 limits during the reporting period.
9.4 INDEPENDENT SPENT FUEL STORAGE INSTALLATION (ISFSI)
There are no radioactive effluents from the NAC-UMS System. Direct dose at the Site Boundary is reported in the Annual Radiological Environmental Operating Report.
PVNGS 2016 ARERR Page 13
9.5 MAJOR CHANGES TO THE RADIOACTIVE WASTE SYSTEMS (liquid, gaseous, and solid).
None.
9.6 SAMPLES RESULTS FROM GROUNDWATER WELLS THAT ARE NOT
DESCRIBED IN THE ODCM AS PART OF THE REMP (NEI 07-07, Industry Groundwater Protection Initiative, August 2007), are included in Appendix D. This initiative provides added assurance that groundwater will not be adversely affected by PVNGS operations.
There were no NEI 07-07 reportable leaks or spills. There were no positive sample results.
9.7 REPORT ADDENDUM
There were two addendums to this report. The first is a correction to the 2013 ARERR and the second is a correction to the 2013 ARERR.
PVNGS 2016 ARERR Page 14
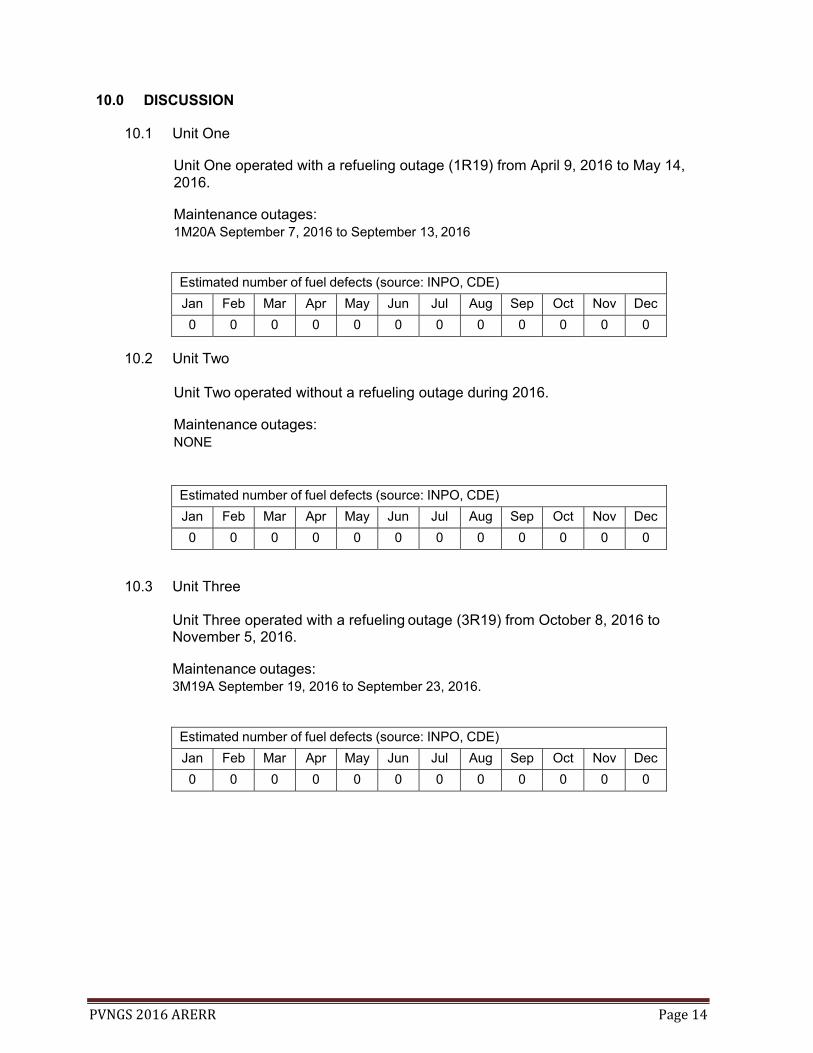
10.0 DISCUSSION
10.1 Unit One
Unit One operated with a refueling outage (1R19) from April 9, 2016 to May 14, 2016.
Maintenance outages: 1M20A September 7, 2016 to September 13, 2016
Estimated number of fuel defects (source: INPO, CDE)
Jan Feb Mar Apr May Jun Jul Aug Sep Oct Nov Dec
0 0 0 0 0 0 0 0 0 0 0 0
10.2 Unit Two Unit Two operated without a refueling outage during 2016.
Maintenance outages: NONE
Estimated number of fuel defects (source: INPO, CDE)
Jan Feb Mar Apr May Jun Jul Aug Sep Oct Nov Dec
0 0 0 0 0 0 0 0 0 0 0 0
10.3 Unit Three Unit Three operated with a refueling outage (3R19) from October 8, 2016 to November 5, 2016.
Maintenance outages: 3M19A September 19, 2016 to September 23, 2016.
Estimated number of fuel defects (source: INPO, CDE)
Jan Feb Mar Apr May Jun Jul Aug Sep Oct Nov Dec
0 0 0 0 0 0 0 0 0 0 0 0
PVNGS 2016 ARERR Page 15
10.4 Carbon-14
Carbon-14 is formed naturally in the upper atmosphere and also is formed in operating nuclear reactors.
Carbon-14 is not a new power plant emission. Because the overall quantity of radioactive releases has steadily decreased due to improvements in power plant operations, carbon-14 may now qualify as a "principal radionuclide" under revised federal regulatory guidance. The levels of other releases have declined, so carbon-14 releases, expressed as a percentage of total releases, have the potential to achieve "principal radionuclide" status (anything greater than one percent of overall radioactivity in effluents) per updated federal regulatory guidance.
The radiation dose to the public from carbon-14 is much lower than regulatory limits and has been a very small contributor to the total radiation dose that Americans receive each year from natural and man-made sources.
Studies by the United Nations Scientific Committee on the Effects of Atomic Radiation, the National Research Council’s BEIR VII study group and the National Council on Radiation Protection and Measurements all show that the risk associated with low-dose radiation from natural and man-made sources, including nuclear power plants, is negligible.
Radiation is measured in units called millirem. The average American is exposed to 620 millirem of radiation every year. Approximately 311 millirem of this comes from natural sources. The majority of the remaining dose (approximately 300 millirem) comes from medical procedures such as CAT scans. Less than one-tenth of a percent of all radiation exposure is from nuclear facilities. Reference: NCRP Report No. 160, Table 1.1.
Starting with the 2010 Annual Radioactive Effluent Release Report, PVNGS will include the estimated exposure from carbon-14 in the Appendix C, dose calculations. The PVNGS calculated production of carbon-14 is 18.5 Curies per cycle (500 days) or 13.5 curies per year. Based on published literature, twenty percent (20%) of the carbon-14 released is assumed to be in an inorganic form (CO2). PVNGS will use an estimated value of 2.7 curies of carbon-14 released, per reactor, per year. The 2.7 curies will be divided equally between each quarter (0.68 curies per reactor, per quarter). Appendix C, dose calculations include this estimated carbon-14 dose. Appendix C also includes the dose excluding carbon-14 for comparison with historical reports.
10.5 Tritium
PVNGS does not have a liquid release pathway. Removal of tritium is performed by operation of the Boric Acid Concentrator (BAC) in the release mode. Comparison of PVNGS annual tritium Curies released to other utilities should be made only after summing both liquid and gaseous tritium Curies released.

PVNGS 2016 ARERR Page 16
10.6 Dose Summary
Dose for 2016 was primarily due to the release of tritium. Tritium production is estimated to be 1000 curies per reactor per year. In order to control plant tritium concentrations, tritium releases should match tritium production. For 2016, PVNGS released a total of 2360 curies of tritium (see Table 39).
Total dose due to releases from all three Units for 2016 were higher than 2015, primarily due to increased releases of tritium.

PVNGS 2016 ARERR Page 17
Table 1: Evaporation Pond Data
Evaporation Pond 1 (1A, 1B, 1C) Quarter 1 Quarter 2 Quarter 3 Quarter 4 Year
Historical volume of water evaporated (ml) 3.22E+11 8.85E+11 8.85E+11 3.22E+11
Tritium Concentration (uCi/cc) 2.84E-06 4.23E-06 2.38E-06 2.38E-06 Tritium Curies 3.22E-01 1.26E+00 7.22E-01 2.63E-01 2.57E+00Evaporation Pond 2 (2A and 2B) Quarter 1 Quarter 2 Quarter 3 Quarter 4 YearHistorical volume of water evaporated (ml) 2.49E+11 7.97E+11 7.97E+11 2.90E+11
Tritium Concentration (uCi/cc) 1.36E-06 1.32E-06 1.80E-06 2.88E-06 Tritium curies 1.73E-01 4.60E-01 5.99E-01 3.66E-01 1.60E+00Evaporation Pond 3 (3A and 3B) Quarter 1 Quarter 2 Quarter 3 Quarter 4 Year
Historical volume of water evaporated (ml) 2.20E+11 3.05E+11 3.05E+11 1.11E+11
3B Tritium Concentration (uCi/cc) 1.48E-06 1.51E-06 2.88E-06 2.27E-06 3B Tritium curies 1.63E-01 4.55E-01 8.69E-01 2.49E-01 1.74E+00Dose (mRem) Quarter 1 Quarter 2 Quarter 3 Quarter 4 Year Pond 1 3.80E-03 1.34E-02 8.60E-03 3.13E-03 2.89E-02Pond 2 2.40E-03 6.38E-03 8.31E-03 5.08E-03 2.22E-02Pond 3 2.26E-03 6.31E-03 1.20E-02 3.45E-03 2.41E-02Total 8.46E-03 2.61E-02 2.90E-02 1.17E-02 7.52E-02
Table 2: Batch Release DataAll times are in hours Unit 1 Unit 2 Unit 3
January - June Number of batch releases 44 20 16 Total time period for batch releases 1901.21 58.82 76.17 Maximum time period for a batch release 168.00 35.27 53.70 Average time period for a batch release 43.21 2.94 4.76 Minimum time period for a batch release 0.10 0.31 0.60 July - December Number of batch releases 23 24 47 Total time period for batch releases 322.13 1184.67 1908.40Maximum time period for a batch release 100.85 1045.92 168.00Average time period for a batch release 14.01 49.36 40.60 Minimum time period for a batch release 0.57 0.57 0.02 January - December Number of batch releases 67 44 63 Total time period for batch releases 2223.34 1243.50 1984.57Maximum time period for a batch release 168.00 1045.92 168.00Average time period for a batch release 33.18 28.26 31.50 Minimum time period for a batch release 0.10 0.31 0.02

PVNGS 2016 ARERR Page 18
Table 3:
Units 1, 2 & 3 Gaseous Effluents Average Lower Limit Of Detection
μCi/cc
Nuclide Continuous Batch Nuclide Continuous Batch
Antimony-122 2.20E-13 1.90E-11 Argon-41 4.50E-08 4.50E-08
Antimony-124 8.40E-14 1.70E-11 Krypton-85 7.40E-06 7.40E-06
Barium-140 3.40E-13 5.70E-11 Krypton-85m 2.20E-08 2.20E-08
Bromine-82 3.30E-13 1.40E-11 Krypton-87 5.70E-08 5.70E-08
Cerium-141 8.70E-14 3.10E-11 Krypton-88 7.40E-08 7.40E-08
Cerium-144 3.60E-13 6.50E-11 Xenon-125 2.20E-08 2.20E-08
Cesium-134 1.00E-13 2.60E-11 Xenon-127 2.10E-08 2.10E-08
Cesium-137 8.10E-14 1.70E-11 Xenon-131m 9.10E-07 9.10E-07
Cesium-138 5.20E-10 7.30E-10 Xenon-133 6.30E-08 6.30E-08
Chromium-51 6.90E-13 1.40E-10 Xenon-133m 1.90E-07 1.90E-07
Cobalt-58 8.50E-14 1.70E-11 Xenon-135 2.00E-08 2.00E-08
Cobalt-60 1.00E-13 1.90E-11 Xenon-135m 8.90E-08 8.90E-08
Iron-59 1.70E-13 3.20E-11 Xenon-138 2.00E-07 2.00E-07
Lanthanum-140 2.80E-13 2.10E-11 Iodine-131 8.00E-14 7.00E-12
Manganese-54 8.30E-14 1.70E-11 Iodine-132 6.60E-12 1.90E-11
Molybdenum-99 2.40E-13 2.80E-11 Iodine-133 4.70E-13 1.10E-11
Niobium-95 8.70E-14 1.80E-11 Iodine-134 5.90E-11 8.20E-11
Rubidium-88 1.90E-08 1.90E-08 Iodine-135 7.00E-12 5.50E-11
Ruthenium-103 7.40E-14 1.50E-11 Strontium-89 2.15E-15 (1) Strontium-90 5.60E-16 (1) Tellurium-123m 6.60E-14 1.50E-11 Tritium 3.80E-07 3.80E-07 Zinc-65 1.90E-13 3.80E-11 Zirconium-95 1.80E-13 4.10E-11 Gross Alpha 3.60E-15 (1) (1) Not required for batch releases.
PVNGS 2016 ARERR Page 19
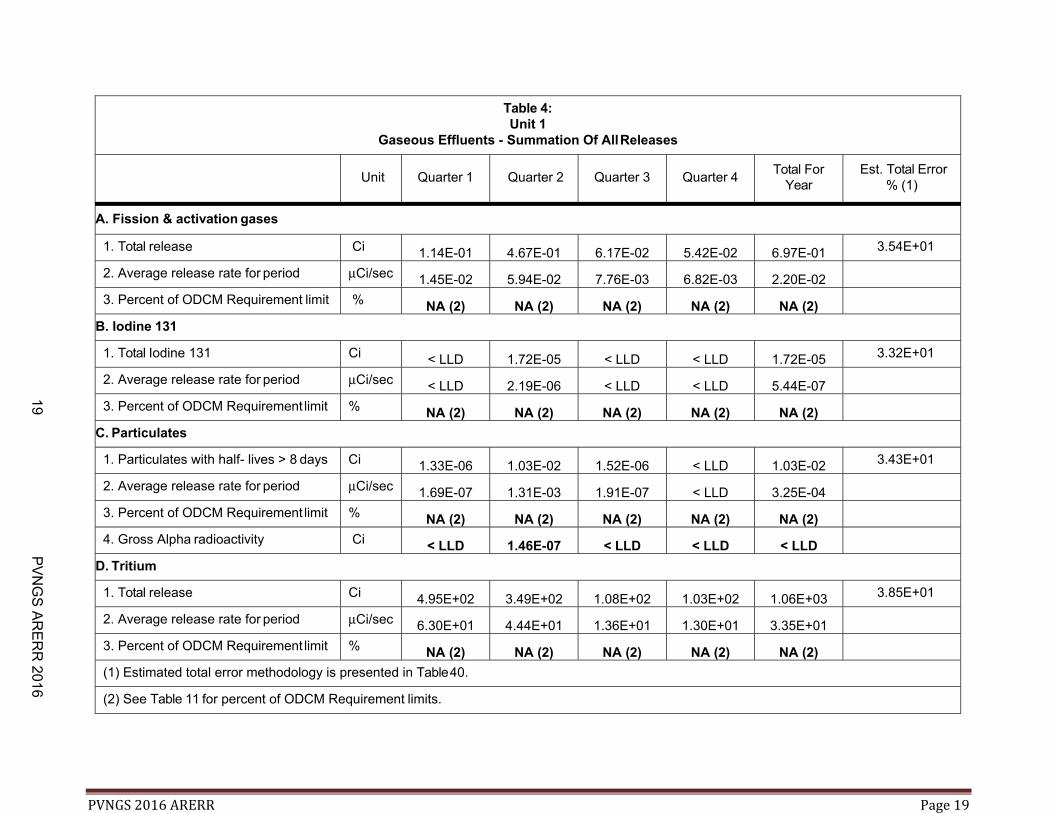
Table 4: Unit 1
Gaseous Effluents - Summation Of All Releases
Unit
Quarter 1
Quarter 2
Quarter 3
Quarter 4
Total For Year
Est. Total Error % (1)
A. Fission & activation gases
1. Total release Ci 1.14E-01 4.67E-01 6.17E-02 5.42E-02 6.97E-01 3.54E+01
2. Average release rate for period μCi/sec 1.45E-02 5.94E-02 7.76E-03 6.82E-03 2.20E-02
3. Percent of ODCM Requirement limit % NA (2) NA (2) NA (2) NA (2) NA (2)
B. Iodine 131
1. Total Iodine 131 Ci < LLD 1.72E-05 < LLD < LLD 1.72E-05 3.32E+01
2. Average release rate for period μCi/sec < LLD 2.19E-06 < LLD < LLD 5.44E-07
3. Percent of ODCM Requirement limit % NA (2) NA (2) NA (2) NA (2) NA (2)
C. Particulates
1. Particulates with half- lives > 8 days Ci 1.33E-06 1.03E-02 1.52E-06 < LLD 1.03E-02 3.43E+01
2. Average release rate for period μCi/sec 1.69E-07 1.31E-03 1.91E-07 < LLD 3.25E-04
3. Percent of ODCM Requirement limit % NA (2) NA (2) NA (2) NA (2) NA (2)
4. Gross Alpha radioactivity Ci < LLD 1.46E-07 < LLD < LLD < LLD
D. Tritium
1. Total release Ci 4.95E+02 3.49E+02 1.08E+02 1.03E+02 1.06E+03 3.85E+01
2. Average release rate for period μCi/sec 6.30E+01 4.44E+01 1.36E+01 1.30E+01 3.35E+01
3. Percent of ODCM Requirement limit % NA (2) NA (2) NA (2) NA (2) NA (2)
(1) Estimated total error methodology is presented in Table 40.
(2) See Table 11 for percent of ODCM Requirement limits.
19P
VN
GS
AR
ER
R2016
PVNGS 2016 ARERR Page 20
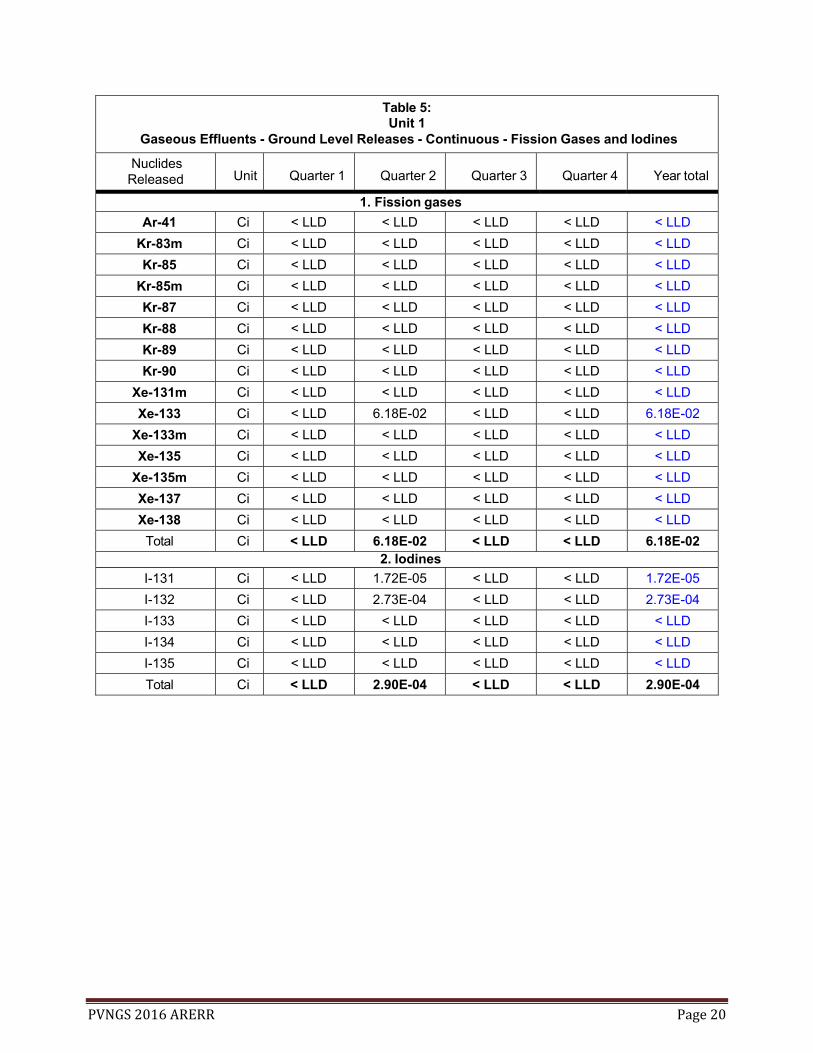
Table 5: Unit 1
Gaseous Effluents - Ground Level Releases - Continuous - Fission Gases and Iodines
Nuclides Released Unit Quarter 1 Quarter 2 Quarter 3 Quarter 4 Year total
1. Fission gases
Ar-41 Ci < LLD < LLD < LLD < LLD < LLD
Kr-83m Ci < LLD < LLD < LLD < LLD < LLD
Kr-85 Ci < LLD < LLD < LLD < LLD < LLD
Kr-85m Ci < LLD < LLD < LLD < LLD < LLD
Kr-87 Ci < LLD < LLD < LLD < LLD < LLD
Kr-88 Ci < LLD < LLD < LLD < LLD < LLD
Kr-89 Ci < LLD < LLD < LLD < LLD < LLD
Kr-90 Ci < LLD < LLD < LLD < LLD < LLD
Xe-131m Ci < LLD < LLD < LLD < LLD < LLD
Xe-133 Ci < LLD 6.18E-02 < LLD < LLD 6.18E-02
Xe-133m Ci < LLD < LLD < LLD < LLD < LLD
Xe-135 Ci < LLD < LLD < LLD < LLD < LLD
Xe-135m Ci < LLD < LLD < LLD < LLD < LLD
Xe-137 Ci < LLD < LLD < LLD < LLD < LLD
Xe-138 Ci < LLD < LLD < LLD < LLD < LLD
Total Ci < LLD 6.18E-02 < LLD < LLD 6.18E-02 2. Iodines
I-131 Ci < LLD 1.72E-05 < LLD < LLD 1.72E-05
I-132 Ci < LLD 2.73E-04 < LLD < LLD 2.73E-04
I-133 Ci < LLD < LLD < LLD < LLD < LLD
I-134 Ci < LLD < LLD < LLD < LLD < LLD
I-135 Ci < LLD < LLD < LLD < LLD < LLD
Total Ci < LLD 2.90E-04 < LLD < LLD 2.90E-04

PVNGS 2016 ARERR Page 21
Table 6: Unit 1
Gaseous Effluents - Ground Level Releases - Continuous - Particulates
Nuclides Released Unit Quarter 1 Quarter 2 Quarter 3 Quarter 4 Year total
3.Particulates
Ag-110m Ci < LLD < LLD < LLD < LLD < LLD
Ba-140 Ci < LLD < LLD < LLD < LLD < LLD
Br-82 Ci < LLD < LLD < LLD < LLD < LLD
Ce-141 Ci < LLD < LLD < LLD < LLD < LLD
Ce-144 Ci < LLD < LLD < LLD < LLD < LLD
Co-57 Ci < LLD 4.88E-06 < LLD < LLD 4.88E-06
Co-58 Ci < LLD 1.59E-03 1.52E-06 < LLD 1.59E-03
Co-60 Ci 1.33E-06 5.21E-04 < LLD < LLD 5.22E-04
Cr-51 Ci < LLD 5.72E-03 < LLD < LLD 5.72E-03
Cs-134 Ci < LLD < LLD < LLD < LLD < LLD
Cs-136 Ci < LLD < LLD < LLD < LLD < LLD
Cs-137 Ci < LLD < LLD < LLD < LLD < LLD
Cs-138 Ci < LLD < LLD < LLD < LLD < LLD
Fe-59 Ci < LLD 9.54E-05 < LLD < LLD 9.54E-05
La-140 Ci < LLD < LLD < LLD < LLD < LLD
Mn-54 Ci < LLD 1.31E-04 < LLD < LLD 1.31E-04
Mo-99 Ci < LLD < LLD < LLD < LLD < LLD
Nb-95 Ci < LLD 1.98E-04 < LLD < LLD 1.98E-04
Os-191 Ci < LLD < LLD < LLD < LLD < LLD
Rb-88 Ci < LLD < LLD < LLD < LLD < LLD
Ru-103 Ci < LLD < LLD < LLD < LLD < LLD
Ru-106 Ci < LLD < LLD < LLD < LLD < LLD
Sb-122 Ci < LLD < LLD < LLD < LLD < LLD
Sb-124 Ci < LLD 7.86E-05 < LLD < LLD 7.86E-05
Sb-125 Ci < LLD < LLD < LLD < LLD < LLD
Se-75 Ci < LLD < LLD < LLD < LLD < LLD
Sn-113m Ci < LLD < LLD < LLD < LLD < LLD
Sr-89 Ci < LLD < LLD < LLD < LLD < LLD
Sr-90 Ci < LLD < LLD < LLD < LLD < LLD
Tc-99m Ci < LLD < LLD < LLD < LLD < LLD
Te-123m Ci < LLD < LLD < LLD < LLD < LLD
Zn-65 Ci < LLD < LLD < LLD < LLD < LLD
Zr-95 Ci < LLD 1.32E-04 < LLD < LLD 1.32E-04
Total Ci 1.33E-06 8.47E-03 1.52E-06 < LLD 8.47E-03 4.Tritium
H-3 Ci 2.58E+01 3.73E+01 3.86E+01 2.27E+01 1.24E+02

PVNGS 2016 ARERR Page 22
Table 7: Unit 1
Gaseous Effluents - Ground Level Releases - Batch - Fission Gases and Iodines
Nuclides Released Unit Quarter 1 Quarter 2 Quarter 3 Quarter 4 Year total
1. Fission gases
Ar-41 Ci 1.14E-01 2.38E-01 6.14E-02 5.42E-02 4.68E-01
Kr-83m Ci < LLD < LLD < LLD < LLD < LLD
Kr-85 Ci < LLD < LLD < LLD < LLD < LLD
Kr-85m Ci < LLD < LLD < LLD < LLD < LLD
Kr-87 Ci < LLD < LLD < LLD < LLD < LLD
Kr-88 Ci < LLD < LLD < LLD < LLD < LLD
Kr-89 Ci < LLD < LLD < LLD < LLD < LLD
Kr-90 Ci < LLD < LLD < LLD < LLD < LLD
Xe-131m Ci < LLD 1.24E-03 < LLD < LLD 1.24E-03
Xe-133 Ci 3.28E-04 1.61E-01 2.28E-04 < LLD 1.62E-01
Xe-133m Ci < LLD 1.02E-03 < LLD < LLD 1.02E-03
Xe-135 Ci < LLD 3.33E-03 < LLD < LLD 3.33E-03
Xe-135m Ci < LLD < LLD < LLD < LLD < LLD
Xe-137 Ci < LLD < LLD < LLD < LLD < LLD
Xe-138 Ci < LLD < LLD < LLD < LLD < LLD
Total Ci 1.14E-01 4.05E-01 6.16E-02 5.42E-02 6.35E-01
2. Iodines I-131 Ci < LLD < LLD < LLD < LLD < LLD
I-132 Ci < LLD < LLD < LLD < LLD < LLD
I-133 Ci < LLD < LLD < LLD < LLD < LLD
I-134 Ci < LLD < LLD < LLD < LLD < LLD
I-135 Ci < LLD < LLD < LLD < LLD < LLD
Total Ci < LLD < LLD < LLD < LLD < LLD

PVNGS 2016 ARERR Page 23
Table 8: Unit 1
Gaseous Effluents - Ground Level Releases - Batch - Particulates
Nuclides Released Unit Quarter 1 Quarter 2 Quarter 3 Quarter 4 Year total
3. Particulates
Ag-110m Ci < LLD < LLD < LLD < LLD < LLD
Ba-140 Ci < LLD < LLD < LLD < LLD < LLD
Br-82 Ci < LLD 1.53E-05 < LLD < LLD 1.53E-05
Ce-141 Ci < LLD < LLD < LLD < LLD < LLD
Ce-144 Ci < LLD < LLD < LLD < LLD < LLD
Co-57 Ci < LLD < LLD < LLD < LLD < LLD
Co-58 Ci < LLD 4.01E-04 < LLD < LLD 4.01E-04
Co-60 Ci < LLD 1.52E-04 < LLD < LLD 1.52E-04
Cr-51 Ci < LLD 1.15E-03 < LLD < LLD 1.15E-03
Cs-134 Ci < LLD < LLD < LLD < LLD < LLD
Cs-136 Ci < LLD < LLD < LLD < LLD < LLD
Cs-137 Ci < LLD < LLD < LLD < LLD < LLD
Cs-138 Ci < LLD < LLD < LLD < LLD < LLD
Fe-59 Ci < LLD 8.86E-06 < LLD < LLD 8.86E-06
La-140 Ci < LLD < LLD < LLD < LLD < LLD
Mn-54 Ci < LLD 3.44E-05 < LLD < LLD 3.44E-05
Mo-99 Ci < LLD < LLD < LLD < LLD < LLD
Nb-95 Ci < LLD 5.04E-05 < LLD < LLD 5.04E-05
Os-191 Ci < LLD < LLD < LLD < LLD < LLD
Rb-88 Ci < LLD < LLD < LLD < LLD < LLD
Ru-103 Ci < LLD < LLD < LLD < LLD < LLD
Ru-106 Ci < LLD < LLD < LLD < LLD < LLD
Sb-122 Ci < LLD < LLD < LLD < LLD < LLD
Sb-124 Ci < LLD < LLD < LLD < LLD < LLD
Sb-125 Ci < LLD < LLD < LLD < LLD < LLD
Se-75 Ci < LLD < LLD < LLD < LLD < LLD
Sn-113m Ci < LLD < LLD < LLD < LLD < LLD
Sr-89 Ci Note 1 Note 1 Note 1 Note 1 Note 1
Sr-90 Ci Note 1 Note 1 Note 1 Note 1 Note 1
Tc-99m Ci < LLD < LLD < LLD < LLD < LLD
Te-123m Ci < LLD < LLD < LLD < LLD < LLD
Zn-65 Ci < LLD < LLD < LLD < LLD < LLD
Zr-95 Ci < LLD 5.29E-06 < LLD < LLD 5.29E-06
Total Ci < LLD 1.82E-03 < LLD < LLD 1.82E-03
4.Tritium H-3 Ci 4.69E+02 3.11E+02 6.96E+01 8.06E+01 9.30E+02
Note 1 - Not required for batch releases

PVNGS 2016 ARERR Page 24
Table 9: Unit 1
Gaseous Effluents - Continuous and Batch - Fission Gases and Iodines
Nuclides Released Unit Quarter 1 Quarter 2 Quarter 3 Quarter 4 Year total
1. Fission gases
Ar-41 Ci 1.14E-01 2.38E-01 6.14E-02 5.42E-02 4.68E-01
Kr-83m Ci < LLD < LLD < LLD < LLD < LLD
Kr-85 Ci < LLD < LLD < LLD < LLD < LLD
Kr-85m Ci < LLD < LLD < LLD < LLD < LLD
Kr-87 Ci < LLD < LLD < LLD < LLD < LLD
Kr-88 Ci < LLD < LLD < LLD < LLD < LLD
Kr-89 Ci < LLD < LLD < LLD < LLD < LLD
Kr-90 Ci < LLD < LLD < LLD < LLD < LLD
Xe-131m Ci < LLD 1.24E-03 < LLD < LLD 1.24E-03
Xe-133 Ci 3.28E-04 2.23E-01 2.28E-04 < LLD 2.23E-01
Xe-133m Ci < LLD 1.02E-03 < LLD < LLD 1.02E-03
Xe-135 Ci < LLD 3.33E-03 < LLD < LLD 3.33E-03
Xe-135m Ci < LLD < LLD < LLD < LLD < LLD
Xe-137 Ci < LLD < LLD < LLD < LLD < LLD
Xe-138 Ci < LLD < LLD < LLD < LLD < LLD
Total Ci 1.14E-01 4.66E-01 6.16E-02 5.42E-02 6.97E-01
2. Iodines I-131 Ci < LLD 1.72E-05 < LLD < LLD 1.72E-05
I-132 Ci < LLD 2.73E-04 < LLD < LLD 2.73E-04
I-133 Ci < LLD < LLD < LLD < LLD < LLD
I-134 Ci < LLD < LLD < LLD < LLD < LLD
I-135 Ci < LLD < LLD < LLD < LLD < LLD
Total Ci < LLD 2.90E-04 < LLD < LLD 2.90E-04

PVNGS 2016 ARERR Page 25
Table 10: Unit 1
Gaseous Effluents - Continuous and Batch - Particulates
Nuclides Released Unit Quarter 1 Quarter 2 Quarter 3 Quarter 4 Year total
3. Particulates
Ag-110m Ci < LLD < LLD < LLD < LLD < LLD
Ba-140 Ci < LLD < LLD < LLD < LLD < LLD
Br-82 Ci < LLD 1.53E-05 < LLD < LLD 1.53E-05
Ce-141 Ci < LLD < LLD < LLD < LLD < LLD
Ce-144 Ci < LLD < LLD < LLD < LLD < LLD
Co-57 Ci < LLD 4.88E-06 < LLD < LLD 4.88E-06
Co-58 Ci < LLD 1.99E-03 1.52E-06 1.52E-06 1.99E-03
Co-60 Ci 1.33E-06 6.73E-04 < LLD < LLD 6.74E-04
Cr-51 Ci < LLD 6.87E-03 < LLD < LLD 6.87E-03
Cs-134 Ci < LLD < LLD < LLD < LLD < LLD
Cs-136 Ci < LLD < LLD < LLD < LLD < LLD
Cs-137 Ci < LLD < LLD < LLD < LLD < LLD
Cs-138 Ci < LLD < LLD < LLD < LLD < LLD
Fe-59 Ci < LLD 1.04E-04 < LLD < LLD 1.04E-04
La-140 Ci < LLD < LLD < LLD < LLD < LLD
Mn-54 Ci < LLD 1.65E-04 < LLD < LLD 1.65E-04
Mo-99 Ci < LLD < LLD < LLD < LLD < LLD
Nb-95 Ci < LLD 2.48E-04 < LLD < LLD 2.48E-04
Os-191 Ci < LLD < LLD < LLD < LLD < LLD
Rb-88 Ci < LLD < LLD < LLD < LLD < LLD
Ru-103 Ci < LLD < LLD < LLD < LLD < LLD
Ru-106 Ci < LLD < LLD < LLD < LLD < LLD
Sb-122 Ci < LLD < LLD < LLD < LLD < LLD
Sb-124 Ci < LLD 7.86E-05 < LLD < LLD 7.86E-05
Sb-125 Ci < LLD < LLD < LLD < LLD < LLD
Se-75 Ci < LLD < LLD < LLD < LLD < LLD
Sn-113m Ci < LLD < LLD < LLD < LLD < LLD
Sr-89 Ci < LLD < LLD < LLD < LLD < LLD
Sr-90 Ci < LLD < LLD < LLD < LLD < LLD
Tc-99m Ci < LLD < LLD < LLD < LLD < LLD
Te-123m Ci < LLD < LLD < LLD < LLD < LLD
Zn-65 Ci < LLD < LLD < LLD < LLD < LLD
Zr-95 Ci < LLD 1.37E-04 < LLD < LLD 1.37E-04
Total Ci 1.33E-06 1.03E-02 1.52E-06 1.52E-06 1.03E-02
Total > 8 days Ci 1.33E-06 1.03E-02 1.52E-06 < LLD 1.03E-02
4.Tritium
H-3 Ci 4.95E+02 3.48E+02 1.08E+02 1.03E+02 1.05E+03
PVNGS 2016 ARERR Page 26
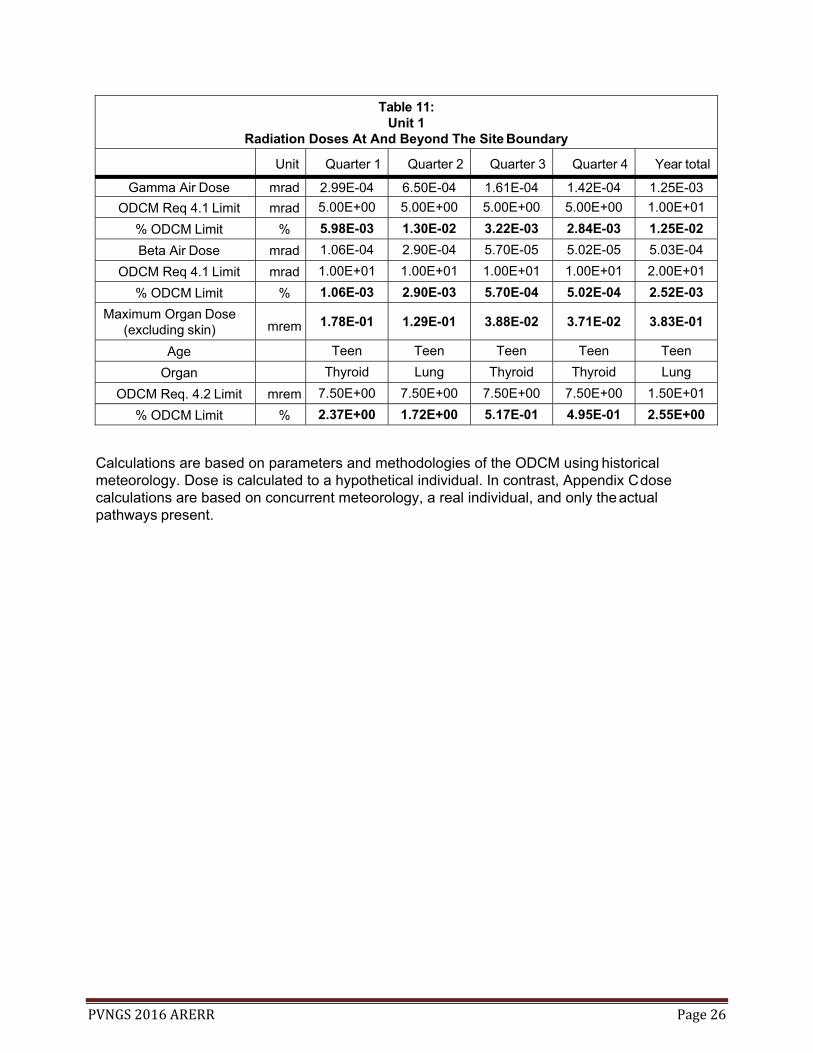
Table 11: Unit 1
Radiation Doses At And Beyond The Site Boundary
Unit Quarter 1 Quarter 2 Quarter 3 Quarter 4 Year total
Gamma Air Dose mrad 2.99E-04 6.50E-04 1.61E-04 1.42E-04 1.25E-03
ODCM Req 4.1 Limit mrad 5.00E+00 5.00E+00 5.00E+00 5.00E+00 1.00E+01
% ODCM Limit % 5.98E-03 1.30E-02 3.22E-03 2.84E-03 1.25E-02
Beta Air Dose mrad 1.06E-04 2.90E-04 5.70E-05 5.02E-05 5.03E-04
ODCM Req 4.1 Limit mrad 1.00E+01 1.00E+01 1.00E+01 1.00E+01 2.00E+01
% ODCM Limit % 1.06E-03 2.90E-03 5.70E-04 5.02E-04 2.52E-03
Maximum Organ Dose (excluding skin) mrem 1.78E-01 1.29E-01 3.88E-02 3.71E-02 3.83E-01
Age Teen Teen Teen Teen Teen
Organ Thyroid Lung Thyroid Thyroid Lung
ODCM Req. 4.2 Limit mrem 7.50E+00 7.50E+00 7.50E+00 7.50E+00 1.50E+01
% ODCM Limit % 2.37E+00 1.72E+00 5.17E-01 4.95E-01 2.55E+00
Calculations are based on parameters and methodologies of the ODCM using historical meteorology. Dose is calculated to a hypothetical individual. In contrast, Appendix C dose calculations are based on concurrent meteorology, a real individual, and only the actual pathways present.
PVNGS 2016 ARERR Page 27
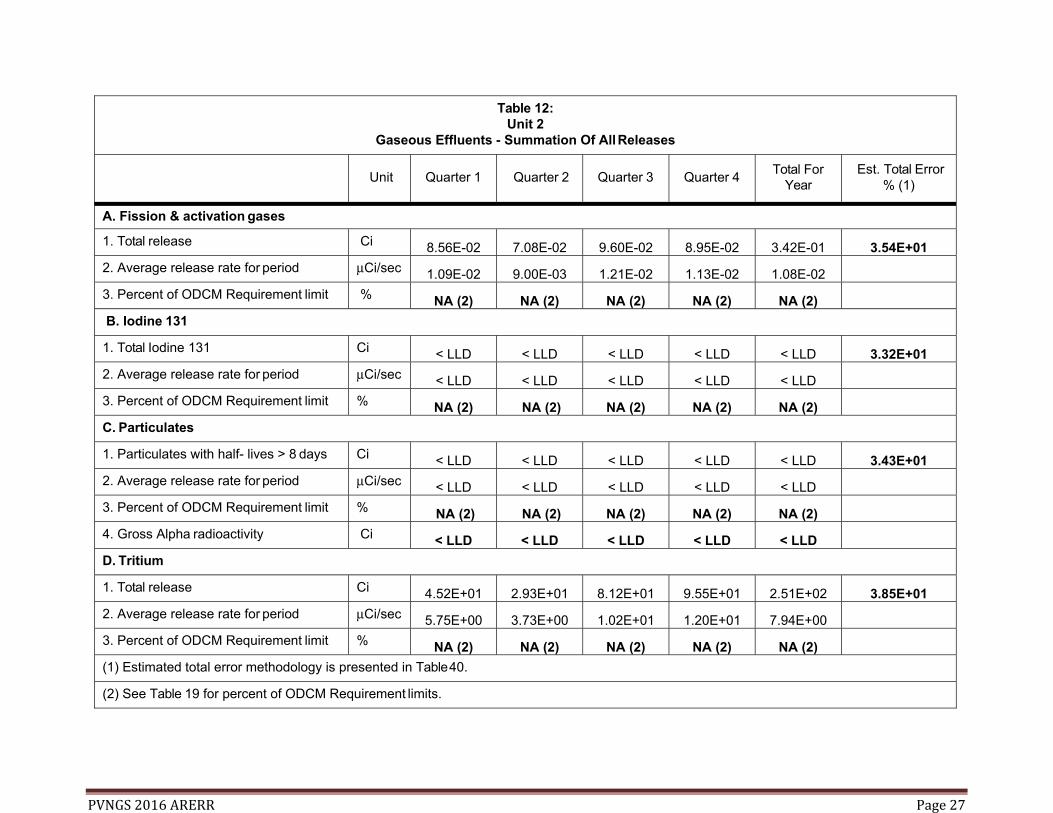
Table 12:
Unit 2 Gaseous Effluents - Summation Of All Releases
Unit
Quarter 1
Quarter 2
Quarter 3
Quarter 4
Total For Year
Est. Total Error % (1)
A. Fission & activation gases
1. Total release Ci 8.56E-02 7.08E-02 9.60E-02 8.95E-02 3.42E-01 3.54E+01
2. Average release rate for period μCi/sec 1.09E-02 9.00E-03 1.21E-02 1.13E-02 1.08E-02
3. Percent of ODCM Requirement limit % NA (2) NA (2) NA (2) NA (2) NA (2)
B. Iodine 131
1. Total Iodine 131 Ci < LLD < LLD < LLD < LLD < LLD 3.32E+01
2. Average release rate for period μCi/sec < LLD < LLD < LLD < LLD < LLD
3. Percent of ODCM Requirement limit % NA (2) NA (2) NA (2) NA (2) NA (2)
C. Particulates
1. Particulates with half- lives > 8 days Ci < LLD < LLD < LLD < LLD < LLD 3.43E+01
2. Average release rate for period μCi/sec < LLD < LLD < LLD < LLD < LLD
3. Percent of ODCM Requirement limit % NA (2) NA (2) NA (2) NA (2) NA (2)
4. Gross Alpha radioactivity Ci < LLD < LLD < LLD < LLD < LLD
D. Tritium
1. Total release Ci 4.52E+01 2.93E+01 8.12E+01 9.55E+01 2.51E+02 3.85E+01
2. Average release rate for period μCi/sec 5.75E+00 3.73E+00 1.02E+01 1.20E+01 7.94E+00
3. Percent of ODCM Requirement limit % NA (2) NA (2) NA (2) NA (2) NA (2)
(1) Estimated total error methodology is presented in Table 40.
(2) See Table 19 for percent of ODCM Requirement limits.

PVNGS 2016 ARERR Page 28
Table 13: Unit 2
Gaseous Effluents - Ground Level Releases - Continuous - Fission Gases and Iodines
Nuclides Released Unit Quarter 1 Quarter 2 Quarter 3 Quarter 4 Year total
1. Fission gases
Ar-41 Ci < LLD < LLD < LLD < LLD < LLD
Kr-83m Ci < LLD < LLD < LLD < LLD < LLD
Kr-85 Ci < LLD < LLD < LLD < LLD < LLD
Kr-85m Ci < LLD < LLD < LLD < LLD < LLD
Kr-87 Ci < LLD < LLD < LLD < LLD < LLD
Kr-88 Ci < LLD < LLD < LLD < LLD < LLD
Kr-89 Ci < LLD < LLD < LLD < LLD < LLD
Kr-90 Ci < LLD < LLD < LLD < LLD < LLD
Xe-131m Ci < LLD < LLD < LLD < LLD < LLD
Xe-133 Ci < LLD < LLD < LLD < LLD < LLD
Xe-133m Ci < LLD < LLD < LLD < LLD < LLD
Xe-135 Ci < LLD < LLD < LLD < LLD < LLD
Xe-135m Ci < LLD < LLD < LLD < LLD < LLD
Xe-137 Ci < LLD < LLD < LLD < LLD < LLD
Xe-138 Ci < LLD < LLD < LLD < LLD < LLD
Total Ci < LLD < LLD < LLD < LLD < LLD
2. IodinesI-131 Ci < LLD < LLD < LLD < LLD < LLD
I-132 Ci < LLD < LLD < LLD < LLD < LLD
I-133 Ci < LLD < LLD < LLD < LLD < LLD
I-134 Ci < LLD < LLD < LLD < LLD < LLD
I-135 Ci < LLD < LLD < LLD < LLD < LLD
Total Ci < LLD < LLD < LLD < LLD < LLD

PVNGS 2016 ARERR Page 29
Table 14: Unit 2
Gaseous Effluents - Ground Level Releases - Continuous - Particulates
Nuclides Released Unit Quarter 1 Quarter 2 Quarter 3 Quarter 4 Year total
3. Particulates
Ag-110m Ci < LLD < LLD < LLD < LLD < LLD
Ba-140 Ci < LLD < LLD < LLD < LLD < LLD
Br-82 Ci < LLD < LLD < LLD < LLD < LLD
Ce-141 Ci < LLD < LLD < LLD < LLD < LLD
Ce-144 Ci < LLD < LLD < LLD < LLD < LLD
Co-57 Ci < LLD < LLD < LLD < LLD < LLD
Co-58 Ci < LLD < LLD < LLD < LLD < LLD
Co-60 Ci < LLD < LLD < LLD < LLD < LLD
Cr-51 Ci < LLD < LLD < LLD < LLD < LLD
Cs-134 Ci < LLD < LLD < LLD < LLD < LLD
Cs-136 Ci < LLD < LLD < LLD < LLD < LLD
Cs-137 Ci < LLD < LLD < LLD < LLD < LLD
Cs-138 Ci < LLD < LLD < LLD < LLD < LLD
Fe-59 Ci < LLD < LLD < LLD < LLD < LLD
La-140 Ci < LLD < LLD < LLD < LLD < LLD
Mn-54 Ci < LLD < LLD < LLD < LLD < LLD
Mo-99 Ci < LLD < LLD < LLD < LLD < LLD
Nb-95 Ci < LLD < LLD < LLD < LLD < LLD
Os-191 Ci < LLD < LLD < LLD < LLD < LLD
Rb-88 Ci < LLD < LLD < LLD < LLD < LLD
Ru-103 Ci < LLD < LLD < LLD < LLD < LLD
Ru-106 Ci < LLD < LLD < LLD < LLD < LLD
Sb-122 Ci < LLD < LLD < LLD < LLD < LLD
Sb-124 Ci < LLD < LLD < LLD < LLD < LLD
Sb-125 Ci < LLD < LLD < LLD < LLD < LLD
Se-75 Ci < LLD < LLD < LLD < LLD < LLD
Sn-113m Ci < LLD < LLD < LLD < LLD < LLD
Sr-89 Ci < LLD < LLD < LLD < LLD < LLD
Sr-90 Ci < LLD < LLD < LLD < LLD < LLD
Tc-99m Ci < LLD < LLD < LLD < LLD < LLD
Te-123m Ci < LLD < LLD < LLD < LLD < LLD
Zn-65 Ci < LLD < LLD < LLD < LLD < LLD
Zr-95 Ci < LLD < LLD < LLD < LLD < LLD
Total Ci < LLD < LLD < LLD < LLD < LLD
4. Tritium H-3 Ci 3.01E+01 2.93E+01 2.11E+01 1.85E+01 9.90E+01

PVNGS 2016 ARERR Page 30
Table 15: Unit 2
Gaseous Effluents - Ground Level Releases - Batch - Fission Gases and Iodines
Nuclides Released Unit Quarter 1 Quarter 2 Quarter 3 Quarter 4 Year total
1. Fission gases
Ar-41 Ci 7.12E-02 4.88E-02 7.50E-02 7.21E-02 2.67E-01
Kr-83m Ci < LLD < LLD < LLD < LLD < LLD
Kr-85 Ci < LLD < LLD < LLD < LLD < LLD
Kr-85m Ci < LLD < LLD < LLD < LLD < LLD
Kr-87 Ci < LLD < LLD < LLD < LLD < LLD
Kr-88 Ci < LLD < LLD < LLD < LLD < LLD
Kr-89 Ci < LLD < LLD < LLD < LLD < LLD
Kr-90 Ci < LLD < LLD < LLD < LLD < LLD
Xe-131m Ci < LLD < LLD < LLD < LLD < LLD
Xe-133 Ci 1.43E-02 1.02E-02 2.09E-02 1.74E-02 6.28E-02
Xe-133m Ci < LLD < LLD < LLD < LLD < LLD
Xe-135 Ci < LLD < LLD 1.33E-04 5.78E-05 1.91E-04
Xe-135m Ci < LLD < LLD < LLD < LLD < LLD
Xe-137 Ci < LLD < LLD < LLD < LLD < LLD
Xe-138 Ci < LLD < LLD < LLD < LLD < LLD
Total Ci 8.55E-02 5.90E-02 9.60E-02 8.96E-02 3.30E-01
2. IodinesI-131 Ci < LLD < LLD < LLD < LLD < LLD
I-132 Ci < LLD < LLD < LLD < LLD < LLD
I-133 Ci < LLD < LLD < LLD < LLD < LLD
I-134 Ci < LLD < LLD < LLD < LLD < LLD
I-135 Ci < LLD < LLD < LLD < LLD < LLD
Total Ci < LLD < LLD < LLD < LLD < LLD

PVNGS 2016 ARERR Page 31
Table 16: Unit 2
Gaseous Effluents - Ground Level Releases - Batch - Particulates
Nuclides Released Unit Quarter 1 Quarter 2 Quarter 3 Quarter 4 Year total
3. Particulates
Ag-110m Ci < LLD < LLD < LLD < LLD < LLD
Ba-140 Ci < LLD < LLD < LLD < LLD < LLD
Br-82 Ci < LLD < LLD < LLD < LLD < LLD
Ce-141 Ci < LLD < LLD < LLD < LLD < LLD
Ce-144 Ci < LLD < LLD < LLD < LLD < LLD
Co-57 Ci < LLD < LLD < LLD < LLD < LLD
Co-58 Ci < LLD < LLD < LLD < LLD < LLD
Co-60 Ci < LLD < LLD < LLD < LLD < LLD
Cr-51 Ci < LLD < LLD < LLD < LLD < LLD
Cs-134 Ci < LLD < LLD < LLD < LLD < LLD
Cs-136 Ci < LLD < LLD < LLD < LLD < LLD
Cs-137 Ci < LLD < LLD < LLD < LLD < LLD
Cs-138 Ci < LLD < LLD < LLD < LLD < LLD
Fe-59 Ci < LLD < LLD < LLD < LLD < LLD
La-140 Ci < LLD < LLD < LLD < LLD < LLD
Mn-54 Ci < LLD < LLD < LLD < LLD < LLD
Mo-99 Ci < LLD < LLD < LLD < LLD < LLD
Nb-95 Ci < LLD < LLD < LLD < LLD < LLD
Os-191 Ci < LLD < LLD < LLD < LLD < LLD
Rb-88 Ci < LLD < LLD < LLD < LLD < LLD
Ru-103 Ci < LLD < LLD < LLD < LLD < LLD
Ru-106 Ci < LLD < LLD < LLD < LLD < LLD
Sb-122 Ci < LLD < LLD < LLD < LLD < LLD
Sb-124 Ci < LLD < LLD < LLD < LLD < LLD
Sb-125 Ci < LLD < LLD < LLD < LLD < LLD
Se-75 Ci < LLD < LLD < LLD < LLD < LLD
Sn-113m Ci < LLD < LLD < LLD < LLD < LLD
Sr-89 Ci Note 1 Note 1 Note 1 Note 1 Note 1
Sr-90 Ci Note 1 Note 1 Note 1 Note 1 Note 1
Tc-99m Ci < LLD < LLD < LLD < LLD < LLD
Te-123m Ci < LLD < LLD < LLD < LLD < LLD
Zn-65 Ci < LLD < LLD < LLD < LLD < LLD
Zr-95 Ci < LLD < LLD < LLD < LLD < LLD
Total Ci < LLD < LLD < LLD < LLD < LLD
4. Tritium H-3 Ci 1.50E+01 1.89E-02 6.00E+01 7.69E+01 1.52E+02
Note 1 - Not required for batch releases

PVNGS 2016 ARERR Page 32
Table 17: Unit 2
Gaseous Effluents - Continuous and Batch - Fission Gases and Iodines
Nuclides Released Unit Quarter 1 Quarter 2 Quarter 3 Quarter 4 Year total
1. Fission gases
Ar-41 Ci 7.12E-02 4.88E-02 7.50E-02 7.21E-02 2.67E-01
Kr-83m Ci < LLD < LLD < LLD < LLD < LLD
Kr-85 Ci < LLD < LLD < LLD < LLD < LLD
Kr-85m Ci < LLD < LLD < LLD < LLD < LLD
Kr-87 Ci < LLD < LLD < LLD < LLD < LLD
Kr-88 Ci < LLD < LLD < LLD < LLD < LLD
Kr-89 Ci < LLD < LLD < LLD < LLD < LLD
Kr-90 Ci < LLD < LLD < LLD < LLD < LLD
Xe-131m Ci < LLD < LLD < LLD < LLD < LLD
Xe-133 Ci 1.43E-02 1.02E-02 2.09E-02 1.74E-02 6.28E-02
Xe-133m Ci < LLD < LLD < LLD < LLD < LLD
Xe-135 Ci < LLD < LLD 1.33E-04 5.78E-05 1.91E-04
Xe-135m Ci < LLD < LLD < LLD < LLD < LLD
Xe-137 Ci < LLD < LLD < LLD < LLD < LLD
Xe-138 Ci < LLD < LLD < LLD < LLD < LLD
Total Ci 8.55E-02 5.90E-02 9.60E-02 8.96E-02 3.30E-01
2. IodinesI-131 Ci < LLD < LLD < LLD < LLD < LLD
I-132 Ci < LLD < LLD < LLD < LLD < LLD
I-133 Ci < LLD < LLD < LLD < LLD < LLD
I-134 Ci < LLD < LLD < LLD < LLD < LLD
I-135 Ci < LLD < LLD < LLD < LLD < LLD
Total Ci < LLD < LLD < LLD < LLD < LLD
PVNGS 2016 ARERR Page 33
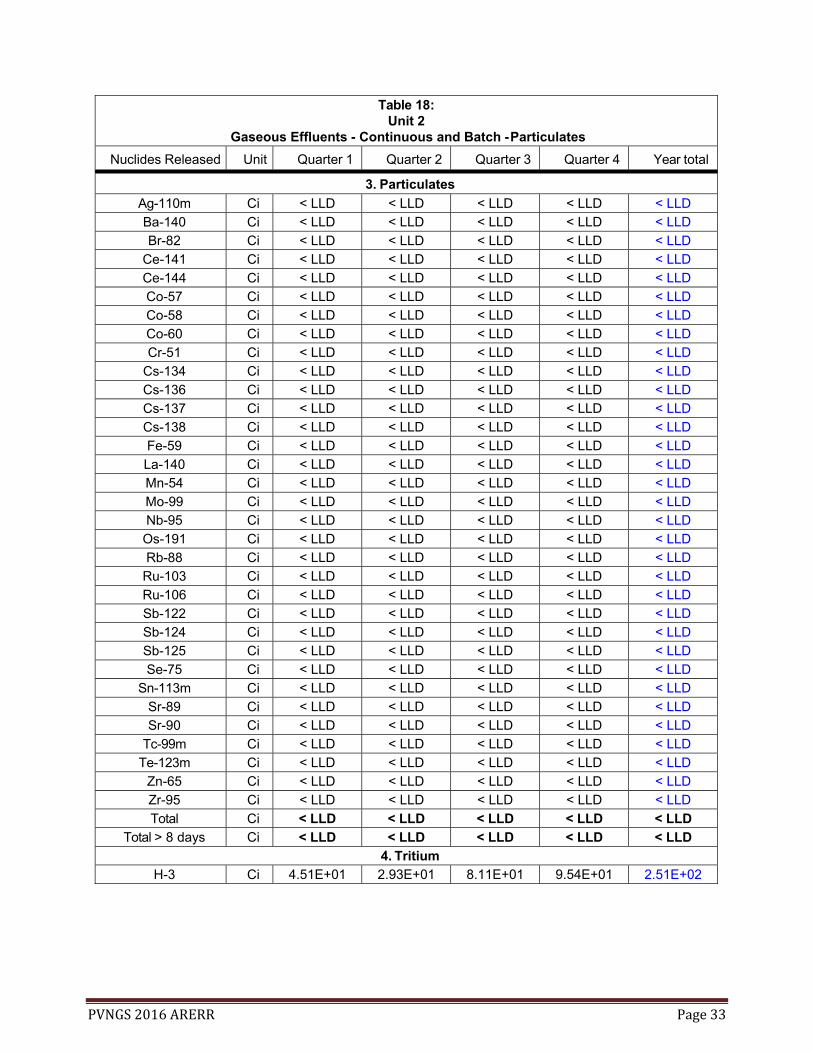
Table 18: Unit 2
Gaseous Effluents - Continuous and Batch - Particulates
Nuclides Released Unit Quarter 1 Quarter 2 Quarter 3 Quarter 4 Year total
3. Particulates
Ag-110m Ci < LLD < LLD < LLD < LLD < LLD
Ba-140 Ci < LLD < LLD < LLD < LLD < LLD
Br-82 Ci < LLD < LLD < LLD < LLD < LLD
Ce-141 Ci < LLD < LLD < LLD < LLD < LLD
Ce-144 Ci < LLD < LLD < LLD < LLD < LLD
Co-57 Ci < LLD < LLD < LLD < LLD < LLD
Co-58 Ci < LLD < LLD < LLD < LLD < LLD
Co-60 Ci < LLD < LLD < LLD < LLD < LLD
Cr-51 Ci < LLD < LLD < LLD < LLD < LLD
Cs-134 Ci < LLD < LLD < LLD < LLD < LLD
Cs-136 Ci < LLD < LLD < LLD < LLD < LLD
Cs-137 Ci < LLD < LLD < LLD < LLD < LLD
Cs-138 Ci < LLD < LLD < LLD < LLD < LLD
Fe-59 Ci < LLD < LLD < LLD < LLD < LLD
La-140 Ci < LLD < LLD < LLD < LLD < LLD
Mn-54 Ci < LLD < LLD < LLD < LLD < LLD
Mo-99 Ci < LLD < LLD < LLD < LLD < LLD
Nb-95 Ci < LLD < LLD < LLD < LLD < LLD
Os-191 Ci < LLD < LLD < LLD < LLD < LLD
Rb-88 Ci < LLD < LLD < LLD < LLD < LLD
Ru-103 Ci < LLD < LLD < LLD < LLD < LLD
Ru-106 Ci < LLD < LLD < LLD < LLD < LLD
Sb-122 Ci < LLD < LLD < LLD < LLD < LLD
Sb-124 Ci < LLD < LLD < LLD < LLD < LLD
Sb-125 Ci < LLD < LLD < LLD < LLD < LLD
Se-75 Ci < LLD < LLD < LLD < LLD < LLD
Sn-113m Ci < LLD < LLD < LLD < LLD < LLD
Sr-89 Ci < LLD < LLD < LLD < LLD < LLD
Sr-90 Ci < LLD < LLD < LLD < LLD < LLD
Tc-99m Ci < LLD < LLD < LLD < LLD < LLD
Te-123m Ci < LLD < LLD < LLD < LLD < LLD
Zn-65 Ci < LLD < LLD < LLD < LLD < LLD
Zr-95 Ci < LLD < LLD < LLD < LLD < LLD
Total Ci < LLD < LLD < LLD < LLD < LLD
Total > 8 days Ci < LLD < LLD < LLD < LLD < LLD
4. Tritium
H-3 Ci 4.51E+01 2.93E+01 8.11E+01 9.54E+01 2.51E+02
PVNGS 2016 ARERR Page 34
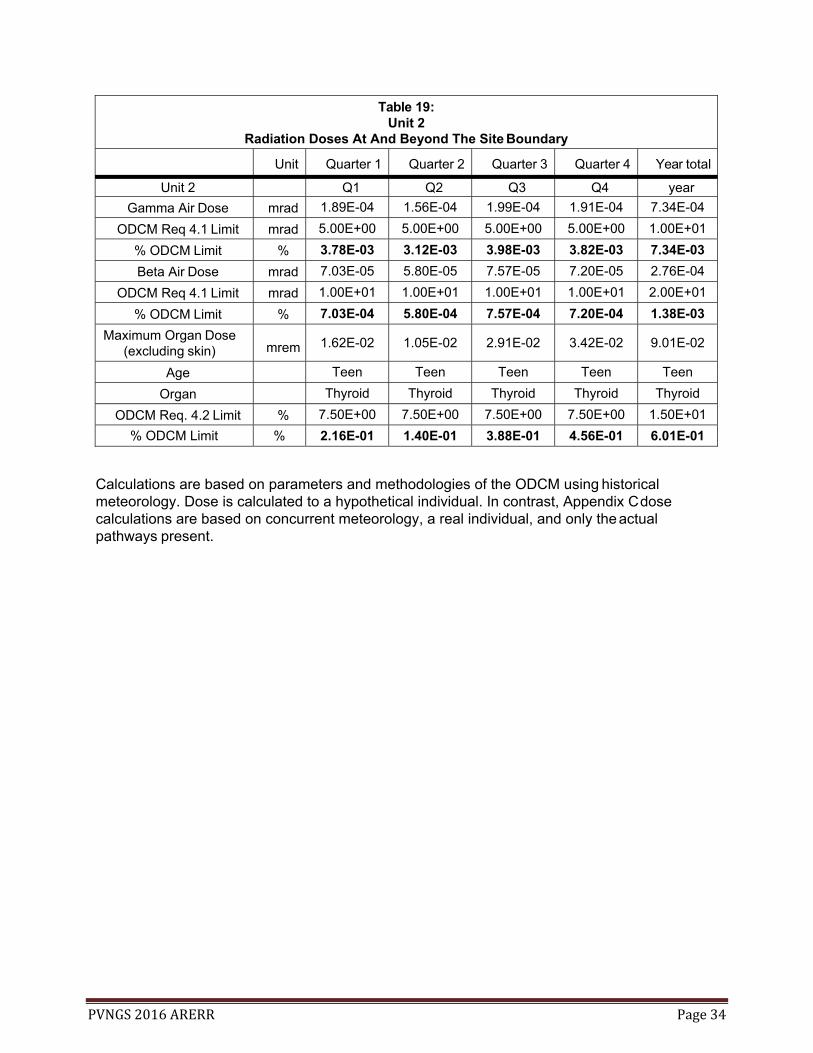
Table 19: Unit 2
Radiation Doses At And Beyond The Site Boundary
Unit Quarter 1 Quarter 2 Quarter 3 Quarter 4 Year total
Unit 2 Q1 Q2 Q3 Q4 year
Gamma Air Dose mrad 1.89E-04 1.56E-04 1.99E-04 1.91E-04 7.34E-04
ODCM Req 4.1 Limit mrad 5.00E+00 5.00E+00 5.00E+00 5.00E+00 1.00E+01
% ODCM Limit % 3.78E-03 3.12E-03 3.98E-03 3.82E-03 7.34E-03
Beta Air Dose mrad 7.03E-05 5.80E-05 7.57E-05 7.20E-05 2.76E-04
ODCM Req 4.1 Limit mrad 1.00E+01 1.00E+01 1.00E+01 1.00E+01 2.00E+01
% ODCM Limit % 7.03E-04 5.80E-04 7.57E-04 7.20E-04 1.38E-03
Maximum Organ Dose (excluding skin) mrem 1.62E-02 1.05E-02 2.91E-02 3.42E-02 9.01E-02
Age Teen Teen Teen Teen Teen
Organ Thyroid Thyroid Thyroid Thyroid Thyroid
ODCM Req. 4.2 Limit % 7.50E+00 7.50E+00 7.50E+00 7.50E+00 1.50E+01
% ODCM Limit % 2.16E-01 1.40E-01 3.88E-01 4.56E-01 6.01E-01
Calculations are based on parameters and methodologies of the ODCM using historical meteorology. Dose is calculated to a hypothetical individual. In contrast, Appendix C dose calculations are based on concurrent meteorology, a real individual, and only the actual pathways present.
PVNGS 2016 ARERR Page 35
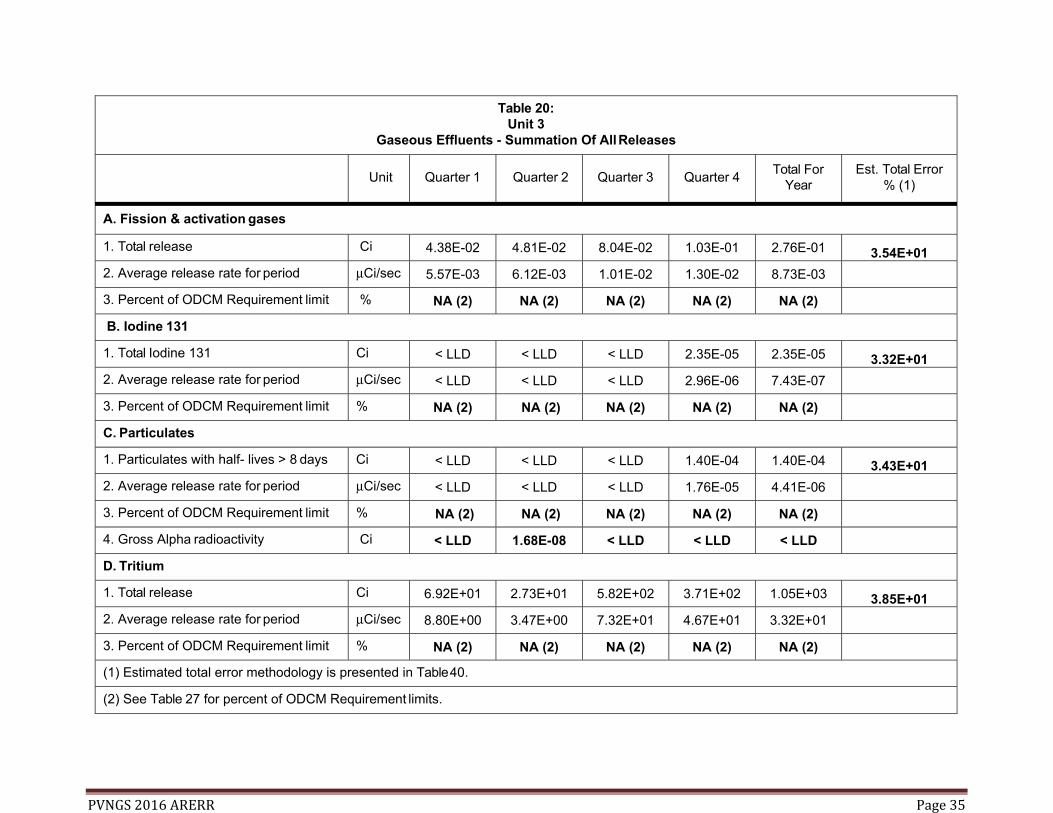
Table 20:
Unit 3 Gaseous Effluents - Summation Of All Releases
Unit
Quarter 1
Quarter 2
Quarter 3
Quarter 4
Total For Year
Est. Total Error % (1)
A. Fission & activation gases
1. Total release Ci 4.38E-02 4.81E-02 8.04E-02 1.03E-01 2.76E-01 3.54E+01
2. Average release rate for period μCi/sec 5.57E-03 6.12E-03 1.01E-02 1.30E-02 8.73E-03
3. Percent of ODCM Requirement limit % NA (2) NA (2) NA (2) NA (2) NA (2)
B. Iodine 131
1. Total Iodine 131 Ci < LLD < LLD < LLD 2.35E-05 2.35E-05 3.32E+01
2. Average release rate for period μCi/sec < LLD < LLD < LLD 2.96E-06 7.43E-07
3. Percent of ODCM Requirement limit % NA (2) NA (2) NA (2) NA (2) NA (2)
C. Particulates
1. Particulates with half- lives > 8 days Ci < LLD < LLD < LLD 1.40E-04 1.40E-04 3.43E+01
2. Average release rate for period μCi/sec < LLD < LLD < LLD 1.76E-05 4.41E-06
3. Percent of ODCM Requirement limit % NA (2) NA (2) NA (2) NA (2) NA (2)
4. Gross Alpha radioactivity Ci < LLD 1.68E-08 < LLD < LLD < LLD
D. Tritium
1. Total release Ci 6.92E+01 2.73E+01 5.82E+02 3.71E+02 1.05E+03 3.85E+01
2. Average release rate for period μCi/sec 8.80E+00 3.47E+00 7.32E+01 4.67E+01 3.32E+01
3. Percent of ODCM Requirement limit % NA (2) NA (2) NA (2) NA (2) NA (2)
(1) Estimated total error methodology is presented in Table 40.
(2) See Table 27 for percent of ODCM Requirement limits.

PVNGS 2016 ARERR Page 36
Table 21: Unit 3
Gaseous Effluents - Ground Level Releases - Continuous - Fission Gases and Iodines
Nuclides Released Unit Quarter 1 Quarter 2 Quarter 3 Quarter 4 Year total
1. Fission gases
Ar-41 Ci < LLD < LLD < LLD < LLD < LLD
Kr-83m Ci < LLD < LLD < LLD < LLD < LLD
Kr-85 Ci < LLD < LLD < LLD < LLD < LLD
Kr-85m Ci < LLD < LLD < LLD < LLD < LLD
Kr-87 Ci < LLD < LLD < LLD < LLD < LLD
Kr-88 Ci < LLD < LLD < LLD < LLD < LLD
Kr-89 Ci < LLD < LLD < LLD < LLD < LLD
Kr-90 Ci < LLD < LLD < LLD < LLD < LLD
Xe-131m Ci < LLD < LLD < LLD < LLD < LLD
Xe-133 Ci < LLD < LLD < LLD < LLD < LLD
Xe-133m Ci < LLD < LLD < LLD < LLD < LLD
Xe-135 Ci < LLD < LLD < LLD < LLD < LLD
Xe-135m Ci < LLD < LLD < LLD < LLD < LLD
Xe-137 Ci < LLD < LLD < LLD < LLD < LLD
Xe-138 Ci < LLD < LLD < LLD < LLD < LLD
Total Ci < LLD < LLD < LLD < LLD < LLD
2. IodinesI-131 Ci < LLD < LLD < LLD 2.35E-05 2.35E-05
I-132 Ci < LLD < LLD < LLD < LLD < LLD
I-133 Ci < LLD < LLD < LLD 9.27E-06 9.27E-06
I-134 Ci < LLD < LLD < LLD < LLD < LLD
I-135 Ci < LLD < LLD < LLD < LLD < LLD
Total Ci < LLD < LLD < LLD 3.28E-05 3.28E-05

PVNGS 2016 ARERR Page 37
Table 22: Unit 3
Gaseous Effluents - Ground Level Releases - Continuous - Particulates
Nuclides Released Unit Quarter 1 Quarter 2 Quarter 3 Quarter 4 Year total
3. Particulates
Ag-110m Ci < LLD < LLD < LLD < LLD < LLD
Ba-140 Ci < LLD < LLD < LLD < LLD < LLD
Br-82 Ci < LLD < LLD < LLD < LLD < LLD
Ce-141 Ci < LLD < LLD < LLD < LLD < LLD
Ce-144 Ci < LLD < LLD < LLD < LLD < LLD
Co-57 Ci < LLD < LLD < LLD < LLD < LLD
Co-58 Ci < LLD < LLD < LLD 2.19E-05 2.19E-05
Co-60 Ci < LLD < LLD < LLD 7.52E-06 7.52E-06
Cr-51 Ci < LLD < LLD < LLD 4.49E-06 4.49E-06
Cs-134 Ci < LLD < LLD < LLD < LLD < LLD
Cs-136 Ci < LLD < LLD < LLD < LLD < LLD
Cs-137 Ci < LLD < LLD < LLD < LLD < LLD
Cs-138 Ci < LLD < LLD < LLD < LLD < LLD
Fe-59 Ci < LLD < LLD < LLD < LLD < LLD
La-140 Ci < LLD < LLD < LLD < LLD < LLD
Mn-54 Ci < LLD < LLD < LLD < LLD < LLD
Mo-99 Ci < LLD < LLD < LLD < LLD < LLD
Nb-95 Ci < LLD < LLD < LLD < LLD < LLD
Os-191 Ci < LLD < LLD < LLD 1.38E-06 1.38E-06
Rb-88 Ci < LLD < LLD < LLD < LLD < LLD
Ru-103 Ci < LLD < LLD < LLD < LLD < LLD
Ru-106 Ci < LLD < LLD < LLD < LLD < LLD
Sb-122 Ci < LLD < LLD < LLD < LLD < LLD
Sb-124 Ci < LLD < LLD < LLD < LLD < LLD
Sb-125 Ci < LLD < LLD < LLD < LLD < LLD
Se-75 Ci < LLD < LLD < LLD < LLD < LLD
Sn-113m Ci < LLD < LLD < LLD < LLD < LLD
Sr-89 Ci < LLD < LLD < LLD < LLD < LLD
Sr-90 Ci < LLD < LLD < LLD < LLD < LLD
Tc-99m Ci < LLD < LLD < LLD < LLD < LLD
Te-123m Ci < LLD < LLD < LLD < LLD < LLD
Zn-65 Ci < LLD < LLD < LLD < LLD < LLD
Zr-95 Ci < LLD < LLD < LLD < LLD < LLD
Total Ci < LLD < LLD < LLD 3.53E-05 3.53E-05
4. Tritium H-3 Ci 2.92E+01 2.73E+01 2.43E+01 1.09E+02 1.90E+02

PVNGS 2016 ARERR Page 38
Table 23: Unit 3
Gaseous Effluents - Ground Level Releases - Batch - Fission Gases and Iodines
Nuclides Released Unit Quarter 1 Quarter 2 Quarter 3 Quarter 4 Year total
1. Fission gases
Ar-41 Ci 4.38E-02 4.81E-02 8.04E-02 5.10E-02 2.23E-01
Kr-83m Ci < LLD < LLD < LLD < LLD < LLD
Kr-85 Ci < LLD < LLD < LLD < LLD < LLD
Kr-85m Ci < LLD < LLD < LLD < LLD < LLD
Kr-87 Ci < LLD < LLD < LLD < LLD < LLD
Kr-88 Ci < LLD < LLD < LLD < LLD < LLD
Kr-89 Ci < LLD < LLD < LLD < LLD < LLD
Kr-90 Ci < LLD < LLD < LLD < LLD < LLD
Xe-131m Ci < LLD < LLD < LLD < LLD < LLD
Xe-133 Ci < LLD < LLD < LLD 5.23E-02 5.23E-02
Xe-133m Ci < LLD < LLD < LLD < LLD < LLD
Xe-135 Ci < LLD < LLD < LLD < LLD < LLD
Xe-135m Ci < LLD < LLD < LLD < LLD < LLD
Xe-137 Ci < LLD < LLD < LLD < LLD < LLD
Xe-138 Ci < LLD < LLD < LLD < LLD < LLD
Total Ci 4.38E-02 4.81E-02 8.04E-02 1.03E-01 2.76E-01
2. IodinesI-131 Ci < LLD < LLD < LLD < LLD < LLD
I-132 Ci < LLD < LLD < LLD < LLD < LLD
I-133 Ci < LLD < LLD < LLD < LLD < LLD
I-134 Ci < LLD < LLD < LLD < LLD < LLD
I-135 Ci < LLD < LLD < LLD < LLD < LLD
Total Ci < LLD < LLD < LLD < LLD < LLD
PVNGS 2016 ARERR Page 39
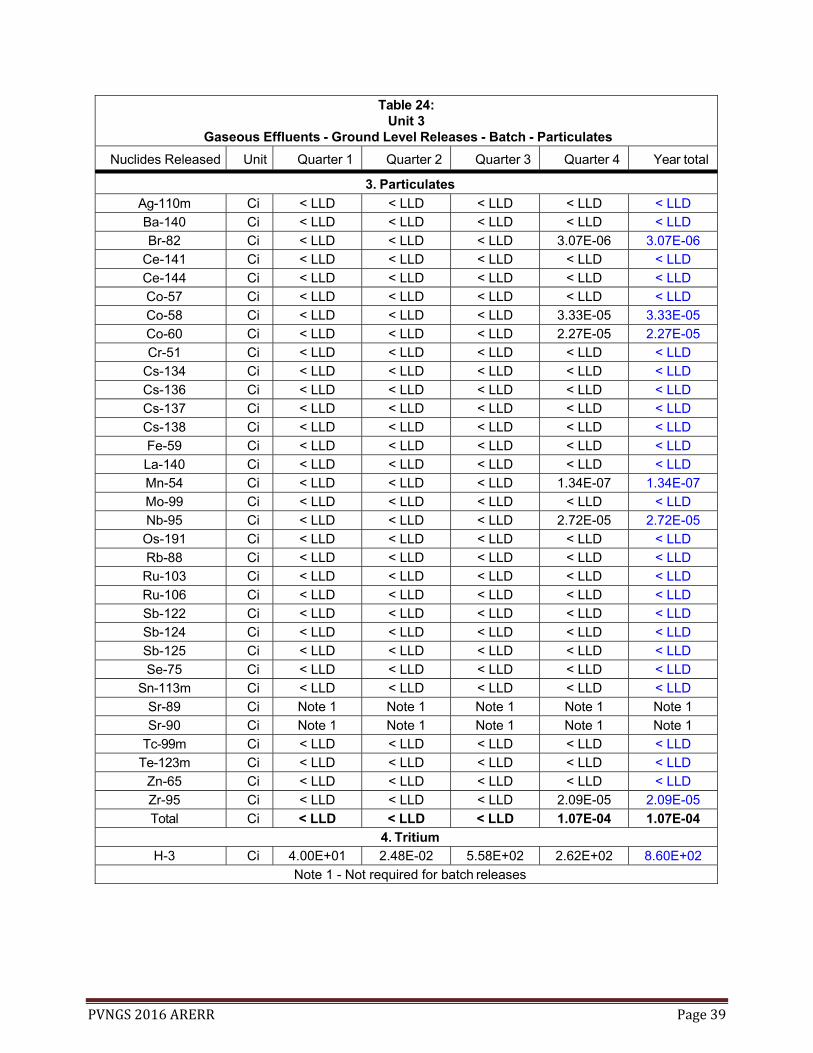
Table 24: Unit 3
Gaseous Effluents - Ground Level Releases - Batch - Particulates
Nuclides Released Unit Quarter 1 Quarter 2 Quarter 3 Quarter 4 Year total
3. Particulates
Ag-110m Ci < LLD < LLD < LLD < LLD < LLD
Ba-140 Ci < LLD < LLD < LLD < LLD < LLD
Br-82 Ci < LLD < LLD < LLD 3.07E-06 3.07E-06
Ce-141 Ci < LLD < LLD < LLD < LLD < LLD
Ce-144 Ci < LLD < LLD < LLD < LLD < LLD
Co-57 Ci < LLD < LLD < LLD < LLD < LLD
Co-58 Ci < LLD < LLD < LLD 3.33E-05 3.33E-05
Co-60 Ci < LLD < LLD < LLD 2.27E-05 2.27E-05
Cr-51 Ci < LLD < LLD < LLD < LLD < LLD
Cs-134 Ci < LLD < LLD < LLD < LLD < LLD
Cs-136 Ci < LLD < LLD < LLD < LLD < LLD
Cs-137 Ci < LLD < LLD < LLD < LLD < LLD
Cs-138 Ci < LLD < LLD < LLD < LLD < LLD
Fe-59 Ci < LLD < LLD < LLD < LLD < LLD
La-140 Ci < LLD < LLD < LLD < LLD < LLD
Mn-54 Ci < LLD < LLD < LLD 1.34E-07 1.34E-07
Mo-99 Ci < LLD < LLD < LLD < LLD < LLD
Nb-95 Ci < LLD < LLD < LLD 2.72E-05 2.72E-05
Os-191 Ci < LLD < LLD < LLD < LLD < LLD
Rb-88 Ci < LLD < LLD < LLD < LLD < LLD
Ru-103 Ci < LLD < LLD < LLD < LLD < LLD
Ru-106 Ci < LLD < LLD < LLD < LLD < LLD
Sb-122 Ci < LLD < LLD < LLD < LLD < LLD
Sb-124 Ci < LLD < LLD < LLD < LLD < LLD
Sb-125 Ci < LLD < LLD < LLD < LLD < LLD
Se-75 Ci < LLD < LLD < LLD < LLD < LLD
Sn-113m Ci < LLD < LLD < LLD < LLD < LLD
Sr-89 Ci Note 1 Note 1 Note 1 Note 1 Note 1
Sr-90 Ci Note 1 Note 1 Note 1 Note 1 Note 1
Tc-99m Ci < LLD < LLD < LLD < LLD < LLD
Te-123m Ci < LLD < LLD < LLD < LLD < LLD
Zn-65 Ci < LLD < LLD < LLD < LLD < LLD
Zr-95 Ci < LLD < LLD < LLD 2.09E-05 2.09E-05
Total Ci < LLD < LLD < LLD 1.07E-04 1.07E-04
4. Tritium H-3 Ci 4.00E+01 2.48E-02 5.58E+02 2.62E+02 8.60E+02
Note 1 - Not required for batch releases

PVNGS 2016 ARERR Page 40
Table 25: Unit 3
Gaseous Effluents - Continuous and Batch - Fission Gases and Iodines
Nuclides Released Unit Quarter 1 Quarter 2 Quarter 3 Quarter 4 Year total
1. Fission gases
Ar-41 Ci 4.38E-02 4.81E-02 8.04E-02 5.10E-02 2.23E-01
Kr-83m Ci < LLD < LLD < LLD < LLD < LLD
Kr-85 Ci < LLD < LLD < LLD < LLD < LLD
Kr-85m Ci < LLD < LLD < LLD < LLD < LLD
Kr-87 Ci < LLD < LLD < LLD < LLD < LLD
Kr-88 Ci < LLD < LLD < LLD < LLD < LLD
Kr-89 Ci < LLD < LLD < LLD < LLD < LLD
Kr-90 Ci < LLD < LLD < LLD < LLD < LLD
Xe-131m Ci < LLD < LLD < LLD < LLD < LLD
Xe-133 Ci < LLD < LLD < LLD 5.23E-02 5.23E-02
Xe-133m Ci < LLD < LLD < LLD < LLD < LLD
Xe-135 Ci < LLD < LLD < LLD < LLD < LLD
Xe-135m Ci < LLD < LLD < LLD < LLD < LLD
Xe-137 Ci < LLD < LLD < LLD < LLD < LLD
Xe-138 Ci < LLD < LLD < LLD < LLD < LLD
Total Ci 4.38E-02 4.81E-02 8.04E-02 1.03E-01 2.76E-01
2. IodinesI-131 Ci < LLD < LLD < LLD 2.35E-05 2.35E-05
I-132 Ci < LLD < LLD < LLD < LLD < LLD
I-133 Ci < LLD < LLD < LLD 9.27E-06 9.27E-06
I-134 Ci < LLD < LLD < LLD < LLD < LLD
I-135 Ci < LLD < LLD < LLD < LLD < LLD
Total Ci < LLD < LLD < LLD 3.28E-05 3.28E-05
PVNGS 2016 ARERR Page 41
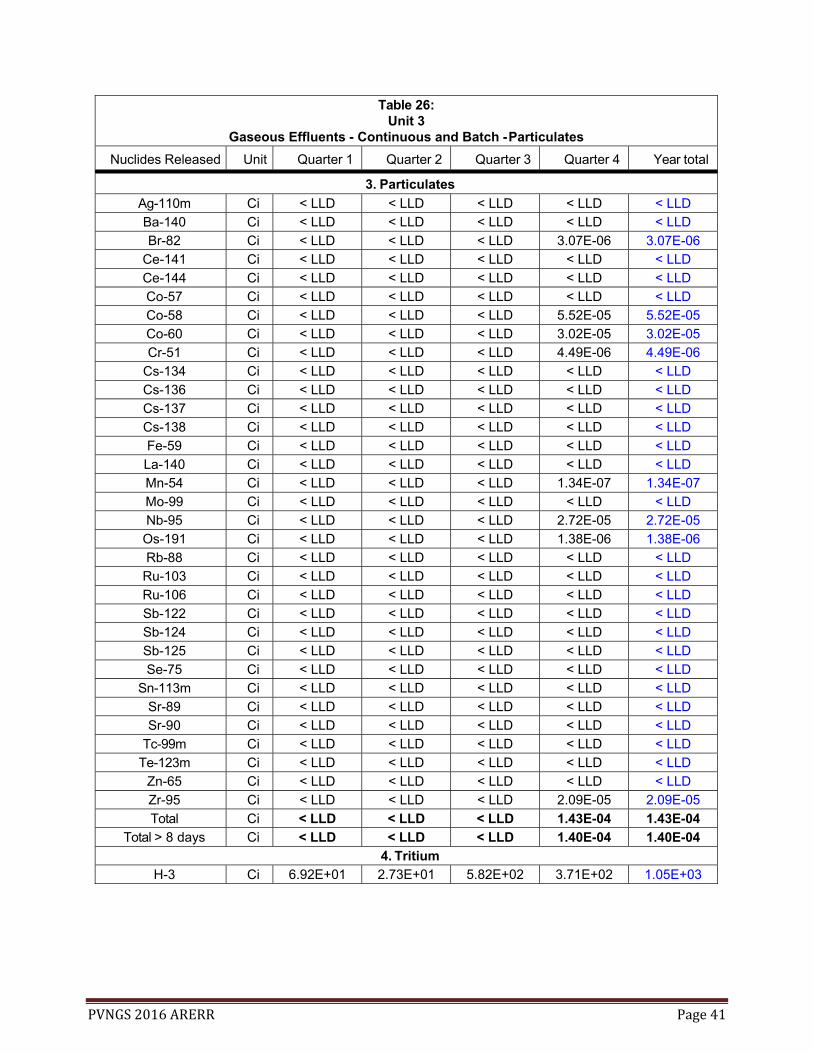
Table 26: Unit 3
Gaseous Effluents - Continuous and Batch - Particulates
Nuclides Released Unit Quarter 1 Quarter 2 Quarter 3 Quarter 4 Year total
3. Particulates
Ag-110m Ci < LLD < LLD < LLD < LLD < LLD
Ba-140 Ci < LLD < LLD < LLD < LLD < LLD
Br-82 Ci < LLD < LLD < LLD 3.07E-06 3.07E-06
Ce-141 Ci < LLD < LLD < LLD < LLD < LLD
Ce-144 Ci < LLD < LLD < LLD < LLD < LLD
Co-57 Ci < LLD < LLD < LLD < LLD < LLD
Co-58 Ci < LLD < LLD < LLD 5.52E-05 5.52E-05
Co-60 Ci < LLD < LLD < LLD 3.02E-05 3.02E-05
Cr-51 Ci < LLD < LLD < LLD 4.49E-06 4.49E-06
Cs-134 Ci < LLD < LLD < LLD < LLD < LLD
Cs-136 Ci < LLD < LLD < LLD < LLD < LLD
Cs-137 Ci < LLD < LLD < LLD < LLD < LLD
Cs-138 Ci < LLD < LLD < LLD < LLD < LLD
Fe-59 Ci < LLD < LLD < LLD < LLD < LLD
La-140 Ci < LLD < LLD < LLD < LLD < LLD
Mn-54 Ci < LLD < LLD < LLD 1.34E-07 1.34E-07
Mo-99 Ci < LLD < LLD < LLD < LLD < LLD
Nb-95 Ci < LLD < LLD < LLD 2.72E-05 2.72E-05
Os-191 Ci < LLD < LLD < LLD 1.38E-06 1.38E-06
Rb-88 Ci < LLD < LLD < LLD < LLD < LLD
Ru-103 Ci < LLD < LLD < LLD < LLD < LLD
Ru-106 Ci < LLD < LLD < LLD < LLD < LLD
Sb-122 Ci < LLD < LLD < LLD < LLD < LLD
Sb-124 Ci < LLD < LLD < LLD < LLD < LLD
Sb-125 Ci < LLD < LLD < LLD < LLD < LLD
Se-75 Ci < LLD < LLD < LLD < LLD < LLD
Sn-113m Ci < LLD < LLD < LLD < LLD < LLD
Sr-89 Ci < LLD < LLD < LLD < LLD < LLD
Sr-90 Ci < LLD < LLD < LLD < LLD < LLD
Tc-99m Ci < LLD < LLD < LLD < LLD < LLD
Te-123m Ci < LLD < LLD < LLD < LLD < LLD
Zn-65 Ci < LLD < LLD < LLD < LLD < LLD
Zr-95 Ci < LLD < LLD < LLD 2.09E-05 2.09E-05
Total Ci < LLD < LLD < LLD 1.43E-04 1.43E-04
Total > 8 days Ci < LLD < LLD < LLD 1.40E-04 1.40E-04
4. Tritium
H-3 Ci 6.92E+01 2.73E+01 5.82E+02 3.71E+02 1.05E+03

PVNGS 2016 ARERR Page 42
Table 27: Unit 3
Radiation Doses At And Beyond The Site Boundary
Unit Quarter 1 Quarter 2 Quarter 3 Quarter 4 Year total
Gamma Air Dose mrad 1.15E-04 1.26E-04 2.11E-04 1.39E-04 5.92E-04
ODCM Req 4.1 Limit mrad 5.00E+00 5.00E+00 5.00E+00 5.00E+00 1.00E+01
% ODCM Limit % 2.30E-03 2.52E-03 4.22E-03 2.78E-03 5.92E-03
Beta Air Dose mrad 4.06E-05 4.46E-05 7.45E-05 6.28E-05 2.22E-04
ODCM Req 4.1 Limit mrad 1.00E+01 1.00E+01 1.00E+01 1.00E+01 2.00E+01
% ODCM Limit % 4.06E-04 4.46E-04 7.45E-04 6.28E-04 1.11E-03
Maximum Organ Dose (excluding skin) mrem 2.48E-02 9.80E-03 2.09E-01 1.33E-01 3.77E-01
Age Teen Teen Teen Teen Teen
Organ Thyroid Thyroid Thyroid Thyroid Thyroid
ODCM Req. 4.2 Limit mrem 7.50E+00 7.50E+00 7.50E+00 7.50E+00 1.50E+01
% ODCM Limit % 3.31E-01 1.31E-01 2.79E+00 1.77E+00 2.51E+00
Calculations are based on parameters and methodologies of the ODCM using historical meteorology. Dose is calculated to a hypothetical individual. In contrast, Appendix C dose calculations are based on concurrent meteorology, a real individual, and only the actual pathways present.
PVNGS 2016 ARERR Page 43
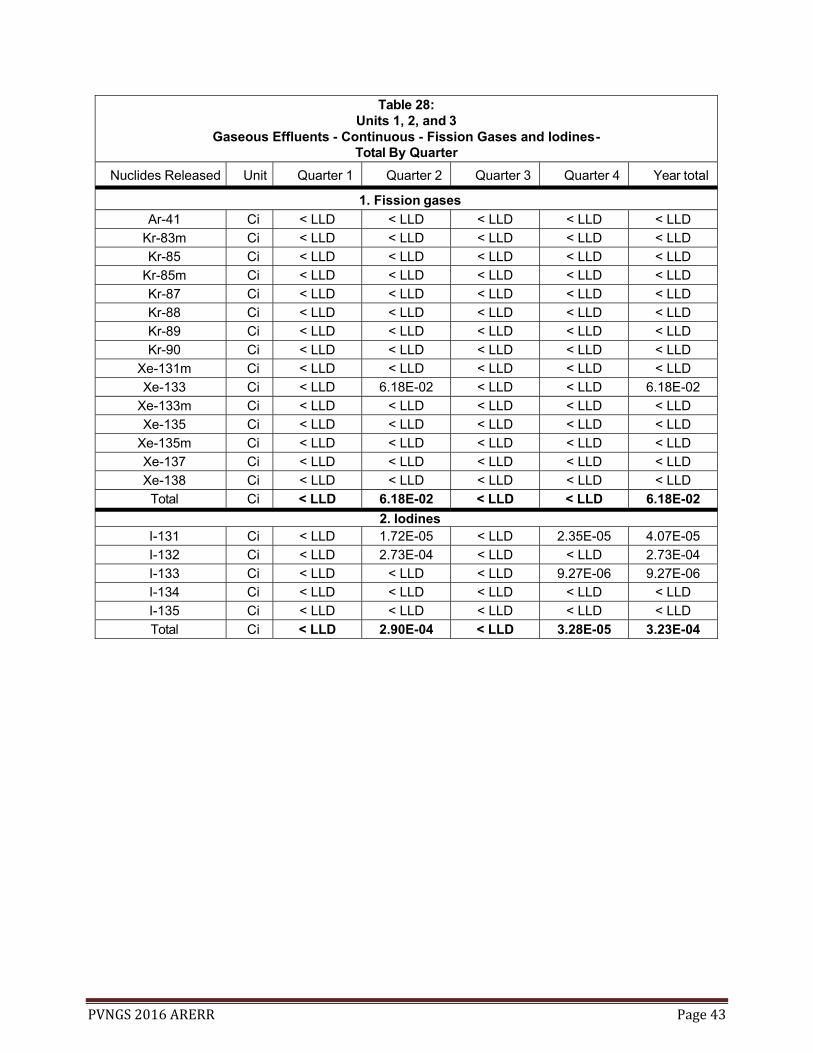
Table 28: Units 1, 2, and 3
Gaseous Effluents - Continuous - Fission Gases and Iodines - Total By Quarter
Nuclides Released Unit Quarter 1 Quarter 2 Quarter 3 Quarter 4 Year total
1. Fission gases
Ar-41 Ci < LLD < LLD < LLD < LLD < LLD
Kr-83m Ci < LLD < LLD < LLD < LLD < LLD
Kr-85 Ci < LLD < LLD < LLD < LLD < LLD
Kr-85m Ci < LLD < LLD < LLD < LLD < LLD
Kr-87 Ci < LLD < LLD < LLD < LLD < LLD
Kr-88 Ci < LLD < LLD < LLD < LLD < LLD
Kr-89 Ci < LLD < LLD < LLD < LLD < LLD
Kr-90 Ci < LLD < LLD < LLD < LLD < LLD
Xe-131m Ci < LLD < LLD < LLD < LLD < LLD
Xe-133 Ci < LLD 6.18E-02 < LLD < LLD 6.18E-02
Xe-133m Ci < LLD < LLD < LLD < LLD < LLD
Xe-135 Ci < LLD < LLD < LLD < LLD < LLD
Xe-135m Ci < LLD < LLD < LLD < LLD < LLD
Xe-137 Ci < LLD < LLD < LLD < LLD < LLD
Xe-138 Ci < LLD < LLD < LLD < LLD < LLD
Total Ci < LLD 6.18E-02 < LLD < LLD 6.18E-02
2. IodinesI-131 Ci < LLD 1.72E-05 < LLD 2.35E-05 4.07E-05
I-132 Ci < LLD 2.73E-04 < LLD < LLD 2.73E-04
I-133 Ci < LLD < LLD < LLD 9.27E-06 9.27E-06
I-134 Ci < LLD < LLD < LLD < LLD < LLD
I-135 Ci < LLD < LLD < LLD < LLD < LLD
Total Ci < LLD 2.90E-04 < LLD 3.28E-05 3.23E-04

PVNGS 2016 ARERR Page 44
Table 29: Units 1, 2, and 3
Gaseous Effluents - Continuous - Particulates - Total By Quarter
Nuclides Released Unit Quarter 1 Quarter 2 Quarter 3 Quarter 4 Year total
3. Particulates
Ag-110m Ci < LLD < LLD < LLD < LLD < LLD
Ba-140 Ci < LLD < LLD < LLD < LLD < LLD
Br-82 Ci < LLD < LLD < LLD < LLD < LLD
Ce-141 Ci < LLD < LLD < LLD < LLD < LLD
Ce-144 Ci < LLD < LLD < LLD < LLD < LLD
Co-57 Ci < LLD 4.88E-06 < LLD < LLD 4.88E-06
Co-58 Ci < LLD 1.59E-03 1.52E-06 2.19E-05 1.61E-03
Co-60 Ci 1.33E-06 5.21E-04 < LLD 7.52E-06 5.30E-04
Cr-51 Ci < LLD 5.72E-03 < LLD 4.49E-06 5.72E-03
Cs-134 Ci < LLD < LLD < LLD < LLD < LLD
Cs-136 Ci < LLD < LLD < LLD < LLD < LLD
Cs-137 Ci < LLD < LLD < LLD < LLD < LLD
Cs-138 Ci < LLD < LLD < LLD < LLD < LLD
Fe-59 Ci < LLD 9.54E-05 < LLD < LLD 9.54E-05
La-140 Ci < LLD < LLD < LLD < LLD < LLD
Mn-54 Ci < LLD 1.31E-04 < LLD < LLD 1.31E-04
Mo-99 Ci < LLD < LLD < LLD < LLD < LLD
Nb-95 Ci < LLD 1.98E-04 < LLD < LLD 1.98E-04
Os-191 Ci < LLD < LLD < LLD 1.38E-06 1.38E-06
Rb-88 Ci < LLD < LLD < LLD < LLD < LLD
Ru-103 Ci < LLD < LLD < LLD < LLD < LLD
Ru-106 Ci < LLD < LLD < LLD < LLD < LLD
Sb-122 Ci < LLD < LLD < LLD < LLD < LLD
Sb-124 Ci < LLD 7.86E-05 < LLD < LLD 7.86E-05
Sb-125 Ci < LLD < LLD < LLD < LLD < LLD
Se-75 Ci < LLD < LLD < LLD < LLD < LLD
Sn-113m Ci < LLD < LLD < LLD < LLD < LLD
Sr-89 Ci < LLD < LLD < LLD < LLD < LLD
Sr-90 Ci < LLD < LLD < LLD < LLD < LLD
Tc-99m Ci < LLD < LLD < LLD < LLD < LLD
Te-123m Ci < LLD < LLD < LLD < LLD < LLD
Zn-65 Ci < LLD < LLD < LLD < LLD < LLD
Zr-95 Ci < LLD 1.32E-04 < LLD < LLD 1.32E-04
Total Ci 1.33E-06 8.47E-03 1.52E-06 3.53E-05 8.51E-03
4. Tritium
H-3 Ci 8.51E+01 9.39E+01 8.40E+01 1.50E+02 4.13E+02

PVNGS 2016 ARERR Page 45
Table 30: Units 1, 2, and 3
Gaseous Effluents - Batch - Fission Gases and Iodines - Total By Quarter
Nuclides Released Unit Quarter 1 Quarter 2 Quarter 3 Quarter 4 Year total
1. Fission gases
Ar-41 Ci 2.29E-01 3.35E-01 2.17E-01 1.77E-01 9.58E-01
Kr-83m Ci < LLD < LLD < LLD < LLD < LLD
Kr-85 Ci < LLD < LLD < LLD < LLD < LLD
Kr-85m Ci < LLD < LLD < LLD < LLD < LLD
Kr-87 Ci < LLD < LLD < LLD < LLD < LLD
Kr-88 Ci < LLD < LLD < LLD < LLD < LLD
Kr-89 Ci < LLD < LLD < LLD < LLD < LLD
Kr-90 Ci < LLD < LLD < LLD < LLD < LLD
Xe-131m Ci < LLD 1.24E-03 < LLD < LLD 1.24E-03
Xe-133 Ci 1.46E-02 1.71E-01 2.11E-02 6.97E-02 2.77E-01
Xe-133m Ci < LLD 1.02E-03 < LLD < LLD 1.02E-03
Xe-135 Ci < LLD 3.33E-03 1.33E-04 5.78E-05 3.52E-03
Xe-135m Ci < LLD < LLD < LLD < LLD < LLD
Xe-137 Ci < LLD < LLD < LLD < LLD < LLD
Xe-138 Ci < LLD < LLD < LLD < LLD < LLD
Total Ci 2.44E-01 5.12E-01 2.38E-01 2.47E-01 1.24E+00
2. IodinesI-131 Ci < LLD < LLD < LLD < LLD < LLD
I-132 Ci < LLD < LLD < LLD < LLD < LLD
I-133 Ci < LLD < LLD < LLD < LLD < LLD
I-134 Ci < LLD < LLD < LLD < LLD < LLD
I-135 Ci < LLD < LLD < LLD < LLD < LLD
Total Ci < LLD < LLD < LLD < LLD < LLD

PVNGS 2016 ARERR Page 46
Table 31: Units 1, 2, and 3
Gaseous Effluents - Batch - Particulates - Total By Quarter
Nuclides Released Unit Quarter 1 Quarter 2 Quarter 3 Quarter 4 Year total
3. Particulates
Ag-110m Ci < LLD < LLD < LLD < LLD < LLD
Ba-140 Ci < LLD < LLD < LLD < LLD < LLD
Br-82 Ci < LLD 1.53E-05 < LLD 3.07E-06 1.84E-05
Ce-141 Ci < LLD < LLD < LLD < LLD < LLD
Ce-144 Ci < LLD < LLD < LLD < LLD < LLD
Co-57 Ci < LLD < LLD < LLD < LLD < LLD
Co-58 Ci < LLD 4.01E-04 < LLD 3.33E-05 4.34E-04
Co-60 Ci < LLD 1.52E-04 < LLD 2.27E-05 1.75E-04
Cr-51 Ci < LLD 1.15E-03 < LLD < LLD 1.15E-03
Cs-134 Ci < LLD < LLD < LLD < LLD < LLD
Cs-136 Ci < LLD < LLD < LLD < LLD < LLD
Cs-137 Ci < LLD < LLD < LLD < LLD < LLD
Cs-138 Ci < LLD < LLD < LLD < LLD < LLD
Fe-59 Ci < LLD 8.86E-06 < LLD < LLD 8.86E-06
La-140 Ci < LLD < LLD < LLD < LLD < LLD
Mn-54 Ci < LLD 3.44E-05 < LLD 1.34E-07 3.45E-05
Mo-99 Ci < LLD < LLD < LLD < LLD < LLD
Nb-95 Ci < LLD 5.04E-05 < LLD 2.72E-05 7.76E-05
Os-191 Ci < LLD < LLD < LLD < LLD < LLD
Rb-88 Ci < LLD < LLD < LLD < LLD < LLD
Ru-103 Ci < LLD < LLD < LLD < LLD < LLD
Ru-106 Ci < LLD < LLD < LLD < LLD < LLD
Sb-122 Ci < LLD < LLD < LLD < LLD < LLD
Sb-124 Ci < LLD < LLD < LLD < LLD < LLD
Sb-125 Ci < LLD < LLD < LLD < LLD < LLD
Se-75 Ci < LLD < LLD < LLD < LLD < LLD
Sn-113m Ci < LLD < LLD < LLD < LLD < LLD
Sr-89 Ci Note 1 Note 1 Note 1 Note 1 Note 1
Sr-90 Ci Note 1 Note 1 Note 1 Note 1 Note 1
Tc-99m Ci < LLD < LLD < LLD < LLD < LLD
Te-123m Ci < LLD < LLD < LLD < LLD < LLD
Zn-65 Ci < LLD < LLD < LLD < LLD < LLD
Zr-95 Ci < LLD 5.29E-06 < LLD 2.09E-05 2.62E-05
Total Ci < LLD 1.82E-03 < LLD 1.07E-04 1.92E-03
4. Tritium
H-3 Ci 5.24E+02 3.11E+02 6.88E+02 4.20E+02 1.94E+03
Note 1 - Not required for batch releases

PVNGS 2016 ARERR Page 47
Table 32: Units 1, 2, and 3
Gaseous Effluents - Continuous and Batch - Fission Gases and Iodines - Total By Quarter
Nuclides Released Unit Quarter 1 Quarter 2 Quarter 3 Quarter 4 Year total
1. Fission gases
Ar-41 Ci 2.29E-01 3.35E-01 2.17E-01 1.77E-01 9.58E-01
Kr-83m Ci < LLD < LLD < LLD < LLD < LLD
Kr-85 Ci < LLD < LLD < LLD < LLD < LLD
Kr-85m Ci < LLD < LLD < LLD < LLD < LLD
Kr-87 Ci < LLD < LLD < LLD < LLD < LLD
Kr-88 Ci < LLD < LLD < LLD < LLD < LLD
Kr-89 Ci < LLD < LLD < LLD < LLD < LLD
Kr-90 Ci < LLD < LLD < LLD < LLD < LLD
Xe-131m Ci < LLD 1.24E-03 < LLD < LLD 1.24E-03
Xe-133 Ci 1.46E-02 2.33E-01 2.11E-02 6.97E-02 3.38E-01
Xe-133m Ci < LLD 1.02E-03 < LLD < LLD 1.02E-03
Xe-135 Ci < LLD 3.33E-03 1.33E-04 5.78E-05 3.52E-03
Xe-135m Ci < LLD < LLD < LLD < LLD < LLD
Xe-137 Ci < LLD < LLD < LLD < LLD < LLD
Xe-138 Ci < LLD < LLD < LLD < LLD < LLD
Total Ci 2.44E-01 5.73E-01 2.38E-01 2.47E-01 1.30E+00
2. IodinesI-131 Ci < LLD 1.72E-05 < LLD 2.35E-05 4.07E-05
I-132 Ci < LLD 2.73E-04 < LLD < LLD 2.73E-04
I-133 Ci < LLD < LLD < LLD 9.27E-06 9.27E-06
I-134 Ci < LLD < LLD < LLD < LLD < LLD
I-135 Ci < LLD < LLD < LLD < LLD < LLD
Total Ci < LLD 2.90E-04 < LLD 3.28E-05 3.23E-04

PVNGS 2016 ARERR Page 48
Table 33: Units 1, 2, and 3
Gaseous Effluents - Continuous and Batch - Particulates - Total By Quarter
Nuclides Released Unit Quarter 1 Quarter 2 Quarter 3 Quarter 4 Year total
3. Particulates
Ag-110m Ci < LLD < LLD < LLD < LLD < LLD
Ba-140 Ci < LLD < LLD < LLD < LLD < LLD
Br-82 Ci < LLD 1.53E-05 < LLD 3.07E-06 1.84E-05
Ce-141 Ci < LLD < LLD < LLD < LLD < LLD
Ce-144 Ci < LLD < LLD < LLD < LLD < LLD
Co-57 Ci < LLD 4.88E-06 < LLD < LLD 4.88E-06
Co-58 Ci < LLD 1.99E-03 < LLD 5.52E-05 2.05E-03
Co-60 Ci 1.33E-06 6.73E-04 < LLD 3.02E-05 7.05E-04
Cr-51 Ci < LLD 6.87E-03 < LLD 4.49E-06 6.87E-03
Cs-134 Ci < LLD < LLD < LLD < LLD < LLD
Cs-136 Ci < LLD < LLD < LLD < LLD < LLD
Cs-137 Ci < LLD < LLD < LLD < LLD < LLD
Cs-138 Ci < LLD < LLD < LLD < LLD < LLD
Fe-59 Ci < LLD 1.04E-04 < LLD < LLD 1.04E-04
La-140 Ci < LLD < LLD < LLD < LLD < LLD
Mn-54 Ci < LLD 1.65E-04 < LLD 1.34E-07 1.66E-04
Mo-99 Ci < LLD < LLD < LLD < LLD < LLD
Nb-95 Ci < LLD 2.48E-04 < LLD 2.72E-05 2.76E-04
Os-191 Ci < LLD < LLD < LLD 1.38E-06 1.38E-06
Rb-88 Ci < LLD < LLD < LLD < LLD < LLD
Ru-103 Ci < LLD < LLD < LLD < LLD < LLD
Ru-106 Ci < LLD < LLD < LLD < LLD < LLD
Sb-122 Ci < LLD < LLD < LLD < LLD < LLD
Sb-124 Ci < LLD 7.86E-05 < LLD < LLD 7.86E-05
Sb-125 Ci < LLD < LLD < LLD < LLD < LLD
Se-75 Ci < LLD < LLD < LLD < LLD < LLD
Sn-113m Ci < LLD < LLD < LLD < LLD < LLD
Sr-89 Ci < LLD < LLD < LLD < LLD < LLD
Sr-90 Ci < LLD < LLD < LLD < LLD < LLD
Tc-99m Ci < LLD < LLD < LLD < LLD < LLD
Te-123m Ci < LLD < LLD < LLD < LLD < LLD
Zn-65 Ci < LLD < LLD < LLD < LLD < LLD
Zr-95 Ci < LLD 1.37E-04 < LLD 2.09E-05 1.58E-04
Total Ci 1.33E-06 1.03E-02 < LLD 1.43E-04 1.04E-02
Total > 8 days Ci 1.33E-06 1.03E-02 < LLD 1.40E-04 1.04E-02
4. Tritium
H-3 Ci 6.09E+02 4.05E+02 7.72E+02 5.70E+02 2.36E+03
PVNGS 2016 ARERR Page 49
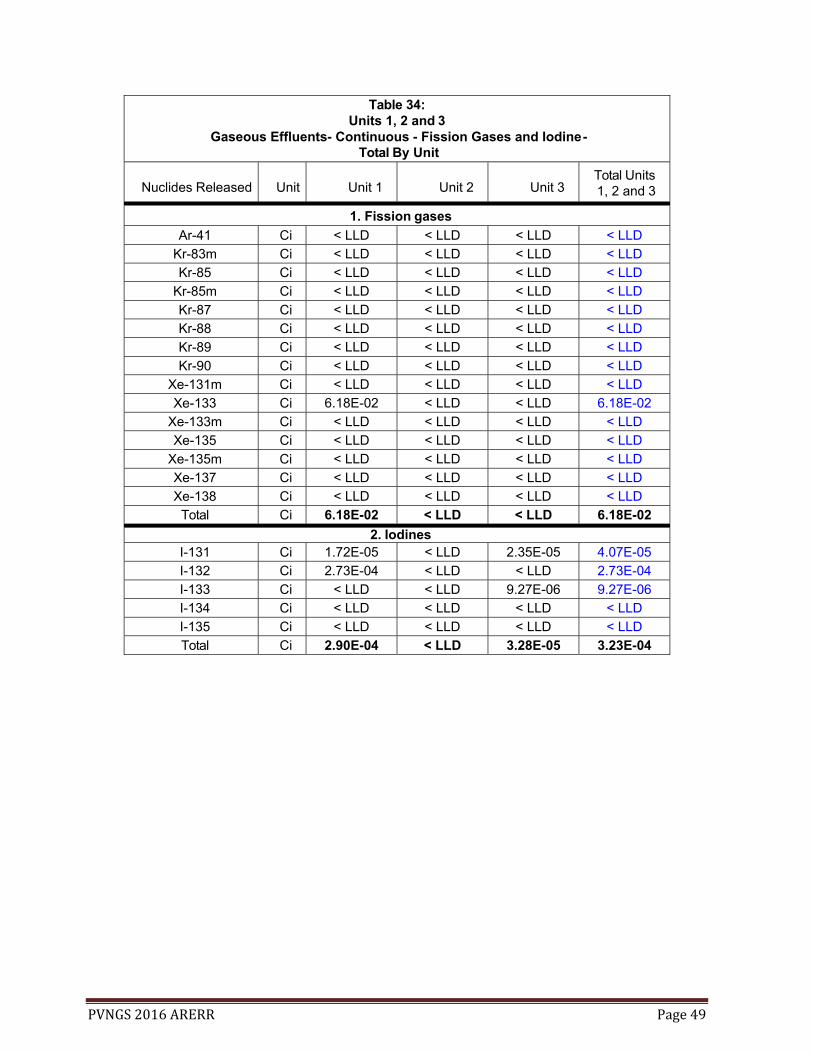
Table 34: Units 1, 2 and 3
Gaseous Effluents- Continuous - Fission Gases and Iodine - Total By Unit
Nuclides Released Unit Unit 1 Unit 2 Unit 3 Total Units 1, 2 and 3
1. Fission gases
Ar-41 Ci < LLD < LLD < LLD < LLD
Kr-83m Ci < LLD < LLD < LLD < LLD
Kr-85 Ci < LLD < LLD < LLD < LLD
Kr-85m Ci < LLD < LLD < LLD < LLD
Kr-87 Ci < LLD < LLD < LLD < LLD
Kr-88 Ci < LLD < LLD < LLD < LLD
Kr-89 Ci < LLD < LLD < LLD < LLD
Kr-90 Ci < LLD < LLD < LLD < LLD
Xe-131m Ci < LLD < LLD < LLD < LLD
Xe-133 Ci 6.18E-02 < LLD < LLD 6.18E-02
Xe-133m Ci < LLD < LLD < LLD < LLD
Xe-135 Ci < LLD < LLD < LLD < LLD
Xe-135m Ci < LLD < LLD < LLD < LLD
Xe-137 Ci < LLD < LLD < LLD < LLD
Xe-138 Ci < LLD < LLD < LLD < LLD
Total Ci 6.18E-02 < LLD < LLD 6.18E-02
2. IodinesI-131 Ci 1.72E-05 < LLD 2.35E-05 4.07E-05
I-132 Ci 2.73E-04 < LLD < LLD 2.73E-04
I-133 Ci < LLD < LLD 9.27E-06 9.27E-06
I-134 Ci < LLD < LLD < LLD < LLD
I-135 Ci < LLD < LLD < LLD < LLD
Total Ci 2.90E-04 < LLD 3.28E-05 3.23E-04

PVNGS 2016 ARERR Page 50
Table 35: Units 1, 2 and 3
Gaseous Effluents- Continuous - Particulates - Total By Unit
Nuclides Released Unit Unit 1 Unit 2 Unit 3 Total Units 1, 2 and 3
3. ParticulatesAg-110m Ci < LLD < LLD < LLD < LLD
Ba-140 Ci < LLD < LLD < LLD < LLD
Br-82 Ci < LLD < LLD < LLD < LLD
Ce-141 Ci < LLD < LLD < LLD < LLD
Ce-144 Ci < LLD < LLD < LLD < LLD
Co-57 Ci 4.88E-06 < LLD < LLD 4.88E-06
Co-58 Ci 1.59E-03 < LLD 2.19E-05 1.62E-03
Co-60 Ci 5.22E-04 < LLD 7.52E-06 5.29E-04
Cr-51 Ci 5.72E-03 < LLD 4.49E-06 5.72E-03
Cs-134 Ci < LLD < LLD < LLD < LLD
Cs-136 Ci < LLD < LLD < LLD < LLD
Cs-137 Ci < LLD < LLD < LLD < LLD
Cs-138 Ci < LLD < LLD < LLD < LLD
Fe-59 Ci 9.54E-05 < LLD < LLD 9.54E-05
La-140 Ci < LLD < LLD < LLD < LLD
Mn-54 Ci 1.31E-04 < LLD < LLD 1.31E-04
Mo-99 Ci < LLD < LLD < LLD < LLD
Nb-95 Ci 1.98E-04 < LLD < LLD 1.98E-04
Os-191 Ci < LLD < LLD 1.38E-06 1.38E-06
Rb-88 Ci < LLD < LLD < LLD < LLD
Ru-103 Ci < LLD < LLD < LLD < LLD
Ru-106 Ci < LLD < LLD < LLD < LLD
Sb-122 Ci < LLD < LLD < LLD < LLD
Sb-124 Ci 7.86E-05 < LLD < LLD 7.86E-05
Sb-125 Ci < LLD < LLD < LLD < LLD
Se-75 Ci < LLD < LLD < LLD < LLD
Sn-113m Ci < LLD < LLD < LLD < LLD
Sr-89 Ci < LLD < LLD < LLD < LLD
Sr-90 Ci < LLD < LLD < LLD < LLD
Tc-99m Ci < LLD < LLD < LLD < LLD
Te-123m Ci < LLD < LLD < LLD < LLD
Zn-65 Ci < LLD < LLD < LLD < LLD
Zr-95 Ci 1.32E-04 < LLD < LLD 1.32E-04
Total Ci 8.47E-03 < LLD 3.53E-05 8.51E-03
4. Tritium
H-3 Ci 1.24E+02 9.91E+01 1.89E+02 4.13E+02

PVNGS 2016 ARERR Page 51
Table 36: Units 1, 2 and 3
Gaseous Effluents- Batch - Fission Gases and Iodine - Total By Unit
Nuclides Released Unit Unit 1 Unit 2 Unit 3 Total Units 1, 2 and 3
1. Fission gases
Ar-41 Ci 5.43E+00 2.77E-01 2.35E-01 5.94E+00
Kr-83m Ci < LLD < LLD < LLD < LLD
Kr-85 Ci < LLD < LLD < LLD < LLD
Kr-85m Ci < LLD < LLD < LLD < LLD
Kr-87 Ci < LLD < LLD < LLD < LLD
Kr-88 Ci < LLD < LLD < LLD < LLD
Kr-89 Ci < LLD < LLD < LLD < LLD
Kr-90 Ci < LLD < LLD < LLD < LLD
Xe-131m Ci 1.24E-03 < LLD < LLD 1.24E-03
Xe-133 Ci 1.62E-01 6.47E-02 5.23E-02 2.79E-01
Xe-133m Ci 1.02E-03 < LLD < LLD 1.02E-03
Xe-135 Ci 3.33E-03 1.90E-04 < LLD 3.52E-03
Xe-135m Ci < LLD < LLD < LLD < LLD
Xe-137 Ci < LLD < LLD < LLD < LLD
Xe-138 < LLD < LLD < LLD < LLD
Total Ci 5.60E+00 3.42E-01 2.87E-01 6.23E+00
2. IodinesI-131 Ci < LLD < LLD < LLD < LLD
I-132 Ci < LLD < LLD < LLD < LLD
I-133 Ci < LLD < LLD < LLD < LLD
I-134 Ci < LLD < LLD < LLD < LLD
I-135 Ci < LLD < LLD < LLD < LLD
Total Ci < LLD < LLD < LLD < LLD

PVNGS 2016 ARERR Page 52
Table 37: Units 1, 2 and 3
Gaseous Effluents- Batch - Particulates - Total By Unit
Nuclides Released Unit Unit 1 Unit 2 Unit 3 Total Units 1,2 and 3
3. ParticulatesAg-110m Ci < LLD < LLD < LLD < LLD
Ba-140 Ci < LLD < LLD < LLD < LLD
Br-82 Ci 1.44E-03 < LLD 4.20E-06 1.44E-03
Ce-141 Ci < LLD < LLD < LLD < LLD
Ce-144 Ci < LLD < LLD < LLD < LLD
Co-57 Ci < LLD < LLD < LLD < LLD
Co-58 Ci 4.01E-04 < LLD 3.33E-05 4.34E-04
Co-60 Ci 1.52E-04 < LLD 2.27E-05 1.75E-04
Cr-51 Ci 1.15E-03 < LLD < LLD 1.15E-03
Cs-134 Ci < LLD < LLD < LLD < LLD
Cs-136 Ci < LLD < LLD < LLD < LLD
Cs-137 Ci < LLD < LLD < LLD < LLD
Cs-138 Ci < LLD < LLD < LLD < LLD
Fe-59 Ci 8.86E-06 < LLD < LLD 8.86E-06
La-140 Ci < LLD < LLD < LLD < LLD
Mn-54 Ci 3.44E-05 < LLD 1.34E-07 3.46E-05
Mo-99 Ci < LLD < LLD < LLD < LLD
Nb-95 Ci 5.04E-05 < LLD 2.72E-05 7.76E-05
Os-191 Ci < LLD < LLD < LLD < LLD
Rb-88 Ci < LLD < LLD < LLD < LLD
Ru-103 Ci < LLD < LLD < LLD < LLD
Ru-106 Ci < LLD < LLD < LLD < LLD
Sb-122 Ci < LLD < LLD < LLD < LLD
Sb-124 Ci < LLD < LLD < LLD < LLD
Sb-125 Ci < LLD < LLD < LLD < LLD
Se-75 Ci < LLD < LLD < LLD < LLD
Sn-113m Ci < LLD < LLD < LLD < LLD
Sr-89 Ci Note 1 Note 1 Note 1 Note 1
Sr-90 Ci Note 1 Note 1 Note 1 Note 1
Tc-99m Ci < LLD < LLD < LLD < LLD
Te-123m Ci < LLD < LLD < LLD < LLD
Zn-65 Ci < LLD < LLD < LLD < LLD
Zr-95 Ci 5.29E-06 < LLD 2.09E-05 2.62E-05
Total Ci 3.24E-03 < LLD 1.08E-04 3.34E-03
4. Tritium
H-3 Ci 9.31E+02 1.52E+02 9.44E+02 2.03E+03
Note 1 - Not required for batch releases

PVNGS 2016 ARERR Page 53
Table 38: Units 1, 2 and 3
Gaseous Effluents- Continuous and Batch - Fission Gases and Iodine - Total By Unit
Nuclides Released Unit Unit 1 Unit 2 Unit 3 Total Units 1, 2 and 3
1. Fission gases
Ar-41 Ci 5.43E+00 2.77E-01 2.35E-01 5.94E+00
Kr-83m Ci < LLD < LLD < LLD < LLD
Kr-85 Ci < LLD < LLD < LLD < LLD
Kr-85m Ci < LLD < LLD < LLD < LLD
Kr-87 Ci < LLD < LLD < LLD < LLD
Kr-88 Ci < LLD < LLD < LLD < LLD
Kr-89 Ci < LLD < LLD < LLD < LLD
Kr-90 Ci < LLD < LLD < LLD < LLD
Xe-131m Ci 1.24E-03 < LLD < LLD 1.24E-03
Xe-133 Ci 2.24E-01 6.47E-02 5.23E-02 3.41E-01
Xe-133m Ci 1.02E-03 < LLD < LLD 1.02E-03
Xe-135 Ci 3.33E-03 1.90E-04 < LLD 3.52E-03
Xe-135m Ci < LLD < LLD < LLD < LLD
Xe-137 Ci < LLD < LLD < LLD < LLD
Xe-138 Ci < LLD < LLD < LLD < LLD
Total Ci 5.66E+00 3.42E-01 2.87E-01 6.29E+00
2. IodinesI-131 Ci 1.72E-05 < LLD 2.35E-05 4.07E-05
I-132 Ci 2.73E-04 < LLD < LLD 2.73E-04
I-133 Ci < LLD < LLD 9.27E-06 9.27E-06
I-134 Ci < LLD < LLD < LLD < LLD
I-135 Ci < LLD < LLD < LLD < LLD
Total Ci 2.90E-04 < LLD 3.28E-05 3.23E-04
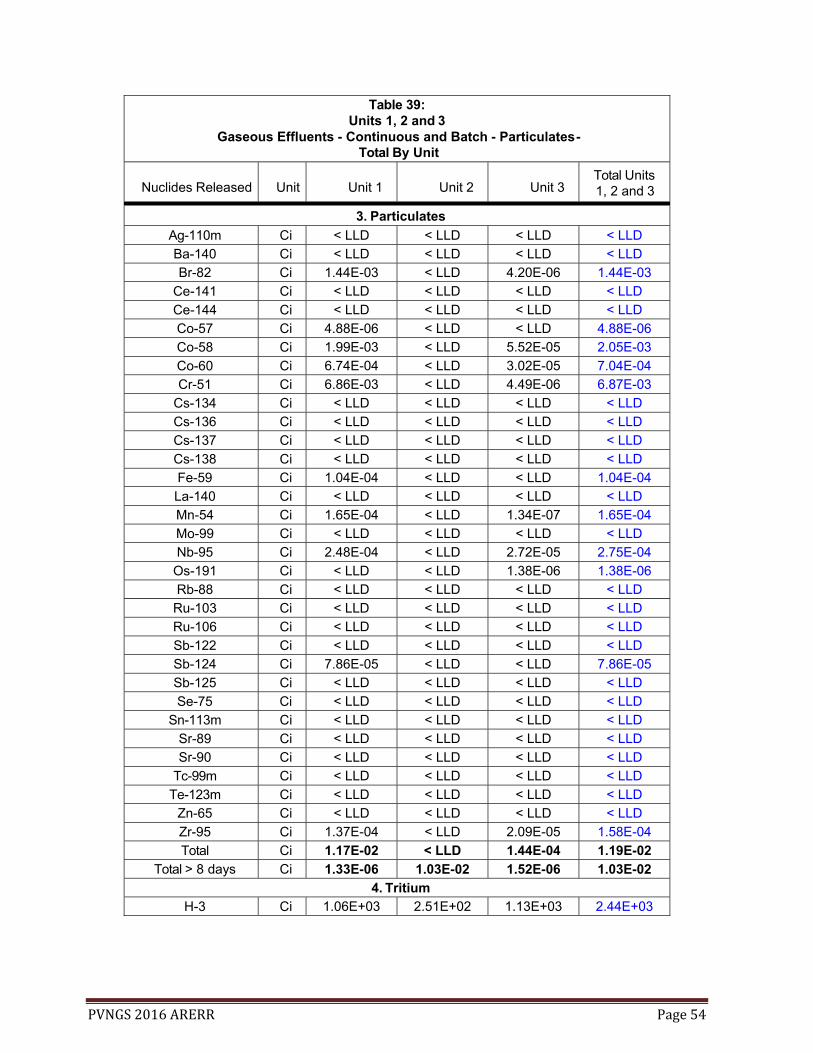
PVNGS 2016 ARERR Page 54
Table 39: Units 1, 2 and 3
Gaseous Effluents - Continuous and Batch - Particulates - Total By Unit
Nuclides Released Unit Unit 1 Unit 2 Unit 3 Total Units 1, 2 and 3
3. Particulates
Ag-110m Ci < LLD < LLD < LLD < LLD
Ba-140 Ci < LLD < LLD < LLD < LLD
Br-82 Ci 1.44E-03 < LLD 4.20E-06 1.44E-03
Ce-141 Ci < LLD < LLD < LLD < LLD
Ce-144 Ci < LLD < LLD < LLD < LLD
Co-57 Ci 4.88E-06 < LLD < LLD 4.88E-06
Co-58 Ci 1.99E-03 < LLD 5.52E-05 2.05E-03
Co-60 Ci 6.74E-04 < LLD 3.02E-05 7.04E-04
Cr-51 Ci 6.86E-03 < LLD 4.49E-06 6.87E-03
Cs-134 Ci < LLD < LLD < LLD < LLD
Cs-136 Ci < LLD < LLD < LLD < LLD
Cs-137 Ci < LLD < LLD < LLD < LLD
Cs-138 Ci < LLD < LLD < LLD < LLD
Fe-59 Ci 1.04E-04 < LLD < LLD 1.04E-04
La-140 Ci < LLD < LLD < LLD < LLD
Mn-54 Ci 1.65E-04 < LLD 1.34E-07 1.65E-04
Mo-99 Ci < LLD < LLD < LLD < LLD
Nb-95 Ci 2.48E-04 < LLD 2.72E-05 2.75E-04
Os-191 Ci < LLD < LLD 1.38E-06 1.38E-06
Rb-88 Ci < LLD < LLD < LLD < LLD
Ru-103 Ci < LLD < LLD < LLD < LLD
Ru-106 Ci < LLD < LLD < LLD < LLD
Sb-122 Ci < LLD < LLD < LLD < LLD
Sb-124 Ci 7.86E-05 < LLD < LLD 7.86E-05
Sb-125 Ci < LLD < LLD < LLD < LLD
Se-75 Ci < LLD < LLD < LLD < LLD
Sn-113m Ci < LLD < LLD < LLD < LLD
Sr-89 Ci < LLD < LLD < LLD < LLD
Sr-90 Ci < LLD < LLD < LLD < LLD
Tc-99m Ci < LLD < LLD < LLD < LLD
Te-123m Ci < LLD < LLD < LLD < LLD
Zn-65 Ci < LLD < LLD < LLD < LLD
Zr-95 Ci 1.37E-04 < LLD 2.09E-05 1.58E-04
Total Ci 1.17E-02 < LLD 1.44E-04 1.19E-02
Total > 8 days Ci 1.33E-06 1.03E-02 1.52E-06 1.03E-02
4. Tritium
H-3 Ci 1.06E+03 2.51E+02 1.13E+03 2.44E+03
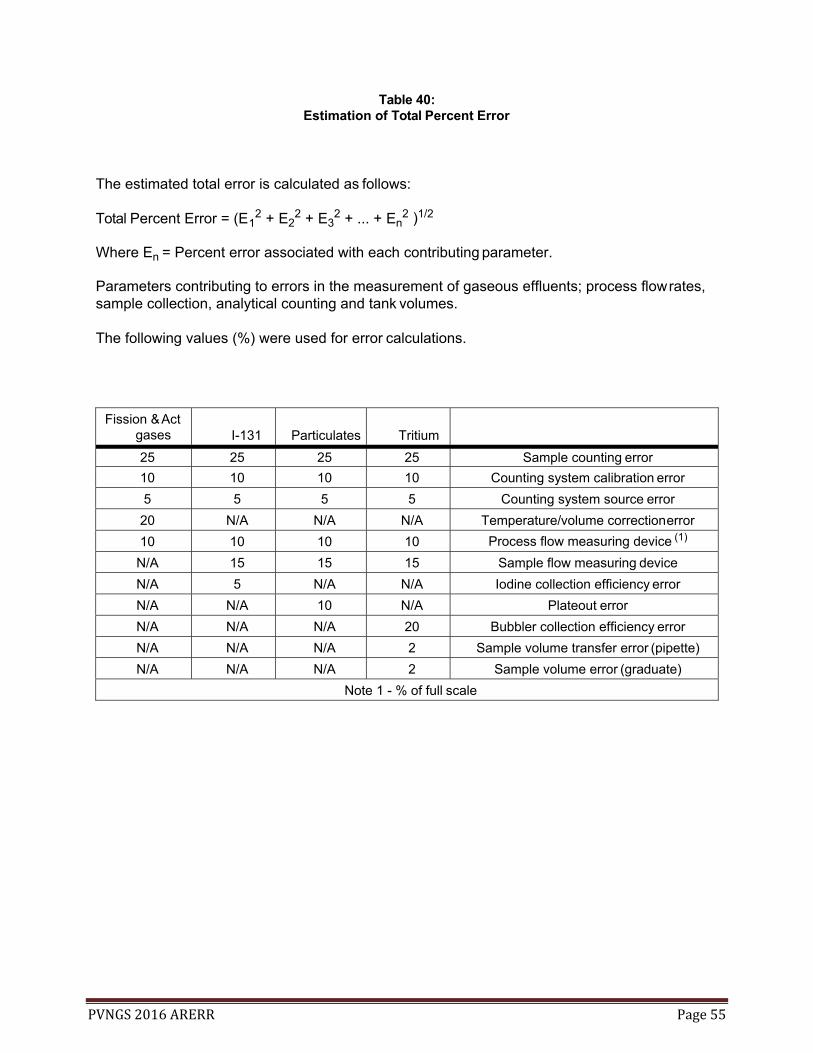
PVNGS 2016 ARERR Page 55
1
Table 40: Estimation of Total Percent Error
The estimated total error is calculated as follows:
Total Percent Error = (E 2 + E22 + E3
2 + ... + En2 )1/2
Where En = Percent error associated with each contributing parameter.
Parameters contributing to errors in the measurement of gaseous effluents; process flow rates, sample collection, analytical counting and tank volumes.
The following values (%) were used for error calculations.
Fission & Act gases
I-131
Particulates
Tritium
25 25 25 25 Sample counting error
10 10 10 10 Counting system calibration error
5 5 5 5 Counting system source error
20 N/A N/A N/A Temperature/volume correction error
10 10 10 10 Process flow measuring device (1)
N/A 15 15 15 Sample flow measuring device
N/A 5 N/A N/A Iodine collection efficiency error
N/A N/A 10 N/A Plateout error
N/A N/A N/A 20 Bubbler collection efficiency error
N/A N/A N/A 2 Sample volume transfer error (pipette)
N/A N/A N/A 2 Sample volume error (graduate)
Note 1 - % of full scale

PVNGS 2016 ARERR Page 56
Table 41: Effluent Monitoring Instrumentation Out Of Service Greater Than 30 Days
Unit Instrument Date span of inoperability
Cause of inoperability
Explanation
2 Unit 2 Fuel Building
Ventilation Flow transmitter
2JHFBFT0093**IXMITR
2/11/2016 through
4/14/2016
Condition Report 16-02244 documents the flow transmitter failing its acceptance criteria for FUNCTIONALITY
due to low flow indication.
Condition Report 16-03957 determined that a ventilation inspection panel was found
open, however, it took greater than 30 days to find and fix the
problem.

PVNGS 2016 ARERR Page 57
Table 42: Solid Waste Summary
A. Solid Waste Shipped Offsite For Burial Or Disposal (not irradiated fuel)
1.0 Type of Waste Unit Jan-Dec 2016 estimated total
error %
1.a. Spent resin, filters, sludges, evaporator bottoms, etc.
m3 9.25E+01 2.50E+01
Ci 2.12E+02 2.50E+01
1.b. Dry compressible waste, contaminated equipment, etc
m3 5.87E+02 2.50E+01 Ci 1.19E+01 2.50E+01
1.c. Irradiated components, control rods, etc.
m3 3.56E-01 2.50E+01 Ci 6.05E+00 2.50E+01
1.d. Other (Oil) m3 5.36E+00 2.50E+01 Ci 8.12E-07 2.50E+01

PVNGS 2016 ARERR Page 58
2.0 Estimate of major nuclide composition 2.a. Spent resin, filters, sludge, evaporator bottoms, etc.
Nuclide Name
Percent Abundance
Curies Estimated Total
Error %
Ni-63 5.24E+01 1.11E+02 2.50E+01
Fe-55 1.76E+01 3.72E+01 2.50E+01 Co-60 1.28E+01 2.71E+01 2.50E+01 Co-58 6.82E+00 1.44E+01 2.50E+01 Cs-137 3.11E+00 6.58E+00 2.50E+01 C-14 2.19E+00 4.64E+00 2.50E+01
Mn-54 1.44E+00 3.06E+00 2.50E+01 Sb-125 1.40E+00 2.96E+00 2.50E+01
H-3 1.33E+00 2.81E+00 2.50E+01 Co-57 6.21E-01 1.31E+00 2.50E+01 Ni-59 6.74E-02 1.43E-01 2.50E+01 Sr-90 5.56E-02 1.18E-01 2.50E+01 Tc-99 5.25E-02 1.11E-01 2.50E+01
Ce-144 4.87E-02 1.03E-01 2.50E+01 Pu-241 1.74E-02 3.68E-02 2.50E+01
Ag-110m 1.68E-02 3.57E-02 2.50E+01 Cs-134 1.44E-02 3.05E-02 2.50E+01 Zr-95 1.32E-02 2.79E-02 2.50E+01 I-129 1.21E-02 2.57E-02 2.50E+01 Cr-51 8.18E-03 1.73E-02 2.50E+01 Zn-65 7.61E-03 1.61E-02 2.50E+01 Nb-95 7.21E-03 1.53E-02 2.50E+01 Sn-113 3.06E-03 6.48E-03 2.50E+01 Sb-124 2.82E-03 5.96E-03 2.50E+01 Am-241 1.22E-03 2.58E-03 2.50E+01 Pu-238 7.64E-04 1.62E-03 2.50E+01 Cm-243 6.56E-04 1.39E-03 2.50E+01 Pu-239 4.91E-04 1.04E-03 2.50E+01 Fe-59 4.33E-04 9.17E-04 2.50E+01 Sr-89 2.41E-04 5.11E-04 2.50E+01
Am-243 5.62E-05 1.19E-04 2.50E+01 Cm-242 2.11E-05 4.47E-05 2.50E+01 Te-123m 7.65E-06 1.62E-05 2.50E+01
Pu-242 6.89E-06 1.46E-05 2.50E+01
Be-7 4.16E-11 8.81E-11 2.50E+01 Hf-181 8.41E-18 1.78E-17 2.50E+01 Ru-103 2.99E-27 6.32E-27 2.50E+01 Ce-141 5.48E-30 1.16E-29 2.50E+01
Total 2.12E+02

PVNGS 2016 ARERR Page 59
2.b. Dry compressible waste, contaminated equip, etc.
Nuclide Name
Percent Abundance Curies Estimated Total Error
% Cr-51 4.87E+01 5.82E+00 2.50E+01
Co-58 1.41E+01 1.69E+00 2.50E+01 Nb-95 1.25E+01 1.50E+00 2.50E+01 Zr-95 1.07E+01 1.27E+00 2.50E+01 Co-60 7.57E+00 9.05E-01 2.50E+01 Fe-55 2.04E+00 2.44E-01 2.50E+01 Mn-54 1.52E+00 1.82E-01 2.50E+01 Fe-59 7.88E-01 9.42E-02 2.50E+01 Ni-63 4.70E-01 5.62E-02 2.50E+01 H-3 2.90E-01 3.47E-02 2.50E+01
Sn-113 2.25E-01 2.69E-02 2.50E+01 Sb-125 1.84E-01 2.20E-02 2.50E+01 Zn-65 1.67E-01 1.99E-02 2.50E+01 Ce-144 1.56E-01 1.86E-02 2.50E+01 C-14 1.45E-01 1.73E-02 2.50E+01
Hf-181 9.76E-02 1.17E-02 2.50E+01 Te-
123m 6.54E-02 7.82E-03 2.50E+01
Sb-124 6.05E-02 7.23E-03 2.50E+01 Co-57 5.36E-02 6.40E-03 2.50E+01 Cs-137 3.84E-02 4.59E-03 2.50E+01 Tc-99 3.53E-02 4.22E-03 2.50E+01 Sr-90 8.52E-03 1.02E-03 2.50E+01 I-129 7.06E-03 8.44E-04 2.50E+01
Cm-242 2.16E-04 2.58E-05 2.50E+01 Pu-239 8.84E-05 1.06E-05 2.50E+01 Am-241 7.03E-05 8.40E-06 2.50E+01 Sc-46 6.53E-05 7.80E-06 2.50E+01
Cm-243 5.98E-05 7.14E-06 2.50E+01 Sr-89 1.58E-05 1.89E-06 2.50E+01
Pu-241 1.73E-06 2.07E-07 2.50E+01 Pu-238 1.82E-08 2.18E-09 2.50E+01
1.00E+02 1.19E+01

PVNGS 2016 ARERR Page 60
2.c. Irradiated components, control rods, etc.
Nuclide Name
Percent Abundance
Curies Estimated Total Error
% Co-60 7.14E+01 4.32E+00 2.50E+01
Fe-55 1.75E+01 1.06E+00 2.50E+01 Ni-63 9.50E+00 5.75E-01 2.50E+01 Cr-51 4.69E-01 2.84E-02 2.50E+01 Co-58 4.26E-01 2.58E-02 2.50E+01 Zr-95 3.01E-01 1.82E-02 2.50E+01 Nb-95 1.80E-01 1.09E-02 2.50E+01 Mn-54 8.28E-02 5.01E-03 2.50E+01 Ni-59 6.21E-02 3.76E-03 2.50E+01 H-3 2.15E-02 1.30E-03 2.50E+01 C-14 2.08E-02 1.26E-03 2.50E+01 Fe-59 1.56E-02 9.44E-04 2.50E+01
Sb-125 1.07E-02 6.47E-04 2.50E+01 Sn-113 8.99E-03 5.44E-04 2.50E+01 Zn-65 8.42E-03 5.10E-04 2.50E+01 Ce-144 7.14E-03 4.32E-04 2.50E+01 Co-57 2.73E-03 1.65E-04 2.50E+01
Te-123m 2.66E-03 1.61E-04 2.50E+01 Cs-137 2.21E-03 1.34E-04 2.50E+01 Hf-181 1.82E-03 1.10E-04 2.50E+01 Sb-124 1.62E-03 9.80E-05 2.50E+01 Nb-94 1.05E-03 6.35E-05 2.50E+01 Sr-90 5.24E-04 3.17E-05 2.50E+01 I-129 9.71E-05 5.88E-06 2.50E+01 Tc-99 6.31E-05 3.82E-06 2.50E+01
Cm-242 9.90E-06 5.99E-07 2.50E+01 Pu-239 5.48E-06 3.32E-07 2.50E+01 Am-241 4.34E-06 2.63E-07 2.50E+01 Cm-243 3.68E-06 2.23E-07 2.50E+01 Ta-182 2.73E-11 1.65E-12 2.50E+01
Total 6.05E+00

PVNGS 2016 ARERR Page 61
2.d. Other (Soil/Oil)
Nuclide Name
Percent Abundance
Curies Estimated
Total Error %
H-3 6.70E+01 7.93E-04 2.50E+01
Tc-99 2.43E+01 2.88E-04 2.50E+01C-14 8.53E+00 1.01E-04 2.50E+01I-129 1.01E-01 1.19E-06 2.50E+01
Cs-137 2.95E-02 3.49E-07 2.50E+01Sb-125 2.95E-02 3.49E-07 2.50E+01Co-60 9.63E-03 1.14E-07 2.50E+01
Total 1.18E-03
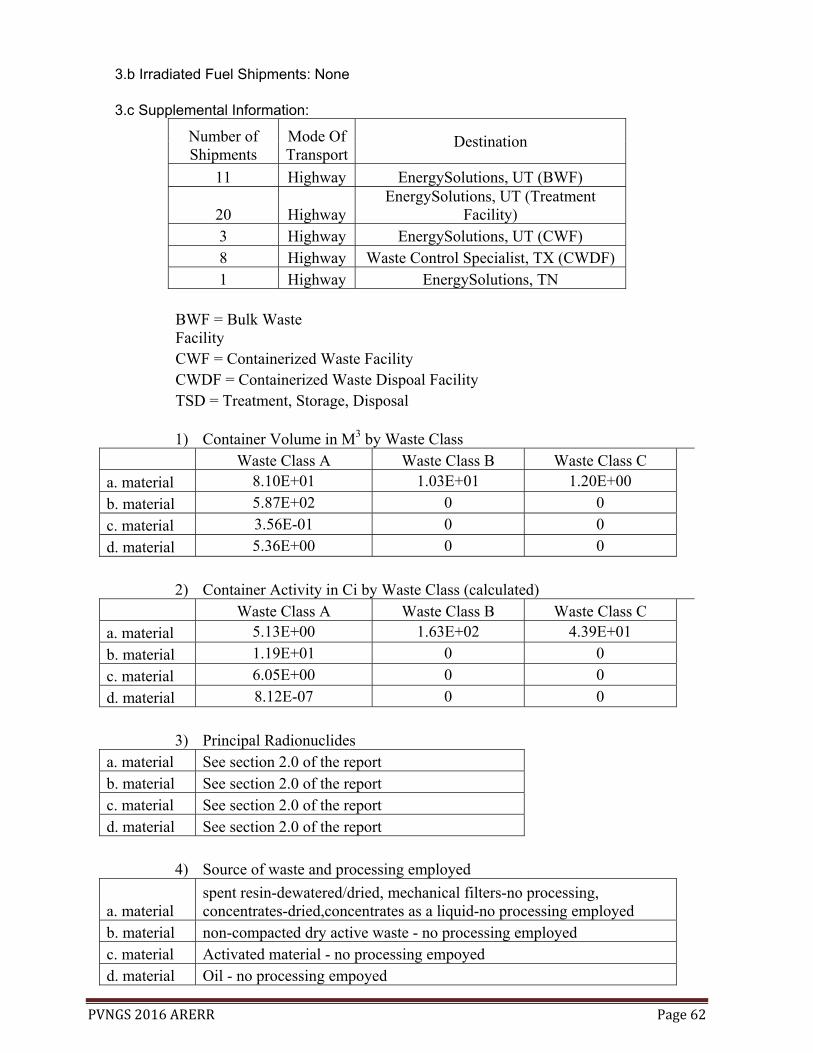
PVNGS 2016 ARERR Page 62
3.b Irradiated Fuel Shipments: None
3.c Supplemental Information:
Number of Shipments
Mode Of Transport
Destination
11 Highway EnergySolutions, UT (BWF)
20 Highway EnergySolutions, UT (Treatment
Facility) 3 Highway EnergySolutions, UT (CWF) 8 Highway Waste Control Specialist, TX (CWDF) 1 Highway EnergySolutions, TN
BWF = Bulk Waste Facility CWF = Containerized Waste Facility CWDF = Containerized Waste Dispoal Facility TSD = Treatment, Storage, Disposal
1) Container Volume in M3 by Waste Class Waste Class A Waste Class B Waste Class C a. material 8.10E+01 1.03E+01 1.20E+00
b. material 5.87E+02 0 0
c. material 3.56E-01 0 0
d. material 5.36E+00 0 0
2) Container Activity in Ci by Waste Class (calculated) Waste Class A Waste Class B Waste Class C a. material 5.13E+00 1.63E+02 4.39E+01
b. material 1.19E+01 0 0
c. material 6.05E+00 0 0
d. material 8.12E-07 0 0
3) Principal Radionuclides a. material See section 2.0 of the report b. material See section 2.0 of the report c. material See section 2.0 of the report d. material See section 2.0 of the report
4) Source of waste and processing employed
a. material spent resin-dewatered/dried, mechanical filters-no processing, concentrates-dried,concentrates as a liquid-no processing employed
b. material non-compacted dry active waste - no processing employed c. material Activated material - no processing empoyed d. material Oil - no processing empoyed

PVNGS 2016 ARERR Page 63
5) Type of Container
a. material
(1) Metal Tank or Liner transported as LSA-I, (10) Type A transportation casks transported as LSA-I, (12) Type A transportation casks transported as LSA-II, (4)Type A tranportation casks transported as Type A
b. material (20) 20' sea land containers transported as LSA-I, (3) Type A tranportation casks transported as Type A
c. material (1) Type A transportation casks transported as LSA-I
d. material (1) Type A tranportation casks transported as Exempt Quantity
6) Solidification agent or absorbent a. material No solidification agents or absorbents used to process material b. material No solidification agents or absorbents used to process material c. material No solidification agents or absorbents used to process material d. material No solidification agents or absorbents used to process material

PVNGS 2016 ARERR Page 61
APPENDIX B
METEOROLOGY
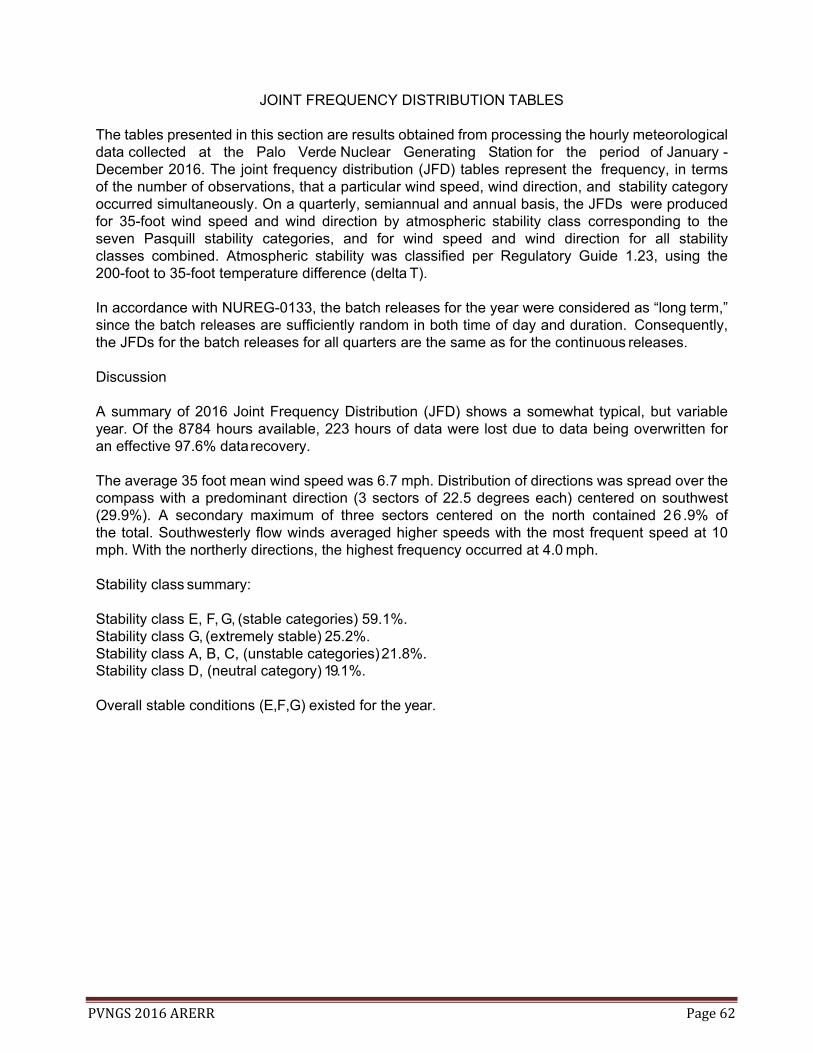
PVNGS 2016 ARERR Page 62
JOINT FREQUENCY DISTRIBUTION TABLES The tables presented in this section are results obtained from processing the hourly meteorological data collected at the Palo Verde Nuclear Generating Station for the period of January - December 2016. The joint frequency distribution (JFD) tables represent the frequency, in terms of the number of observations, that a particular wind speed, wind direction, and stability category occurred simultaneously. On a quarterly, semiannual and annual basis, the JFDs were produced for 35-foot wind speed and wind direction by atmospheric stability class corresponding to the seven Pasquill stability categories, and for wind speed and wind direction for all stability classes combined. Atmospheric stability was classified per Regulatory Guide 1.23, using the 200-foot to 35-foot temperature difference (delta T).
In accordance with NUREG-0133, the batch releases for the year were considered as “long term,” since the batch releases are sufficiently random in both time of day and duration. Consequently, the JFDs for the batch releases for all quarters are the same as for the continuous releases.
Discussion
A summary of 2016 Joint Frequency Distribution (JFD) shows a somewhat typical, but variable year. Of the 8784 hours available, 223 hours of data were lost due to data being overwritten for an effective 97.6% data recovery.
The average 35 foot mean wind speed was 6.7 mph. Distribution of directions was spread over the compass with a predominant direction (3 sectors of 22.5 degrees each) centered on southwest (29.9%). A secondary maximum of three sectors centered on the north contained 26 .9% of the total. Southwesterly flow winds averaged higher speeds with the most frequent speed at 10 mph. With the northerly directions, the highest frequency occurred at 4.0 mph.
Stability class summary:
Stability class E, F, G, (stable categories) 59.1%. Stability class G, (extremely stable) 25.2%. Stability class A, B, C, (unstable categories) 21.8%. Stability class D, (neutral category) 19.1%.
Overall stable conditions (E,F,G) existed for the year.

PVNGS 2016 ARERR Page 63
ARIZONA PUBLIC SERVICE CO. - PALO VERDE NUCLEAR GENERATING STATION JOINT FREQUENCY DISTRIBUTION FOR THE PERIOD 1/01/2016 TO 3/31/2016 *** 1ST QRTR *** STABILITY CLASS A STABILITY BASED ON: DELTA T BETWEEN 200.0 AND 35.0 FEET WIND MEASURED AT: 35.0 FEET WIND THRESHOLD AT: .75 MPH JOINT FREQUENCY DISTRIBUTION OF WIND SPEED AND DIRECTION IN HOURS AT 35.00 FEET SPEED (MPH) N NNE NE ENE E ESE SE SSE S SSW SW WSW W WNW NW NNW TOTAL ___________ _____ CALM 0 .76- 1.50 0 0 0 0 0 0 0 0 0 0 0 0 0 0 0 0 0 1.51- 2.50 0 0 0 0 0 0 0 0 0 0 0 0 0 0 0 0 0 2.51- 3.50 0 0 0 0 0 0 0 0 0 0 0 0 0 0 0 0 0 3.51- 4.50 0 0 0 0 0 0 0 0 0 0 0 0 0 0 0 0 0 4.51- 5.50 0 0 0 0 0 0 0 0 0 0 0 0 0 0 0 0 0 5.51- 6.50 0 0 0 0 0 0 0 0 0 1 0 0 0 0 0 0 1 6.51- 8.50 0 0 0 0 0 2 0 2 2 0 1 3 1 0 0 0 11 8.51-11.50 1 0 0 0 0 1 0 0 0 1 4 1 5 4 3 1 21 11.51-14.50 0 0 0 0 0 0 0 0 0 1 6 5 1 0 2 1 16 14.51-20.50 0 0 0 0 0 0 0 0 0 4 0 2 0 3 0 3 12 >20.50 0 0 0 0 0 0 0 0 0 1 0 0 0 0 0 0 1 ___________ ______ ______ ______ ______ ______ ______ ______ ______ ______ ______ ______ ______ ______ ______ ______ ______ ______ TOTAL 1 0 0 0 0 3 0 2 2 8 11 11 7 7 5 5 62 STABILITY CLASS B SPEED (MPH) N NNE NE ENE E ESE SE SSE S SSW SW WSW W WNW NW NNW TOTAL ___________ _____ CALM 0 .76- 1.50 0 0 0 0 0 0 0 0 0 0 0 0 0 0 0 0 0 1.51- 2.50 0 0 0 0 0 0 0 0 0 0 0 0 0 0 0 0 0 2.51- 3.50 0 0 0 0 0 0 0 0 0 0 0 0 0 0 0 0 0 3.51- 4.50 0 0 0 0 0 0 0 0 1 0 0 0 0 0 0 0 1 4.51- 5.50 0 1 0 1 0 0 0 1 0 1 0 0 0 1 1 0 6 5.51- 6.50 0 1 0 0 0 0 0 1 4 1 3 2 1 0 0 0 13 6.51- 8.50 0 1 3 3 1 1 0 2 1 3 6 4 2 1 0 0 28 8.51-11.50 0 1 0 1 0 1 0 0 0 2 3 4 1 1 0 2 16 11.51-14.50 0 0 0 0 0 0 0 0 0 2 5 1 0 0 0 0 8 14.51-20.50 0 0 0 0 0 0 0 0 0 1 1 0 0 0 0 0 2 >20.50 0 0 0 0 0 0 0 0 0 1 0 0 0 0 0 0 1 ___________ ______ ______ ______ ______ ______ ______ ______ ______ ______ ______ ______ ______ ______ ______ ______ ______ ______ TOTAL 0 4 3 5 1 2 0 4 6 11 18 11 4 3 1 2 75 STABILITY CLASS C SPEED (MPH) N NNE NE ENE E ESE SE SSE S SSW SW WSW W WNW NW NNW TOTAL ___________ _____ CALM 0 .76- 1.50 0 0 0 0 0 0 0 0 0 0 0 0 0 0 0 0 0 1.51- 2.50 1 0 0 0 0 0 0 0 0 0 0 0 0 0 0 0 1 2.51- 3.50 0 0 0 0 0 0 0 0 0 0 0 1 0 0 0 0 1 3.51- 4.50 0 0 0 0 0 0 0 0 1 2 1 2 2 0 0 1 9 4.51- 5.50 1 0 1 3 3 0 1 2 6 4 2 0 1 0 0 3 27 5.51- 6.50 2 2 4 1 1 1 0 2 5 8 5 2 0 1 0 2 36 6.51- 8.50 0 3 4 2 4 2 2 0 4 3 3 2 0 1 0 1 31 8.51-11.50 0 0 4 1 1 1 0 0 2 1 0 0 0 0 0 0 10 11.51-14.50 0 0 0 0 0 0 0 0 0 1 3 0 1 0 0 0 5 14.51-20.50 0 0 0 0 0 0 0 0 0 1 2 0 0 1 0 0 4 >20.50 0 0 0 0 0 0 0 0 0 0 0 0 0 0 0 0 0 ___________ ______ ______ ______ ______ ______ ______ ______ ______ ______ ______ ______ ______ ______ ______ ______ ______ ______ TOTAL 4 5 13 7 9 4 3 4 18 20 16 7 4 3 0 7 124 ARIZONA PUBLIC SERVICE CO. - PALO VERDE NUCLEAR GENERATING STATION JOINT FREQUENCY DISTRIBUTION FOR THE PERIOD 1/01/2016 TO 3/31/2016 *** 1ST QRTR ***

PVNGS 2016 ARERR Page 64
STABILITY CLASS D STABILITY BASED ON: DELTA T BETWEEN 200.0 AND 35.0 FEET WIND MEASURED AT: 35.0 FEET WIND THRESHOLD AT: .75 MPH JOINT FREQUENCY DISTRIBUTION OF WIND SPEED AND DIRECTION IN HOURS AT 35.00 FEET SPEED (MPH) N NNE NE ENE E ESE SE SSE S SSW SW WSW W WNW NW NNW TOTAL ___________ _____ CALM 0 .76- 1.50 0 0 1 0 0 0 0 0 0 0 0 0 0 0 0 0 1 1.51- 2.50 1 1 2 0 0 0 2 3 2 5 5 2 2 0 1 2 28 2.51- 3.50 12 4 1 3 3 3 5 7 16 15 13 8 3 6 2 5 106 3.51- 4.50 5 5 7 5 0 1 2 3 13 18 11 4 5 1 6 3 89 4.51- 5.50 6 11 9 5 1 1 6 5 9 7 9 4 2 3 1 3 82 5.51- 6.50 2 3 8 3 0 1 0 2 3 9 5 5 0 1 2 1 45 6.51- 8.50 5 4 5 6 1 0 0 0 2 3 6 4 3 1 1 1 42 8.51-11.50 0 0 4 1 6 3 0 0 0 4 6 6 4 0 2 1 37 11.51-14.50 0 0 0 1 4 0 0 0 0 4 7 3 2 0 0 1 22 14.51-20.50 0 0 0 0 6 0 0 0 2 3 2 1 4 6 0 0 24 >20.50 0 0 0 0 0 0 0 0 0 3 0 0 0 0 0 0 3 ___________ ______ ______ ______ ______ ______ ______ ______ ______ ______ ______ ______ ______ ______ ______ ______ ______ ______ TOTAL 31 28 37 24 21 9 15 20 47 71 64 37 25 18 15 17 479 STABILITY CLASS E SPEED (MPH) N NNE NE ENE E ESE SE SSE S SSW SW WSW W WNW NW NNW TOTAL ___________ _____ CALM 0 .76- 1.50 0 0 0 0 1 0 0 0 0 0 1 1 0 0 2 0 5 1.51- 2.50 5 4 0 0 1 0 0 2 0 2 1 5 0 2 2 1 25 2.51- 3.50 3 2 1 1 0 0 0 0 0 5 4 7 5 5 6 1 40 3.51- 4.50 3 1 0 1 0 0 0 0 2 5 6 6 3 2 5 4 38 4.51- 5.50 3 3 1 1 1 0 0 0 7 9 4 2 1 1 2 3 38 5.51- 6.50 2 2 2 0 0 0 0 0 1 2 4 0 0 3 2 2 20 6.51- 8.50 1 3 1 1 0 1 0 1 3 7 7 6 8 3 2 1 45 8.51-11.50 2 2 1 3 0 3 1 0 0 4 7 4 6 4 1 1 39 11.51-14.50 0 1 0 4 2 0 0 0 0 3 5 2 1 13 1 0 32 14.51-20.50 0 0 0 0 13 0 0 0 1 2 8 3 3 4 0 0 34 >20.50 0 0 0 0 1 0 0 0 3 0 2 2 0 0 0 0 8 ___________ ______ ______ ______ ______ ______ ______ ______ ______ ______ ______ ______ ______ ______ ______ ______ ______ ______ TOTAL 19 18 6 11 19 4 1 3 17 39 49 38 27 37 23 13 324 STABILITY CLASS F SPEED (MPH) N NNE NE ENE E ESE SE SSE S SSW SW WSW W WNW NW NNW TOTAL ___________ _____ CALM 0 .76- 1.50 0 0 0 0 0 0 0 0 0 0 0 0 0 0 0 0 0 1.51- 2.50 4 2 0 0 0 0 0 1 1 1 3 3 2 5 3 3 28 2.51- 3.50 4 1 1 3 2 0 0 1 0 2 5 2 5 4 13 7 50 3.51- 4.50 4 2 1 0 0 0 0 0 1 4 5 3 3 2 10 10 45 4.51- 5.50 4 0 1 0 0 0 1 0 1 5 2 4 3 1 5 4 31 5.51- 6.50 1 4 2 0 0 0 0 0 0 6 4 3 4 3 4 5 36 6.51- 8.50 2 3 1 2 1 0 0 2 0 6 10 10 2 5 5 7 56 8.51-11.50 0 1 0 0 0 0 0 0 0 11 4 1 1 9 4 4 35 11.51-14.50 0 0 0 0 0 0 0 0 0 1 0 0 1 0 0 2 4 14.51-20.50 0 0 0 0 1 0 0 0 0 0 0 0 0 0 0 0 1 >20.50 0 0 0 0 0 0 0 0 0 0 0 0 0 0 0 0 0 ___________ ______ ______ ______ ______ ______ ______ ______ ______ ______ ______ ______ ______ ______ ______ ______ ______ ______ TOTAL 19 13 6 5 4 0 1 4 3 36 33 26 21 29 44 42 286 ARIZONA PUBLIC SERVICE CO. - PALO VERDE NUCLEAR GENERATING STATION JOINT FREQUENCY DISTRIBUTION FOR THE PERIOD 1/01/2016 TO 3/31/2016 *** 1ST QRTR *** STABILITY CLASS G STABILITY BASED ON: DELTA T BETWEEN 200.0 AND 35.0 FEET WIND MEASURED AT: 35.0 FEET WIND THRESHOLD AT: .75 MPH JOINT FREQUENCY DISTRIBUTION OF WIND SPEED AND DIRECTION IN HOURS AT 35.00 FEET SPEED (MPH) N NNE NE ENE E ESE SE SSE S SSW SW WSW W WNW NW NNW TOTAL ___________ _____ CALM 0 .76- 1.50 0 1 0 0 0 0 0 0 0 0 0 0 0 1 1 0 3 1.51- 2.50 11 3 3 1 2 0 0 0 0 2 1 4 6 7 16 18 74 2.51- 3.50 49 11 8 5 2 3 1 2 2 5 3 1 8 19 34 48 201 3.51- 4.50 68 13 3 3 1 1 1 2 1 2 1 2 7 12 26 71 214 4.51- 5.50 66 14 2 2 0 1 0 0 1 1 3 3 2 5 17 38 155 5.51- 6.50 36 19 3 1 0 0 0 0 0 2 1 1 2 5 5 12 87 6.51- 8.50 42 10 1 0 0 0 0 0 1 2 1 1 1 0 1 12 72 8.51-11.50 13 10 1 0 0 0 0 0 0 2 0 0 0 0 0 2 28 11.51-14.50 0 0 0 0 0 0 0 0 0 0 0 0 0 0 0 0 0 14.51-20.50 0 0 0 0 0 0 0 0 0 0 0 0 0 0 0 0 0 >20.50 0 0 0 0 0 0 0 0 0 0 0 0 0 0 0 0 0 ___________ ______ ______ ______ ______ ______ ______ ______ ______ ______ ______ ______ ______ ______ ______ ______ ______ ______ TOTAL 285 81 21 12 5 5 2 4 5 16 10 12 26 49 100 201 834

PVNGS 2016 ARERR Page 65
STABILITY CLASS ALL SPEED (MPH) N NNE NE ENE E ESE SE SSE S SSW SW WSW W WNW NW NNW TOTAL ___________ _____ CALM 0 .76- 1.50 0 1 1 0 1 0 0 0 0 0 1 1 0 1 3 0 9 1.51- 2.50 22 10 5 1 3 0 2 6 3 10 10 14 10 14 22 24 156 2.51- 3.50 68 18 11 12 7 6 6 10 18 27 25 19 21 34 55 61 398 3.51- 4.50 80 21 11 9 1 2 3 5 19 31 24 17 20 17 47 89 396 4.51- 5.50 80 29 14 12 5 2 8 8 24 27 20 13 9 11 26 51 339 5.51- 6.50 43 31 19 5 1 2 0 5 13 29 22 13 7 13 13 22 238 6.51- 8.50 50 24 15 14 7 6 2 7 13 24 34 30 17 11 9 22 285 8.51-11.50 16 14 10 6 7 9 1 0 2 25 24 16 17 18 10 11 186 11.51-14.50 0 1 0 5 6 0 0 0 0 12 26 11 6 13 3 4 87 14.51-20.50 0 0 0 0 20 0 0 0 3 11 13 6 7 14 0 3 77 >20.50 0 0 0 0 1 0 0 0 3 5 2 2 0 0 0 0 13 ___________ ______ ______ ______ ______ ______ ______ ______ ______ ______ ______ ______ ______ ______ ______ ______ ______ ______ TOTAL 359 149 86 64 59 27 22 41 98 201 201 142 114 146 188 287 2184 TOTAL NUMBER OF OBSERVATIONS: 2184 TOTAL NUMBER OF VALID OBSERVATIONS: 2184 TOTAL NUMBER OF MISSING OBSERVATIONS: 0 PERCENT DATA RECOVERY FOR THIS PERIOD: 100.0 % MEAN WIND SPEED FOR THIS PERIOD: 5.9 MPH TOTAL NUMBER OF OBSERVATIONS WITH BACKUP DATA: 0 PERCENTAGE OCCURRENCE OF STABILITY CLASSES A B C D E F G 2.84 3.43 5.68 21.93 14.84 13.10 38.19 DISTRIBUTION OF WIND DIRECTION VS STABILITY N NNE NE ENE E ESE SE SSE S SSW SW WSW W WNW NW NNW CALM A 1 0 0 0 0 3 0 2 2 8 11 11 7 7 5 5 0 B 0 4 3 5 1 2 0 4 6 11 18 11 4 3 1 2 0 C 4 5 13 7 9 4 3 4 18 20 16 7 4 3 0 7 0 D 31 28 37 24 21 9 15 20 47 71 64 37 25 18 15 17 0 E 19 18 6 11 19 4 1 3 17 39 49 38 27 37 23 13 0 F 19 13 6 5 4 0 1 4 3 36 33 26 21 29 44 42 0 G 285 81 21 12 5 5 2 4 5 16 10 12 26 49 100 201 0 TOTAL 359 149 86 64 59 27 22 41 98 201 201 142 114 146 188 287 0 ARIZONA PUBLIC SERVICE CO. - PALO VERDE NUCLEAR GENERATING STATION JOINT FREQUENCY DISTRIBUTION FOR THE PERIOD 4/01/2016 TO 6/30/2016 *** 2ND QRTR *** STABILITY CLASS A STABILITY BASED ON: DELTA T BETWEEN 200.0 AND 35.0 FEET WIND MEASURED AT: 35.0 FEET WIND THRESHOLD AT: .75 MPH JOINT FREQUENCY DISTRIBUTION OF WIND SPEED AND DIRECTION IN HOURS AT 35.00 FEET SPEED (MPH) N NNE NE ENE E ESE SE SSE S SSW SW WSW W WNW NW NNW TOTAL ___________ _____ CALM 0 .76- 1.50 0 0 0 0 0 0 0 0 0 0 0 0 0 0 0 0 0 1.51- 2.50 0 0 0 0 0 0 0 0 0 0 0 0 0 0 0 0 0 2.51- 3.50 0 0 0 0 0 0 0 0 0 0 0 0 0 0 0 0 0 3.51- 4.50 0 0 0 0 0 0 0 0 0 0 0 0 0 0 0 0 0 4.51- 5.50 0 0 0 1 1 1 2 1 3 0 1 0 0 0 0 0 10 5.51- 6.50 0 1 0 0 2 0 1 6 13 7 4 0 0 0 0 0 34 6.51- 8.50 0 0 1 4 3 2 6 8 25 10 18 4 3 3 1 0 88 8.51-11.50 0 1 0 4 8 9 0 4 8 18 21 9 5 0 2 1 90 11.51-14.50 1 1 5 1 1 1 4 0 7 13 16 5 3 3 4 2 67 14.51-20.50 0 0 5 3 2 2 0 1 5 8 3 0 2 1 0 1 33 >20.50 0 0 1 0 0 0 0 0 0 1 6 1 0 1 1 0 11 ___________ ______ ______ ______ ______ ______ ______ ______ ______ ______ ______ ______ ______ ______ ______ ______ ______ ______ TOTAL 1 3 12 13 17 15 13 20 61 57 69 19 13 8 8 4 333 STABILITY CLASS B SPEED (MPH) N NNE NE ENE E ESE SE SSE S SSW SW WSW W WNW NW NNW TOTAL ___________ _____ CALM 0 .76- 1.50 0 0 0 0 0 0 0 0 0 0 0 0 0 0 0 0 0 1.51- 2.50 0 0 0 0 0 0 0 0 0 0 0 0 0 0 0 0 0 2.51- 3.50 0 0 0 0 0 0 0 0 0 0 0 0 0 0 0 0 0 3.51- 4.50 0 0 0 0 0 0 0 0 0 0 1 0 0 0 0 0 1 4.51- 5.50 0 0 1 2 1 1 1 4 12 0 2 1 1 0 0 1 27 5.51- 6.50 1 1 0 2 1 1 2 3 17 9 4 5 1 2 2 0 51 6.51- 8.50 0 1 2 2 2 5 1 3 9 10 8 4 4 1 0 0 52 8.51-11.50 0 0 2 3 3 2 3 2 2 10 9 2 2 0 0 0 40 11.51-14.50 0 1 0 0 1 3 0 1 0 4 4 0 0 2 0 0 16 14.51-20.50 0 0 2 0 1 0 0 0 0 3 3 1 0 0 0 0 10 >20.50 0 0 0 0 0 1 0 0 0 1 0 0 0 1 0 0 3 ___________ ______ ______ ______ ______ ______ ______ ______ ______ ______ ______ ______ ______ ______ ______ ______ ______ ______ TOTAL 1 3 7 9 9 13 7 13 40 37 31 13 8 6 2 1 200
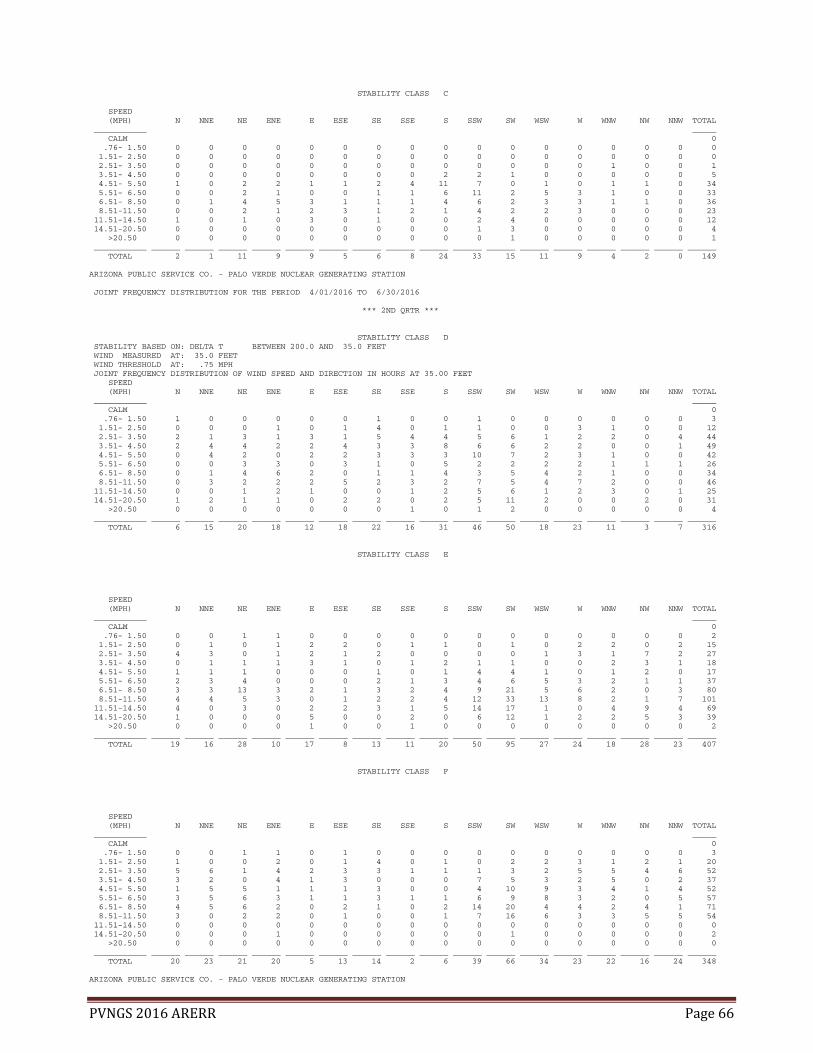
PVNGS 2016 ARERR Page 66
STABILITY CLASS C SPEED (MPH) N NNE NE ENE E ESE SE SSE S SSW SW WSW W WNW NW NNW TOTAL ___________ _____ CALM 0 .76- 1.50 0 0 0 0 0 0 0 0 0 0 0 0 0 0 0 0 0 1.51- 2.50 0 0 0 0 0 0 0 0 0 0 0 0 0 0 0 0 0 2.51- 3.50 0 0 0 0 0 0 0 0 0 0 0 0 0 1 0 0 1 3.51- 4.50 0 0 0 0 0 0 0 0 2 2 1 0 0 0 0 0 5 4.51- 5.50 1 0 2 2 1 1 2 4 11 7 0 1 0 1 1 0 34 5.51- 6.50 0 0 2 1 0 0 1 1 6 11 2 5 3 1 0 0 33 6.51- 8.50 0 1 4 5 3 1 1 1 4 6 2 3 3 1 1 0 36 8.51-11.50 0 0 2 1 2 3 1 2 1 4 2 2 3 0 0 0 23 11.51-14.50 1 0 1 0 3 0 1 0 0 2 4 0 0 0 0 0 12 14.51-20.50 0 0 0 0 0 0 0 0 0 1 3 0 0 0 0 0 4 >20.50 0 0 0 0 0 0 0 0 0 0 1 0 0 0 0 0 1 ___________ ______ ______ ______ ______ ______ ______ ______ ______ ______ ______ ______ ______ ______ ______ ______ ______ ______ TOTAL 2 1 11 9 9 5 6 8 24 33 15 11 9 4 2 0 149 ARIZONA PUBLIC SERVICE CO. - PALO VERDE NUCLEAR GENERATING STATION JOINT FREQUENCY DISTRIBUTION FOR THE PERIOD 4/01/2016 TO 6/30/2016 *** 2ND QRTR *** STABILITY CLASS D STABILITY BASED ON: DELTA T BETWEEN 200.0 AND 35.0 FEET WIND MEASURED AT: 35.0 FEET WIND THRESHOLD AT: .75 MPH JOINT FREQUENCY DISTRIBUTION OF WIND SPEED AND DIRECTION IN HOURS AT 35.00 FEET SPEED (MPH) N NNE NE ENE E ESE SE SSE S SSW SW WSW W WNW NW NNW TOTAL ___________ _____ CALM 0 .76- 1.50 1 0 0 0 0 0 1 0 0 1 0 0 0 0 0 0 3 1.51- 2.50 0 0 0 1 0 1 4 0 1 1 0 0 3 1 0 0 12 2.51- 3.50 2 1 3 1 3 1 5 4 4 5 6 1 2 2 0 4 44 3.51- 4.50 2 4 4 2 2 4 3 3 8 6 6 2 2 0 0 1 49 4.51- 5.50 0 4 2 0 2 2 3 3 3 10 7 2 3 1 0 0 42 5.51- 6.50 0 0 3 3 0 3 1 0 5 2 2 2 2 1 1 1 26 6.51- 8.50 0 1 4 6 2 0 1 1 4 3 5 4 2 1 0 0 34 8.51-11.50 0 3 2 2 2 5 2 3 2 7 5 4 7 2 0 0 46 11.51-14.50 0 0 1 2 1 0 0 1 2 5 6 1 2 3 0 1 25 14.51-20.50 1 2 1 1 0 2 2 0 2 5 11 2 0 0 2 0 31 >20.50 0 0 0 0 0 0 0 1 0 1 2 0 0 0 0 0 4 ___________ ______ ______ ______ ______ ______ ______ ______ ______ ______ ______ ______ ______ ______ ______ ______ ______ ______ TOTAL 6 15 20 18 12 18 22 16 31 46 50 18 23 11 3 7 316 STABILITY CLASS E SPEED (MPH) N NNE NE ENE E ESE SE SSE S SSW SW WSW W WNW NW NNW TOTAL ___________ _____ CALM 0 .76- 1.50 0 0 1 1 0 0 0 0 0 0 0 0 0 0 0 0 2 1.51- 2.50 0 1 0 1 2 2 0 1 1 0 1 0 2 2 0 2 15 2.51- 3.50 4 3 0 1 2 1 2 0 0 0 0 1 3 1 7 2 27 3.51- 4.50 0 1 1 1 3 1 0 1 2 1 1 0 0 2 3 1 18 4.51- 5.50 1 1 1 0 0 0 1 0 1 4 4 1 0 1 2 0 17 5.51- 6.50 2 3 4 0 0 0 2 1 3 4 6 5 3 2 1 1 37 6.51- 8.50 3 3 13 3 2 1 3 2 4 9 21 5 6 2 0 3 80 8.51-11.50 4 4 5 3 0 1 2 2 4 12 33 13 8 2 1 7 101 11.51-14.50 4 0 3 0 2 2 3 1 5 14 17 1 0 4 9 4 69 14.51-20.50 1 0 0 0 5 0 0 2 0 6 12 1 2 2 5 3 39 >20.50 0 0 0 0 1 0 0 1 0 0 0 0 0 0 0 0 2 ___________ ______ ______ ______ ______ ______ ______ ______ ______ ______ ______ ______ ______ ______ ______ ______ ______ ______ TOTAL 19 16 28 10 17 8 13 11 20 50 95 27 24 18 28 23 407 STABILITY CLASS F SPEED (MPH) N NNE NE ENE E ESE SE SSE S SSW SW WSW W WNW NW NNW TOTAL ___________ _____ CALM 0 .76- 1.50 0 0 1 1 0 1 0 0 0 0 0 0 0 0 0 0 3 1.51- 2.50 1 0 0 2 0 1 4 0 1 0 2 2 3 1 2 1 20 2.51- 3.50 5 6 1 4 2 3 3 1 1 1 3 2 5 5 4 6 52 3.51- 4.50 3 2 0 4 1 3 0 0 0 7 5 3 2 5 0 2 37 4.51- 5.50 1 5 5 1 1 1 3 0 0 4 10 9 3 4 1 4 52 5.51- 6.50 3 5 6 3 1 1 3 1 1 6 9 8 3 2 0 5 57 6.51- 8.50 4 5 6 2 0 2 1 0 2 14 20 4 4 2 4 1 71 8.51-11.50 3 0 2 2 0 1 0 0 1 7 16 6 3 3 5 5 54 11.51-14.50 0 0 0 0 0 0 0 0 0 0 0 0 0 0 0 0 0 14.51-20.50 0 0 0 1 0 0 0 0 0 0 1 0 0 0 0 0 2 >20.50 0 0 0 0 0 0 0 0 0 0 0 0 0 0 0 0 0 ___________ ______ ______ ______ ______ ______ ______ ______ ______ ______ ______ ______ ______ ______ ______ ______ ______ ______ TOTAL 20 23 21 20 5 13 14 2 6 39 66 34 23 22 16 24 348 ARIZONA PUBLIC SERVICE CO. - PALO VERDE NUCLEAR GENERATING STATION

PVNGS 2016 ARERR Page 67
JOINT FREQUENCY DISTRIBUTION FOR THE PERIOD 4/01/2016 TO 6/30/2016 *** 2ND QRTR *** STABILITY CLASS G STABILITY BASED ON: DELTA T BETWEEN 200.0 AND 35.0 FEET WIND MEASURED AT: 35.0 FEET WIND THRESHOLD AT: .75 MPH JOINT FREQUENCY DISTRIBUTION OF WIND SPEED AND DIRECTION IN HOURS AT 35.00 FEET SPEED (MPH) N NNE NE ENE E ESE SE SSE S SSW SW WSW W WNW NW NNW TOTAL ___________ _____ CALM 0 .76- 1.50 0 0 0 0 0 0 1 0 0 0 0 0 0 0 1 0 2 1.51- 2.50 4 2 0 0 2 1 1 0 0 0 0 1 3 3 2 4 23 2.51- 3.50 21 1 1 3 3 7 4 2 0 0 3 1 0 9 7 8 70 3.51- 4.50 25 9 5 5 0 4 6 0 0 2 3 6 4 6 9 15 99 4.51- 5.50 29 10 2 2 1 4 7 0 0 0 3 1 1 1 4 10 75 5.51- 6.50 11 5 2 0 1 0 2 2 1 1 0 2 0 1 0 4 32 6.51- 8.50 4 2 2 2 1 0 1 1 0 1 0 1 1 0 0 4 20 8.51-11.50 3 1 0 1 0 0 0 0 0 0 0 0 0 0 1 0 6 11.51-14.50 0 0 0 0 0 1 0 0 0 0 0 0 0 0 0 0 1 14.51-20.50 0 0 0 0 0 0 0 0 0 0 0 0 0 0 0 0 0 >20.50 0 0 0 0 0 0 0 0 0 0 0 0 0 0 0 0 0 ___________ ______ ______ ______ ______ ______ ______ ______ ______ ______ ______ ______ ______ ______ ______ ______ ______ ______ TOTAL 97 30 12 13 8 17 22 5 1 4 9 12 9 20 24 45 328 STABILITY CLASS ALL SPEED (MPH) N NNE NE ENE E ESE SE SSE S SSW SW WSW W WNW NW NNW TOTAL ___________ _____ CALM 0 .76- 1.50 1 0 2 2 0 1 2 0 0 1 0 0 0 0 1 0 10 1.51- 2.50 5 3 0 4 4 5 9 1 3 1 3 3 11 7 4 7 70 2.51- 3.50 32 11 5 9 10 12 14 7 5 6 12 5 10 18 18 20 194 3.51- 4.50 30 16 10 12 6 12 9 4 12 18 17 11 8 13 12 19 209 4.51- 5.50 32 20 13 8 7 10 19 12 30 25 27 15 8 8 8 15 257 5.51- 6.50 17 15 17 9 5 5 12 14 46 40 27 27 12 9 4 11 270 6.51- 8.50 11 13 32 24 13 11 14 16 48 53 74 25 23 10 6 8 381 8.51-11.50 10 9 13 16 15 21 8 13 18 58 86 36 28 7 9 13 360 11.51-14.50 6 2 10 3 8 7 8 3 14 38 47 7 5 12 13 7 190 14.51-20.50 2 2 8 5 8 4 2 3 7 23 33 4 4 3 7 4 119 >20.50 0 0 1 0 1 1 0 2 0 3 9 1 0 2 1 0 21 ___________ ______ ______ ______ ______ ______ ______ ______ ______ ______ ______ ______ ______ ______ ______ ______ ______ ______ TOTAL 146 91 111 92 77 89 97 75 183 266 335 134 109 89 83 104 2081 TOTAL NUMBER OF OBSERVATIONS: 2088 TOTAL NUMBER OF VALID OBSERVATIONS: 2081 TOTAL NUMBER OF MISSING OBSERVATIONS: 7 PERCENT DATA RECOVERY FOR THIS PERIOD: 99.7 % MEAN WIND SPEED FOR THIS PERIOD: 7.6 MPH TOTAL NUMBER OF OBSERVATIONS WITH BACKUP DATA: 0 PERCENTAGE OCCURRENCE OF STABILITY CLASSES A B C D E F G 16.00 9.61 7.16 15.19 19.56 16.72 15.76 DISTRIBUTION OF WIND DIRECTION VS STABILITY N NNE NE ENE E ESE SE SSE S SSW SW WSW W WNW NW NNW CALM A 1 3 12 13 17 15 13 20 61 57 69 19 13 8 8 4 0 B 1 3 7 9 9 13 7 13 40 37 31 13 8 6 2 1 0 C 2 1 11 9 9 5 6 8 24 33 15 11 9 4 2 0 0 D 6 15 20 18 12 18 22 16 31 46 50 18 23 11 3 7 0 E 19 16 28 10 17 8 13 11 20 50 95 27 24 18 28 23 0 F 20 23 21 20 5 13 14 2 6 39 66 34 23 22 16 24 0 G 97 30 12 13 8 17 22 5 1 4 9 12 9 20 24 45 0 TOTAL 146 91 111 92 77 89 97 75 183 266 335 134 109 89 83 104 0 ARIZONA PUBLIC SERVICE CO. - PALO VERDE NUCLEAR GENERATING STATION JOINT FREQUENCY DISTRIBUTION FOR THE PERIOD 1/01/2016 TO 6/30/2016 *** 1ST SEMI *** STABILITY CLASS A STABILITY BASED ON: DELTA T BETWEEN 200.0 AND 35.0 FEET WIND MEASURED AT: 35.0 FEET WIND THRESHOLD AT: .75 MPH JOINT FREQUENCY DISTRIBUTION OF WIND SPEED AND DIRECTION IN HOURS AT 35.00 FEET SPEED (MPH) N NNE NE ENE E ESE SE SSE S SSW SW WSW W WNW NW NNW TOTAL ___________ _____ CALM 0 .76- 1.50 0 0 0 0 0 0 0 0 0 0 0 0 0 0 0 0 0 1.51- 2.50 0 0 0 0 0 0 0 0 0 0 0 0 0 0 0 0 0 2.51- 3.50 0 0 0 0 0 0 0 0 0 0 0 0 0 0 0 0 0 3.51- 4.50 0 0 0 0 0 0 0 0 0 0 0 0 0 0 0 0 0 4.51- 5.50 0 0 0 1 1 1 2 1 3 0 1 0 0 0 0 0 10 5.51- 6.50 0 1 0 0 2 0 1 6 13 8 4 0 0 0 0 0 35 6.51- 8.50 0 0 1 4 3 4 6 10 27 10 19 7 4 3 1 0 99 8.51-11.50 1 1 0 4 8 10 0 4 8 19 25 10 10 4 5 2 111 11.51-14.50 1 1 5 1 1 1 4 0 7 14 22 10 4 3 6 3 83 14.51-20.50 0 0 5 3 2 2 0 1 5 12 3 2 2 4 0 4 45 >20.50 0 0 1 0 0 0 0 0 0 2 6 1 0 1 1 0 12 ___________ ______ ______ ______ ______ ______ ______ ______ ______ ______ ______ ______ ______ ______ ______ ______ ______ ______ TOTAL 2 3 12 13 17 18 13 22 63 65 80 30 20 15 13 9 395

PVNGS 2016 ARERR Page 68
STABILITY CLASS B SPEED (MPH) N NNE NE ENE E ESE SE SSE S SSW SW WSW W WNW NW NNW TOTAL ___________ _____ CALM 0 .76- 1.50 0 0 0 0 0 0 0 0 0 0 0 0 0 0 0 0 0 1.51- 2.50 0 0 0 0 0 0 0 0 0 0 0 0 0 0 0 0 0 2.51- 3.50 0 0 0 0 0 0 0 0 0 0 0 0 0 0 0 0 0 3.51- 4.50 0 0 0 0 0 0 0 0 1 0 1 0 0 0 0 0 2 4.51- 5.50 0 1 1 3 1 1 1 5 12 1 2 1 1 1 1 1 33 5.51- 6.50 1 2 0 2 1 1 2 4 21 10 7 7 2 2 2 0 64 6.51- 8.50 0 2 5 5 3 6 1 5 10 13 14 8 6 2 0 0 80 8.51-11.50 0 1 2 4 3 3 3 2 2 12 12 6 3 1 0 2 56 11.51-14.50 0 1 0 0 1 3 0 1 0 6 9 1 0 2 0 0 24 14.51-20.50 0 0 2 0 1 0 0 0 0 4 4 1 0 0 0 0 12 >20.50 0 0 0 0 0 1 0 0 0 2 0 0 0 1 0 0 4 ___________ ______ ______ ______ ______ ______ ______ ______ ______ ______ ______ ______ ______ ______ ______ ______ ______ ______ TOTAL 1 7 10 14 10 15 7 17 46 48 49 24 12 9 3 3 275 STABILITY CLASS C SPEED (MPH) N NNE NE ENE E ESE SE SSE S SSW SW WSW W WNW NW NNW TOTAL ___________ _____ CALM 0 .76- 1.50 0 0 0 0 0 0 0 0 0 0 0 0 0 0 0 0 0 1.51- 2.50 1 0 0 0 0 0 0 0 0 0 0 0 0 0 0 0 1 2.51- 3.50 0 0 0 0 0 0 0 0 0 0 0 1 0 1 0 0 2 3.51- 4.50 0 0 0 0 0 0 0 0 3 4 2 2 2 0 0 1 14 4.51- 5.50 2 0 3 5 4 1 3 6 17 11 2 1 1 1 1 3 61 5.51- 6.50 2 2 6 2 1 1 1 3 11 19 7 7 3 2 0 2 69 6.51- 8.50 0 4 8 7 7 3 3 1 8 9 5 5 3 2 1 1 67 8.51-11.50 0 0 6 2 3 4 1 2 3 5 2 2 3 0 0 0 33 11.51-14.50 1 0 1 0 3 0 1 0 0 3 7 0 1 0 0 0 17 14.51-20.50 0 0 0 0 0 0 0 0 0 2 5 0 0 1 0 0 8 >20.50 0 0 0 0 0 0 0 0 0 0 1 0 0 0 0 0 1 ___________ ______ ______ ______ ______ ______ ______ ______ ______ ______ ______ ______ ______ ______ ______ ______ ______ ______ TOTAL 6 6 24 16 18 9 9 12 42 53 31 18 13 7 2 7 273 ARIZONA PUBLIC SERVICE CO. - PALO VERDE NUCLEAR GENERATING STATION JOINT FREQUENCY DISTRIBUTION FOR THE PERIOD 1/01/2016 TO 6/30/2016 *** 1ST SEMI *** STABILITY CLASS D STABILITY BASED ON: DELTA T BETWEEN 200.0 AND 35.0 FEET WIND MEASURED AT: 35.0 FEET WIND THRESHOLD AT: .75 MPH JOINT FREQUENCY DISTRIBUTION OF WIND SPEED AND DIRECTION IN HOURS AT 35.00 FEET SPEED (MPH) N NNE NE ENE E ESE SE SSE S SSW SW WSW W WNW NW NNW TOTAL ___________ _____ CALM 0 .76- 1.50 1 0 1 0 0 0 1 0 0 1 0 0 0 0 0 0 4 1.51- 2.50 1 1 2 1 0 1 6 3 3 6 5 2 5 1 1 2 40 2.51- 3.50 14 5 4 4 6 4 10 11 20 20 19 9 5 8 2 9 150 3.51- 4.50 7 9 11 7 2 5 5 6 21 24 17 6 7 1 6 4 138 4.51- 5.50 6 15 11 5 3 3 9 8 12 17 16 6 5 4 1 3 124 5.51- 6.50 2 3 11 6 0 4 1 2 8 11 7 7 2 2 3 2 71 6.51- 8.50 5 5 9 12 3 0 1 1 6 6 11 8 5 2 1 1 76 8.51-11.50 0 3 6 3 8 8 2 3 2 11 11 10 11 2 2 1 83 11.51-14.50 0 0 1 3 5 0 0 1 2 9 13 4 4 3 0 2 47 14.51-20.50 1 2 1 1 6 2 2 0 4 8 13 3 4 6 2 0 55 >20.50 0 0 0 0 0 0 0 1 0 4 2 0 0 0 0 0 7 ___________ ______ ______ ______ ______ ______ ______ ______ ______ ______ ______ ______ ______ ______ ______ ______ ______ ______ TOTAL 37 43 57 42 33 27 37 36 78 117 114 55 48 29 18 24 795 STABILITY CLASS E SPEED (MPH) N NNE NE ENE E ESE SE SSE S SSW SW WSW W WNW NW NNW TOTAL ___________ _____ CALM 0 .76- 1.50 0 0 1 1 1 0 0 0 0 0 1 1 0 0 2 0 7 1.51- 2.50 5 5 0 1 3 2 0 3 1 2 2 5 2 4 2 3 40 2.51- 3.50 7 5 1 2 2 1 2 0 0 5 4 8 8 6 13 3 67 3.51- 4.50 3 2 1 2 3 1 0 1 4 6 7 6 3 4 8 5 56 4.51- 5.50 4 4 2 1 1 0 1 0 8 13 8 3 1 2 4 3 55 5.51- 6.50 4 5 6 0 0 0 2 1 4 6 10 5 3 5 3 3 57 6.51- 8.50 4 6 14 4 2 2 3 3 7 16 28 11 14 5 2 4 125 8.51-11.50 6 6 6 6 0 4 3 2 4 16 40 17 14 6 2 8 140 11.51-14.50 4 1 3 4 4 2 3 1 5 17 22 3 1 17 10 4 101 14.51-20.50 1 0 0 0 18 0 0 2 1 8 20 4 5 6 5 3 73 >20.50 0 0 0 0 2 0 0 1 3 0 2 2 0 0 0 0 10 ___________ ______ ______ ______ ______ ______ ______ ______ ______ ______ ______ ______ ______ ______ ______ ______ ______ ______ TOTAL 38 34 34 21 36 12 14 14 37 89 144 65 51 55 51 36 731

PVNGS 2016 ARERR Page 69
STABILITY CLASS F SPEED (MPH) N NNE NE ENE E ESE SE SSE S SSW SW WSW W WNW NW NNW TOTAL ___________ _____ CALM 0 .76- 1.50 0 0 1 1 0 1 0 0 0 0 0 0 0 0 0 0 3 1.51- 2.50 5 2 0 2 0 1 4 1 2 1 5 5 5 6 5 4 48 2.51- 3.50 9 7 2 7 4 3 3 2 1 3 8 4 10 9 17 13 102 3.51- 4.50 7 4 1 4 1 3 0 0 1 11 10 6 5 7 10 12 82 4.51- 5.50 5 5 6 1 1 1 4 0 1 9 12 13 6 5 6 8 83 5.51- 6.50 4 9 8 3 1 1 3 1 1 12 13 11 7 5 4 10 93 6.51- 8.50 6 8 7 4 1 2 1 2 2 20 30 14 6 7 9 8 127 8.51-11.50 3 1 2 2 0 1 0 0 1 18 20 7 4 12 9 9 89 11.51-14.50 0 0 0 0 0 0 0 0 0 1 0 0 1 0 0 2 4 14.51-20.50 0 0 0 1 1 0 0 0 0 0 1 0 0 0 0 0 3 >20.50 0 0 0 0 0 0 0 0 0 0 0 0 0 0 0 0 0 ___________ ______ ______ ______ ______ ______ ______ ______ ______ ______ ______ ______ ______ ______ ______ ______ ______ ______ TOTAL 39 36 27 25 9 13 15 6 9 75 99 60 44 51 60 66 634 ARIZONA PUBLIC SERVICE CO. - PALO VERDE NUCLEAR GENERATING STATION JOINT FREQUENCY DISTRIBUTION FOR THE PERIOD 1/01/2016 TO 6/30/2016 *** 1ST SEMI *** STABILITY CLASS G STABILITY BASED ON: DELTA T BETWEEN 200.0 AND 35.0 FEET WIND MEASURED AT: 35.0 FEET WIND THRESHOLD AT: .75 MPH JOINT FREQUENCY DISTRIBUTION OF WIND SPEED AND DIRECTION IN HOURS AT 35.00 FEET SPEED (MPH) N NNE NE ENE E ESE SE SSE S SSW SW WSW W WNW NW NNW TOTAL ___________ _____ CALM 0 .76- 1.50 0 1 0 0 0 0 1 0 0 0 0 0 0 1 2 0 5 1.51- 2.50 15 5 3 1 4 1 1 0 0 2 1 5 9 10 18 22 97 2.51- 3.50 70 12 9 8 5 10 5 4 2 5 6 2 8 28 41 56 271 3.51- 4.50 93 22 8 8 1 5 7 2 1 4 4 8 11 18 35 86 313 4.51- 5.50 95 24 4 4 1 5 7 0 1 1 6 4 3 6 21 48 230 5.51- 6.50 47 24 5 1 1 0 2 2 1 3 1 3 2 6 5 16 119 6.51- 8.50 46 12 3 2 1 0 1 1 1 3 1 2 2 0 1 16 92 8.51-11.50 16 11 1 1 0 0 0 0 0 2 0 0 0 0 1 2 34 11.51-14.50 0 0 0 0 0 1 0 0 0 0 0 0 0 0 0 0 1 14.51-20.50 0 0 0 0 0 0 0 0 0 0 0 0 0 0 0 0 0 >20.50 0 0 0 0 0 0 0 0 0 0 0 0 0 0 0 0 0 ___________ ______ ______ ______ ______ ______ ______ ______ ______ ______ ______ ______ ______ ______ ______ ______ ______ ______ TOTAL 382 111 33 25 13 22 24 9 6 20 19 24 35 69 124 246 1162 STABILITY CLASS ALL SPEED (MPH) N NNE NE ENE E ESE SE SSE S SSW SW WSW W WNW NW NNW TOTAL ___________ _____ CALM 0 .76- 1.50 1 1 3 2 1 1 2 0 0 1 1 1 0 1 4 0 19 1.51- 2.50 27 13 5 5 7 5 11 7 6 11 13 17 21 21 26 31 226 2.51- 3.50 100 29 16 21 17 18 20 17 23 33 37 24 31 52 73 81 592 3.51- 4.50 110 37 21 21 7 14 12 9 31 49 41 28 28 30 59 108 605 4.51- 5.50 112 49 27 20 12 12 27 20 54 52 47 28 17 19 34 66 596 5.51- 6.50 60 46 36 14 6 7 12 19 59 69 49 40 19 22 17 33 508 6.51- 8.50 61 37 47 38 20 17 16 23 61 77 108 55 40 21 15 30 666 8.51-11.50 26 23 23 22 22 30 9 13 20 83 110 52 45 25 19 24 546 11.51-14.50 6 3 10 8 14 7 8 3 14 50 73 18 11 25 16 11 277 14.51-20.50 2 2 8 5 28 4 2 3 10 34 46 10 11 17 7 7 196 >20.50 0 0 1 0 2 1 0 2 3 8 11 3 0 2 1 0 34 ___________ ______ ______ ______ ______ ______ ______ ______ ______ ______ ______ ______ ______ ______ ______ ______ ______ ______ TOTAL 505 240 197 156 136 116 119 116 281 467 536 276 223 235 271 391 4265 TOTAL NUMBER OF OBSERVATIONS: 4272 TOTAL NUMBER OF VALID OBSERVATIONS: 4265 TOTAL NUMBER OF MISSING OBSERVATIONS: 7 PERCENT DATA RECOVERY FOR THIS PERIOD: 99.8 % MEAN WIND SPEED FOR THIS PERIOD: 6.8 MPH TOTAL NUMBER OF OBSERVATIONS WITH BACKUP DATA: 0 PERCENTAGE OCCURRENCE OF STABILITY CLASSES A B C D E F G 9.26 6.45 6.40 18.64 17.14 14.87 27.25 DISTRIBUTION OF WIND DIRECTION VS STABILITY N NNE NE ENE E ESE SE SSE S SSW SW WSW W WNW NW NNW CALM A 2 3 12 13 17 18 13 22 63 65 80 30 20 15 13 9 0 B 1 7 10 14 10 15 7 17 46 48 49 24 12 9 3 3 0 C 6 6 24 16 18 9 9 12 42 53 31 18 13 7 2 7 0 D 37 43 57 42 33 27 37 36 78 117 114 55 48 29 18 24 0 E 38 34 34 21 36 12 14 14 37 89 144 65 51 55 51 36 0 F 39 36 27 25 9 13 15 6 9 75 99 60 44 51 60 66 0 G 382 111 33 25 13 22 24 9 6 20 19 24 35 69 124 246 0 TOTAL 505 240 197 156 136 116 119 116 281 467 536 276 223 235 271 391 0 ARIZONA PUBLIC SERVICE CO. - PALO VERDE NUCLEAR GENERATING STATION JOINT FREQUENCY DISTRIBUTION FOR THE PERIOD 7/01/2016 TO 9/30/2016

PVNGS 2016 ARERR Page 70
*** 3RD QRTR *** STABILITY CLASS A STABILITY BASED ON: DELTA T BETWEEN 200.0 AND 35.0 FEET WIND MEASURED AT: 35.0 FEET WIND THRESHOLD AT: .75 MPH JOINT FREQUENCY DISTRIBUTION OF WIND SPEED AND DIRECTION IN HOURS AT 35.00 FEET SPEED (MPH) N NNE NE ENE E ESE SE SSE S SSW SW WSW W WNW NW NNW TOTAL ___________ _____ CALM 0 .76- 1.50 0 0 0 0 0 0 0 0 0 0 0 0 0 0 0 0 0 1.51- 2.50 0 0 0 0 0 0 0 0 0 0 0 0 0 0 0 0 0 2.51- 3.50 0 0 0 0 0 0 0 0 0 0 0 0 0 0 0 0 0 3.51- 4.50 0 0 1 0 0 0 0 0 0 0 0 0 0 0 0 0 1 4.51- 5.50 0 0 1 0 0 0 1 1 0 0 0 0 0 0 0 0 3 5.51- 6.50 0 0 0 2 2 4 3 7 14 5 1 2 0 0 0 1 41 6.51- 8.50 1 2 1 2 4 10 9 18 24 18 18 10 5 3 2 1 128 8.51-11.50 0 1 0 0 3 18 1 5 11 15 26 15 11 3 2 2 113 11.51-14.50 0 0 0 0 1 2 0 2 0 3 12 4 1 0 0 0 25 14.51-20.50 0 0 0 1 0 0 0 1 0 2 3 0 0 0 0 0 7 >20.50 1 0 0 0 0 0 0 0 0 0 0 0 0 0 0 0 1 ___________ ______ ______ ______ ______ ______ ______ ______ ______ ______ ______ ______ ______ ______ ______ ______ ______ ______ TOTAL 2 3 3 5 10 34 14 34 49 43 60 31 17 6 4 4 319 STABILITY CLASS B SPEED (MPH) N NNE NE ENE E ESE SE SSE S SSW SW WSW W WNW NW NNW TOTAL ___________ _____ CALM 0 .76- 1.50 0 0 0 0 0 0 0 0 0 0 0 0 0 0 0 0 0 1.51- 2.50 0 0 0 0 0 0 0 0 0 0 0 0 0 0 0 0 0 2.51- 3.50 0 0 0 0 0 0 0 0 0 0 0 0 0 0 0 0 0 3.51- 4.50 0 0 0 0 0 0 0 0 0 0 0 0 0 0 0 0 0 4.51- 5.50 1 0 0 0 0 0 2 3 6 2 2 0 1 0 0 1 18 5.51- 6.50 0 2 2 0 1 0 0 3 10 6 7 1 1 1 0 0 34 6.51- 8.50 0 2 1 4 3 5 4 5 8 8 13 7 4 0 0 1 65 8.51-11.50 0 0 2 3 3 6 0 0 4 6 17 9 2 2 0 0 54 11.51-14.50 0 0 1 0 1 1 1 0 4 3 7 1 0 0 0 0 19 14.51-20.50 0 0 0 0 2 0 0 1 0 0 2 0 0 0 0 0 5 >20.50 0 0 0 0 0 0 0 0 0 0 0 0 0 0 0 0 0 ___________ ______ ______ ______ ______ ______ ______ ______ ______ ______ ______ ______ ______ ______ ______ ______ ______ ______ TOTAL 1 4 6 7 10 12 7 12 32 25 48 18 8 3 0 2 195 STABILITY CLASS C SPEED (MPH) N NNE NE ENE E ESE SE SSE S SSW SW WSW W WNW NW NNW TOTAL ___________ _____ CALM 0 .76- 1.50 0 0 0 0 0 0 0 0 0 0 0 0 0 0 0 0 0 1.51- 2.50 0 0 0 0 0 0 0 0 0 0 0 0 0 0 0 0 0 2.51- 3.50 0 0 0 0 0 0 0 0 0 0 0 0 0 0 0 0 0 3.51- 4.50 0 0 1 0 0 1 1 0 0 0 0 0 1 0 1 0 5 4.51- 5.50 0 1 1 0 1 1 3 2 8 5 3 1 0 0 2 2 30 5.51- 6.50 1 0 0 0 2 0 1 1 8 4 6 4 1 0 0 1 29 6.51- 8.50 0 1 2 2 1 2 2 1 5 12 14 2 3 1 2 0 50 8.51-11.50 0 1 0 1 0 0 0 0 1 5 11 0 1 0 0 0 20 11.51-14.50 1 1 1 0 4 0 0 0 1 0 3 0 0 0 0 0 11 14.51-20.50 1 0 0 0 3 1 0 1 0 1 1 0 0 0 0 0 8 >20.50 0 0 0 0 0 0 0 0 0 0 0 0 0 0 0 0 0 ___________ ______ ______ ______ ______ ______ ______ ______ ______ ______ ______ ______ ______ ______ ______ ______ ______ ______ TOTAL 3 4 5 3 11 5 7 5 23 27 38 7 6 1 5 3 153 ARIZONA PUBLIC SERVICE CO. - PALO VERDE NUCLEAR GENERATING STATION JOINT FREQUENCY DISTRIBUTION FOR THE PERIOD 7/01/2016 TO 9/30/2016 *** 3RD QRTR *** STABILITY CLASS D STABILITY BASED ON: DELTA T BETWEEN 200.0 AND 35.0 FEET WIND MEASURED AT: 35.0 FEET WIND THRESHOLD AT: .75 MPH JOINT FREQUENCY DISTRIBUTION OF WIND SPEED AND DIRECTION IN HOURS AT 35.00 FEET SPEED (MPH) N NNE NE ENE E ESE SE SSE S SSW SW WSW W WNW NW NNW TOTAL ___________ _____ CALM 0 .76- 1.50 0 0 0 0 0 0 0 0 0 0 0 0 0 0 0 0 0 1.51- 2.50 2 0 0 3 1 0 0 0 1 0 1 1 1 3 0 1 14 2.51- 3.50 2 1 2 1 1 1 0 3 5 5 1 2 4 2 5 2 37 3.51- 4.50 2 2 2 3 2 2 1 1 8 5 6 2 1 4 0 3 44 4.51- 5.50 2 1 3 2 3 2 0 1 6 7 7 6 2 2 0 3 47 5.51- 6.50 1 2 1 0 0 0 0 2 5 7 9 6 2 1 1 1 38 6.51- 8.50 2 1 2 2 4 4 3 1 9 6 14 3 4 1 2 0 58 8.51-11.50 3 4 2 3 6 4 1 0 4 16 22 7 3 2 1 0 78 11.51-14.50 1 6 4 1 16 4 0 2 1 2 20 4 0 0 0 0 61 14.51-20.50 0 3 0 2 11 1 3 3 1 0 22 2 1 0 1 1 51 >20.50 0 0 0 0 0 1 0 1 0 0 0 0 0 0 0 0 2 ___________ ______ ______ ______ ______ ______ ______ ______ ______ ______ ______ ______ ______ ______ ______ ______ ______ ______ TOTAL 15 20 16 17 44 19 8 14 40 48 102 33 18 15 10 11 430
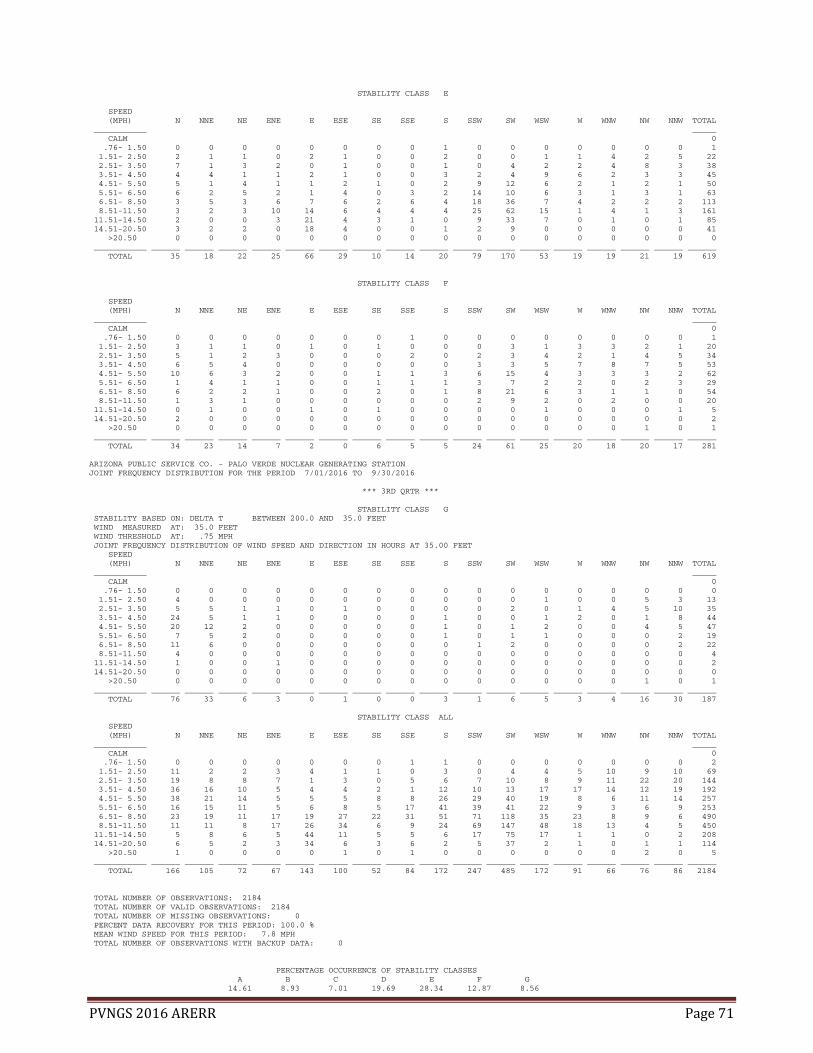
PVNGS 2016 ARERR Page 71
STABILITY CLASS E SPEED (MPH) N NNE NE ENE E ESE SE SSE S SSW SW WSW W WNW NW NNW TOTAL ___________ _____ CALM 0 .76- 1.50 0 0 0 0 0 0 0 0 1 0 0 0 0 0 0 0 1 1.51- 2.50 2 1 1 0 2 1 0 0 2 0 0 1 1 4 2 5 22 2.51- 3.50 7 1 3 2 0 1 0 0 1 0 4 2 2 4 8 3 38 3.51- 4.50 4 4 1 1 2 1 0 0 3 2 4 9 6 2 3 3 45 4.51- 5.50 5 1 4 1 1 2 1 0 2 9 12 6 2 1 2 1 50 5.51- 6.50 6 2 5 2 1 4 0 3 2 14 10 6 3 1 3 1 63 6.51- 8.50 3 5 3 6 7 6 2 6 4 18 36 7 4 2 2 2 113 8.51-11.50 3 2 3 10 14 6 4 4 4 25 62 15 1 4 1 3 161 11.51-14.50 2 0 0 3 21 4 3 1 0 9 33 7 0 1 0 1 85 14.51-20.50 3 2 2 0 18 4 0 0 1 2 9 0 0 0 0 0 41 >20.50 0 0 0 0 0 0 0 0 0 0 0 0 0 0 0 0 0 ___________ ______ ______ ______ ______ ______ ______ ______ ______ ______ ______ ______ ______ ______ ______ ______ ______ ______ TOTAL 35 18 22 25 66 29 10 14 20 79 170 53 19 19 21 19 619 STABILITY CLASS F SPEED (MPH) N NNE NE ENE E ESE SE SSE S SSW SW WSW W WNW NW NNW TOTAL ___________ _____ CALM 0 .76- 1.50 0 0 0 0 0 0 0 1 0 0 0 0 0 0 0 0 1 1.51- 2.50 3 1 1 0 1 0 1 0 0 0 3 1 3 3 2 1 20 2.51- 3.50 5 1 2 3 0 0 0 2 0 2 3 4 2 1 4 5 34 3.51- 4.50 6 5 4 0 0 0 0 0 0 3 3 5 7 8 7 5 53 4.51- 5.50 10 6 3 2 0 0 1 1 3 6 15 4 3 3 3 2 62 5.51- 6.50 1 4 1 1 0 0 1 1 1 3 7 2 2 0 2 3 29 6.51- 8.50 6 2 2 1 0 0 2 0 1 8 21 6 3 1 1 0 54 8.51-11.50 1 3 1 0 0 0 0 0 0 2 9 2 0 2 0 0 20 11.51-14.50 0 1 0 0 1 0 1 0 0 0 0 1 0 0 0 1 5 14.51-20.50 2 0 0 0 0 0 0 0 0 0 0 0 0 0 0 0 2 >20.50 0 0 0 0 0 0 0 0 0 0 0 0 0 0 1 0 1 ___________ ______ ______ ______ ______ ______ ______ ______ ______ ______ ______ ______ ______ ______ ______ ______ ______ ______ TOTAL 34 23 14 7 2 0 6 5 5 24 61 25 20 18 20 17 281 ARIZONA PUBLIC SERVICE CO. - PALO VERDE NUCLEAR GENERATING STATION JOINT FREQUENCY DISTRIBUTION FOR THE PERIOD 7/01/2016 TO 9/30/2016 *** 3RD QRTR *** STABILITY CLASS G STABILITY BASED ON: DELTA T BETWEEN 200.0 AND 35.0 FEET WIND MEASURED AT: 35.0 FEET WIND THRESHOLD AT: .75 MPH JOINT FREQUENCY DISTRIBUTION OF WIND SPEED AND DIRECTION IN HOURS AT 35.00 FEET SPEED (MPH) N NNE NE ENE E ESE SE SSE S SSW SW WSW W WNW NW NNW TOTAL ___________ _____ CALM 0 .76- 1.50 0 0 0 0 0 0 0 0 0 0 0 0 0 0 0 0 0 1.51- 2.50 4 0 0 0 0 0 0 0 0 0 0 1 0 0 5 3 13 2.51- 3.50 5 5 1 1 0 1 0 0 0 0 2 0 1 4 5 10 35 3.51- 4.50 24 5 1 1 0 0 0 0 1 0 0 1 2 0 1 8 44 4.51- 5.50 20 12 2 0 0 0 0 0 1 0 1 2 0 0 4 5 47 5.51- 6.50 7 5 2 0 0 0 0 0 1 0 1 1 0 0 0 2 19 6.51- 8.50 11 6 0 0 0 0 0 0 0 1 2 0 0 0 0 2 22 8.51-11.50 4 0 0 0 0 0 0 0 0 0 0 0 0 0 0 0 4 11.51-14.50 1 0 0 1 0 0 0 0 0 0 0 0 0 0 0 0 2 14.51-20.50 0 0 0 0 0 0 0 0 0 0 0 0 0 0 0 0 0 >20.50 0 0 0 0 0 0 0 0 0 0 0 0 0 0 1 0 1 ___________ ______ ______ ______ ______ ______ ______ ______ ______ ______ ______ ______ ______ ______ ______ ______ ______ ______ TOTAL 76 33 6 3 0 1 0 0 3 1 6 5 3 4 16 30 187 STABILITY CLASS ALL SPEED (MPH) N NNE NE ENE E ESE SE SSE S SSW SW WSW W WNW NW NNW TOTAL ___________ _____ CALM 0 .76- 1.50 0 0 0 0 0 0 0 1 1 0 0 0 0 0 0 0 2 1.51- 2.50 11 2 2 3 4 1 1 0 3 0 4 4 5 10 9 10 69 2.51- 3.50 19 8 8 7 1 3 0 5 6 7 10 8 9 11 22 20 144 3.51- 4.50 36 16 10 5 4 4 2 1 12 10 13 17 17 14 12 19 192 4.51- 5.50 38 21 14 5 5 5 8 8 26 29 40 19 8 6 11 14 257 5.51- 6.50 16 15 11 5 6 8 5 17 41 39 41 22 9 3 6 9 253 6.51- 8.50 23 19 11 17 19 27 22 31 51 71 118 35 23 8 9 6 490 8.51-11.50 11 11 8 17 26 34 6 9 24 69 147 48 18 13 4 5 450 11.51-14.50 5 8 6 5 44 11 5 5 6 17 75 17 1 1 0 2 208 14.51-20.50 6 5 2 3 34 6 3 6 2 5 37 2 1 0 1 1 114 >20.50 1 0 0 0 0 1 0 1 0 0 0 0 0 0 2 0 5 ___________ ______ ______ ______ ______ ______ ______ ______ ______ ______ ______ ______ ______ ______ ______ ______ ______ ______ TOTAL 166 105 72 67 143 100 52 84 172 247 485 172 91 66 76 86 2184 TOTAL NUMBER OF OBSERVATIONS: 2184 TOTAL NUMBER OF VALID OBSERVATIONS: 2184 TOTAL NUMBER OF MISSING OBSERVATIONS: 0 PERCENT DATA RECOVERY FOR THIS PERIOD: 100.0 % MEAN WIND SPEED FOR THIS PERIOD: 7.8 MPH TOTAL NUMBER OF OBSERVATIONS WITH BACKUP DATA: 0 PERCENTAGE OCCURRENCE OF STABILITY CLASSES A B C D E F G 14.61 8.93 7.01 19.69 28.34 12.87 8.56

PVNGS 2016 ARERR Page 72
DISTRIBUTION OF WIND DIRECTION VS STABILITY N NNE NE ENE E ESE SE SSE S SSW SW WSW W WNW NW NNW CALM A 2 3 3 5 10 34 14 34 49 43 60 31 17 6 4 4 0 B 1 4 6 7 10 12 7 12 32 25 48 18 8 3 0 2 0 C 3 4 5 3 11 5 7 5 23 27 38 7 6 1 5 3 0 D 15 20 16 17 44 19 8 14 40 48 102 33 18 15 10 11 0 E 35 18 22 25 66 29 10 14 20 79 170 53 19 19 21 19 0 F 34 23 14 7 2 0 6 5 5 24 61 25 20 18 20 17 0 G 76 33 6 3 0 1 0 0 3 1 6 5 3 4 16 30 0 TOTAL 166 105 72 67 143 100 52 84 172 247 485 172 91 66 76 86 0 ARIZONA PUBLIC SERVICE CO. - PALO VERDE NUCLEAR GENERATING STATION JOINT FREQUENCY DISTRIBUTION FOR THE PERIOD 10/01/2016 TO 12/31/2016 *** 4TH QRTR *** STABILITY CLASS A STABILITY BASED ON: DELTA T BETWEEN 200.0 AND 35.0 FEET WIND MEASURED AT: 35.0 FEET WIND THRESHOLD AT: .75 MPH JOINT FREQUENCY DISTRIBUTION OF WIND SPEED AND DIRECTION IN HOURS AT 35.00 FEET SPEED (MPH) N NNE NE ENE E ESE SE SSE S SSW SW WSW W WNW NW NNW TOTAL ___________ _____ CALM 0 .76- 1.50 0 0 0 0 0 0 0 0 0 0 0 0 0 0 0 0 0 1.51- 2.50 0 0 0 0 0 0 0 0 0 0 0 0 0 0 0 0 0 2.51- 3.50 0 0 0 0 0 0 0 0 0 0 0 0 0 0 0 0 0 3.51- 4.50 0 0 0 0 0 0 0 0 0 0 0 0 0 0 0 0 0 4.51- 5.50 0 0 0 0 1 0 0 0 0 0 0 0 0 0 0 0 1 5.51- 6.50 0 0 0 1 0 0 2 1 1 0 0 0 0 0 0 0 5 6.51- 8.50 0 0 1 0 2 1 6 4 2 0 2 0 0 0 2 0 20 8.51-11.50 0 0 0 1 0 3 0 0 0 1 0 0 1 2 0 1 9 11.51-14.50 0 0 0 0 0 0 0 0 0 0 1 0 1 1 0 0 3 14.51-20.50 0 0 0 0 0 0 0 0 0 0 0 0 0 0 0 0 0 >20.50 0 0 0 0 0 0 0 0 0 0 0 0 0 0 0 0 0 ___________ ______ ______ ______ ______ ______ ______ ______ ______ ______ ______ ______ ______ ______ ______ ______ ______ ______ TOTAL 0 0 1 2 3 4 8 5 3 1 3 0 2 3 2 1 38 STABILITY CLASS B SPEED (MPH) N NNE NE ENE E ESE SE SSE S SSW SW WSW W WNW NW NNW TOTAL ___________ _____ CALM 0 .76- 1.50 0 0 0 0 0 0 0 0 0 0 0 0 0 0 0 0 0 1.51- 2.50 0 0 0 0 0 0 0 0 0 0 0 0 0 0 0 0 0 2.51- 3.50 0 0 0 0 0 0 0 0 0 0 0 0 0 0 0 0 0 3.51- 4.50 0 0 0 0 0 0 1 0 0 1 0 0 0 0 0 0 2 4.51- 5.50 0 0 0 2 1 1 1 4 5 0 1 0 0 0 1 2 18 5.51- 6.50 0 0 2 2 1 1 3 4 2 2 0 1 0 0 0 0 18 6.51- 8.50 0 0 0 5 5 2 3 6 0 7 2 0 0 0 0 1 31 8.51-11.50 1 0 0 0 5 0 1 0 0 3 3 0 0 0 1 0 14 11.51-14.50 0 0 0 1 3 0 0 1 0 0 1 0 0 0 0 0 6 14.51-20.50 0 0 1 2 0 0 0 0 0 0 0 0 0 0 0 0 3 >20.50 0 0 0 0 0 0 0 0 0 0 0 0 0 0 0 0 0 ___________ ______ ______ ______ ______ ______ ______ ______ ______ ______ ______ ______ ______ ______ ______ ______ ______ ______ TOTAL 1 0 3 12 15 4 9 15 7 13 7 1 0 0 2 3 92 STABILITY CLASS C SPEED (MPH) N NNE NE ENE E ESE SE SSE S SSW SW WSW W WNW NW NNW TOTAL ___________ _____ CALM 0 .76- 1.50 0 0 0 0 0 0 0 0 0 0 0 0 0 0 0 0 0 1.51- 2.50 0 0 0 0 0 0 0 0 0 0 0 0 0 0 0 0 0 2.51- 3.50 0 0 0 0 0 0 0 0 0 0 1 0 0 0 0 0 1 3.51- 4.50 0 0 0 0 0 2 3 6 6 4 1 0 1 1 1 0 25 4.51- 5.50 1 2 2 5 2 0 1 8 10 3 0 1 1 1 1 0 38 5.51- 6.50 0 1 0 1 0 1 0 3 1 0 1 0 1 0 1 1 11 6.51- 8.50 0 0 2 3 1 0 1 0 2 2 3 1 0 0 1 1 17 8.51-11.50 0 1 4 0 3 2 0 0 0 3 4 0 0 0 0 2 19 11.51-14.50 0 1 0 0 7 0 0 0 0 2 0 1 0 1 0 1 13 14.51-20.50 0 0 0 0 1 0 0 0 0 0 2 0 0 0 0 0 3 >20.50 0 0 0 0 0 0 0 0 0 0 0 0 0 0 0 0 0 ___________ ______ ______ ______ ______ ______ ______ ______ ______ ______ ______ ______ ______ ______ ______ ______ ______ ______ TOTAL 1 5 8 9 14 5 5 17 19 14 12 3 3 3 4 5 127 ARIZONA PUBLIC SERVICE CO. - PALO VERDE NUCLEAR GENERATING STATION JOINT FREQUENCY DISTRIBUTION FOR THE PERIOD 10/01/2016 TO 12/31/2016 *** 4TH QRTR ***

PVNGS 2016 ARERR Page 73
STABILITY CLASS D STABILITY BASED ON: DELTA T BETWEEN 200.0 AND 35.0 FEET WIND MEASURED AT: 35.0 FEET WIND THRESHOLD AT: .75 MPH JOINT FREQUENCY DISTRIBUTION OF WIND SPEED AND DIRECTION IN HOURS AT 35.00 FEET SPEED (MPH) N NNE NE ENE E ESE SE SSE S SSW SW WSW W WNW NW NNW TOTAL ___________ _____ CALM 0 .76- 1.50 0 0 0 0 0 0 0 0 0 0 0 0 0 0 0 0 0 1.51- 2.50 1 2 2 1 1 0 1 3 1 0 5 2 0 0 3 2 24 2.51- 3.50 10 2 3 5 2 1 1 4 6 9 7 6 10 8 2 7 83 3.51- 4.50 6 4 7 3 1 2 1 4 13 11 6 1 2 3 5 8 77 4.51- 5.50 1 3 4 3 3 1 4 3 3 4 6 4 3 1 0 4 47 5.51- 6.50 3 1 4 3 0 1 0 0 3 4 4 4 1 1 1 0 30 6.51- 8.50 5 4 1 2 1 3 1 1 2 5 12 4 1 0 3 3 48 8.51-11.50 0 1 6 3 5 1 2 0 0 4 8 3 1 1 1 2 38 11.51-14.50 0 1 0 1 15 3 2 0 0 0 9 3 2 0 0 0 36 14.51-20.50 0 0 1 0 18 0 1 0 1 1 2 1 0 0 0 0 25 >20.50 0 0 0 0 1 0 0 0 0 0 0 0 0 0 0 0 1 ___________ ______ ______ ______ ______ ______ ______ ______ ______ ______ ______ ______ ______ ______ ______ ______ ______ ______ TOTAL 26 18 28 21 47 12 13 15 29 38 59 28 20 14 15 26 409 STABILITY CLASS E SPEED (MPH) N NNE NE ENE E ESE SE SSE S SSW SW WSW W WNW NW NNW TOTAL ___________ _____ CALM 0 .76- 1.50 0 0 0 0 0 0 0 0 1 0 0 0 0 0 0 0 1 1.51- 2.50 5 4 0 1 0 1 1 1 2 3 7 4 5 11 4 1 50 2.51- 3.50 3 2 0 1 1 3 0 1 4 3 3 3 3 4 2 6 39 3.51- 4.50 8 6 1 2 1 0 0 1 3 3 5 4 2 4 6 3 49 4.51- 5.50 1 6 0 2 0 0 1 3 2 2 8 7 1 0 3 5 41 5.51- 6.50 3 3 3 2 0 0 0 1 2 2 3 4 3 2 1 0 29 6.51- 8.50 4 3 4 2 2 3 1 1 0 5 9 3 3 0 1 1 42 8.51-11.50 1 2 0 3 6 8 1 1 3 3 2 3 0 1 1 2 37 11.51-14.50 0 1 1 0 6 4 1 0 0 1 1 5 1 1 1 0 23 14.51-20.50 0 0 0 0 6 0 0 0 0 1 6 1 0 3 0 1 18 >20.50 0 0 0 0 0 0 0 0 0 0 0 1 1 3 0 0 5 ___________ ______ ______ ______ ______ ______ ______ ______ ______ ______ ______ ______ ______ ______ ______ ______ ______ ______ TOTAL 25 27 9 13 22 19 5 9 17 23 44 35 19 29 19 19 334 STABILITY CLASS F SPEED (MPH) N NNE NE ENE E ESE SE SSE S SSW SW WSW W WNW NW NNW TOTAL ___________ _____ CALM 0 .76- 1.50 0 0 0 0 0 0 0 0 0 1 0 0 0 0 0 0 1 1.51- 2.50 5 3 6 0 1 1 0 3 1 0 1 7 3 8 7 2 48 2.51- 3.50 11 4 4 0 0 0 2 0 0 2 3 2 5 7 5 4 49 3.51- 4.50 8 1 2 4 1 0 0 0 4 1 7 5 7 5 11 8 64 4.51- 5.50 7 1 3 0 1 0 0 0 2 2 9 6 0 2 5 3 41 5.51- 6.50 5 0 0 0 1 0 0 0 0 2 6 3 2 3 2 6 30 6.51- 8.50 4 1 2 5 0 0 1 0 1 4 10 2 1 2 4 5 42 8.51-11.50 1 2 3 4 0 0 1 1 0 0 2 0 1 2 0 3 20 11.51-14.50 0 0 1 1 1 0 0 0 0 0 0 0 0 0 0 1 4 14.51-20.50 0 0 0 1 4 0 0 0 0 0 0 0 0 0 0 0 5 >20.50 0 0 0 0 0 0 0 0 0 0 0 0 0 0 0 0 0 ___________ ______ ______ ______ ______ ______ ______ ______ ______ ______ ______ ______ ______ ______ ______ ______ ______ ______ TOTAL 41 12 21 15 9 1 4 4 8 12 38 25 19 29 34 32 304 ARIZONA PUBLIC SERVICE CO. - PALO VERDE NUCLEAR GENERATING STATION JOINT FREQUENCY DISTRIBUTION FOR THE PERIOD 10/01/2016 TO 12/31/2016 *** 4TH QRTR *** STABILITY CLASS G STABILITY BASED ON: DELTA T BETWEEN 200.0 AND 35.0 FEET WIND MEASURED AT: 35.0 FEET WIND THRESHOLD AT: .75 MPH JOINT FREQUENCY DISTRIBUTION OF WIND SPEED AND DIRECTION IN HOURS AT 35.00 FEET SPEED (MPH) N NNE NE ENE E ESE SE SSE S SSW SW WSW W WNW NW NNW TOTAL ___________ _____ CALM 0 .76- 1.50 0 0 0 0 0 0 0 0 0 0 0 0 2 0 0 2 4 1.51- 2.50 20 12 3 2 1 1 1 1 2 2 2 4 8 15 16 20 110 2.51- 3.50 56 17 3 4 0 0 0 3 1 1 5 4 6 22 36 53 211 3.51- 4.50 79 37 5 6 2 1 0 1 2 1 3 0 10 7 20 52 226 4.51- 5.50 45 30 4 1 0 0 0 0 0 0 1 0 1 1 3 24 110 5.51- 6.50 23 14 7 2 0 0 0 0 0 1 0 1 0 0 4 10 62 6.51- 8.50 26 19 2 2 0 0 0 0 0 0 0 0 0 0 1 13 63 8.51-11.50 5 8 5 1 0 0 0 0 0 0 0 0 0 0 0 2 21 11.51-14.50 0 0 0 1 0 0 0 0 0 0 0 0 0 0 0 0 1 14.51-20.50 0 0 0 0 0 0 0 0 0 0 0 0 0 0 0 0 0 >20.50 0 0 0 0 0 0 0 0 0 0 0 0 0 0 0 0 0 ___________ ______ ______ ______ ______ ______ ______ ______ ______ ______ ______ ______ ______ ______ ______ ______ ______ ______ TOTAL 254 137 29 19 3 2 1 5 5 5 11 9 27 45 80 176 808

PVNGS 2016 ARERR Page 74
STABILITY CLASS ALL SPEED (MPH) N NNE NE ENE E ESE SE SSE S SSW SW WSW W WNW NW NNW TOTAL ___________ _____ CALM 0 .76- 1.50 0 0 0 0 0 0 0 0 1 1 0 0 2 0 0 2 6 1.51- 2.50 31 21 11 4 3 3 3 8 6 5 15 17 16 34 30 25 232 2.51- 3.50 80 25 10 10 3 4 3 8 11 15 19 15 24 41 45 70 383 3.51- 4.50 101 48 15 15 5 5 5 12 28 21 22 10 22 20 43 71 443 4.51- 5.50 55 42 13 13 8 2 7 18 22 11 25 18 6 5 13 38 296 5.51- 6.50 34 19 16 11 2 3 5 9 9 11 14 13 7 6 9 17 185 6.51- 8.50 39 27 12 19 11 9 13 12 7 23 38 10 5 2 12 24 263 8.51-11.50 8 14 18 12 19 14 5 2 3 14 19 6 3 6 3 12 158 11.51-14.50 0 3 2 4 32 7 3 1 0 3 12 9 4 3 1 2 86 14.51-20.50 0 0 2 3 29 0 1 0 1 2 10 2 0 3 0 1 54 >20.50 0 0 0 0 1 0 0 0 0 0 0 1 1 3 0 0 6 ___________ ______ ______ ______ ______ ______ ______ ______ ______ ______ ______ ______ ______ ______ ______ ______ ______ ______ TOTAL 348 199 99 91 113 47 45 70 88 106 174 101 90 123 156 262 2112 TOTAL NUMBER OF OBSERVATIONS: 2112 TOTAL NUMBER OF VALID OBSERVATIONS: 2112 TOTAL NUMBER OF MISSING OBSERVATIONS: 0 PERCENT DATA RECOVERY FOR THIS PERIOD: 100.0 % MEAN WIND SPEED FOR THIS PERIOD: 5.6 MPH TOTAL NUMBER OF OBSERVATIONS WITH BACKUP DATA: 0 PERCENTAGE OCCURRENCE OF STABILITY CLASSES A B C D E F G 1.80 4.36 6.01 19.37 15.81 14.39 38.26 DISTRIBUTION OF WIND DIRECTION VS STABILITY N NNE NE ENE E ESE SE SSE S SSW SW WSW W WNW NW NNW CALM A 0 0 1 2 3 4 8 5 3 1 3 0 2 3 2 1 0 B 1 0 3 12 15 4 9 15 7 13 7 1 0 0 2 3 0 C 1 5 8 9 14 5 5 17 19 14 12 3 3 3 4 5 0 D 26 18 28 21 47 12 13 15 29 38 59 28 20 14 15 26 0 E 25 27 9 13 22 19 5 9 17 23 44 35 19 29 19 19 0 F 41 12 21 15 9 1 4 4 8 12 38 25 19 29 34 32 0 G 254 137 29 19 3 2 1 5 5 5 11 9 27 45 80 176 0 TOTAL 348 199 99 91 113 47 45 70 88 106 174 101 90 123 156 262 0 ARIZONA PUBLIC SERVICE CO. - PALO VERDE NUCLEAR GENERATING STATION JOINT FREQUENCY DISTRIBUTION FOR THE PERIOD 7/01/2016 TO 12/31/2016 *** 2ND SEMI *** STABILITY CLASS A STABILITY BASED ON: DELTA T BETWEEN 200.0 AND 35.0 FEET WIND MEASURED AT: 35.0 FEET WIND THRESHOLD AT: .75 MPH JOINT FREQUENCY DISTRIBUTION OF WIND SPEED AND DIRECTION IN HOURS AT 35.00 FEET SPEED (MPH) N NNE NE ENE E ESE SE SSE S SSW SW WSW W WNW NW NNW TOTAL ___________ _____ CALM 0 .76- 1.50 0 0 0 0 0 0 0 0 0 0 0 0 0 0 0 0 0 1.51- 2.50 0 0 0 0 0 0 0 0 0 0 0 0 0 0 0 0 0 2.51- 3.50 0 0 0 0 0 0 0 0 0 0 0 0 0 0 0 0 0 3.51- 4.50 0 0 1 0 0 0 0 0 0 0 0 0 0 0 0 0 1 4.51- 5.50 0 0 1 0 1 0 1 1 0 0 0 0 0 0 0 0 4 5.51- 6.50 0 0 0 3 2 4 5 8 15 5 1 2 0 0 0 1 46 6.51- 8.50 1 2 2 2 6 11 15 22 26 18 20 10 5 3 4 1 148 8.51-11.50 0 1 0 1 3 21 1 5 11 16 26 15 12 5 2 3 122 11.51-14.50 0 0 0 0 1 2 0 2 0 3 13 4 2 1 0 0 28 14.51-20.50 0 0 0 1 0 0 0 1 0 2 3 0 0 0 0 0 7 >20.50 1 0 0 0 0 0 0 0 0 0 0 0 0 0 0 0 1 ___________ ______ ______ ______ ______ ______ ______ ______ ______ ______ ______ ______ ______ ______ ______ ______ ______ ______ TOTAL 2 3 4 7 13 38 22 39 52 44 63 31 19 9 6 5 357 STABILITY CLASS B SPEED (MPH) N NNE NE ENE E ESE SE SSE S SSW SW WSW W WNW NW NNW TOTAL ___________ _____ CALM 0 .76- 1.50 0 0 0 0 0 0 0 0 0 0 0 0 0 0 0 0 0 1.51- 2.50 0 0 0 0 0 0 0 0 0 0 0 0 0 0 0 0 0 2.51- 3.50 0 0 0 0 0 0 0 0 0 0 0 0 0 0 0 0 0 3.51- 4.50 0 0 0 0 0 0 1 0 0 1 0 0 0 0 0 0 2 4.51- 5.50 1 0 0 2 1 1 3 7 11 2 3 0 1 0 1 3 36 5.51- 6.50 0 2 4 2 2 1 3 7 12 8 7 2 1 1 0 0 52 6.51- 8.50 0 2 1 9 8 7 7 11 8 15 15 7 4 0 0 2 96 8.51-11.50 1 0 2 3 8 6 1 0 4 9 20 9 2 2 1 0 68 11.51-14.50 0 0 1 1 4 1 1 1 4 3 8 1 0 0 0 0 25 14.51-20.50 0 0 1 2 2 0 0 1 0 0 2 0 0 0 0 0 8 >20.50 0 0 0 0 0 0 0 0 0 0 0 0 0 0 0 0 0 ___________ ______ ______ ______ ______ ______ ______ ______ ______ ______ ______ ______ ______ ______ ______ ______ ______ ______ TOTAL 2 4 9 19 25 16 16 27 39 38 55 19 8 3 2 5 287
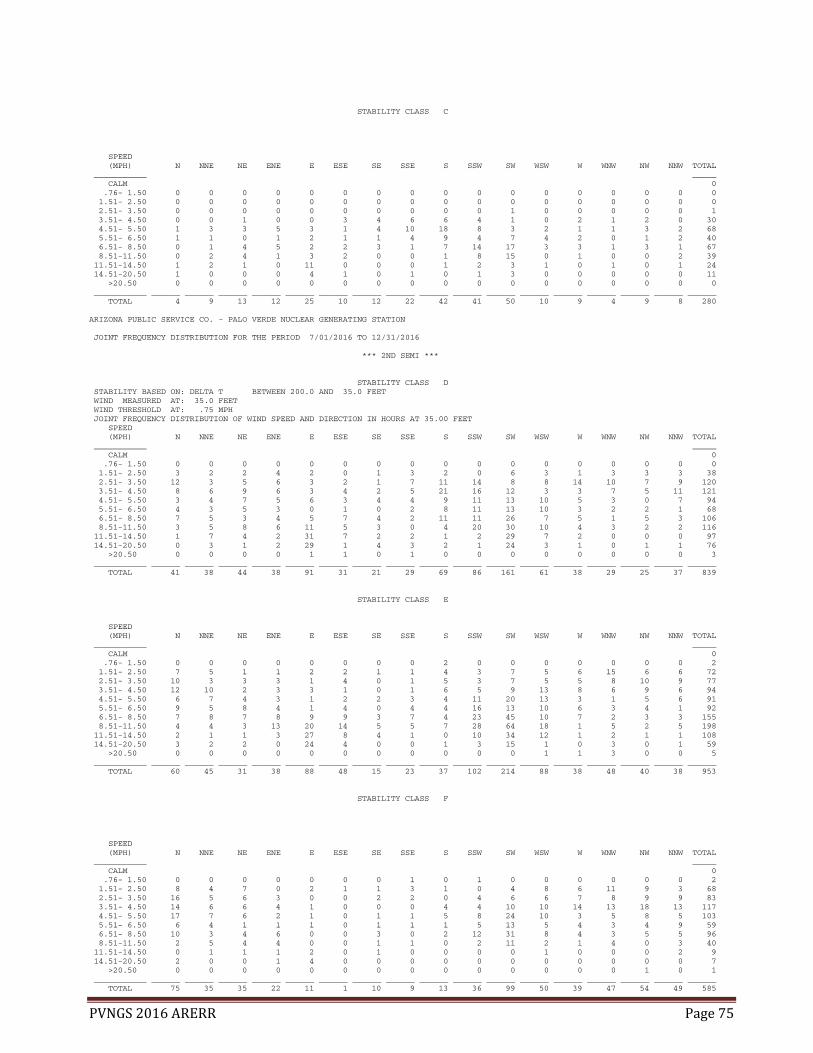
PVNGS 2016 ARERR Page 75
STABILITY CLASS C SPEED (MPH) N NNE NE ENE E ESE SE SSE S SSW SW WSW W WNW NW NNW TOTAL ___________ _____ CALM 0 .76- 1.50 0 0 0 0 0 0 0 0 0 0 0 0 0 0 0 0 0 1.51- 2.50 0 0 0 0 0 0 0 0 0 0 0 0 0 0 0 0 0 2.51- 3.50 0 0 0 0 0 0 0 0 0 0 1 0 0 0 0 0 1 3.51- 4.50 0 0 1 0 0 3 4 6 6 4 1 0 2 1 2 0 30 4.51- 5.50 1 3 3 5 3 1 4 10 18 8 3 2 1 1 3 2 68 5.51- 6.50 1 1 0 1 2 1 1 4 9 4 7 4 2 0 1 2 40 6.51- 8.50 0 1 4 5 2 2 3 1 7 14 17 3 3 1 3 1 67 8.51-11.50 0 2 4 1 3 2 0 0 1 8 15 0 1 0 0 2 39 11.51-14.50 1 2 1 0 11 0 0 0 1 2 3 1 0 1 0 1 24 14.51-20.50 1 0 0 0 4 1 0 1 0 1 3 0 0 0 0 0 11 >20.50 0 0 0 0 0 0 0 0 0 0 0 0 0 0 0 0 0 ___________ ______ ______ ______ ______ ______ ______ ______ ______ ______ ______ ______ ______ ______ ______ ______ ______ ______ TOTAL 4 9 13 12 25 10 12 22 42 41 50 10 9 4 9 8 280 ARIZONA PUBLIC SERVICE CO. - PALO VERDE NUCLEAR GENERATING STATION JOINT FREQUENCY DISTRIBUTION FOR THE PERIOD 7/01/2016 TO 12/31/2016 *** 2ND SEMI *** STABILITY CLASS D STABILITY BASED ON: DELTA T BETWEEN 200.0 AND 35.0 FEET WIND MEASURED AT: 35.0 FEET WIND THRESHOLD AT: .75 MPH JOINT FREQUENCY DISTRIBUTION OF WIND SPEED AND DIRECTION IN HOURS AT 35.00 FEET SPEED (MPH) N NNE NE ENE E ESE SE SSE S SSW SW WSW W WNW NW NNW TOTAL ___________ _____ CALM 0 .76- 1.50 0 0 0 0 0 0 0 0 0 0 0 0 0 0 0 0 0 1.51- 2.50 3 2 2 4 2 0 1 3 2 0 6 3 1 3 3 3 38 2.51- 3.50 12 3 5 6 3 2 1 7 11 14 8 8 14 10 7 9 120 3.51- 4.50 8 6 9 6 3 4 2 5 21 16 12 3 3 7 5 11 121 4.51- 5.50 3 4 7 5 6 3 4 4 9 11 13 10 5 3 0 7 94 5.51- 6.50 4 3 5 3 0 1 0 2 8 11 13 10 3 2 2 1 68 6.51- 8.50 7 5 3 4 5 7 4 2 11 11 26 7 5 1 5 3 106 8.51-11.50 3 5 8 6 11 5 3 0 4 20 30 10 4 3 2 2 116 11.51-14.50 1 7 4 2 31 7 2 2 1 2 29 7 2 0 0 0 97 14.51-20.50 0 3 1 2 29 1 4 3 2 1 24 3 1 0 1 1 76 >20.50 0 0 0 0 1 1 0 1 0 0 0 0 0 0 0 0 3 ___________ ______ ______ ______ ______ ______ ______ ______ ______ ______ ______ ______ ______ ______ ______ ______ ______ ______ TOTAL 41 38 44 38 91 31 21 29 69 86 161 61 38 29 25 37 839 STABILITY CLASS E SPEED (MPH) N NNE NE ENE E ESE SE SSE S SSW SW WSW W WNW NW NNW TOTAL ___________ _____ CALM 0 .76- 1.50 0 0 0 0 0 0 0 0 2 0 0 0 0 0 0 0 2 1.51- 2.50 7 5 1 1 2 2 1 1 4 3 7 5 6 15 6 6 72 2.51- 3.50 10 3 3 3 1 4 0 1 5 3 7 5 5 8 10 9 77 3.51- 4.50 12 10 2 3 3 1 0 1 6 5 9 13 8 6 9 6 94 4.51- 5.50 6 7 4 3 1 2 2 3 4 11 20 13 3 1 5 6 91 5.51- 6.50 9 5 8 4 1 4 0 4 4 16 13 10 6 3 4 1 92 6.51- 8.50 7 8 7 8 9 9 3 7 4 23 45 10 7 2 3 3 155 8.51-11.50 4 4 3 13 20 14 5 5 7 28 64 18 1 5 2 5 198 11.51-14.50 2 1 1 3 27 8 4 1 0 10 34 12 1 2 1 1 108 14.51-20.50 3 2 2 0 24 4 0 0 1 3 15 1 0 3 0 1 59 >20.50 0 0 0 0 0 0 0 0 0 0 0 1 1 3 0 0 5 ___________ ______ ______ ______ ______ ______ ______ ______ ______ ______ ______ ______ ______ ______ ______ ______ ______ ______ TOTAL 60 45 31 38 88 48 15 23 37 102 214 88 38 48 40 38 953 STABILITY CLASS F SPEED (MPH) N NNE NE ENE E ESE SE SSE S SSW SW WSW W WNW NW NNW TOTAL ___________ _____ CALM 0 .76- 1.50 0 0 0 0 0 0 0 1 0 1 0 0 0 0 0 0 2 1.51- 2.50 8 4 7 0 2 1 1 3 1 0 4 8 6 11 9 3 68 2.51- 3.50 16 5 6 3 0 0 2 2 0 4 6 6 7 8 9 9 83 3.51- 4.50 14 6 6 4 1 0 0 0 4 4 10 10 14 13 18 13 117 4.51- 5.50 17 7 6 2 1 0 1 1 5 8 24 10 3 5 8 5 103 5.51- 6.50 6 4 1 1 1 0 1 1 1 5 13 5 4 3 4 9 59 6.51- 8.50 10 3 4 6 0 0 3 0 2 12 31 8 4 3 5 5 96 8.51-11.50 2 5 4 4 0 0 1 1 0 2 11 2 1 4 0 3 40 11.51-14.50 0 1 1 1 2 0 1 0 0 0 0 1 0 0 0 2 9 14.51-20.50 2 0 0 1 4 0 0 0 0 0 0 0 0 0 0 0 7 >20.50 0 0 0 0 0 0 0 0 0 0 0 0 0 0 1 0 1 ___________ ______ ______ ______ ______ ______ ______ ______ ______ ______ ______ ______ ______ ______ ______ ______ ______ ______ TOTAL 75 35 35 22 11 1 10 9 13 36 99 50 39 47 54 49 585

PVNGS 2016 ARERR Page 76
ARIZONA PUBLIC SERVICE CO. - PALO VERDE NUCLEAR GENERATING STATION JOINT FREQUENCY DISTRIBUTION FOR THE PERIOD 7/01/2016 TO 12/31/2016 *** 2ND SEMI *** STABILITY CLASS G STABILITY BASED ON: DELTA T BETWEEN 200.0 AND 35.0 FEET WIND MEASURED AT: 35.0 FEET WIND THRESHOLD AT: .75 MPH JOINT FREQUENCY DISTRIBUTION OF WIND SPEED AND DIRECTION IN HOURS AT 35.00 FEET SPEED (MPH) N NNE NE ENE E ESE SE SSE S SSW SW WSW W WNW NW NNW TOTAL ___________ _____ CALM 0 .76- 1.50 0 0 0 0 0 0 0 0 0 0 0 0 2 0 0 2 4 1.51- 2.50 24 12 3 2 1 1 1 1 2 2 2 5 8 15 21 23 123 2.51- 3.50 61 22 4 5 0 1 0 3 1 1 7 4 7 26 41 63 246 3.51- 4.50 103 42 6 7 2 1 0 1 3 1 3 1 12 7 21 60 270 4.51- 5.50 65 42 6 1 0 0 0 0 1 0 2 2 1 1 7 29 157 5.51- 6.50 30 19 9 2 0 0 0 0 1 1 1 2 0 0 4 12 81 6.51- 8.50 37 25 2 2 0 0 0 0 0 1 2 0 0 0 1 15 85 8.51-11.50 9 8 5 1 0 0 0 0 0 0 0 0 0 0 0 2 25 11.51-14.50 1 0 0 2 0 0 0 0 0 0 0 0 0 0 0 0 3 14.51-20.50 0 0 0 0 0 0 0 0 0 0 0 0 0 0 0 0 0 >20.50 0 0 0 0 0 0 0 0 0 0 0 0 0 0 1 0 1 ___________ ______ ______ ______ ______ ______ ______ ______ ______ ______ ______ ______ ______ ______ ______ ______ ______ ______ TOTAL 330 170 35 22 3 3 1 5 8 6 17 14 30 49 96 206 995 STABILITY CLASS ALL SPEED (MPH) N NNE NE ENE E ESE SE SSE S SSW SW WSW W WNW NW NNW TOTAL ___________ _____ CALM 0 .76- 1.50 0 0 0 0 0 0 0 1 2 1 0 0 2 0 0 2 8 1.51- 2.50 42 23 13 7 7 4 4 8 9 5 19 21 21 44 39 35 301 2.51- 3.50 99 33 18 17 4 7 3 13 17 22 29 23 33 52 67 90 527 3.51- 4.50 137 64 25 20 9 9 7 13 40 31 35 27 39 34 55 90 635 4.51- 5.50 93 63 27 18 13 7 15 26 48 40 65 37 14 11 24 52 553 5.51- 6.50 50 34 27 16 8 11 10 26 50 50 55 35 16 9 15 26 438 6.51- 8.50 62 46 23 36 30 36 35 43 58 94 156 45 28 10 21 30 753 8.51-11.50 19 25 26 29 45 48 11 11 27 83 166 54 21 19 7 17 608 11.51-14.50 5 11 8 9 76 18 8 6 6 20 87 26 5 4 1 4 294 14.51-20.50 6 5 4 6 63 6 4 6 3 7 47 4 1 3 1 2 168 >20.50 1 0 0 0 1 1 0 1 0 0 0 1 1 3 2 0 11 ___________ ______ ______ ______ ______ ______ ______ ______ ______ ______ ______ ______ ______ ______ ______ ______ ______ ______ TOTAL 514 304 171 158 256 147 97 154 260 353 659 273 181 189 232 348 4296 TOTAL NUMBER OF OBSERVATIONS: 4296 TOTAL NUMBER OF VALID OBSERVATIONS: 4296 TOTAL NUMBER OF MISSING OBSERVATIONS: 0 PERCENT DATA RECOVERY FOR THIS PERIOD: 100.0 % MEAN WIND SPEED FOR THIS PERIOD: 6.7 MPH TOTAL NUMBER OF OBSERVATIONS WITH BACKUP DATA: 0 PERCENTAGE OCCURRENCE OF STABILITY CLASSES A B C D E F G 8.31 6.68 6.52 19.53 22.18 13.62 23.16 DISTRIBUTION OF WIND DIRECTION VS STABILITY N NNE NE ENE E ESE SE SSE S SSW SW WSW W WNW NW NNW CALM A 2 3 4 7 13 38 22 39 52 44 63 31 19 9 6 5 0 B 2 4 9 19 25 16 16 27 39 38 55 19 8 3 2 5 0 C 4 9 13 12 25 10 12 22 42 41 50 10 9 4 9 8 0 D 41 38 44 38 91 31 21 29 69 86 161 61 38 29 25 37 0 E 60 45 31 38 88 48 15 23 37 102 214 88 38 48 40 38 0 F 75 35 35 22 11 1 10 9 13 36 99 50 39 47 54 49 0 G 330 170 35 22 3 3 1 5 8 6 17 14 30 49 96 206 0 TOTAL 514 304 171 158 256 147 97 154 260 353 659 273 181 189 232 348 0 ARIZONA PUBLIC SERVICE CO. - PALO VERDE NUCLEAR GENERATING STATION JOINT FREQUENCY DISTRIBUTION FOR THE PERIOD 1/01/2016 TO 12/31/2016 *** ANNUAL *** STABILITY CLASS A STABILITY BASED ON: DELTA T BETWEEN 200.0 AND 35.0 FEET WIND MEASURED AT: 35.0 FEET WIND THRESHOLD AT: .75 MPH JOINT FREQUENCY DISTRIBUTION OF WIND SPEED AND DIRECTION IN HOURS AT 35.00 FEET SPEED (MPH) N NNE NE ENE E ESE SE SSE S SSW SW WSW W WNW NW NNW TOTAL ___________ _____ CALM 0 .76- 1.50 0 0 0 0 0 0 0 0 0 0 0 0 0 0 0 0 0 1.51- 2.50 0 0 0 0 0 0 0 0 0 0 0 0 0 0 0 0 0 2.51- 3.50 0 0 0 0 0 0 0 0 0 0 0 0 0 0 0 0 0 3.51- 4.50 0 0 1 0 0 0 0 0 0 0 0 0 0 0 0 0 1 4.51- 5.50 0 0 1 1 2 1 3 2 3 0 1 0 0 0 0 0 14 5.51- 6.50 0 1 0 3 4 4 6 14 28 13 5 2 0 0 0 1 81 6.51- 8.50 1 2 3 6 9 15 21 32 53 28 39 17 9 6 5 1 247 8.51-11.50 1 2 0 5 11 31 1 9 19 35 51 25 22 9 7 5 233 11.51-14.50 1 1 5 1 2 3 4 2 7 17 35 14 6 4 6 3 111 14.51-20.50 0 0 5 4 2 2 0 2 5 14 6 2 2 4 0 4 52 >20.50 1 0 1 0 0 0 0 0 0 2 6 1 0 1 1 0 13 ___________ ______ ______ ______ ______ ______ ______ ______ ______ ______ ______ ______ ______ ______ ______ ______ ______ ______ TOTAL 4 6 16 20 30 56 35 61 115 109 143 61 39 24 19 14 752
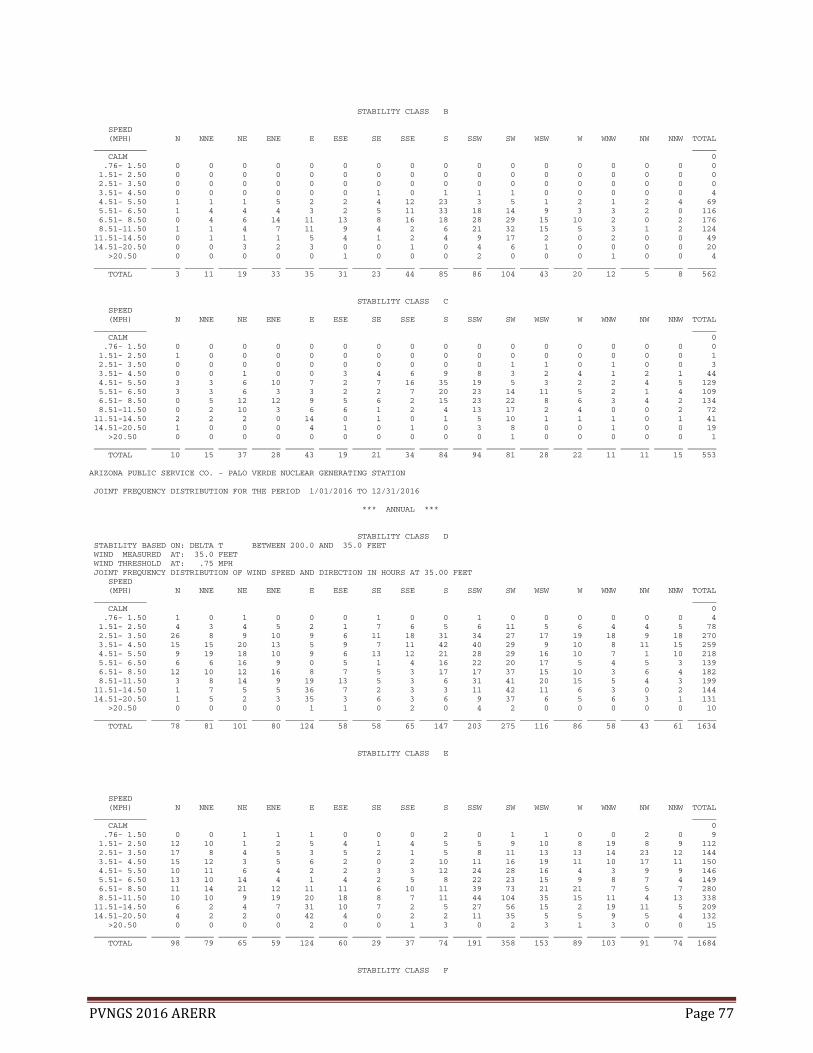
PVNGS 2016 ARERR Page 77
STABILITY CLASS B SPEED (MPH) N NNE NE ENE E ESE SE SSE S SSW SW WSW W WNW NW NNW TOTAL ___________ _____ CALM 0 .76- 1.50 0 0 0 0 0 0 0 0 0 0 0 0 0 0 0 0 0 1.51- 2.50 0 0 0 0 0 0 0 0 0 0 0 0 0 0 0 0 0 2.51- 3.50 0 0 0 0 0 0 0 0 0 0 0 0 0 0 0 0 0 3.51- 4.50 0 0 0 0 0 0 1 0 1 1 1 0 0 0 0 0 4 4.51- 5.50 1 1 1 5 2 2 4 12 23 3 5 1 2 1 2 4 69 5.51- 6.50 1 4 4 4 3 2 5 11 33 18 14 9 3 3 2 0 116 6.51- 8.50 0 4 6 14 11 13 8 16 18 28 29 15 10 2 0 2 176 8.51-11.50 1 1 4 7 11 9 4 2 6 21 32 15 5 3 1 2 124 11.51-14.50 0 1 1 1 5 4 1 2 4 9 17 2 0 2 0 0 49 14.51-20.50 0 0 3 2 3 0 0 1 0 4 6 1 0 0 0 0 20 >20.50 0 0 0 0 0 1 0 0 0 2 0 0 0 1 0 0 4 ___________ ______ ______ ______ ______ ______ ______ ______ ______ ______ ______ ______ ______ ______ ______ ______ ______ ______ TOTAL 3 11 19 33 35 31 23 44 85 86 104 43 20 12 5 8 562 STABILITY CLASS C SPEED (MPH) N NNE NE ENE E ESE SE SSE S SSW SW WSW W WNW NW NNW TOTAL ___________ _____ CALM 0 .76- 1.50 0 0 0 0 0 0 0 0 0 0 0 0 0 0 0 0 0 1.51- 2.50 1 0 0 0 0 0 0 0 0 0 0 0 0 0 0 0 1 2.51- 3.50 0 0 0 0 0 0 0 0 0 0 1 1 0 1 0 0 3 3.51- 4.50 0 0 1 0 0 3 4 6 9 8 3 2 4 1 2 1 44 4.51- 5.50 3 3 6 10 7 2 7 16 35 19 5 3 2 2 4 5 129 5.51- 6.50 3 3 6 3 3 2 2 7 20 23 14 11 5 2 1 4 109 6.51- 8.50 0 5 12 12 9 5 6 2 15 23 22 8 6 3 4 2 134 8.51-11.50 0 2 10 3 6 6 1 2 4 13 17 2 4 0 0 2 72 11.51-14.50 2 2 2 0 14 0 1 0 1 5 10 1 1 1 0 1 41 14.51-20.50 1 0 0 0 4 1 0 1 0 3 8 0 0 1 0 0 19 >20.50 0 0 0 0 0 0 0 0 0 0 1 0 0 0 0 0 1 ___________ ______ ______ ______ ______ ______ ______ ______ ______ ______ ______ ______ ______ ______ ______ ______ ______ ______ TOTAL 10 15 37 28 43 19 21 34 84 94 81 28 22 11 11 15 553 ARIZONA PUBLIC SERVICE CO. - PALO VERDE NUCLEAR GENERATING STATION JOINT FREQUENCY DISTRIBUTION FOR THE PERIOD 1/01/2016 TO 12/31/2016 *** ANNUAL *** STABILITY CLASS D STABILITY BASED ON: DELTA T BETWEEN 200.0 AND 35.0 FEET WIND MEASURED AT: 35.0 FEET WIND THRESHOLD AT: .75 MPH JOINT FREQUENCY DISTRIBUTION OF WIND SPEED AND DIRECTION IN HOURS AT 35.00 FEET SPEED (MPH) N NNE NE ENE E ESE SE SSE S SSW SW WSW W WNW NW NNW TOTAL ___________ _____ CALM 0 .76- 1.50 1 0 1 0 0 0 1 0 0 1 0 0 0 0 0 0 4 1.51- 2.50 4 3 4 5 2 1 7 6 5 6 11 5 6 4 4 5 78 2.51- 3.50 26 8 9 10 9 6 11 18 31 34 27 17 19 18 9 18 270 3.51- 4.50 15 15 20 13 5 9 7 11 42 40 29 9 10 8 11 15 259 4.51- 5.50 9 19 18 10 9 6 13 12 21 28 29 16 10 7 1 10 218 5.51- 6.50 6 6 16 9 0 5 1 4 16 22 20 17 5 4 5 3 139 6.51- 8.50 12 10 12 16 8 7 5 3 17 17 37 15 10 3 6 4 182 8.51-11.50 3 8 14 9 19 13 5 3 6 31 41 20 15 5 4 3 199 11.51-14.50 1 7 5 5 36 7 2 3 3 11 42 11 6 3 0 2 144 14.51-20.50 1 5 2 3 35 3 6 3 6 9 37 6 5 6 3 1 131 >20.50 0 0 0 0 1 1 0 2 0 4 2 0 0 0 0 0 10 ___________ ______ ______ ______ ______ ______ ______ ______ ______ ______ ______ ______ ______ ______ ______ ______ ______ ______ TOTAL 78 81 101 80 124 58 58 65 147 203 275 116 86 58 43 61 1634 STABILITY CLASS E SPEED (MPH) N NNE NE ENE E ESE SE SSE S SSW SW WSW W WNW NW NNW TOTAL ___________ _____ CALM 0 .76- 1.50 0 0 1 1 1 0 0 0 2 0 1 1 0 0 2 0 9 1.51- 2.50 12 10 1 2 5 4 1 4 5 5 9 10 8 19 8 9 112 2.51- 3.50 17 8 4 5 3 5 2 1 5 8 11 13 13 14 23 12 144 3.51- 4.50 15 12 3 5 6 2 0 2 10 11 16 19 11 10 17 11 150 4.51- 5.50 10 11 6 4 2 2 3 3 12 24 28 16 4 3 9 9 146 5.51- 6.50 13 10 14 4 1 4 2 5 8 22 23 15 9 8 7 4 149 6.51- 8.50 11 14 21 12 11 11 6 10 11 39 73 21 21 7 5 7 280 8.51-11.50 10 10 9 19 20 18 8 7 11 44 104 35 15 11 4 13 338 11.51-14.50 6 2 4 7 31 10 7 2 5 27 56 15 2 19 11 5 209 14.51-20.50 4 2 2 0 42 4 0 2 2 11 35 5 5 9 5 4 132 >20.50 0 0 0 0 2 0 0 1 3 0 2 3 1 3 0 0 15 ___________ ______ ______ ______ ______ ______ ______ ______ ______ ______ ______ ______ ______ ______ ______ ______ ______ ______ TOTAL 98 79 65 59 124 60 29 37 74 191 358 153 89 103 91 74 1684 STABILITY CLASS F

PVNGS 2016 ARERR Page 78
SPEED (MPH) N NNE NE ENE E ESE SE SSE S SSW SW WSW W WNW NW NNW TOTAL ___________ _____ CALM 0 .76- 1.50 0 0 1 1 0 1 0 1 0 1 0 0 0 0 0 0 5 1.51- 2.50 13 6 7 2 2 2 5 4 3 1 9 13 11 17 14 7 116 2.51- 3.50 25 12 8 10 4 3 5 4 1 7 14 10 17 17 26 22 185 3.51- 4.50 21 10 7 8 2 3 0 0 5 15 20 16 19 20 28 25 199 4.51- 5.50 22 12 12 3 2 1 5 1 6 17 36 23 9 10 14 13 186 5.51- 6.50 10 13 9 4 2 1 4 2 2 17 26 16 11 8 8 19 152 6.51- 8.50 16 11 11 10 1 2 4 2 4 32 61 22 10 10 14 13 223 8.51-11.50 5 6 6 6 0 1 1 1 1 20 31 9 5 16 9 12 129 11.51-14.50 0 1 1 1 2 0 1 0 0 1 0 1 1 0 0 4 13 14.51-20.50 2 0 0 2 5 0 0 0 0 0 1 0 0 0 0 0 10 >20.50 0 0 0 0 0 0 0 0 0 0 0 0 0 0 1 0 1 ___________ ______ ______ ______ ______ ______ ______ ______ ______ ______ ______ ______ ______ ______ ______ ______ ______ ______ TOTAL 114 71 62 47 20 14 25 15 22 111 198 110 83 98 114 115 1219 ARIZONA PUBLIC SERVICE CO. - PALO VERDE NUCLEAR GENERATING STATION JOINT FREQUENCY DISTRIBUTION FOR THE PERIOD 1/01/2016 TO 12/31/2016 *** ANNUAL *** STABILITY CLASS G STABILITY BASED ON: DELTA T BETWEEN 200.0 AND 35.0 FEET WIND MEASURED AT: 35.0 FEET WIND THRESHOLD AT: .75 MPH JOINT FREQUENCY DISTRIBUTION OF WIND SPEED AND DIRECTION IN HOURS AT 35.00 FEET SPEED (MPH) N NNE NE ENE E ESE SE SSE S SSW SW WSW W WNW NW NNW TOTAL ___________ _____ CALM 0 .76- 1.50 0 1 0 0 0 0 1 0 0 0 0 0 2 1 2 2 9 1.51- 2.50 39 17 6 3 5 2 2 1 2 4 3 10 17 25 39 45 220 2.51- 3.50 131 34 13 13 5 11 5 7 3 6 13 6 15 54 82 119 517 3.51- 4.50 196 64 14 15 3 6 7 3 4 5 7 9 23 25 56 146 583 4.51- 5.50 160 66 10 5 1 5 7 0 2 1 8 6 4 7 28 77 387 5.51- 6.50 77 43 14 3 1 0 2 2 2 4 2 5 2 6 9 28 200 6.51- 8.50 83 37 5 4 1 0 1 1 1 4 3 2 2 0 2 31 177 8.51-11.50 25 19 6 2 0 0 0 0 0 2 0 0 0 0 1 4 59 11.51-14.50 1 0 0 2 0 1 0 0 0 0 0 0 0 0 0 0 4 14.51-20.50 0 0 0 0 0 0 0 0 0 0 0 0 0 0 0 0 0 >20.50 0 0 0 0 0 0 0 0 0 0 0 0 0 0 1 0 1 ___________ ______ ______ ______ ______ ______ ______ ______ ______ ______ ______ ______ ______ ______ ______ ______ ______ ______ TOTAL 712 281 68 47 16 25 25 14 14 26 36 38 65 118 220 452 2157 STABILITY CLASS ALL SPEED (MPH) N NNE NE ENE E ESE SE SSE S SSW SW WSW W WNW NW NNW TOTAL ___________ _____ CALM 0 .76- 1.50 1 1 3 2 1 1 2 1 2 2 1 1 2 1 4 2 27 1.51- 2.50 69 36 18 12 14 9 15 15 15 16 32 38 42 65 65 66 527 2.51- 3.50 199 62 34 38 21 25 23 30 40 55 66 47 64 104 140 171 1119 3.51- 4.50 247 101 46 41 16 23 19 22 71 80 76 55 67 64 114 198 1240 4.51- 5.50 205 112 54 38 25 19 42 46 102 92 112 65 31 30 58 118 1149 5.51- 6.50 110 80 63 30 14 18 22 45 109 119 104 75 35 31 32 59 946 6.51- 8.50 123 83 70 74 50 53 51 66 119 171 264 100 68 31 36 60 1419 8.51-11.50 45 48 49 51 67 78 20 24 47 166 276 106 66 44 26 41 1154 11.51-14.50 11 14 18 17 90 25 16 9 20 70 160 44 16 29 17 15 571 14.51-20.50 8 7 12 11 91 10 6 9 13 41 93 14 12 20 8 9 364 >20.50 1 0 1 0 3 2 0 3 3 8 11 4 1 5 3 0 45 ___________ ______ ______ ______ ______ ______ ______ ______ ______ ______ ______ ______ ______ ______ ______ ______ ______ ______ TOTAL 1019 544 368 314 392 263 216 270 541 820 1195 549 404 424 503 739 8561 TOTAL NUMBER OF OBSERVATIONS: 8568 TOTAL NUMBER OF VALID OBSERVATIONS: 8561 TOTAL NUMBER OF MISSING OBSERVATIONS: 7 PERCENT DATA RECOVERY FOR THIS PERIOD: 99.9 % MEAN WIND SPEED FOR THIS PERIOD: 6.7 MPH TOTAL NUMBER OF OBSERVATIONS WITH BACKUP DATA: 0 PERCENTAGE OCCURRENCE OF STABILITY CLASSES A B C D E F G 8.78 6.56 6.46 19.09 19.67 14.24 25.20 DISTRIBUTION OF WIND DIRECTION VS STABILITY N NNE NE ENE E ESE SE SSE S SSW SW WSW W WNW NW NNW CALM A 4 6 16 20 30 56 35 61 115 109 143 61 39 24 19 14 0 B 3 11 19 33 35 31 23 44 85 86 104 43 20 12 5 8 0 C 10 15 37 28 43 19 21 34 84 94 81 28 22 11 11 15 0 D 78 81 101 80 124 58 58 65 147 203 275 116 86 58 43 61 0 E 98 79 65 59 124 60 29 37 74 191 358 153 89 103 91 74 0 F 114 71 62 47 20 14 25 15 22 111 198 110 83 98 114 115 0 G 712 281 68 47 16 25 25 14 14 26 36 38 65 118 220 452 0 TOTAL 1019 544 368 314 392 263 216 270 541 820 1195 549 404 424 503 739 0

PVNGS 2016 ARERR Page 79
APPENDIX C
DOSE CALCULATIONS

PVNGS 2016 ARERR Page 80
GASEOUS EFFLUENT DOSE CALCULATIONS Doses to the maximum individual and the surrounding population resulting from the release of radioactive material in gaseous effluents from the Palo Verde Nuclear Generating Station were calculated using the GASPAR computer program. The radionuclides considered in the dose calculations were tritium, iodine-131, iodine-132, iodine-133, iodine-135, all noble gases, and particulates having a half-life greater than eight days and for which dose factors are contained in NUREG-0172. Locations selected for individual dose calculations included for each sector, the site boundary, and within five miles, if present, the nearest residence, the nearest garden, and the nearest milk animal. GASPAR implements the radiological dose models of Regulatory Guide 1.109 to determine the radiation exposure to man from four principal atmospheric exposure pathways: plume, ground deposition, inhalation, and ingestion. Doses to the maximum individual and the population were calculated as a function of age group and pathway for significant body organs.
Table 43 presents the doses on a quarterly, semiannual and annual basis for the Energy Information Center. An occupancy factor of 1.0 (implying continuous occupancy over the entire year) was considered for the Energy Information Center and the exposure pathways considered to calculate its doses were plume, ground deposition, and inhalation. Dose to the special location for 2016 was 1.65 millirem. This is well within the 25 mrem/yr limit of 40 CFR 190.
Table 44 presents the population dose.
Table 45 summarizes the individual doses and compares the result to PVNGS ODCM Requirement limits. The site boundary and residence locations for which data are presented represent the highest annual doses.
Based on results obtained by placing TLDs on the site boundary in each sector, the net dose for this reporting period, from direct-radiation, (plume and ground deposition) from all three units was indistinguishable from preoperational values of 8 - 14 μR/hr (17 - 30 mR/Std Qtr).
There were no liquid effluents associated with the operation of this facility.

PVNGS 2016 ARERR Page 81
Dose Calculation Models The GASPAR computer code was used to evaluate the radiological consequences of the routine release of gaseous effluents. GASPAR implements the dose calculational methodologies of Regu- latory Guide 1.109, Revision 1.
Source terms for each quarter are combined with station-specific demographic data and each quarter’s atmospheric diffusion estimates for gaseous dose calculations.
Atmospheric diffusion estimates are generated by the XOQDOQ computer code using onsite meteorological data as input. Additional input to GASPAR includes the following site-specific data:
0 to 5 mile nearest residence, milk animal and garden in each of the 16 compass sectors, based on the 2016 Land Use Census.
0 to 10 mile population from the PVNGS Emergency Plan, Rev 47.
The 10 to 50 mile population distribution from the PVNGS UFSAR, Figure 2.1-12.
The population distribution of metropolitan Phoenix greater than 50 miles from PVNGS, based on the 1980 federal census results, is conservatively included in the 40 to 50 mile sectors (NE=123; ENE=140,097; E=621,130; ESE=8,392).
Absolute humidity of 6.0 g/m3 from the PVNGS UFSAR, Table 2.3-16.
The fraction of the year that vegetables are grown (0.667) from the PVNGS ER-OL, Section 2.1.3.4, Table 2.1-8.
The fraction of daily feed derived from pasture while on pasture (0.35) and length of grazing season for milk animals beyond 5 miles (0.75) from the PVNGS ER-OL, Section 2.1.3.4.3.
The fraction of daily feed derived from pasture while on pasture (0.05) and length of grazing season for meat animals (0.25) from the PVNGS ER-OL, Section 2.1.3.4.4.
There were three (3) sectors containing milk animal (goat or cow) locations within five (5) miles. For calculation purposes these milk animals are assumed to be fed 100% on pasture grass during the year.
Other values used for input to GASPAR are default values from Regulatory Guide 1.109, Rev. 1.

PVNGS 2016 ARERR Page 82
Table 43: Doses To Special Locations For 2016
ENERGY INFORMATION CENTER LOCATED ONSITE 0.45 MILE S FROM UNIT 1, 0.29 MILE SSE FROM UNIT 2 AND 0.20 MILE ESE FROM UNIT 3.
(MREM) T.BODY GI-TRACT BONE LIVER KIDNEY THYROID LUNG SKIN
1ST QUARTER
ADULT 6.71E-01 6.71E-01 1.22E-03 6.71E-01 6.71E-01 6.71E-01 6.71E-01 6.71E-01TEEN 6.75E-01 6.75E-01 1.22E-03 6.75E-01 6.75E-01 6.75E-01 6.75E-01 6.76E-01CHILD 5.97E-01 5.97E-01 1.22E-03 5.97E-01 5.97E-01 5.97E-01 5.97E-01 5.98E-01INFANT 3.44E-01 3.44E-01 1.22E-03 3.44E-01 3.44E-01 3.44E-01 3.44E-01 3.44E-01
2ND QUARTER
ADULT 1.95E-01 1.95E-01 9.72E-03 1.95E-01 1.95E-01 1.95E-01 1.97E-01 1.97E-01TEEN 1.97E-01 1.97E-01 9.72E-03 1.97E-01 1.97E-01 1.97E-01 2.01E-01 1.99E-01CHILD 1.75E-01 1.75E-01 9.72E-03 1.75E-01 1.75E-01 1.75E-01 1.78E-01 1.77E-01INFANT 1.05E-01 1.05E-01 9.72E-03 1.05E-01 1.05E-01 1.05E-01 1.07E-01 1.07E-01
1ST SEMI-ANNUAL
ADULT 8.66E-01 8.66E-01 1.09E-02 8.66E-01 8.66E-01 8.66E-01 8.68E-01 8.69E-01TEEN 8.72E-01 8.72E-01 1.09E-02 8.72E-01 8.72E-01 8.72E-01 8.76E-01 8.75E-01CHILD 7.72E-01 7.72E-01 1.09E-02 7.72E-01 7.72E-01 7.72E-01 7.75E-01 7.75E-01INFANT 4.49E-01 4.49E-01 1.09E-02 4.49E-01 4.49E-01 4.49E-01 4.50E-01 4.51E-01
3RD QUARTER
ADULT 2.30E-01 2.30E-01 3.39E-04 2.30E-01 2.30E-01 2.30E-01 2.30E-01 2.31E-01TEEN 2.32E-01 2.32E-01 3.39E-04 2.32E-01 2.32E-01 2.32E-01 2.32E-01 2.32E-01CHILD 2.05E-01 2.05E-01 3.39E-04 2.05E-01 2.05E-01 2.05E-01 2.05E-01 2.05E-01INFANT 1.18E-01 1.18E-01 3.39E-04 1.18E-01 1.18E-01 1.18E-01 1.18E-01 1.18E-01
4TH QUARTER
ADULT 5.56E-01 5.56E-01 2.08E-03 5.56E-01 5.56E-01 5.56E-01 5.56E-01 5.56E-01TEEN 5.60E-01 5.60E-01 2.08E-03 5.60E-01 5.60E-01 5.60E-01 5.60E-01 5.60E-01CHILD 4.95E-01 4.95E-01 2.08E-03 4.95E-01 4.95E-01 4.96E-01 4.96E-01 4.95E-01INFANT 2.86E-01 2.86E-01 2.08E-03 2.86E-01 2.86E-01 2.86E-01 2.86E-01 1.29E-01
2ND SEMI-ANNUAL
ADULT 7.86E-01 7.86E-01 2.42E-03 7.86E-01 7.86E-01 7.86E-01 7.86E-01 7.86E-01TEEN 7.92E-01 7.92E-01 2.42E-03 7.92E-01 7.92E-01 7.92E-01 7.92E-01 7.92E-01CHILD 7.00E-01 7.00E-01 2.42E-03 7.00E-01 7.00E-01 7.01E-01 7.01E-01 6.99E-01INFANT 4.04E-01 4.04E-01 2.42E-03 4.04E-01 4.04E-01 4.04E-01 4.04E-01 2.47E-01
ANNUAL
ADULT 1.65E+00 1.65E+00 1.34E-02 1.65E+00 1.65E+00 1.65E+00 1.65E+00 1.65E+00TEEN 1.66E+00 1.66E+00 1.34E-02 1.66E+00 1.66E+00 1.66E+00 1.67E+00 1.67E+00CHILD 1.47E+00 1.47E+00 1.34E-02 1.47E+00 1.47E+00 1.47E+00 1.48E+00 1.47E+00INFANT 8.52E-01 8.52E-01 1.34E-02 8.52E-01 8.52E-01 8.52E-01 8.54E-01 6.98E-01

PVNGS 2016 ARERR Page 83
Table 44:
Integrated Population Dose for 2016 January through March
PLUME 1.20E-04 1.20E-04 1.20E-04 1.20E-04 1.20E-04 1.20E-04 1.20E-04 2.23E-04
0.00% 0.00% 90.84% 0.00% 0.00% 0.00% 0.00% 0.00%
GROUND 1.21E-05 1.21E-05 1.21E-05 1.21E-05 1.21E-05 1.21E-05 1.21E-05 1.42E-05
0.00% 0.00% 9.16% 0.00% 0.00% 0.00% 0.00% 0.00%
INHAL 2.15E+00 2.15E+00 < LLD 2.15E+00 2.15E+00 2.15E+00 2.15E+00 2.15E+00
25.83% 25.83% 0.00% 25.83% 25.83% 25.83% 25.83% 25.83%
VEGET 5.33E+00 5.33E+00 < LLD 5.33E+00 5.33E+00 5.33E+00 5.33E+00 5.33E+00
64.04% 64.04% 0.00% 64.04% 64.04% 64.04% 64.04% 64.04%
COW MILK 5.79E-01 5.79E-01 < LLD 5.79E-01 5.79E-01 5.79E-01 5.79E-01 5.79E-01
6.96% 6.96% 0.00% 6.96% 6.96% 6.96% 6.96% 6.96%
MEAT 2.64E-01 2.64E-01 < LLD 2.64E-01 2.64E-01 2.64E-01 2.64E-01 2.64E-01
3.17% 3.17% 0.00% 3.17% 3.17% 3.17% 3.17% 3.17%
*TOTAL* 8.33E+00 8.33E+00 1.32E-04 8.33E+00 8.33E+00 8.33E+00 8.33E+00 8.33E+00
PER CAPITA DOSE (REM) 4.25E-06 4.25E-06 6.74E-11 4.25E-06 4.25E-06 4.25E-06 4.25E-06 4.25E-06
April through June
PLUME 1.87E-04 1.87E-04 1.87E-04 1.87E-04 1.87E-04 1.87E-04 1.87E-04 4.23E-04
0.01% 0.01% 2.48% 0.01% 0.01% 0.01% 0.01% 0.02%
GROUND 7.29E-03 7.29E-03 7.29E-03 7.29E-03 7.29E-03 7.29E-03 7.29E-03 8.57E-03
0.26% 0.26% 96.94% 0.26% 0.26% 0.26% 0.26% 0.31%
INHAL 8.24E-01 8.24E-01 2.14E-05 8.24E-01 8.24E-01 8.24E-01 8.30E-01 8.24E-01
29.90% 29.89% 0.28% 29.90% 29.90% 29.90% 30.05% 29.88%
VEGET 1.65E+00 1.66E+00 2.11E-05 1.65E+00 1.65E+00 1.65E+00 1.65E+00 1.65E+00
60.04% 60.05% 0.28% 60.04% 60.04% 60.04% 59.91% 60.01%
COW 2.08E-01 2.08E-01 5.34E-07 2.08E-01 2.08E-01 2.08E-01 2.08E-01 2.08E-01
7.56% 7.56% 0.01% 7.56% 7.56% 7.56% 7.55% 7.56%
MEAT 6.14E-02 6.14E-02 3.47E-07 6.14E-02 6.14E-02 6.14E-02 6.14E-02 6.14E-02
2.23% 2.23% 0.00% 2.23% 2.23% 2.23% 2.22% 2.23%
*TOTAL* 2.76E+00 2.76E+00 7.52E-03 2.76E+00 2.75E+00 2.76E+00 2.76E+00 2.76E+00
PER CAPITA DOSE (REM) 1.41E-06 1.41E-06 3.84E-09 1.41E-06 1.40E-06 1.41E-06 1.41E-06 1.41E-06
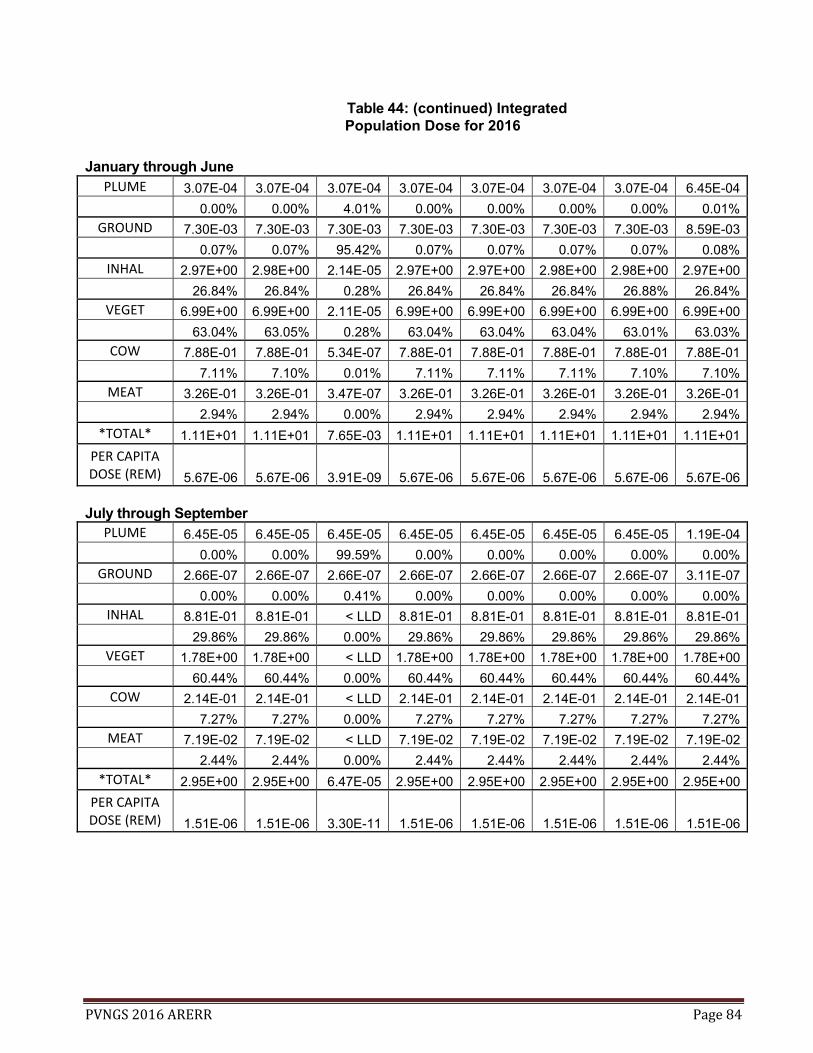
PVNGS 2016 ARERR Page 84
Table 44: (continued) Integrated Population Dose for 2016
January through June PLUME 3.07E-04 3.07E-04 3.07E-04 3.07E-04 3.07E-04 3.07E-04 3.07E-04 6.45E-04
0.00% 0.00% 4.01% 0.00% 0.00% 0.00% 0.00% 0.01%
GROUND 7.30E-03 7.30E-03 7.30E-03 7.30E-03 7.30E-03 7.30E-03 7.30E-03 8.59E-03
0.07% 0.07% 95.42% 0.07% 0.07% 0.07% 0.07% 0.08%
INHAL 2.97E+00 2.98E+00 2.14E-05 2.97E+00 2.97E+00 2.98E+00 2.98E+00 2.97E+00
26.84% 26.84% 0.28% 26.84% 26.84% 26.84% 26.88% 26.84%
VEGET 6.99E+00 6.99E+00 2.11E-05 6.99E+00 6.99E+00 6.99E+00 6.99E+00 6.99E+00
63.04% 63.05% 0.28% 63.04% 63.04% 63.04% 63.01% 63.03%
COW 7.88E-01 7.88E-01 5.34E-07 7.88E-01 7.88E-01 7.88E-01 7.88E-01 7.88E-01
7.11% 7.10% 0.01% 7.11% 7.11% 7.11% 7.10% 7.10%
MEAT 3.26E-01 3.26E-01 3.47E-07 3.26E-01 3.26E-01 3.26E-01 3.26E-01 3.26E-01
2.94% 2.94% 0.00% 2.94% 2.94% 2.94% 2.94% 2.94%
*TOTAL* 1.11E+01 1.11E+01 7.65E-03 1.11E+01 1.11E+01 1.11E+01 1.11E+01 1.11E+01
PER CAPITA DOSE (REM) 5.67E-06 5.67E-06 3.91E-09 5.67E-06 5.67E-06 5.67E-06 5.67E-06 5.67E-06
July through September
PLUME 6.45E-05 6.45E-05 6.45E-05 6.45E-05 6.45E-05 6.45E-05 6.45E-05 1.19E-04
0.00% 0.00% 99.59% 0.00% 0.00% 0.00% 0.00% 0.00%
GROUND 2.66E-07 2.66E-07 2.66E-07 2.66E-07 2.66E-07 2.66E-07 2.66E-07 3.11E-07
0.00% 0.00% 0.41% 0.00% 0.00% 0.00% 0.00% 0.00%
INHAL 8.81E-01 8.81E-01 < LLD 8.81E-01 8.81E-01 8.81E-01 8.81E-01 8.81E-01
29.86% 29.86% 0.00% 29.86% 29.86% 29.86% 29.86% 29.86%
VEGET 1.78E+00 1.78E+00 < LLD 1.78E+00 1.78E+00 1.78E+00 1.78E+00 1.78E+00
60.44% 60.44% 0.00% 60.44% 60.44% 60.44% 60.44% 60.44%
COW 2.14E-01 2.14E-01 < LLD 2.14E-01 2.14E-01 2.14E-01 2.14E-01 2.14E-01
7.27% 7.27% 0.00% 7.27% 7.27% 7.27% 7.27% 7.27%
MEAT 7.19E-02 7.19E-02 < LLD 7.19E-02 7.19E-02 7.19E-02 7.19E-02 7.19E-02
2.44% 2.44% 0.00% 2.44% 2.44% 2.44% 2.44% 2.44%
*TOTAL* 2.95E+00 2.95E+00 6.47E-05 2.95E+00 2.95E+00 2.95E+00 2.95E+00 2.95E+00
PER CAPITA DOSE (REM) 1.51E-06 1.51E-06 3.30E-11 1.51E-06 1.51E-06 1.51E-06 1.51E-06 1.51E-06
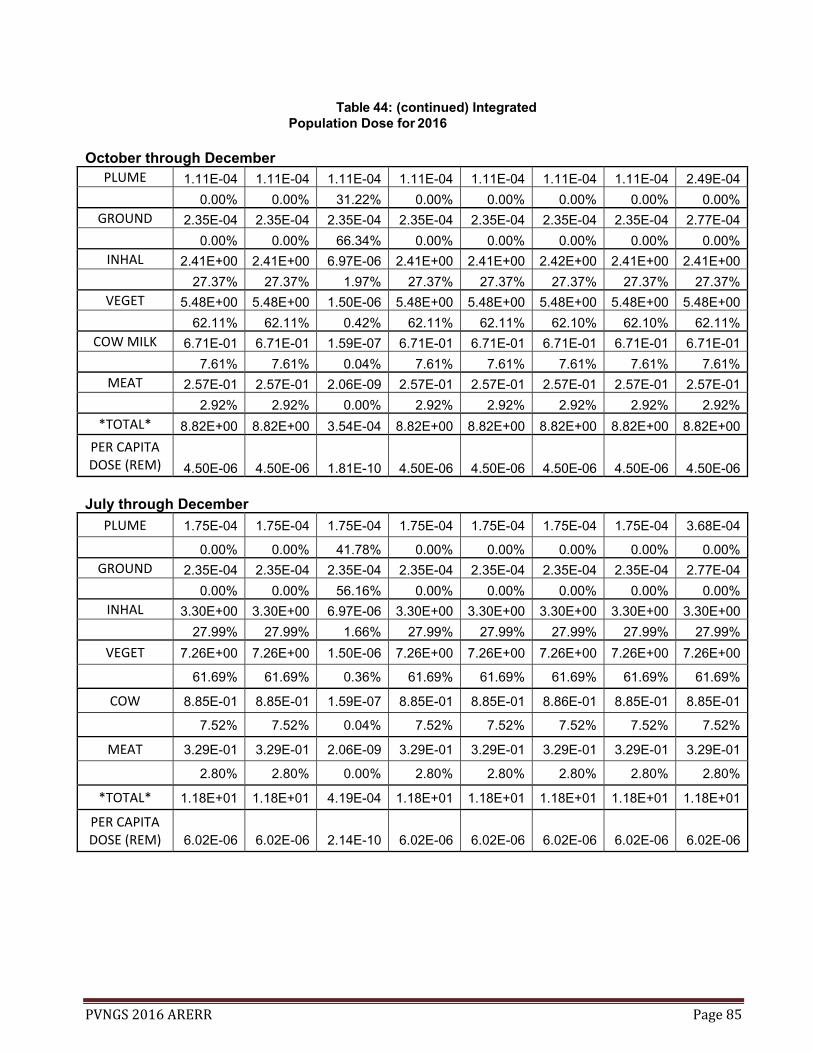
PVNGS 2016 ARERR Page 85
Table 44: (continued) Integrated Population Dose for 2016
October through December
PLUME 1.11E-04 1.11E-04 1.11E-04 1.11E-04 1.11E-04 1.11E-04 1.11E-04 2.49E-04
0.00% 0.00% 31.22% 0.00% 0.00% 0.00% 0.00% 0.00%
GROUND 2.35E-04 2.35E-04 2.35E-04 2.35E-04 2.35E-04 2.35E-04 2.35E-04 2.77E-04
0.00% 0.00% 66.34% 0.00% 0.00% 0.00% 0.00% 0.00%
INHAL 2.41E+00 2.41E+00 6.97E-06 2.41E+00 2.41E+00 2.42E+00 2.41E+00 2.41E+00
27.37% 27.37% 1.97% 27.37% 27.37% 27.37% 27.37% 27.37%
VEGET 5.48E+00 5.48E+00 1.50E-06 5.48E+00 5.48E+00 5.48E+00 5.48E+00 5.48E+00
62.11% 62.11% 0.42% 62.11% 62.11% 62.10% 62.10% 62.11%
COW MILK 6.71E-01 6.71E-01 1.59E-07 6.71E-01 6.71E-01 6.71E-01 6.71E-01 6.71E-01
7.61% 7.61% 0.04% 7.61% 7.61% 7.61% 7.61% 7.61%
MEAT 2.57E-01 2.57E-01 2.06E-09 2.57E-01 2.57E-01 2.57E-01 2.57E-01 2.57E-01
2.92% 2.92% 0.00% 2.92% 2.92% 2.92% 2.92% 2.92%
*TOTAL* 8.82E+00 8.82E+00 3.54E-04 8.82E+00 8.82E+00 8.82E+00 8.82E+00 8.82E+00
PER CAPITA DOSE (REM) 4.50E-06 4.50E-06 1.81E-10 4.50E-06 4.50E-06 4.50E-06 4.50E-06 4.50E-06
July through December
PLUME 1.75E-04 1.75E-04 1.75E-04 1.75E-04 1.75E-04 1.75E-04 1.75E-04 3.68E-04 0.00% 0.00% 41.78% 0.00% 0.00% 0.00% 0.00% 0.00%
GROUND 2.35E-04 2.35E-04 2.35E-04 2.35E-04 2.35E-04 2.35E-04 2.35E-04 2.77E-04
0.00% 0.00% 56.16% 0.00% 0.00% 0.00% 0.00% 0.00%
INHAL 3.30E+00 3.30E+00 6.97E-06 3.30E+00 3.30E+00 3.30E+00 3.30E+00 3.30E+00
27.99% 27.99% 1.66% 27.99% 27.99% 27.99% 27.99% 27.99%
VEGET 7.26E+00 7.26E+00 1.50E-06 7.26E+00 7.26E+00 7.26E+00 7.26E+00 7.26E+00
61.69% 61.69% 0.36% 61.69% 61.69% 61.69% 61.69% 61.69%
COW 8.85E-01 8.85E-01 1.59E-07 8.85E-01 8.85E-01 8.86E-01 8.85E-01 8.85E-01
7.52% 7.52% 0.04% 7.52% 7.52% 7.52% 7.52% 7.52%
MEAT 3.29E-01 3.29E-01 2.06E-09 3.29E-01 3.29E-01 3.29E-01 3.29E-01 3.29E-01
2.80% 2.80% 0.00% 2.80% 2.80% 2.80% 2.80% 2.80%
*TOTAL* 1.18E+01 1.18E+01 4.19E-04 1.18E+01 1.18E+01 1.18E+01 1.18E+01 1.18E+01
PER CAPITA DOSE (REM) 6.02E-06 6.02E-06 2.14E-10 6.02E-06 6.02E-06 6.02E-06 6.02E-06 6.02E-06

PVNGS 2016 ARERR Page 86
Table 44: (continued)
Integrated Population Dose for 2016
January through December
PLUME 4.82E-04 4.82E-04 4.82E-04 4.82E-04 4.82E-04 4.82E-04 4.82E-04 1.01E-03
0.00% 0.00% 5.97% 0.00% 0.00% 0.00% 0.00% 0.00%
GROUND 7.54E-03 7.54E-03 7.54E-03 7.54E-03 7.54E-03 7.54E-03 7.54E-03 8.86E-03
0.03% 0.03% 93.39% 0.03% 0.03% 0.03% 0.03% 0.04%
INHAL 6.27E+00
6.27E+00 2.84E-05 6.27E+00
6.27E+00
6.27E+00 6.28E+00
6.27E+00
27.43% 27.43% 0.35% 27.43% 27.43% 27.44% 27.45% 27.43%
VEGET 1.43E+01
1.43E+01 2.26E-05 1.43E+01
1.43E+01
1.43E+01 1.43E+01
1.43E+01
62.35% 62.35% 0.28% 62.35% 62.35% 62.34% 62.33% 62.34%
COW 1.67E+00
1.67E+00 6.93E-07 1.67E+00
1.67E+00
1.67E+00 1.67E+00
1.67E+00
7.32% 7.32% 0.01% 7.32% 7.32% 7.32% 7.32% 7.32%
MEAT 6.55E-01 6.55E-01 3.49E-07 6.55E-01 6.55E-01 6.55E-01 6.55E-01 6.55E-01
2.87% 2.87% 0.00% 2.87% 2.87% 2.87% 2.86% 2.87%
*TOTAL* 2.29E+01
2.29E+01 8.07E-03 2.29E+01
2.29E+01
2.29E+01 2.29E+01
2.29E+01
PER CAPITA DOSE (REM) 1.17E-05 1.17E-05 4.12E-09 1.17E-05 1.17E-05 1.17E-05 1.17E-05 1.17E-05

PVNGS 2016 ARERR Page 87
Table 45: Summary of Individual Doses for 2016
Unit Quarter 1 Quarter 2 Quarter 3 Quarter 4 Year total
Gamma Air Dose mrad 5.07E-04 3.29E-04 1.23E-04 3.72E-04 1.17E-03
ODCM Req. 4.1 Limit mrad 5.00E+00 5.00E+00 5.00E+00 5.00E+00 1.00E+01 % ODCM Limit % 1.01E-02 6.58E-03 2.46E-03 7.44E-03 1.17E-02
Beta Air Dose mrad 1.82E-04 1.41E-04 4.46E-05 1.49E-04 4.53E-04
ODCM Req. 4.1 Limit mrad 1.00E+01 1.00E+01 1.00E+01 1.00E+01 2.00E+01 % ODCM Limit % 1.82E-03 1.41E-03 4.46E-04 1.49E-03 2.27E-03 Maximum Individual Total Body mrem 3.37E-04 2.18E-04 8.14E-05 2.47E-04 7.78E-04 Skin mrem 5.41E-04 3.57E-04 1.31E-04 3.99E-04 1.26E-03 Site Boundary Location Unit 1 miles 1.70 SSE 0.78 NW 1.40 SSW 1.70 SSE 1.70 SSE Unit 2 miles 1.88 SSE 0.74 NW 1.14 SSW 1.88 SSE 1.88 SSE Unit 3 miles 1.73 SSE 0.65 NW 1.00 SSW 1.73 SSE 1.73 SSE
Maximum Organ Dose (excluding skin)
Age Infant Infant Infant Teen Teen Organ Bone Bone Bone Thyroid (2) Lung
mrem 1.85E-01 1.01E-01 7.94E-02 1.90E-01 4.86E-01
ODCM Req. 4.2 Limit mrem 7.50E+00 7.50E+00 7.50E+00 7.50E+00 1.50E+01 % ODCM Limit (1) % 2.47E+00 1.35E+00 1.06E+00 2.53E+00 3.24E+00 Location Unit 1 miles 2.84 NNE 2.84 NNE 2.84 NNE 2.74 S 2.74 S Unit 2 miles 3.05 NNE 3.05 NNE 3.05 NNE 2.56 S 2.56 S Unit 3 miles 3.28 NNE 3.28 NNE 3.28 NNE 2.35 S 2.35 S
Maximum Organ Dose excluding C-14 (3)
(excluding skin)
Age Teen Infant Teen Teen Teen Organ Thyroid (2) Thyroid Thyroid (2) Thyroid (2) Lung
mrem 1.74E-01 4.88E-02 7.41E-02 1.90E-01 4.86E-01
ODCM Req. 4.2 Limit 7.50E+00 7.50E+00 7.50E+00 7.50E+00 1.50E+01 % ODCM Limit (1) 2.32E+00 6.51E-01 9.88E-01 2.53E+00 3.24E+00
Organ dose from tritium only for Unit 2 location above
mrem
1.74E-01 4.72E-02 7.41E-02 1.90E-01 4.84E-01
Fraction of organ dose from tritium only for Unit 2 location above(2,3)
%
100.00%
96.72%
100.00%
100.00%
99.59%
X/Q for Unit 2 location above sec/m3 8.75E-07 4.73E-07 3.76E-07 7.96E-06 5.16E-06 D/Q for Unit 2 location above m-2 1.31E-09 1.82E-09 1.61E-09 2.58E-09 1.86E-09 Note 1: ODCM Requirement 5.1 has higher limits than ODCM Requirement 4.2, therefore the percent of limits are more
conservative based on ODCM Requirement 4.2 than on ODCM Requirement 5.1. Note 2: All organs except bone Note 3 Refer to discussion in section 10.4
PVNGS 2016 ARERR Page 88
APPENDIX D
NEI 07-07 GROUNDWATER PROTECTION INITIATIVE SAMPLING

■■ 'N...................
|'JPV-207A
^PZ-Sb
;.4 '’;-<M ^r'"'/ V
mm.-
A Af>pIeM''‘r.:Wm-
’MMvL-v. ^ ---—' gi
Slud'se Dispose Landflll|
oM'M,/'/'. &;i
; ^=A,ji¥#:Pyr19»AB
191A, PV-195Aia»»i«Y.».in9i.iid«i.ijii>>iiv>A
IWJ.!li*:^«lH
A PV-ca PV;193A*A^P:S
A
APP^
AERIALPHOTO: HELICOPTER PHOTOS, F
1Brown AND, Caldwell ■
EXPLANATION
PVNGS Well Locations and Aquifer Monitored A StiallowAquiferWell
85-Acre WSR Piezometer A Palo Verde Clay Aquifer Well A RegionalAquiferWell
PVNGS Boundary
FIGURE 1 SITE MAP
PALO VERDE NUCLEAR GENERATING STATION ARIZONA PUBLIC SERVICES
PVNGS2016ARERR Page 89

PVNGS 2016 ARERR Page 90
Field Sample ID Location ID Sample Date
Parameter Name
Report Result
Report
Units
Detected
Sample Purpose
PV-APP-10-0216 APP-10 02/04/2016 Tritium < 303 pCi/L N REG PV-APP-10-0216 APP-10 02/04/2016 Cesium-137 < 1.0 pCi/L N REG PV-APP-10-0216 APP-10 02/04/2016 Cobalt-60 < 2.0 pCi/L N REG PV-APP-10-0216 APP-10 02/04/2016 Cesium-134 < 2.1 pCi/L N REG PV-APP-10-0516 APP-10 05/26/2016 Tritium < 287 pCi/L N REG PV-APP-10-0516 APP-10 05/26/2016 Cesium-137 < 2.1 pCi/L N REG PV-APP-10-0516 APP-10 05/26/2016 Cobalt-60 < 1.4 pCi/L N REG PV-APP-10-0516 APP-10 05/26/2016 Cesium-134 < 1.7 pCi/L N REG PV-APP-10-0916 APP-10 09/21/2016 Tritium < 288 pCi/L N REG PV-APP-10-0916 APP-10 09/21/2016 Cesium-137 < 1.5 pCi/L N REG PV-APP-10-0916 APP-10 09/21/2016 Cobalt-60 < 0.5 pCi/L N REG PV-APP-10-0916 APP-10 09/21/2016 Cesium-134 < 1.3 pCi/L N REG PV-APP-10-1116 APP-10 11/16/2016 Tritium < 308 pCi/L N REG PV-APP-10-1116 APP-10 11/16/2016 Cesium-137 < 1.5 pCi/L N REG PV-APP-10-1116 APP-10 11/16/2016 Cobalt-60 < 0.7 pCi/L N REG PV-APP-10-1116 APP-10 11/16/2016 Cesium-134 < 1.0 pCi/L N REG PV-APP-12-0216 APP-12 02/04/2016 Tritium < 303 pCi/L N REG PV-APP-12-0216 APP-12 02/04/2016 Cesium-137 < 1.0 pCi/L N REG PV-APP-12-0216 APP-12 02/04/2016 Cobalt-60 < 1.4 pCi/L N REG PV-APP-12-0216 APP-12 02/04/2016 Cesium-134 < 1.6 pCi/L N REG PV-APP-12-0516 APP-12 05/26/2016 Tritium < 287 pCi/L N REG PV-APP-12-0516 APP-12 05/26/2016 Cesium-137 < 1.0 pCi/L N REG PV-APP-12-0516 APP-12 05/26/2016 Cobalt-60 < 1.4 pCi/L N REG PV-APP-12-0516 APP-12 05/26/2016 Cesium-134 < 1.5 pCi/L N REG PV-APP-12-0916 APP-12 09/21/2016 Tritium < 288 pCi/L N REG PV-APP-12-0916 APP-12 09/21/2016 Cesium-137 < 0.8 pCi/L N REG PV-APP-12-0916 APP-12 09/21/2016 Cobalt-60 < 0.5 pCi/L N REG PV-APP-12-0916 APP-12 09/21/2016 Cesium-134 < 1.1 pCi/L N REG PV-APP-12-1116 APP-12 11/08/2016 Tritium < 289 pCi/L N PV-APP-12-1116 APP-12 11/08/2016 Cesium-137 < 1.0 pCi/L N PV-APP-12-1116 APP-12 11/08/2016 Cobalt-60 < 1.2 pCi/L N PV-APP-12-1116 APP-12 11/08/2016 Cesium-134 < 10.0 pCi/L N PV-APP-15-0216 APP-15 02/01/2016 Tritium < 242 pCi/L N REG PV-APP-15-0216 APP-15 02/01/2016 Cesium-137 < 1.0 pCi/L N REG PV-APP-15-0216 APP-15 02/01/2016 Cobalt-60 < 1.4 pCi/L N REG PV-APP-15-0216 APP-15 02/01/2016 Cesium-134 < 1.4 pCi/L N REG PV-APP-15-1016 APP-15 10/04/2016 Tritium < 288.0 pCi/L N PV-APP-15-1016 APP-15 10/04/2016 Cesium-137 < 1.4 pCi/L N PV-APP-15-1016 APP-15 10/04/2016 Cobalt-60 < 1.1 pCi/L N PV-APP-15-1016 APP-15 10/04/2016 Cesium-134 < 1.0 pCi/L N PV-APP-18-0316 APP-18 03/16/2016 Tritium < 287 pCi/L N REG

PVNGS 2016 ARERR Page 91
PV-APP-18-0316 APP-18 03/16/2016 Cesium-137 < 3.4 pCi/L N REG PV-APP-18-0316 APP-18 03/16/2016 Cobalt-60 < 1.3 pCi/L N REG PV-APP-18-0316 APP-18 03/16/2016 Cesium-134 < 2.8 pCi/L N REG PV-APP-18-1116 APP-18 11/02/2016 Tritium < 285 pCi/L N REG PV-APP-18-1116 APP-18 11/02/2016 Cesium-137 < 0.9 pCi/L N REG PV-APP-18-1116 APP-18 11/02/2016 Cobalt-60 < 0.3 pCi/L N REG PV-APP-18-1116 APP-18 11/02/2016 Cesium-134 < 1.0 pCi/L N REG PV-APP-19-0216 APP-19 02/03/2016 Tritium < 303 pCi/L N REG PV-APP-19-0216 APP-19 02/03/2016 Cesium-137 < 1.1 pCi/L N REG PV-APP-19-0216 APP-19 02/03/2016 Cobalt-60 < 1.4 pCi/L N REG PV-APP-19-0216 APP-19 02/03/2016 Cesium-134 < 2.1 pCi/L N REG PV-APP-19-1116 APP-19 11/16/2016 Tritium < 308 pCi/L N REG PV-APP-19-1116 APP-19 11/16/2016 Cesium-137 < 0.5 pCi/L N REG PV-APP-19-1116 APP-19 11/16/2016 Cobalt-60 < 0.8 pCi/L N REG PV-APP-19-1116 APP-19 11/16/2016 Cesium-134 < 1.0 pCi/L N REG PV-APP-20-0216 APP-20 02/10/2016 Tritium < 303 pCi/L N REG PV-APP-20-0216 APP-20 02/10/2016 Cesium-137 < 1.4 pCi/L N REG PV-APP-20-0216 APP-20 02/10/2016 Cobalt-60 < 1.4 pCi/L N REG PV-APP-20-0216 APP-20 02/10/2016 Cesium-134 < 1.7 pCi/L N REG PV-APP-20-1116 APP-20 11/02/2016 Tritium < 285 pCi/L N REG PV-APP-20-1116 APP-20 11/02/2016 Cesium-137 < 1.1 pCi/L N REG PV-APP-20-1116 APP-20 11/02/2016 Cobalt-60 < 1.0 pCi/L N REG PV-APP-20-1116 APP-20 11/02/2016 Cesium-134 < 0.8 pCi/L N REG PV-APP-21-0216 APP-21 02/10/2016 Tritium < 303 pCi/L N REG PV-APP-21-0216 APP-21 02/10/2016 Cesium-137 < 1.2 pCi/L N REG PV-APP-21-0216 APP-21 02/10/2016 Cobalt-60 < 1.5 pCi/L N REG PV-APP-21-0216 APP-21 02/10/2016 Cesium-134 < 1.2 pCi/L N REG PV-APP-21-1116 APP-21 11/02/2016 Tritium < 285 pCi/L N REG PV-APP-21-1116 APP-21 11/02/2016 Cesium-137 < 0.9 pCi/L N REG PV-APP-21-1116 APP-21 11/02/2016 Cobalt-60 < 1.0 pCi/L N REG PV-APP-21-1116 APP-21 11/02/2016 Cesium-134 < 0.9 pCi/L N REG PV-APP-22-0216 APP-22 02/22/2016 Tritium < 299 pCi/L N REG PV-APP-22-0216 APP-22 02/22/2016 Cesium-137 < 1.2 pCi/L N REG PV-APP-22-0216 APP-22 02/22/2016 Cobalt-60 < 1.4 pCi/L N REG PV-APP-22-0216 APP-22 02/22/2016 Cesium-134 < 1.7 pCi/L N REG PV-APP-22-1016 APP-22 10/04/2016 Tritium < 288 pCi/L N PV-APP-22-1016 APP-22 10/04/2016 Cesium-137 < 1.4 pCi/L N PV-APP-22-1016 APP-22 10/04/2016 Cobalt-60 < 0.8 pCi/L N PV-APP-22-1016 APP-22 10/04/2016 Cesium-134 < 1.0 pCi/L N PV-APP-23-0216 APP-23 02/10/2016 Tritium < 303 pCi/L N REG PV-APP-23-0216 APP-23 02/10/2016 Cesium-137 < 1.3 pCi/L N REG PV-APP-23-0216 APP-23 02/10/2016 Cobalt-60 < 1.4 pCi/L N REG PV-APP-23-0216 APP-23 02/10/2016 Cesium-134 < 1.8 pCi/L N REG PV-APP-23-1016 APP-23 10/12/2016 Tritium < 288 pCi/L N REG

PVNGS 2016 ARERR Page 92
PV-APP-23-1016 APP-23 10/12/2016 Cesium-137 < 0.8 pCi/L N REG PV-APP-23-1016 APP-23 10/12/2016 Cobalt-60 < 0.8 pCi/L N REG PV-APP-23-1016 APP-23 10/12/2016 Cesium-134 < 0.7 pCi/L N REG PV-APP-3-0216 APP-3 02/11/2016 Tritium < 303 pCi/L N REG PV-APP-3-0216 APP-3 02/11/2016 Cesium-137 < 1.0 pCi/L N REG PV-APP-3-0216 APP-3 02/11/2016 Cobalt-60 < 1.4 pCi/L N REG PV-APP-3-0216 APP-3 02/11/2016 Cesium-134 < 1.7 pCi/L N REG PV-APP-4R-0216 APP-4R 02/11/2016 Tritium < 303 pCi/L N REG PV-APP-4R-0216 APP-4R 02/11/2016 Cesium-137 < 1.1 pCi/L N REG PV-APP-4R-0216 APP-4R 02/11/2016 Cobalt-60 < 1.4 pCi/L N REG PV-APP-4R-0216 APP-4R 02/11/2016 Cesium-134 < 2.7 pCi/L N REG PV-APP-4R-1116 APP-4R 11/01/2016 Tritium < 285 pCi/L N PV-APP-4R-1116 APP-4R 11/01/2016 Cesium-137 < 1.7 pCi/L N PV-APP-4R-1116 APP-4R 11/01/2016 Cobalt-60 < 0.3 pCi/L N PV-APP-4R-1116 APP-4R 11/01/2016 Cesium-134 < 1.4 pCi/L N PV-APP-5-0216 APP-5 02/23/2016 Tritium < 299 pCi/L N REG PV-APP-5-0216 APP-5 02/23/2016 Cesium-137 < 1.8 pCi/L N REG PV-APP-5-0216 APP-5 02/23/2016 Cobalt-60 < 1.4 pCi/L N REG PV-APP-5-0216 APP-5 02/23/2016 Cesium-134 < 2.9 pCi/L N REG PV-APP-7-0216 APP-7 02/09/2016 Tritium < 303 pCi/L N REG PV-APP-7-0216 APP-7 02/09/2016 Cesium-137 < 1.0 pCi/L N REG PV-APP-7-0216 APP-7 02/09/2016 Cobalt-60 < 1.5 pCi/L N REG PV-APP-7-0216 APP-7 02/09/2016 Cesium-134 < 1.9 pCi/L N REG PV-APP-9-0216 APP-9 02/04/2016 Tritium < 303 pCi/L N REG PV-APP-9-0216 APP-9 02/04/2016 Cesium-137 < 1.0 pCi/L N REG PV-APP-9-0216 APP-9 02/04/2016 Cobalt-60 < 1.4 pCi/L N REG PV-APP-9-0216 APP-9 02/04/2016 Cesium-134 < 2.8 pCi/L N REG PV-APP-9-0516 APP-9 05/26/2016 Tritium < 287 pCi/L N REG PV-APP-9-0516 APP-9 05/26/2016 Cesium-137 < 1.0 pCi/L N REG PV-APP-9-0516 APP-9 05/26/2016 Cobalt-60 < 1.4 pCi/L N REG PV-APP-9-0516 APP-9 05/26/2016 Cesium-134 < 2.4 pCi/L N REG PV-APP-9-0916 APP-9 09/21/2016 Tritium < 288 pCi/L N REG PV-APP-9-0916 APP-9 09/21/2016 Cesium-137 < 1.7 pCi/L N REG PV-APP-9-0916 APP-9 09/21/2016 Cobalt-60 < 0.9 pCi/L N REG PV-APP-9-0916 APP-9 09/21/2016 Cesium-134 < 1.6 pCi/L N REG PV-APP-9-1116 APP-9 11/18/2016 Tritium < 308 pCi/L N REG PV-APP-9-1116 APP-9 11/18/2016 Cesium-137 < 1.3 pCi/L N REG PV-APP-9-1116 APP-9 11/18/2016 Cobalt-60 < 0.7 pCi/L N REG PV-APP-9-1116 APP-9 11/18/2016 Cesium-134 < 1.7 pCi/L N REG PV-PV-14H-0216 PV-14H 02/01/2016 Tritium < 242 pCi/L N REG PV-PV-14H-0216 PV-14H 02/01/2016 Cesium-137 < 1.0 pCi/L N REG PV-PV-14H-0216 PV-14H 02/01/2016 Cobalt-60 < 1.4 pCi/L N REG PV-PV-14H-0216 PV-14H 02/01/2016 Cesium-134 < 1.6 pCi/L N REG PV-PV-14H-1016 PV-14H 10/04/2016 Tritium < 288 pCi/L N
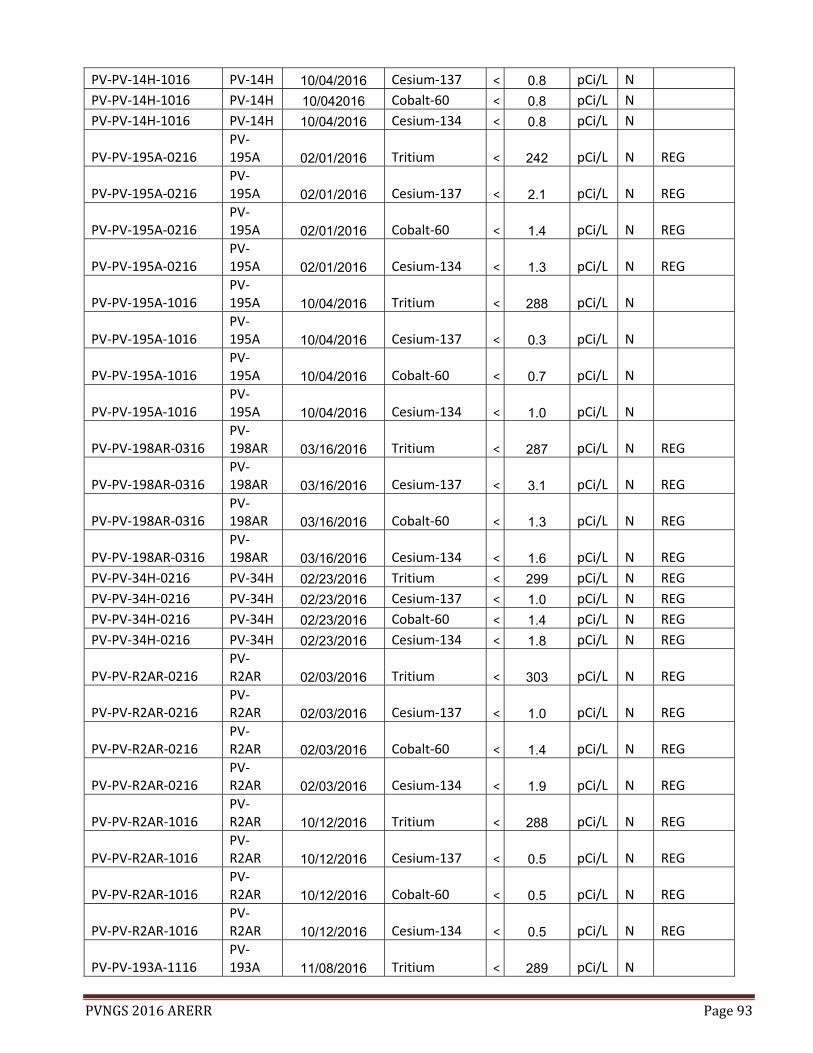
PVNGS 2016 ARERR Page 93
PV-PV-14H-1016 PV-14H 10/04/2016 Cesium-137 < 0.8 pCi/L N PV-PV-14H-1016 PV-14H 10/042016 Cobalt-60 < 0.8 pCi/L N PV-PV-14H-1016 PV-14H 10/04/2016 Cesium-134 < 0.8 pCi/L N
PV-PV-195A-0216 PV-195A 02/01/2016 Tritium < 242 pCi/L N REG
PV-PV-195A-0216 PV-195A 02/01/2016 Cesium-137 < 2.1 pCi/L N REG
PV-PV-195A-0216 PV-195A 02/01/2016 Cobalt-60 < 1.4 pCi/L N REG
PV-PV-195A-0216 PV-195A 02/01/2016 Cesium-134 < 1.3 pCi/L N REG
PV-PV-195A-1016 PV-195A 10/04/2016 Tritium < 288 pCi/L N
PV-PV-195A-1016 PV-195A 10/04/2016 Cesium-137 < 0.3 pCi/L N
PV-PV-195A-1016 PV-195A 10/04/2016 Cobalt-60 < 0.7 pCi/L N
PV-PV-195A-1016 PV-195A 10/04/2016 Cesium-134 < 1.0 pCi/L N
PV-PV-198AR-0316 PV-198AR 03/16/2016 Tritium < 287 pCi/L N REG
PV-PV-198AR-0316 PV-198AR 03/16/2016 Cesium-137 < 3.1 pCi/L N REG
PV-PV-198AR-0316 PV-198AR 03/16/2016 Cobalt-60 < 1.3 pCi/L N REG
PV-PV-198AR-0316 PV-198AR 03/16/2016 Cesium-134 < 1.6 pCi/L N REG
PV-PV-34H-0216 PV-34H 02/23/2016 Tritium < 299 pCi/L N REG PV-PV-34H-0216 PV-34H 02/23/2016 Cesium-137 < 1.0 pCi/L N REG PV-PV-34H-0216 PV-34H 02/23/2016 Cobalt-60 < 1.4 pCi/L N REG PV-PV-34H-0216 PV-34H 02/23/2016 Cesium-134 < 1.8 pCi/L N REG
PV-PV-R2AR-0216 PV-R2AR 02/03/2016 Tritium < 303 pCi/L N REG
PV-PV-R2AR-0216 PV-R2AR 02/03/2016 Cesium-137 < 1.0 pCi/L N REG
PV-PV-R2AR-0216 PV-R2AR 02/03/2016 Cobalt-60 < 1.4 pCi/L N REG
PV-PV-R2AR-0216 PV-R2AR 02/03/2016 Cesium-134 < 1.9 pCi/L N REG
PV-PV-R2AR-1016 PV-R2AR 10/12/2016 Tritium < 288 pCi/L N REG
PV-PV-R2AR-1016 PV-R2AR 10/12/2016 Cesium-137 < 0.5 pCi/L N REG
PV-PV-R2AR-1016 PV-R2AR 10/12/2016 Cobalt-60 < 0.5 pCi/L N REG
PV-PV-R2AR-1016 PV-R2AR 10/12/2016 Cesium-134 < 0.5 pCi/L N REG
PV-PV-193A-1116 PV-193A 11/08/2016 Tritium < 289 pCi/L N

PVNGS 2016 ARERR Page 94
PV-PV-193A-1116 PV-193A 11/08/2016 Cesium-137 < 0.8 pCi/L N
PV-PV-193A-1116 PV-193A 11/08/2016 Cobalt-60 < 0.2 pCi/L N
PV-PV-193A-1116 PV-193A 11/08/2016 Cesium-134 < 0.9 pCi/L N
PV-PV-Q8-1116 PV-Q8 11/08/2016 Tritium < 289 pCi/L N PV-PV-Q8-1116 PV-Q8 11/08/2016 Cesium-137 < 1.7 pCi/L N PV-PV-Q8-1116 PV-Q8 11/08/2016 Cobalt-60 < 1.9 pCi/L N PV-PV-Q8-1116 PV-Q8 11/08/2016 Cesium-134 < 1.6 pCi/L N

PVNGS 2016 ARERR Page 95
APPENDIX E
2015 ANNUAL RADIOLOGICAL EFFLUENT RELEASE REPORT
CORRECTION

OFFSITE DOSE CALCULATION MANUALPALO VERDE NUCLEAR GENERATING STATION
UNITS 1, 2, AND 3
REVISION 27
Originator ______________________________________
Technical Reviewer______________________________________
Director, RadiationProtection ______________________________________
PRB ______________________________________
Effective Date:
McDowell,Joshua(Z08270)
Digitally signed by McDowell, Joshua (Z08270)DN: cn=McDowell, Joshua (Z08270) Reason: I am the author of this documentDate: 2016.03.29 13:47:09 -07'00'
Routolo, Robert M(Z99739)
Digitally signed by Routolo, Robert M(Z99739)DN: cn=Routolo, Robert M(Z99739) Reason: I have reviewed this documentDate: 2016.03.24 10:42:46 -07'00'
Moeller, Carl (Z09119)
Digitally signed by Moeller, Carl (Z09119) DN: cn=Moeller, Carl (Z09119)Date: 2016.03.25 06:25:14 -07'00'
McGhee, Mark A(Z65028)
Digitally signed by McGhee, Mark A(Z65028)DN: cn=McGhee, Mark A(Z65028) Reason: PRB Chairman Approval Date: 2016.03.24 11:39:05 -07'00'
03/25/2016
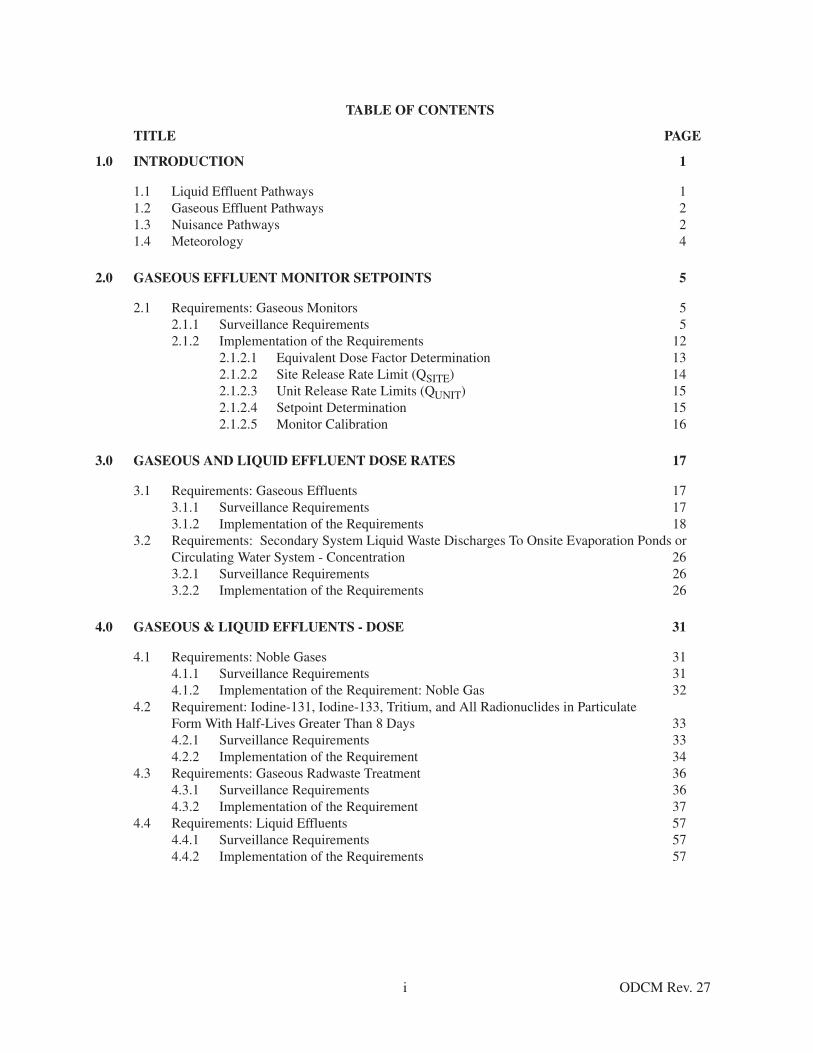
ODCM Rev. 27
TABLE OF CONTENTS
TITLE PAGE
1.0 INTRODUCTION 1
1.1 Liquid Effluent Pathways 11.2 Gaseous Effluent Pathways 21.3 Nuisance Pathways 21.4 Meteorology 4
2.0 GASEOUS EFFLUENT MONITOR SETPOINTS 5
2.1 Requirements: Gaseous Monitors 52.1.1 Surveillance Requirements 52.1.2 Implementation of the Requirements 12
2.1.2.1 Equivalent Dose Factor Determination 132.1.2.2 Site Release Rate Limit (QSITE) 142.1.2.3 Unit Release Rate Limits (QUNIT) 152.1.2.4 Setpoint Determination 152.1.2.5 Monitor Calibration 16
3.0 GASEOUS AND LIQUID EFFLUENT DOSE RATES 17
3.1 Requirements: Gaseous Effluents 173.1.1 Surveillance Requirements 173.1.2 Implementation of the Requirements 18
3.2 Requirements: Secondary System Liquid Waste Discharges To Onsite Evaporation Ponds or Circulating Water System - Concentration 263.2.1 Surveillance Requirements 263.2.2 Implementation of the Requirements 26
4.0 GASEOUS & LIQUID EFFLUENTS - DOSE 31
4.1 Requirements: Noble Gases 314.1.1 Surveillance Requirements 314.1.2 Implementation of the Requirement: Noble Gas 32
4.2 Requirement: Iodine-131, Iodine-133, Tritium, and All Radionuclides in Particulate Form With Half-Lives Greater Than 8 Days 334.2.1 Surveillance Requirements 334.2.2 Implementation of the Requirement 34
4.3 Requirements: Gaseous Radwaste Treatment 364.3.1 Surveillance Requirements 364.3.2 Implementation of the Requirement 37
4.4 Requirements: Liquid Effluents 574.4.1 Surveillance Requirements 574.4.2 Implementation of the Requirements 57
i

ODCM Rev. 27
TABLE OF CONTENTS
TITLE PAGE
5.0 TOTAL DOSE AND DOSE TO PUBLIC ONSITE 58
5.1 Requirement: Total Dose 585.1.1 Surveillance Requirements 585.1.2 Implementation of the Requirement 58
6.0 RADIOLOGICAL ENVIRONMENTAL MONITORING PROGRAM (REMP) 62
6.1 Requirement: REMP 626.1.1 Surveillance Requirements 636.1.2 Implementation of the Requirements 63
6.2 Requirement: Land Use Census 716.2.1 Surveillance Requirements 716.2.2 Implementation of the Requirements 71
6.3 Requirement: Interlaboratory Comparison Program 726.3.1 Surveillance Requirements 726.3.2 Implementation of the Requirements 72
7.0 RADIOLOGICAL REPORTS 83
7.1 Requirement: Annual Radioactive Effluent Release Report 837.2 Requirement: Annual Radiological Environmental Operating Report 85
APPENDIX A DETERMINATION OF CONTROLLING LOCATION 86
APPENDIX B BASES FOR REQUIREMENTS 872.1 RADIOACTIVE GASEOUS EFFLUENT MONITORING INSTRUMENTATION 873.1 GASEOUS EFFLUENT - DOSE RATE 873.2 SECONDARY SYSTEM LIQUID WASTE DISCHARGE TO
ONSITE EVAPORATION PONDS - CONCENTRATION 884.1 GASEOUS EFFLUENT - DOSE, Noble Gases 884.2 GASEOUS EFFLUENT - DOSE - Iodine-131, Iodine-133, Tritium,
and All Radionuclides in Particulate Form With Half-Lives Greater Than 8 Days894.3 GASEOUS RADWASTE TREATMENT 894.4 SECONDARY SYSTEM LIQUID WASTE DISCHARGE TO
ONSITE EVAPORATION PONDS - DOSE 905.1 TOTAL DOSE AND DOSE TO PUBLIC ONSITE 906.1 RADIOLOGICAL ENVIRONMENTAL MONITORING PROGRAM (REMP) 916.2 LAND USE CENSUS 916.3 INTERLABORATORY COMPARISON PROGRAM 91
APPENDIX C DEFINITIONS 92
APPENDIX D REFERENCES 96
ii

ODCM Rev. 27
LIST OF TABLES
TABLE PAGETITLE
1-1 NUISANCE PATHWAYS 3
2-1 RADIOACTIVE GASEOUS EFFLUENT MONITORING INSTRUMENTATION 6
2-2 RADIOACTIVE GASEOUS EFFLUENT MONITORING INSTRUMENTATION SURVEILLANCE REQUIREMENTS 10
3-1 RADIOACTIVE GASEOUS WASTE SAMPLING AND ANALYSIS PROGRAM 20
3-2 DISPERSION AND DEPOSITION PARAMETERS FOR LONG TERM RELEASES AT THE SITE BOUNDARY 23
3-3 DOSE FACTORS FOR NOBLE GASES AND DAUGHTERS 24
3-4 Pi VALUES FOR THE INHALATION PATHWAY 25
3-5 RADIOACTIVE LIQUID WASTE SAMPLING AND ANALYSIS PROGRAM 27
3-6 RADIOACTIVE LIQUID EFFLUENT MONITORING INSTRUMENTATION 30
3-7 RADIOACTIVE LIQUID EFFLUENT MONITORING INSTRUMENTATION SURVEILLANCE REQUIREMENTS 30
4-1 Ri DOSE CONVERSION FACTORS FOR THE GROUND PLANE PATHWAY 39
4-2 Ri DOSE CONVERSION FACTORS FOR THE VEGETATION PATHWAY - ADULT RECEPTOR 40
4-3 Ri DOSE CONVERSION FACTORS FOR THE VEGETATION PATHWAY - TEEN RECEPTOR 41
4-4 Ri DOSE CONVERSION FACTORS FOR THE VEGETATION PATHWAY - CHILD RECEPTOR 42
4-5 Ri DOSE CONVERSION FACTORS FOR THE GRASS-COW-MEAT PATHWAY - ADULT RECEPTOR 43
4-6 Ri DOSE CONVERSION FACTORS FOR THE GRASS-COW-MEAT PATHWAY - TEEN RECEPTOR 44
4-7 Ri DOSE CONVERSION FACTORS FOR THE GRASS-COW-MEAT PATHWAY - CHILD RECEPTOR 45
4-8 Ri DOSE CONVERSION FACTORS FOR THE GRASS-COW-MILK PATHWAY - ADULT RECEPTOR 46
4-9 Ri DOSE CONVERSION FACTORS FOR THE GRASS-COW-MILK PATHWAY - TEEN RECEPTOR 47
4-10 Ri DOSE CONVERSION FACTORS FOR THE GRASS-COW-MILK PATHWAY - CHILD RECEPTOR 48
iii

ODCM Rev. 27
LIST OF TABLES
TABLE PAGETITLE
4-11 Ri DOSE CONVERSION FACTORS FOR THE GRASS-COW-MILK PATHWAY - INFANT RECEPTOR 49
4-12 Ri DOSE CONVERSION FACTORS FOR THE INHALATION PATHWAY - ADULT RECEPTOR 50
4-13 Ri DOSE CONVERSION FACTORS FOR THE INHALATION PATHWAY - TEEN RECEPTOR 51
4-14 Ri DOSE CONVERSION FACTORS FOR THE INHALATION PATHWAY - CHILD RECEPTOR 52
4-15 Ri DOSE CONVERSION FACTORS FOR THE INHALATION PATHWAY - INFANT RECEPTOR 53
4-16 PALO VERDE NUCLEAR GENERATING STATION DISPERSION AND DEPOSITION PARAMETERS FOR LONG TERM RELEASES AT THE NEAREST PATHWAY LOCATIONS CENTERED ON UNIT l 54
4-17 PALO VERDE NUCLEAR GENERATING STATION DISPERSION AND DEPOSITION PARAMETERS FOR LONG TERM RELEASES AT THE NEAREST PATHWAY LOCATIONS CENTERED ON UNIT 2 55
4-18 PALO VERDE NUCLEAR GENERATING STATION DISPERSION AND DEPOSITION PARAMETERS FOR LONG TERM RELEASES AT THE NEAREST PATHWAY LOCATIONS CENTERED ON UNIT 3 56
6-1 RADIOLOGICAL ENVIRONMENTAL MONITORING PROGRAM 64
6-2 REPORTING LEVELS FOR RADIOACTIVITY CONCENTRATIONS IN ENVIRONMENTAL SAMPLES 68
6-3 DETECTION CAPABILITIES FOR ENVIRONMENTAL ANALYSIS 69
6-4 RADIOLOGICAL ENVIRONMENTAL MONITORING SAMPLE COLLECTION LOCATIONS 73
C-1 FREQUENCY NOTATION 95
iv

ODCM Rev. 27
LIST OF FIGURES
FIGURE PAGETITLE
6-1 Radiological Environmental Monitoring Program Sample Sites 0 - 10 miles 77
6-2 Radiological Environmental Monitoring Program Sample Sites 10 - 35 Miles 78
6-3 Radiological Environmental Monitoring Program Sample Sites 35 - 75 Miles DELETED 79
6-4 Site Exclusion Area Boundary DELETED 80
6-5 Gaseous Effluent Release Points 81
6-6 Low Population Zone DELETED 82
v

1 ODCM Rev. 27
1.0 INTRODUCTION
The Offsite Dose Calculation Manual (ODCM) implements the program elements which are requiredby the Administrative Controls section of the Technical Specifications. The ODCM contains theoperational requirements, the surveillance requirements, and actions required if the operationalrequirements are not met for the Radioactive Effluent Controls Program and the RadiologicalEnvironmental Monitoring Program to assure compliance with 10 CFR 20.1302, 40 CFR Part 190,10 CFR 50.36a, and Appendix I to 10 CFR Part 50. The Technical Specifications, Section 3.0, alsoapply to the ODCM. Substitute the word “Requirements” for “Limiting Condition for Operation.” Itshould be noted that the hot and cold shutdown and operability requirements in TechnicalSpecification 3.0.3 and 3.0.4 do not apply to any of the requirements contained in this ODCM. TheODCM also contains descriptions of the information that should be included in the AnnualRadiological Environmental Operating Report and the Annual Radioactive Effluent Release Reportrequired by the Technical Specifications.
The ODCM provides the parameters and methodology to be used in calculating offsite doses resultingfrom radioactive effluents, in the calculation of gaseous effluent monitor Alarm/Trip Setpoints, and inthe conduct of the Radiological Environmental Monitoring Program. Included are methods fordetermining air, whole body, and organ dose at the controlling location due to plant effluents to assurecompliance with the regulatory requirements detailed in the ODCM. Methods are included forperforming dose projections to assure compliance with the gaseous treatment system operabilitysections of the ODCM. The ODCM utilizes information from NRC Regulatory Guide 1.109,“Calculation of Annual Doses to Man from Routine Releases of Reactor Effluents for the Purpose ofEvaluating Compliance with 10 CFR Part 50, Appendix I,” October 1977, and NRC NUREG 0133,“Preparation of Radiological Effluent Technical Specifications for Nuclear Power Plants,”October 1978. NUREG 0133 utilizes some of the key information in Regulatory Guide 1.109 toprovide methods which were used in the preparation of the radiological effluent TechnicalSpecifications and which have now been transferred to the ODCM in accordance with NRC GenericLetter 89-01, “Implementation of Programmatic Controls for Radiological Effluent TechnicalSpecifications in the Administrative Controls Section of the Technical Specifications and theRelocation of Procedural Details of RETS to the Offsite Dose Calculation Manual or to the ProcessControl Program,” January 31, 1989, and NUREG 1301, “Offsite Dose Calculation Manual Guidance:Standard Radiological Effluent Controls for Pressurized Water Reactors,” Generic Letter 89-01,Supplement No. 1, April 1991. Further guidance for the implementation of the new 10 CFR Part 20,effective January 1, 1994, was obtained from the Federal Register, Vol. 58, December 23, 1993. It isrecognized that this is only draft guidance, however, it is the only guidance for referencing the new10 CFR 20 in the ODCM.
1.1 Liquid Effluent Pathways
Dose calculation methodology for radioactive liquid effluents is not included in this manual due tothe desert location of the plant, the hydrology of the area, and the fact that there are no liquid releasesto areas at or beyond the SITE BOUNDARY during normal operation. All liquid discharges to theonsite evaporation ponds are controlled by Section 3.2. The impact of postulated accidental seepageson the groundwater system, and in particular on the existing wells located in the 5-mile zone aroundthe site area has been calculated and analyzed in Section 2.4.13.3 of the PVNGS FSAR.
If plant operating conditions become such that the likelihood of a liquid effluent pathway is created,then dose calculation methodology for this pathway will be added to this manual.
2 ODCM Rev. 27
1.2 Gaseous Effluent Pathways
All gaseous effluents are treated as ground level releases and are considered to be “long-term” asdiscussed in NUREG-0133, “Preparation of Radiological Effluent Technical Specifications forNuclear Power Plants.” This includes the containment purge and Waste Gas Decay Tank releases aswell as the normal ventilation system and condenser vacuum exhaust releases. All releases are eithergreater than 500 hours in duration or are made at random, not depending upon atmosphericconditions or time of day. The releases are lumped together and calculated as an entity. Historicalannual average X/Q values are used throughout this manual for all gaseous effluent setpoint and dosecalculations. Airborne releases are further subdivided into two subclasses:
1.2.1 Iodine-131, Iodine-133, Tritium and Radionuclides in Particulate Form with Half-livesGreater than Eight Days
In this model, a controlling location is identified for assessing the maximum exposure to aMEMBER OF THE PUBLIC for the various pathways and to critical organs. Infant exposureoccurs through inhalation and any actual milk pathway. Child, teenager and adult exposurederives from inhalation, consumed vegetation pathways, and any actual milk and meatpathways. Dose to each of the seven organs listed in Regulatory Guide 1.109 (bone, liver, totalbody, thyroid, kidney, lung and GI-LLI) are computed from individual nuclide contributions ineach sector. The largest of the organ doses in any sector is compared to 10 CFR 50, Appendix Idesign objectives. The release rates of these nuclides will be converted to instantaneous doserates for comparison to the limits of 10 CFR 20.
1.2.2 Noble Gases
The air dose from both the beta and gamma radiation component of the noble gases will beassessed and compared to the 10 CFR 50, Appendix I design objectives. The noble gas releaserate will be converted to instantaneous dose rates for comparison to the limits of 10 CFR 20.
Section 2.0 of this manual discusses the methodology to be used in determining effluentmonitor alarm/trip setpoints to assure compliance with the 10 CFR Part 20 limits asimplemented in Section 3.0. Section 4.0 discusses the methods to assure releases are As LowAs Reasonably Achievable (ALARA) in accordance with Appendix I to 10 CFR Part 50.Methods are described in Section 5.0 for determining the annual cumulative dose to aMEMBER OF THE PUBLIC from gaseous effluents and direct radiation to assure compliancewith 40 CFR Part 190.
The requirements for the Annual Radiological Effluent Release Report and the RadiologicalEnvironmental Monitoring Program, including the Annual Land Use Census and theInterlaboratory Comparison Program, and the Annual Environmental Report are described inSections 6.0 and 7.0 of this manual.
1.3 Nuisance Pathways
This section addresses the potential release pathways which should not contribute more than 10% ofthe doses evaluated in this manual. Table 1-1 lists examples of potential release pathways. TheODCM methodology for calculation of doses will be applied to an applicable release pathway if alikely potential arises for contributing more than 10% of the doses evaluated in this manual.

3 ODCM Rev. 27
TABLE 1-1
NUISANCE PATHWAYS
(EXAMPLES)
Evaporation Pond
Cooling Towers
Laundry/Decon Building Exhaust
Unmonitored Secondary System Steam Vents/Reliefs
Turbine Building Ventilation Exhaust
Unmonitored Tank Atmospheric Vents
Dry Active Waste Processing and Storage (DAWPS) Building
Respirator Cleaning Facility
Secondary Side Decontamination Equipment
Low Level Radioactive Material Storage Facility
Outage Support Facility MAR 2016
4 ODCM Rev. 27
1.4 Meteorology
Historical annual average atmospheric dispersion (X/Q) and deposition (D/Q) data, based on nineyears of meteorological data, and given in Table 3-2 for each of the three nuclear generating units areused to demonstrate compliance with the ODCM Requirements. These Requirements include:
Section 2.0 Gaseous Effluent Monitor Setpoints;Section 3.0 Gaseous and Liquid Effluent - Dose RateSection 4.0 Gaseous and Liquid Effluent - DoseSection 5.0 Total Dose and Dose to Public Onsite
Sections 2.0 and 3.0 specify utilizing the highest X/Q or D/Q meteorological dispersion parameter atthe Site Boundary for any of the three units as applicable. Using the highest dispersion parameter forany of the units provides a conservative assumption to assure compliance with the higher 10 CFRPart 20 limits.
Section 4.0 specifies utilizing the highest X/Q at the Site Boundary for the particular unit, fromTable 3-2 for noble gases. The highest X/Q and D/Q are utilized for the particular unit’s releases asapplicable for gases other than noble gases (iodines, particulates, and tritium) for the controllingpathway’s location (site boundary using Table 3-2 or other controlling locations using Table 4-16,4-17, or 4-18).
Section 5.0 specifies utilizing the highest X/Q for the particular unit’s releases at the controllinglocation from Table 4-16, 4-17, or 4-18, for noble gases. The highest X/Q and D/Q are utilized for theparticular unit’s releases as applicable for gases other than noble gases at the controlling pathway’slocation using Table 4-16, 4-17, or 4-18.
Section 7.0 requires that the meteorological conditions concurrent with the time of release ofradioactive materials in gaseous effluents, as determined by sampling frequency and measurement,shall be used for determining the gaseous pathway doses.
5 ODCM Rev. 27
2.0 GASEOUS EFFLUENT MONITOR SETPOINTS
2.1 Requirements: Gaseous Monitors
The radioactive gaseous effluent monitoring instrumentation channels shown in Table 2-1 shall beFUNCTIONAL with their alarm/trip setpoints set to ensure that the dose requirements in Section 3.0are not exceeded. The alarm/trip setpoints of these channels shall be determined and adjusted inaccordance with the methodology and parameters in Section 2.1.2.
Applicability: As shown in Table 2-1.
Action:
a. With the low range radioactive gaseous effluent monitoring instrumentation channel alarm/tripsetpoint less conservative than required by the above Requirement, immediately suspend therelease of radioactive gaseous effluents monitored by the affected channel, or declare the channelnonfunctional, or change the setpoint so it is acceptably conservative.
b. With less than the minimum number of radioactive gaseous effluent monitoring instrumentationchannels FUNCTIONAL, take the ACTION shown in Table 2-1. Restore the nonfunctionalinstrumentation to FUNCTIONAL status within 30 days or, if unsuccessful, explain in the nextAnnual Radioactive Effluent Release Report why this nonfunctionality was not corrected withinthe time specified.
2.1.1 Surveillance Requirements
a. Each radioactive gaseous effluent monitoring instrumentation channel shall bedemonstrated FUNCTIONAL by performance of the CHANNEL CHECK, SOURCECHECK, CHANNEL CALIBRATION, and CHANNEL FUNCTIONAL TEST operationsat the frequencies shown in Table 2-2.
b. The specified Frequency for each Surveillance Requirement is met if the SurveillanceRequirement is performed within 1.25 times the interval specified in the Frequency, asmeasured from the previous performance or as measured from the time a specifiedcondition of the Frequency is met.
For Frequencies specified as “Prior to each release,” the above interval extension does notapply.
For Frequencies specified as “Once” the above interval extension does not apply.
If a Completion Time requires periodic performance on a “once per . . . ” basis, the aboveFrequency extension applies to each performance after the initial performance.
MAR 2016
MAR 2016
MAR 2016
MAR 2016
MAR 2016
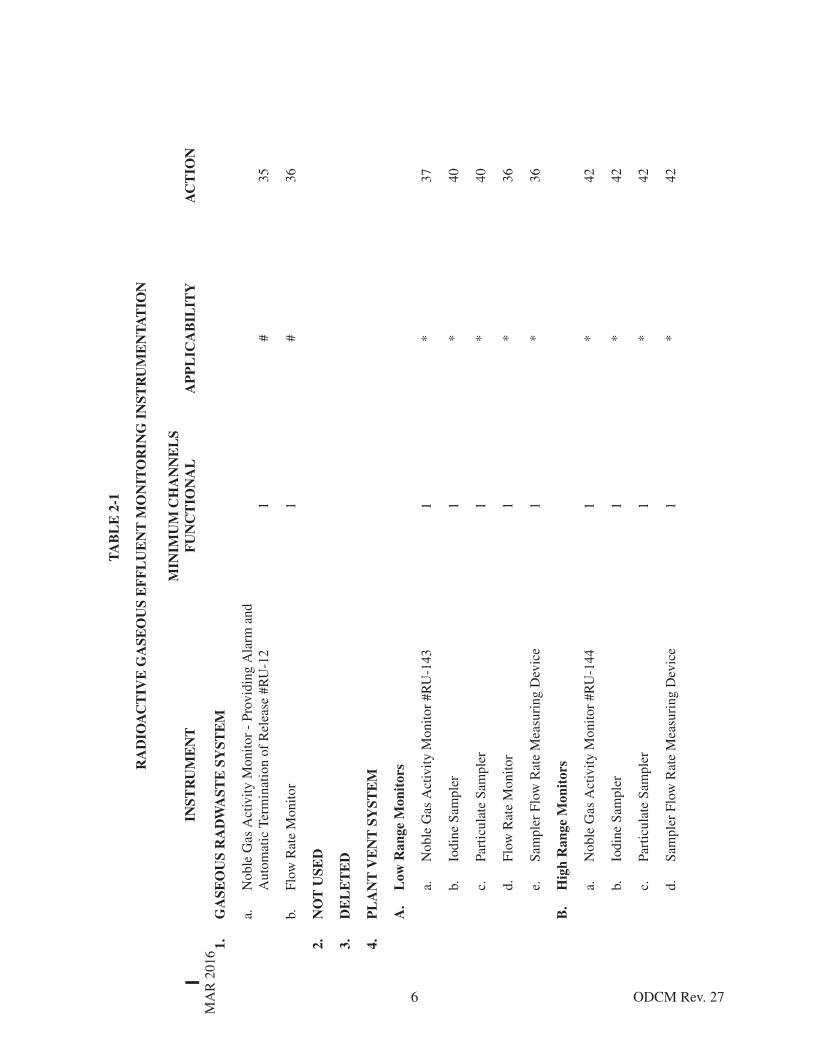
6 ODCM Rev. 27
TA
BL
E 2
-1
RA
DIO
AC
TIV
E G
ASE
OU
S E
FF
LU
EN
T M
ON
ITO
RIN
G I
NST
RU
ME
NT
AT
ION
INST
RU
ME
NT
MIN
IMU
M C
HA
NN
EL
S F
UN
CT
ION
AL
AP
PL
ICA
BIL
ITY
AC
TIO
N
1.G
ASE
OU
S R
AD
WA
STE
SY
STE
M
a.N
oble
Gas
Act
ivity
Mon
itor
- Pr
ovid
ing
Ala
rm a
nd
Aut
omat
ic T
erm
inat
ion
of R
elea
se #
RU
-12
1#
35
b.Fl
ow R
ate
Mon
itor
1#
36
2.N
OT
USE
D
3.D
EL
ET
ED
4.P
LA
NT
VE
NT
SY
STE
M
A.
Low
Ran
ge M
onit
ors
a.N
oble
Gas
Act
ivity
Mon
itor
#RU
-143
1*
37
b.Io
dine
Sam
pler
1*
40
c.Pa
rtic
ulat
e Sa
mpl
er1
*40
d.Fl
ow R
ate
Mon
itor
1*
36
e.Sa
mpl
er F
low
Rat
e M
easu
ring
Dev
ice
1*
36
B.
Hig
h R
ange
Mon
itor
s
a.N
oble
Gas
Act
ivity
Mon
itor
#RU
-144
1*
42
b.Io
dine
Sam
pler
1*
42
c.Pa
rtic
ulat
e Sa
mpl
er1
*42
d.Sa
mpl
er F
low
Rat
e M
easu
ring
Dev
ice
1*
42
MA
R 2
016

7 ODCM Rev. 27
5.F
UE
L B
UIL
DIN
G V
EN
TIL
AT
ION
SY
STE
M
A.
Low
Ran
ge M
onit
ors
a.N
oble
Gas
Act
ivit
y M
onito
r #R
U-1
451
##37
, 41
b.Io
dine
Sam
pler
1##
40
c.Pa
rtic
ulat
e Sa
mpl
e1
##40
d.Fl
ow R
ate
Mon
itor
1##
36
e.Sa
mpl
er F
low
Rat
e M
easu
ring
Dev
ice
1##
36
B.
Hig
h R
ange
Mon
itor
s
a.N
oble
Gas
Act
ivity
Mon
itor
#RU
-146
1##
42
b.Io
dine
Sam
pler
1##
42
c.Pa
rtic
ulat
e Sa
mpl
e1
##42
d.Sa
mpl
er F
low
Rat
e M
easu
ring
Dev
ice
1##
42
TA
BL
E 2
-1 (
Con
tinu
ed)
RA
DIO
AC
TIV
E G
ASE
OU
S E
FF
LU
EN
T M
ON
ITO
RIN
G I
NST
RU
ME
NT
AT
ION
INST
RU
ME
NT
MIN
IMU
M C
HA
NN
EL
S F
UN
CT
ION
AL
AP
PL
ICA
BIL
ITY
AC
TIO
N
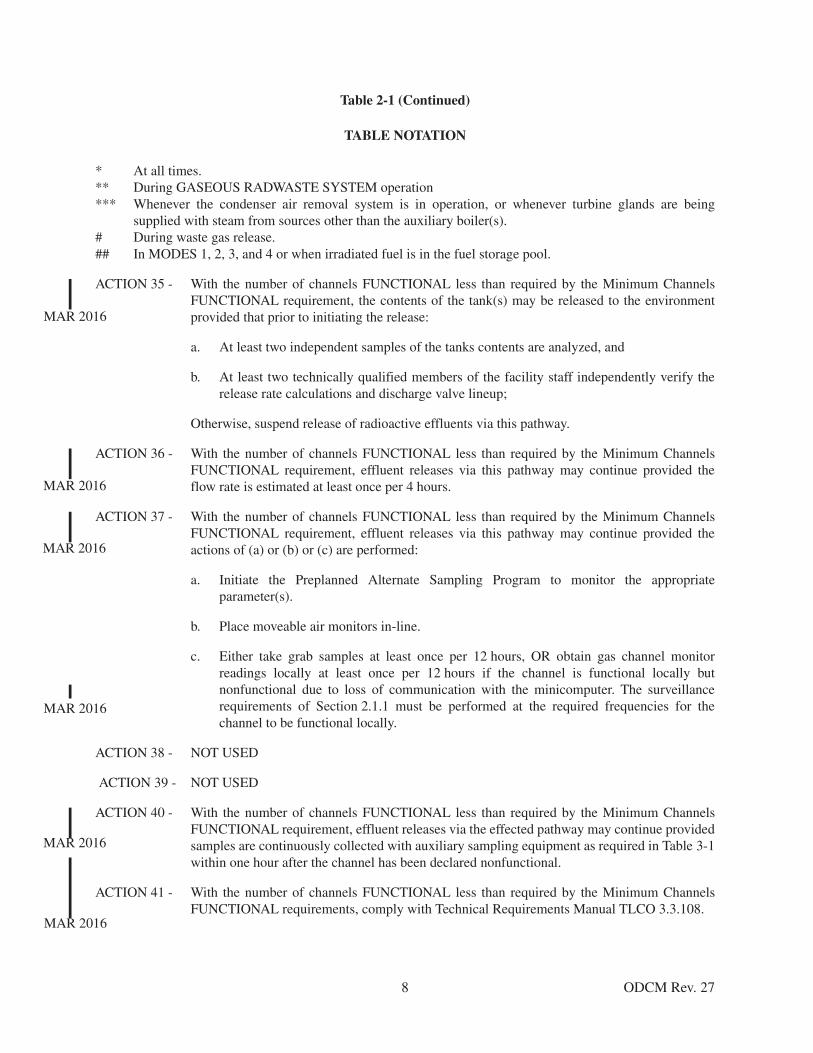
8 ODCM Rev. 27
Table 2-1 (Continued)
TABLE NOTATION
* At all times.** During GASEOUS RADWASTE SYSTEM operation*** Whenever the condenser air removal system is in operation, or whenever turbine glands are being
supplied with steam from sources other than the auxiliary boiler(s).# During waste gas release.## In MODES 1, 2, 3, and 4 or when irradiated fuel is in the fuel storage pool.
ACTION 35 - With the number of channels FUNCTIONAL less than required by the Minimum ChannelsFUNCTIONAL requirement, the contents of the tank(s) may be released to the environmentprovided that prior to initiating the release:
a. At least two independent samples of the tanks contents are analyzed, and
b. At least two technically qualified members of the facility staff independently verify therelease rate calculations and discharge valve lineup;
Otherwise, suspend release of radioactive effluents via this pathway.
ACTION 36 - With the number of channels FUNCTIONAL less than required by the Minimum ChannelsFUNCTIONAL requirement, effluent releases via this pathway may continue provided theflow rate is estimated at least once per 4 hours.
ACTION 37 - With the number of channels FUNCTIONAL less than required by the Minimum ChannelsFUNCTIONAL requirement, effluent releases via this pathway may continue provided theactions of (a) or (b) or (c) are performed:
a. Initiate the Preplanned Alternate Sampling Program to monitor the appropriateparameter(s).
b. Place moveable air monitors in-line.
c. Either take grab samples at least once per 12 hours, OR obtain gas channel monitorreadings locally at least once per 12 hours if the channel is functional locally butnonfunctional due to loss of communication with the minicomputer. The surveillancerequirements of Section 2.1.1 must be performed at the required frequencies for thechannel to be functional locally.
ACTION 38 - NOT USED
ACTION 39 - NOT USED
ACTION 40 - With the number of channels FUNCTIONAL less than required by the Minimum ChannelsFUNCTIONAL requirement, effluent releases via the effected pathway may continue providedsamples are continuously collected with auxiliary sampling equipment as required in Table 3-1within one hour after the channel has been declared nonfunctional.
ACTION 41 - With the number of channels FUNCTIONAL less than required by the Minimum ChannelsFUNCTIONAL requirements, comply with Technical Requirements Manual TLCO 3.3.108.
MAR 2016
MAR 2016
MAR 2016
MAR 2016
MAR 2016
MAR 2016

9 ODCM Rev. 27
Table 2-1 (Continued)
TABLE NOTATION
ACTION 42 - With the number of channels FUNCTIONAL less than required by the Minimum ChannelsFUNCTIONAL requirement initiate the Preplanned Alternate Sampling Program to monitorthe appropriate parameter(s) within 72 hours, and:
a. Either restore the nonfunctional channel(s) to FUNCTIONAL status within 7 days of theevent, or
b. Prepare and submit a Special Report to the Commission within 14 days following theevent outlining the action(s) taken, the cause of the nonfunctionality, and the plans andschedule for restoring the system to FUNCTIONAL status.
MAR 2016
MAR 2016
MAR 2016
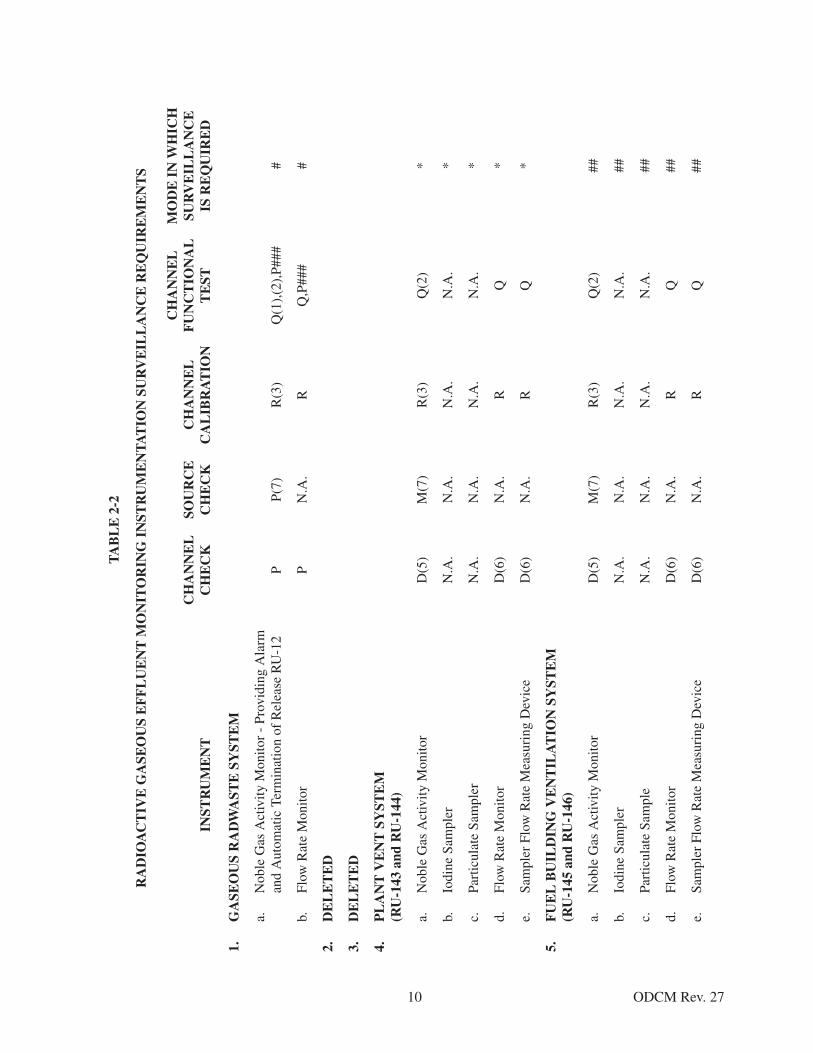
10 ODCM Rev. 27
TA
BL
E 2
-2
RA
DIO
AC
TIV
E G
ASE
OU
S E
FF
LU
EN
T M
ON
ITO
RIN
G I
NST
RU
ME
NT
AT
ION
SU
RV
EIL
LA
NC
E R
EQ
UIR
EM
EN
TS
INST
RU
ME
NT
CH
AN
NE
LC
HE
CK
SOU
RC
EC
HE
CK
CH
AN
NE
L
CA
LIB
RA
TIO
N
CH
AN
NE
LF
UN
CT
ION
AL
TE
ST
MO
DE
IN
WH
ICH
SU
RV
EIL
LA
NC
E
IS R
EQ
UIR
ED
1.G
ASE
OU
S R
AD
WA
STE
SY
STE
M
a.N
oble
Gas
Act
ivity
Mon
itor
- Pr
ovid
ing
Ala
rm
and
Aut
omat
ic T
erm
inat
ion
of R
elea
se R
U-1
2P
P(7)
R(3
)Q
(1),
(2),
P###
#
b.Fl
ow R
ate
Mon
itor
PN
.A.
RQ
,P##
##
2.D
EL
ET
ED
3.D
EL
ET
ED
4.P
LA
NT
VE
NT
SY
STE
M(R
U-1
43 a
nd R
U-1
44)
a.N
oble
Gas
Act
ivity
Mon
itor
D(5
)M
(7)
R(3
)Q
(2)
*
b.Io
dine
Sam
pler
N.A
.N
.A.
N.A
.N
.A.
*
c.Pa
rtic
ulat
e Sa
mpl
erN
.A.
N.A
.N
.A.
N.A
.*
d.Fl
ow R
ate
Mon
itor
D(6
)N
.A.
RQ
*
e.Sa
mpl
er F
low
Rat
e M
easu
ring
Dev
ice
D(6
)N
.A.
RQ
*
5.F
UE
L B
UIL
DIN
G V
EN
TIL
AT
ION
SY
STE
M(R
U-1
45 a
nd R
U-1
46)
a.N
oble
Gas
Act
ivity
Mon
itor
D(5
)M
(7)
R(3
)Q
(2)
##
b.Io
dine
Sam
pler
N.A
.N
.A.
N.A
.N
.A.
##
c.Pa
rtic
ulat
e Sa
mpl
eN
.A.
N.A
.N
.A.
N.A
.##
d.Fl
ow R
ate
Mon
itor
D(6
)N
.A.
RQ
##
e.Sa
mpl
er F
low
Rat
e M
easu
ring
Dev
ice
D(6
)N
.A.
RQ
##

11 ODCM Rev. 27
Table 2-2 (Continued)
TABLE NOTATION
* At all times.** During GASEOUS RADWASTE SYSTEM operation*** Whenever the condenser air removal system is in operation, or whenever turbine glands are being
supplied with steam from sources other than the auxiliary boiler(s).# During waste gas release.## In MODES 1, 2, 3, and 4 or when irradiated fuel is in the fuel storage pool.### Functional test should consist of, but not be limited to, a verification of system isolation capability by the
insertion of a simulated alarm condition.
(1) The CHANNEL FUNCTIONAL TEST shall also demonstrate that automatic isolation of this pathwayoccurs if the instrument indicates measured levels above the alarm/trip setpoint.
(2) The CHANNEL FUNCTIONAL TEST shall also demonstrate that control room alarm annunciationoccurs if any of the following conditions exists:
1. Instrument indicates measured levels above the alarm setpoint.2. Circuit failure.3. Instrument indicates a downscale failure.4. Instrument controls not set in operate mode.
(3) The initial CHANNEL CALIBRATION shall be performed using one or more of the reference standardscertified by the National Institute of Standards and Technology (NIST) or using standards that have beenobtained from suppliers that participate in measurement assurance activities with NIST. These standardsshall permit calibrating the system over its intended range of energy and measurement range. Forsubsequent CHANNEL CALIBRATION, sources that have been related to the initial calibration may beused in lieu of the reference standards associated with the initial calibration.
(4) NOT USED
(5) The channel check for channels in standby status shall consist of verification that the channel is on-lineand reachable.
(6) Daily channel check not required for flow monitors in standby status.
(7) LED may be utilized as the check source in lieu of a source of increased activity.

12 ODCM Rev. 27
2.1.2 Implementation of the Requirements
The general methodology for establishing low range gaseous effluent monitor setpoints isbased upon a site release rate limit in μCi/sec derived from site specific meteorologicaldispersion conditions, radioisotopic distribution, and whole body and skin dose factors. Thehigh alarm of the low range monitors will alarm/trip when the release rate from an individualvent will result in exceeding the limits in Section 3.1. 80% of Section 3.1 limits is consideredto be the site release rate limit. The site release rate limit will be allocated among the licensedunits’ release points. The unit release rate limit will then be utilized for the determination ofgaseous effluent monitor setpoints. A fraction of the unit release rate limit is then allotted toeach release point and its monitor alert setpoint (μCi/cc) is derived using actual or fan designflow rates.
Administrative values are used to reduce each setpoint to account for the potential activity inother releases. These administrative values shall be reviewed based on actual release data.
For the purpose of implementation of Section 2.1, the alarm setpoint levels for low rangeeffluent noble gas monitors are established to ensure that personnel are alerted when the noblegas releases are at a rate such that if the releases would continue for the year they wouldapproach the total body dose rate of 500 mrem/yr and 3000 mrem/yr skin dose in Section 3.1.The equations in Section 3.1 of this manual provide the methodology for calculating thegaseous effluent dose rate.
The evaluation of doses due to releases of radioactive material can be simplified by the use ofequivalent dose factors as defined in Section 2.1.2.1.
The equivalent dose factors will be evaluated periodically to assure that the best informationon isotopic distribution is being used for the dose equivalent value.

13 ODCM Rev. 27
2.1.2.1 Equivalent Dose Factor Determination
The equivalent whole body dose factor is calculated as follows:
(2-1)
Where:
Keq = the equivalent whole body dose factor weighted by historicalradionuclide distribution in releases in mrem/yr per μCi/m3.
Ki = the whole body dose factor due to gamma emissions for eachidentified noble gas radionuclide i, in mrem/yr per μCi/m3 fromTable 3-3.
fi = the fraction of noble gas radionuclide i in the total noble gasradionuclide mix.
The equivalent skin dose factor is calculated as follows:
(2-2)
Where:
(L+1.1M)eq = the equivalent skin dose factor due to beta and gamma emissions fromall noble gases released, weighted by the historical radionuclidedistribution in releases in mrem/yr per μCi/m3.
Li = the skin dose factor due to the beta emissions for each identified noblegas radionuclide i, in mrem/yr per μCi/m3 from Table 3-3.
Mi = the air dose factor due to gamma emissions for each identified noblegas radionuclide i, in mrad/yr per μCi/m3 from Table 3-3.
fi = the fraction of noble gas radionuclide i in the total noble gasradionuclide mix.
1.1 = unit conversion constant of 1.1 mrem/mrad converts air dose to skindose.
Keq Ki( ) fi( )[ ]i=
L 1.1M+( )eq Li 1.1Mi+( ) fi( )[ ]i=
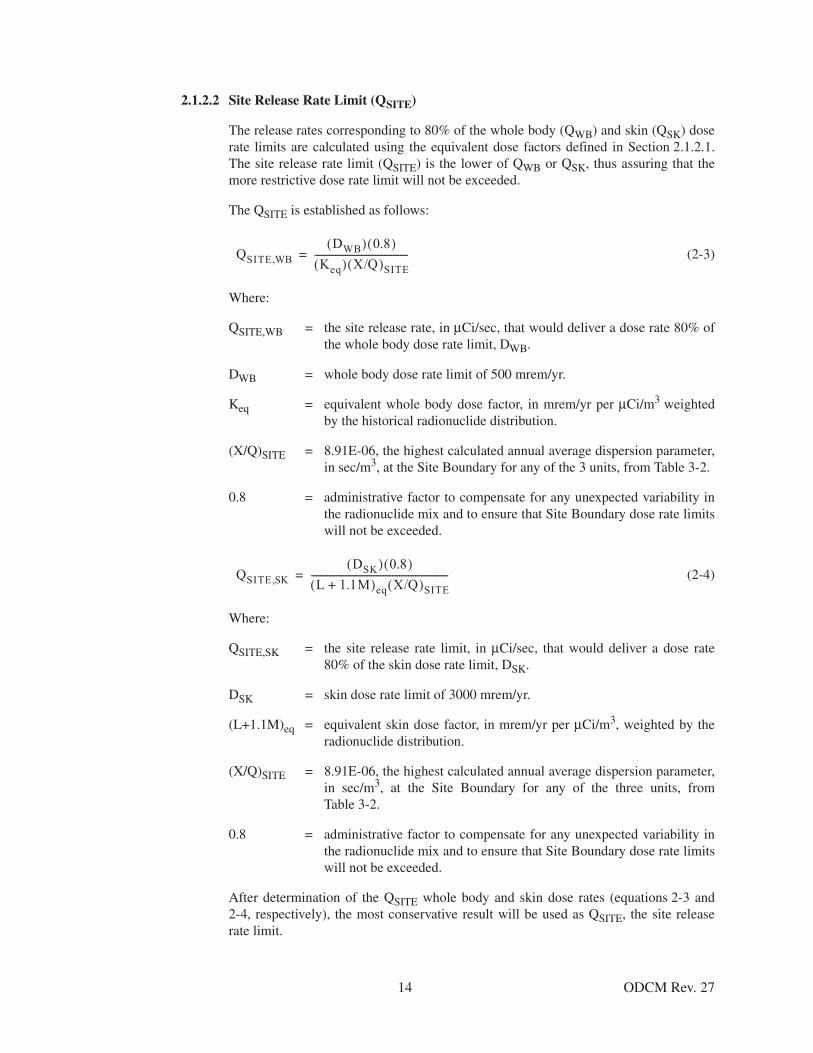
14 ODCM Rev. 27
2.1.2.2 Site Release Rate Limit (QSITE)
The release rates corresponding to 80% of the whole body (QWB) and skin (QSK) doserate limits are calculated using the equivalent dose factors defined in Section 2.1.2.1.The site release rate limit (QSITE) is the lower of QWB or QSK, thus assuring that themore restrictive dose rate limit will not be exceeded.
The QSITE is established as follows:
(2-3)
Where:
QSITE,WB = the site release rate, in μCi/sec, that would deliver a dose rate 80% ofthe whole body dose rate limit, DWB.
DWB = whole body dose rate limit of 500 mrem/yr.
Keq = equivalent whole body dose factor, in mrem/yr per μCi/m3 weightedby the historical radionuclide distribution.
(X/Q)SITE = 8.91E-06, the highest calculated annual average dispersion parameter,in sec/m3, at the Site Boundary for any of the 3 units, from Table 3-2.
0.8 = administrative factor to compensate for any unexpected variability inthe radionuclide mix and to ensure that Site Boundary dose rate limitswill not be exceeded.
(2-4)
Where:
QSITE,SK = the site release rate limit, in μCi/sec, that would deliver a dose rate80% of the skin dose rate limit, DSK.
DSK = skin dose rate limit of 3000 mrem/yr.
(L+1.1M)eq = equivalent skin dose factor, in mrem/yr per μCi/m3, weighted by theradionuclide distribution.
(X/Q)SITE = 8.91E-06, the highest calculated annual average dispersion parameter,in sec/m3, at the Site Boundary for any of the three units, fromTable 3-2.
0.8 = administrative factor to compensate for any unexpected variability inthe radionuclide mix and to ensure that Site Boundary dose rate limitswill not be exceeded.
After determination of the QSITE whole body and skin dose rates (equations 2-3 and2-4, respectively), the most conservative result will be used as QSITE, the site releaserate limit.
QSITE,WBDWB( ) 0.8( )
Keq( ) X/Q( )SITE----------------------------------------=
QSITE,SKDSK( ) 0.8( )
L 1.1M+( )eq X/Q( )SITE-----------------------------------------------------------=
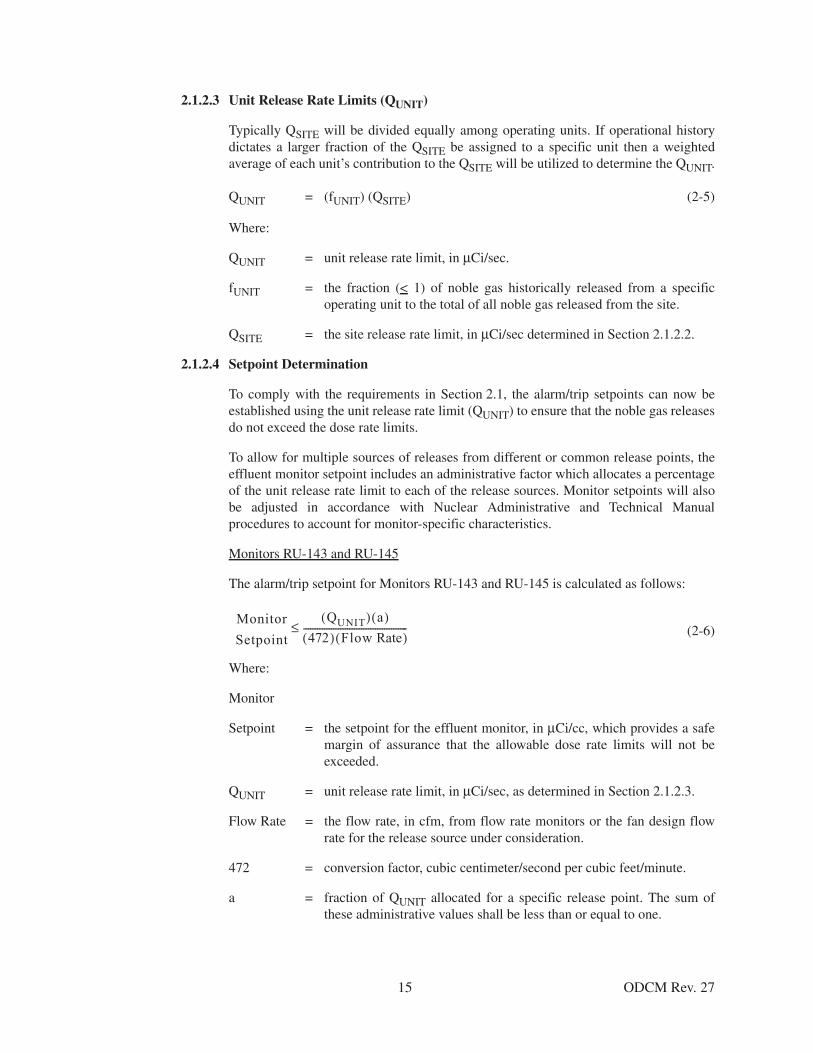
15 ODCM Rev. 27
2.1.2.3 Unit Release Rate Limits (QUNIT)
Typically QSITE will be divided equally among operating units. If operational historydictates a larger fraction of the QSITE be assigned to a specific unit then a weightedaverage of each unit’s contribution to the QSITE will be utilized to determine the QUNIT.
QUNIT = (fUNIT) (QSITE) (2-5)
Where:
QUNIT = unit release rate limit, in μCi/sec.
fUNIT = the fraction (< 1) of noble gas historically released from a specificoperating unit to the total of all noble gas released from the site.
QSITE = the site release rate limit, in μCi/sec determined in Section 2.1.2.2.
2.1.2.4 Setpoint Determination
To comply with the requirements in Section 2.1, the alarm/trip setpoints can now beestablished using the unit release rate limit (QUNIT) to ensure that the noble gas releasesdo not exceed the dose rate limits.
To allow for multiple sources of releases from different or common release points, theeffluent monitor setpoint includes an administrative factor which allocates a percentageof the unit release rate limit to each of the release sources. Monitor setpoints will alsobe adjusted in accordance with Nuclear Administrative and Technical Manualprocedures to account for monitor-specific characteristics.
Monitors RU-143 and RU-145
The alarm/trip setpoint for Monitors RU-143 and RU-145 is calculated as follows:
(2-6)
Where:
Monitor
Setpoint = the setpoint for the effluent monitor, in μCi/cc, which provides a safemargin of assurance that the allowable dose rate limits will not beexceeded.
QUNIT = unit release rate limit, in μCi/sec, as determined in Section 2.1.2.3.
Flow Rate = the flow rate, in cfm, from flow rate monitors or the fan design flowrate for the release source under consideration.
472 = conversion factor, cubic centimeter/second per cubic feet/minute.
a = fraction of QUNIT allocated for a specific release point. The sum ofthese administrative values shall be less than or equal to one.
MonitorSetpoint
QUNIT( ) a( )472( ) Flow Rate( )
---------------------------------------------≤

16 ODCM Rev. 27
Monitor RU-12
The alarm/trip setpoint for Monitor RU-12, the Waste Gas Decay Tank Monitor, iscalculated as follows:
(2-7)
Where:
Monitor
Setpoint = the setpoint for the monitor, in μCi/cc at STP, which provides a safemargin of assurance that the allowable dose rate limits will not beexceeded.
QUNIT = unit release rate limit, in μCi/sec, as determined in Section 2.1.2.3.
Flow Rate = flow rate, in cfm at STP at which the tank will be released.
PF = the current process flow of the plant vent in CFM.
H = the current plant vent monitor concentration in μCi/cc.
a = fraction of QUNIT allocated for a specific release point. Thisadministrative value should be equal to or less than the administrativevalue used for the Plant Vent.
0.9 = an administrative value to account for potential increases in activityfrom other contributors to the same release point.
472 = conversion factor, cubic centimeter/second per cubic feet/minute.
If there is no release associated with this monitor, the monitor setpoint should beestablished as close as practical to background to prevent spurious alarms, and yetassure an alarm should an inadvertent release occur.
2.1.2.5 Monitor Calibration
The Radiation Level Conversion Factor (RLF) for each monitor is entered into theRadiation Monitoring System Database and may change whenever the monitor iscalibrated. Calibration is performed in accordance with Nuclear Administrative andTechnical Manual procedures.
Monitorsetpoint
QUNIT( ) a( ) 0.9( ) H( ) PF( ) 472( )–[ ]Flow Rate( ) 472( )
----------------------------------------------------------------------------------------≤

17 ODCM Rev. 27
3.0 GASEOUS AND LIQUID EFFLUENT DOSE RATES
3.1 Requirements: Gaseous Effluents
The dose rate due to radioactive materials released in gaseous effluents from the site (see Figure 6-4and Figure 6-5) shall be limited to the following:
a. For noble gases: Less than or equal to 500 mrems/yr to the total body and less than or equal to3000 mrems/yr to the skin, and
b. For I-131 and I-133, for tritium, and for all radionuclides in particulate form with half-livesgreater than 8 days: Less than or equal to 1500 mrems/yr to any organ.
Applicability: At all times.
Action:
With the dose rate(s) exceeding the above limits, immediately decrease the release rate to within the above limits(s).
3.1.1 Surveillance Requirements
a. The dose rate due to noble gases in gaseous effluents shall be determined to be within theabove limits in accordance with the methods contained in Section 3.1.2.
b. The dose rate due to I-131, I-133, tritium and all radionuclides in particulate form withhalf-lives greater than 8 days in gaseous effluents shall be determined to be within theabove limits in accordance with the methods contained in Section 3.1.2 by obtainingrepresentative samples and performing analyses in accordance with the sampling andanalysis program specified in Table 3-1.

18 ODCM Rev. 27
3.1.2 Implementation of the Requirements
Noble Gases
Noble gas activity monitor setpoints are established at release rates which permit correctiveaction to be taken before exceeding the 10 CFR 20 annual dose limits as described inSection 2.0. The requirements for sampling and analysis of continuous and batch effluentreleases are given in Table 3-1. The methods for sampling and analysis of continuous andbatch effluent releases are given in the Nuclear Administrative and Technical Manualprocedures. The dose rate in unrestricted areas shall be determined using the followingequations.
For whole body dose rate:
(3-1)
For skin dose rate:
(3-2)
Where:
Ki = the whole body dose factor due to gamma emissions for each identified noblegas radionuclide i, in mrem/yr per μCi/m3 from Table 3-3.
Qi = the release rate of radionuclide i, in μCi/sec.
(X/Q)SITE = 8.91E-06, the highest calculated annual average dispersion parameter, insec/m3, for any of the three units, from Table 3-2.
DWB = the annual whole body dose rate (mrem/yr.).
Li = the skin dose factor due to the beta emissions for each identified noble gasradionuclide i, in mrem/yr per μCi/m3 from Table 3-3.
Mi = the air dose factor due to gamma emissions for each identified noble gasradionuclide i, in mrad/yr per μCi/m3 from Table 3-3.
DSK = the annual skin dose rate (mrem/yr).
1.1 = unit conversion constant of 1.1 mrem/mrad converts air dose to skin dose.
DWB Ki( ) X/Q( )SITE Qi( )[ ]i=
DSK Li 1.1Mi+( ) X/Q( )SITE Qi( )[ ]i=
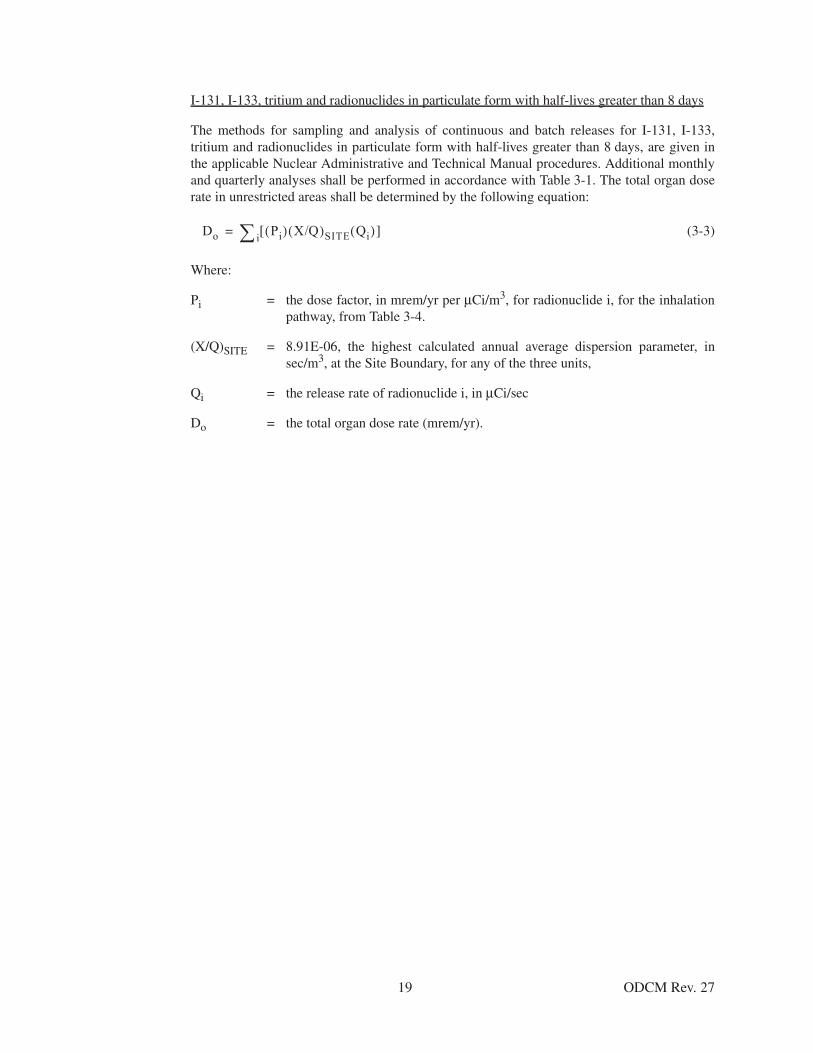
19 ODCM Rev. 27
I-131, I-133, tritium and radionuclides in particulate form with half-lives greater than 8 days
The methods for sampling and analysis of continuous and batch releases for I-131, I-133,tritium and radionuclides in particulate form with half-lives greater than 8 days, are given inthe applicable Nuclear Administrative and Technical Manual procedures. Additional monthlyand quarterly analyses shall be performed in accordance with Table 3-1. The total organ doserate in unrestricted areas shall be determined by the following equation:
(3-3)
Where:
Pi = the dose factor, in mrem/yr per μCi/m3, for radionuclide i, for the inhalationpathway, from Table 3-4.
(X/Q)SITE = 8.91E-06, the highest calculated annual average dispersion parameter, insec/m3, at the Site Boundary, for any of the three units,
Qi = the release rate of radionuclide i, in μCi/sec
Do = the total organ dose rate (mrem/yr).
Do Pi( ) X/Q( )SITE Qi( )[ ]i=
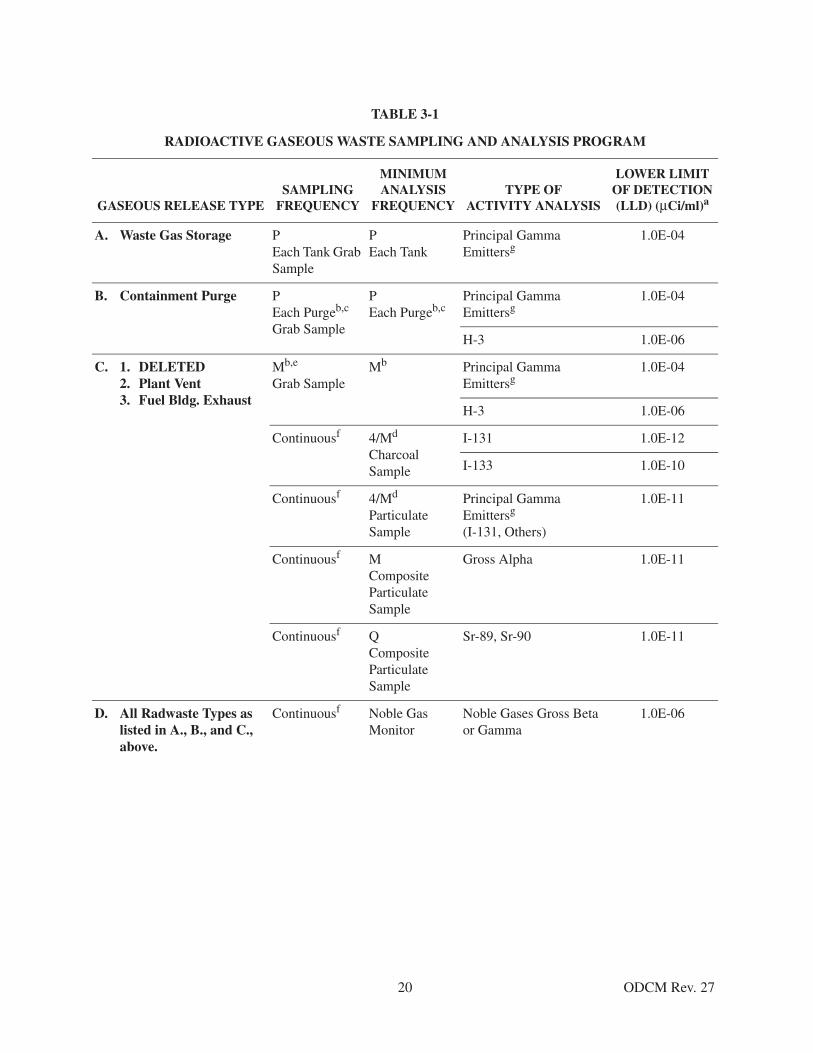
20 ODCM Rev. 27
TABLE 3-1
RADIOACTIVE GASEOUS WASTE SAMPLING AND ANALYSIS PROGRAM
GASEOUS RELEASE TYPESAMPLING
FREQUENCY
MINIMUM ANALYSIS
FREQUENCYTYPE OF
ACTIVITY ANALYSIS
LOWER LIMIT OF DETECTION (LLD) (μCi/ml)a
A. Waste Gas Storage PEach Tank Grab Sample
PEach Tank
Principal Gamma Emittersg
1.0E-04
B. Containment Purge PEach Purgeb,c
Grab Sample
PEach Purgeb,c
Principal Gamma Emittersg
1.0E-04
H-3 1.0E-06
C. 1. DELETED2. Plant Vent3. Fuel Bldg. Exhaust
Mb,e
Grab SampleMb Principal Gamma
Emittersg1.0E-04
H-3 1.0E-06
Continuousf 4/Md
Charcoal Sample
I-131 1.0E-12
I-133 1.0E-10
Continuousf 4/Md
Particulate Sample
Principal Gamma Emittersg
(I-131, Others)
1.0E-11
Continuousf MComposite Particulate Sample
Gross Alpha 1.0E-11
Continuousf QComposite Particulate Sample
Sr-89, Sr-90 1.0E-11
D. All Radwaste Types as listed in A., B., and C., above.
Continuousf Noble Gas Monitor
Noble Gases Gross Beta or Gamma
1.0E-06

21 ODCM Rev. 27
Table 3-1 (Continued)
TABLE NOTATION
a The LLD is the smallest concentration of radioactive material in a sample that will yield a net count(above system background) that will be detected with 95% probability with only 5% probability offalsely concluding that a blank observation represents a real signal.
For a particular measurement system (which may include radiochemical separation):
Where:
LLD is the a priori lower limit of detection as defined above (as μCi per unit mass or volume). Currentliterature defines the LLD as the detection capability for the instrumentation only and the MDCminimum detectable concentration, as the detection capability for a given instrument, procedure and typeof sample.
sb is the standard deviation of the background counting rate or of the counting rate of a blank sample asappropriate (as counts per minute),
E is the counting efficiency (as counts per transformation),
V is the sample size (in units of mass or volume),
2.22E6 is the number of transformations per minute per microcurie,
Y is the fractional radiochemical yield (when applicable),
λ is the radioactive decay constant for the particular radionuclide, and
Δt is the elapsed time between the midpoint of sample collection and time of counting (for planteffluents, not environmental samples).
The value of sb used in the calculation of the LLD for a detection system shall be based on the actualobserved variance of the background counting rate or of the counting rate of the blank samples (asappropriate) rather than on an unverified theoretically predicted variance. In calculating the LLD for aradionuclide determined by gamma-ray spectrometry the background should include the typicalcontributions of other radionuclides normally present in the samples. Typical values of E, V, Y, and Δtshould be used in the calculation.
It should be recognized that the LLD is defined as an a priori (before the fact) limit representing thecapability of a measurement system and not as an a posteriori (after the fact) limit for a particularmeasurement.
LLD4.66 sb
E * V * 2.22E6 * Y * exp λΔt–( )--------------------------------------------------------------------------------=

22 ODCM Rev. 27
Table 3-1 (Continued)
TABLE NOTATION
b Analyses shall also be performed following SHUTDOWN, STARTUP, or a THERMAL POWER changeexceeding 15% of the RATED THERMAL POWER within a 1-hour period if 1) analysis shows that theDOSE EQUIVALENT I-131 concentration in the primary coolant has increased more than a factor of 3;and 2) the noble gas activity monitor on the plant vent shows that effluent activity has increased by morethan a factor of 3. If the associated noble gas vent monitor is nonfunctional, samples must be obtained assoon as possible. Analyses shall be performed within a four-hour period. This requirement does notapply to the Fuel Building Exhaust.
c Sampling and analyses shall also be performed at least once per 31 days when purging time exceeds30 days continuous.
d Samples shall be changed at least 4 times a month and analyses shall be completed within 48 hours afterchanging (or after removal from sampler). When samples collected for 24 hours are analyzed, thecorresponding LLDs may be increased by a factor of 10.
e Tritium grab samples shall be taken at least monthly from the ventilation exhaust from the spent fuel poolarea, whenever spent fuel is in the spent fuel pool.
f The ratio of the sample flow rate to the sampled stream flow rate shall be known for the time periodcovered by each dose or dose rate calculation made in accordance with Requirements 3.1, 4.1 and 4.2 ofthe ODCM.
g The principal gamma emitters for which the LLD specification applies include the followingradionuclides: Kr-87, Kr-88, Xe-133, Xe-133m, Xe-135, and Xe-138 for gaseous emissions and Mn-54,Fe-59, Co-58, Co-60, Zn-65, Mo-99, Cs-134, Cs-137, Ce-141 and Ce-144 for particulate emissions. Thislist does not mean that only these nuclides are to be detected and reported. Other peaks which aremeasurable and identifiable, together with the above nuclides shall also be identified and reported in theAnnual Radioactive Effluent Release Report.
MAR 2016

23 ODCM Rev. 27
Ref
eren
ce:
Dis
tanc
es a
re f
rom
the
PVN
GS
ER
-OL
, Tab
le 2
.3-3
3. D
ispe
rsio
n an
d D
epos
ition
par
amet
ers
are
from
a S
epte
mbe
r, 19
85, c
alcu
latio
nby
NU
S C
orpo
ratio
n ba
sed
on 9
year
s of
met
eoro
logi
cal d
ata;
NU
S C
orpo
ratio
n le
tter
NU
S-A
NPP
-138
6, d
ated
Oct
ober
4, 1
985.
TA
BL
E 3
-2
DIS
PE
RSI
ON
AN
D D
EP
OSI
TIO
N P
AR
AM
ET
ER
S F
OR
LO
NG
TE
RM
RE
LE
ASE
S
AT
TH
ESI
TE
BO
UN
DA
RY
DIR
EC
TIO
ND
IST
AN
CE
(M
ET
ER
S)
UN
IT 1
X/Q
(SE
C/m
3 )D
/Q(m
-2)
UN
IT 2
D
IST
AN
CE
(M
ET
ER
S)X
/Q(S
EC
/m3 )
D/Q
(m-2
)
UN
IT 3
D
IST
AN
CE
(M
ET
ER
S)X
/Q(S
EC
/m3 )
D/Q
(m-2
)
N10
374.
93E
-06
9.24
E-0
913
183.
85E
-06
6.17
E-0
916
613.
54E
-06
4.86
E-0
9
NN
E10
574.
14E
-06
1.19
E-0
813
423.
18E
-06
7.93
E-0
916
932.
86E
-06
6.23
E-0
9
NE
2206
2.84
E-0
66.
84E
-09
2545
2.42
E-0
65.
34E
-09
2756
2.21
E-0
64.
65E
-09
EN
E19
672.
51E
-06
4.43
E-0
922
062.
22E
-06
3.64
E-0
923
372.
08E
-06
3.30
E-0
9
E19
272.
56E
-06
3.24
E-0
921
632.
27E
-06
2.66
E-0
922
902.
l4E
-06
2.41
E-0
9
ESE
1967
2.61
E-0
62.
46E
-09
2067
2.32
E-0
62.
11E
-09
2023
2.37
E-0
62.
10E
-09
SE20
493.
56E
-06
2.36
E-0
921
013.
47E
-06
2.26
E-0
922
563.
24E
-06
2.00
E-0
9
SSE
2730
3.80
E-0
61.
58E
-09
3026
3.43
E-0
61.
32E
-09
2786
3.72
E-0
61.
52E
-09
S30
065.
07E
-06
1.78
E-0
926
995.
16E
-06
1.97
E-0
923
465.
90E
-06
2.51
E-0
9
SSW
2258
6.52
E-0
63.
20E
-09
1836
7.90
E-0
64.
56E
-09
l607
8.9l
E-0
65.
73E
-09
SW14
877.
47E
-06
5.65
E-0
912
087.
72E
-06
6.88
E-0
9l0
578.
68E
-06
8.61
E-0
9
WSW
1251
4.52
E-0
65.
93E
-09
1014
5.55
E-0
68.
44E
-09
889
5.34
E-0
68.
83E
-09
W12
254.
73E
-06
9.49
E-0
9 9
935.
86E
-06
1.34
E-0
8 8
716.
72E
-06
1.67
E-0
8
WN
W12
443.
76E
-06
6.76
E-0
910
104.
67E
-06
9.60
E-0
9 8
855.
37E
-06
1.19
E-0
8
NW
1254
3.43
E-0
65.
87E
-09
1191
3.62
E-0
66.
40E
-09
l045
4.l7
E-0
67.
98E
-09
NN
W10
693.
70E
-06
7.26
E-0
913
422.
85E
-06
4.87
E-0
9l5
6l2.
93E
-06
4.58
E-0
9
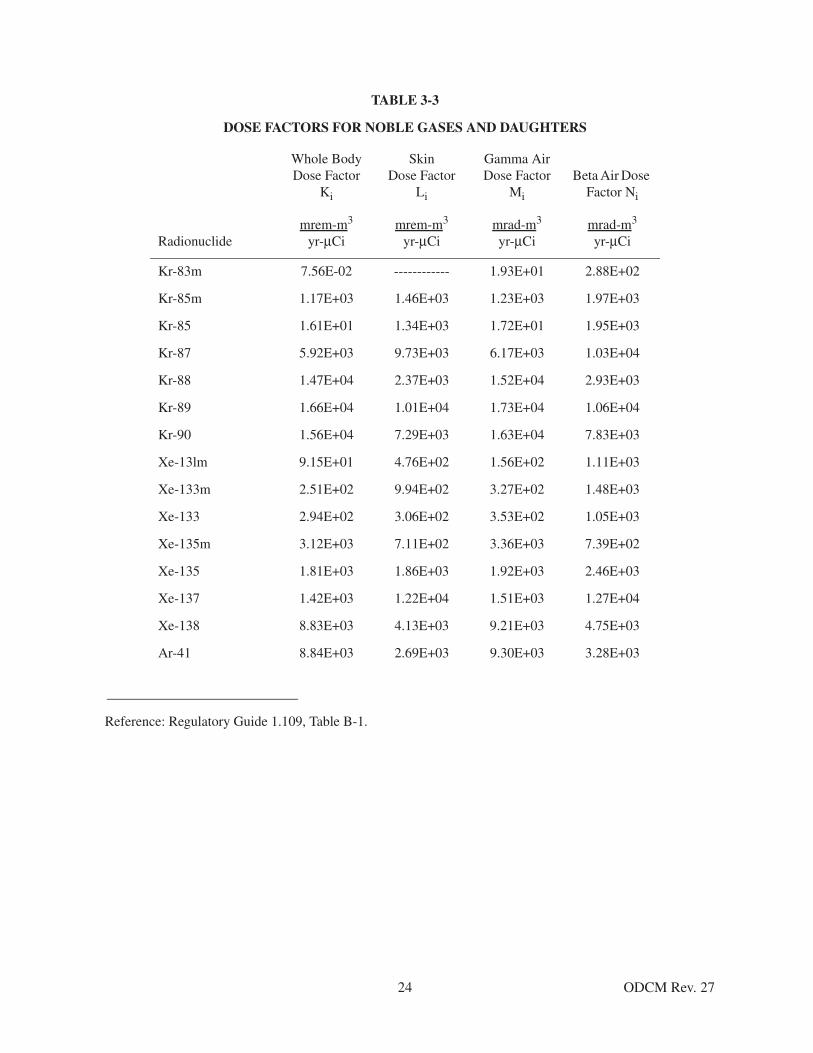
24 ODCM Rev. 27
TABLE 3-3
DOSE FACTORS FOR NOBLE GASES AND DAUGHTERS
Reference: Regulatory Guide 1.109, Table B-1.
Whole Body Dose Factor
Ki
SkinDose Factor
Li
Gamma Air Dose Factor
Mi
Beta Air Dose Factor Ni
Radionuclidemrem-m3
yr-μCimrem-m3
yr-μCimrad-m3
yr-μCimrad-m3
yr-μCi
Kr-83m 7.56E-02 ------------ 1.93E+01 2.88E+02
Kr-85m 1.17E+03 1.46E+03 1.23E+03 1.97E+03
Kr-85 1.61E+01 1.34E+03 1.72E+01 1.95E+03
Kr-87 5.92E+03 9.73E+03 6.17E+03 1.03E+04
Kr-88 1.47E+04 2.37E+03 1.52E+04 2.93E+03
Kr-89 1.66E+04 1.01E+04 1.73E+04 1.06E+04
Kr-90 1.56E+04 7.29E+03 1.63E+04 7.83E+03
Xe-13lm 9.15E+01 4.76E+02 1.56E+02 1.11E+03
Xe-133m 2.51E+02 9.94E+02 3.27E+02 1.48E+03
Xe-133 2.94E+02 3.06E+02 3.53E+02 1.05E+03
Xe-135m 3.12E+03 7.11E+02 3.36E+03 7.39E+02
Xe-135 1.81E+03 1.86E+03 1.92E+03 2.46E+03
Xe-137 1.42E+03 1.22E+04 1.51E+03 1.27E+04
Xe-138 8.83E+03 4.13E+03 9.21E+03 4.75E+03
Ar-41 8.84E+03 2.69E+03 9.30E+03 3.28E+03

25 ODCM Rev. 27
TABLE 3-4
Pi VALUES FOR THE INHALATION PATHWAY
(mrem/yr/μCi/m3)
NUCLIDE Age Group Organ Pi
H-3 TEEN LIVER 1.27E+03
CR-51 TEEN LUNG 2.10E+04
MN-54 TEEN LUNG 1.98E+06
FE-59 TEEN LUNG 1.53E+06
CO-58 TEEN LUNG 1.34E+06
CO-60 TEEN LUNG 8.72E+06
ZN-65 TEEN LUNG 1.24E+06
SR-89 TEEN LUNG 2.42E+06
SR-90 TEEN BONE 1.08E+08
ZR-95 TEEN LUNG 2.69E+06
SB-124 TEEN LUNG 3.85E+06
I-131 CHILD THYROID 1.62E+07
I-133 CHILD THYROID 3.85E+06
CS-134 TEEN LIVER 1.13E+06
CS-137 CHILD BONE 9.07E+05
BA-140 TEEN LUNG 2.03E+06
CE-141 TEEN LUNG 6.14E+05
CE-144 TEEN LUNG 1.34E+07

26 ODCM Rev. 27
3.2 Requirements: Secondary System Liquid Waste Discharges To Onsite Evaporation Ponds orCirculating Water System - Concentration
The concentration of radioactive material discharged from secondary system liquid waste to thecirculating water system shall be limited to:
5.0E-07 μCi/ml for the principal gamma emitters (except Ce-144)
3.0E-06 μCi/ml for Ce-144
1.0E-06 μCi/ml for I-131
1.0E-03 μCi/ml for H-3
The concentration of radioactive material discharged from secondary system liquid waste to theonsite evaporation ponds shall be limited to:
2.0E-06 μCi/ml for Cs-134
2.0E-06 μCi/ml for Cs-137
The concentrations specified in 10 CFR Part 20.1001-20.2402, Appendix B, Table 2, Column 2, for all other isotopes
Applicability: At all times.
Action:
When any secondary system liquid waste discharge pathway concentration determined in accordancewith the surveillance requirements given below exceeds the above Requirements, divert thatdischarge pathway to the liquid radwaste system without delay or terminate the discharge.
3.2.1 Surveillance Requirements
a. Secondary system liquid wastes shall be sampled and analyzed according to the samplingand analysis program of Table 3-5.
3.2.2 Implementation of the Requirements
This requirement is implemented by Nuclear Administrative and Technical Manualprocedures.

27 ODCM Rev. 27
TA
BL
E 3
-5
RA
DIO
AC
TIV
E L
IQU
ID W
AST
E S
AM
PL
ING
AN
D A
NA
LY
SIS
PR
OG
RA
M
Seco
ndar
y Sy
stem
Liq
uid
Rel
ease
P
athw
ayD
esti
nati
onSa
mpl
ing
&
Ana
lysi
s F
requ
ency
Not
esT
ype
Of
Act
ivit
y A
naly
sis
Low
er L
imit
O
f D
etec
tion
(L
LD
)a (μ
Ci/m
l)
1.C
hem
ical
Was
te N
eutr
aliz
er
Tank
(C
WN
T)b
Ret
entio
n Ta
nkP
Eac
h B
atch
Prin
cipa
l Gam
ma
Em
itter
sc5.
0E-0
7liq
uid
radw
aste
N. A
.I-
131
1.0E
-06
H-3
1.0E
-05
2.St
eam
Gen
erat
or B
low
dow
n L
ow T
DS
Sum
pbci
rc. w
ater
PE
ach
Bat
ch1
Prin
cipa
l Gam
ma
Em
itter
sc5.
0E-0
7C
WN
TN
. A.
I-13
11.
0E-0
6H
-31.
0E-0
53.
Con
dens
ate
a.C
onde
nsat
e Po
lishi
ng L
ow
TD
S Su
mpb
circ
. wat
erP
Eac
h B
atch
3Pr
inci
pal G
amm
a E
mitt
ersc
I-13
1H
-3
5.0E
-07
1.0E
-06
1.0E
-05
CW
NT
N. A
.
b.In
itial
Bac
kwas
h(l
ow T
DS
sum
p) to
ci
rc. w
ater
PE
ach
Dis
char
gePr
inci
pal G
amm
a E
mitt
ersc
I-13
1H
-3
5.0E
-07
1.0E
-06
1.0E
-05
(low
TD
S su
mp)
to
CW
NT
N. A
.
c.Pr
e-se
rvic
e ri
nse
effl
uent
Ret
entio
n Ta
nk
thro
ugh
SC-N
-V06
9P
Eac
h D
isch
arge
2Pr
inci
pal G
amm
a E
mitt
ersc
I-13
1H
-3
5.0E
-07
1.0E
-06
1.0E
-05
cond
ense
r th
roug
h SC
-N-U
V23
2N
. A.
d.O
verb
oard
con
dens
ate
circ
wat
er th
roug
h C
D-N
-V19
4P
Eac
h D
isch
arge
Prin
cipa
l Gam
ma
Em
itter
sc
I-13
1H
-3
5.0E
-07
1.0E
-06
1.0E
-05
Ret
entio
n Ta
nk
thro
ugh
SC-N
-V07
9P
Eac
h D
isch
arge
2
4.T
urbi
ne B
uild
ing
Sum
pdR
eten
tion
Tank
DG
rab
Sam
ple
3Pr
inci
pal G
amm
a E
mitt
ersc
I-13
1H
-3
5.0E
-07
1.0E
-06
1.0E
-05
CW
NT
N. A
.

28 ODCM Rev. 27
1Sa
mpl
ing
and
anal
ysis
are
req
uire
d on
ly w
hen
conc
entr
atio
n fo
r ch
emic
al w
aste
neu
tral
izer
tank
or
stea
m g
ener
ator
act
ivity
exc
eeds
the
requ
irem
ent
2R
U-2
00 s
hall
be d
emon
stra
ted
FUN
CT
ION
AL
by
perf
orm
ance
of
the
CH
AN
NE
L C
HE
CK
, SO
UR
CE
CH
EC
K, C
HA
NN
EL
CA
LIB
RA
TIO
N, a
ndC
HA
NN
EL
FU
NC
TIO
NA
L T
EST
at
the
freq
uenc
ies
show
n in
Tab
le 3
-6.
The
Ala
rm/T
rip
setp
oint
s fo
r R
U-2
00 a
re s
et t
o en
sure
tha
t th
eco
ncen
trat
ions
in th
e R
eten
tion
Tank
s do
not
exc
eed
the
Req
uire
men
t3
Sam
plin
g an
d an
alys
is a
re r
equi
red
only
whe
n co
ncen
trat
ion
for
chem
ical
was
te n
eutr
aliz
er ta
nk o
r co
nden
sate
act
ivity
exc
eeds
the
requ
irem
ent
5.N
orth
& S
outh
Con
dens
er A
rea
Sum
psd
Ret
entio
n Ta
nkD
Gra
b Sa
mpl
e3
Prin
cipa
l Gam
ma
Em
itter
sc
I-13
1H
-3
5.0E
-07
1.0E
-06
1.0E
-05
CW
NT
N. A
.
6.St
eam
Gen
erat
or B
low
dow
n to
R
eten
tion
Tank
Ret
entio
n Ta
nk
thro
ugh
SC-N
-V06
4P
Eac
h D
isch
arge
2Pr
inci
pal G
amm
a E
mitt
ersc
I-13
1H
-3
5.0E
-07
1.0E
-06
1.0E
-05
7.R
eten
tion
Tank
to E
vapo
ratio
n Po
ndev
apor
atio
n po
ndP
Eac
h B
atch
Prin
cipa
l Gam
ma
Em
itter
sc
I-13
1H
-3
5.0E
-07
1.0E
-06
1.0E
-05
TA
BL
E 3
-5
RA
DIO
AC
TIV
E L
IQU
ID W
AST
E S
AM
PL
ING
AN
D A
NA
LY
SIS
PR
OG
RA
M
Seco
ndar
y Sy
stem
Liq
uid
Rel
ease
P
athw
ayD
esti
nati
onSa
mpl
ing
&
Ana
lysi
s F
requ
ency
Not
esT
ype
Of
Act
ivit
y A
naly
sis
Low
er L
imit
O
f D
etec
tion
(L
LD
)a ( μ
Ci/m
l)
MA
R 2
016

29 ODCM Rev. 27
Table 3-5 (Continued)
TABLE NOTATION
a The LLD is defined as the smallest concentration of radioactive material in a sample that will yield a netcount, above system background, that will be detected with 95% probability with only 5% probability offalsely concluding that a blank observation represents a “real” signal.
For a particular measurement system which may include radiochemical separation:
Where:
LLD is the “a priori” lower limit of detection as defined above as microcuries per unit mass or volume,
sb is the standard deviation of the background counting rate or of the counting rate of a blank sample asappropriate as counts per minute,
E is the counting efficiency as counts per disintegration,
V is the sample size in units of mass or volume,
2.22E6 is the number of disintegrations per minute per microcurie,
Y is the fractional radiochemical yield when applicable,
λ is the radioactive decay constant for the particular radionuclide, and
Δt is the elapsed time between midpoint of sample collection and time of counting.
Typical values of E, V, Y, and Δt should be used in the calculation.
It should be recognized that the LLD is defined as an a priori (before the fact) limit representing thecapability of a measurement system and not as an a posteriori (after the fact) limit for a particularmeasurement.
b A batch release is the discharge of liquid wastes of a discrete volume. Prior to sampling for analyses,each batch shall be isolated, and then thoroughly mixed to assure representative sampling.
c The principal gamma emitters for which the LLD specification applies include the followingradionuclides: Mn-54, Fe-59, Co-58, Co-60, Zn-65, Mo-99, Cs-134, Cs-137, and Ce-141. Ce-144 shallalso be measured, but with an LLD of 3.0E-06. This list does not mean that only these nuclides are to beconsidered. Other gamma peaks that are identifiable, together with those of the above nuclides, shall alsobe analyzed and reported in the Annual Radioactive Effluent Release Report.
d A continuous release is the discharge of liquid wastes of a nondiscrete volume, e.g., from a volume of asystem that has an input flow during the continuous release
LLD4.66 sb
E * V * 2.22E6 * Y * exp λΔt–( )--------------------------------------------------------------------------------=

30 ODCM Rev. 27
TABLE 3-6
RADIOACTIVE LIQUID EFFLUENT MONITORING INSTRUMENTATION
InstrumentChannel Check
Source Check
Channel Calibration
Channel Functional
Test
Mode in which Surveillance is
Required
RU-200 P N. A. R Q See Table 3-7
TABLE 3-7
RADIOACTIVE LIQUID EFFLUENT MONITORING INSTRUMENTATION
SURVEILLANCE REQUIREMENTS
Secondary System Liquid Release Pathway
Mode in which
Surveillance is Required Action if RU-200 is nonfunctional
Pre-service rinse to Retention Tanks At All Times
Obtain grab sample at least once per 12 hours and analyze in accordance with section 3.2
Condensate overboard to Retention Tanks 1-4
Obtain grab sample at least once per 12 hours and analyses in accordance with section 3.2
Steam Generator Blowdown/Drain to Retention Tanks
At All Times
Modes 1-4: Suspend the release
Modes 5,6 & defueled: Obtain grab sample at least once per 12 hours and analyze in accordance with sec-tion 3.2
MAR 2016

31 ODCM Rev. 27
4.0 GASEOUS & LIQUID EFFLUENTS - DOSE
4.1 Requirements: Noble Gases
The air dose due to noble gases released in gaseous effluents, from each reactor unit to areas at andbeyond the SITE BOUNDARY (see Figure 6-4 and Figure 6-5) shall be limited to the following:
a. During any calendar quarter: Less than or equal to 5 mrads for gamma radiation and less than orequal to 10 mrads for beta radiation and,
b. During any calendar year: Less than or equal to 10 mrads for gamma radiation and less than orequal to 20 mrads for beta radiation.
Applicability: At all times.
Action:
With the calculated air dose from radioactive noble gases in gaseous effluents exceeding any ofthe above limits, prepare and submit to the Commission within 30 days, a Special Report thatidentifies the cause(s) for exceeding the limit(s) and defines the corrective actions that havebeen taken to reduce the releases and the proposed corrective actions to be taken to assure thatsubsequent releases will be in compliance with the above limits.
4.1.1 Surveillance Requirements
a. Cumulative dose contributions for the current calendar quarter and current calendar yearfor noble gases shall be determined in accordance with the methodology contained inSection 4.1.2 at least once per 31 days.

32 ODCM Rev. 27
4.1.2 Implementation of the Requirement: Noble Gas
The air dose in unrestricted areas beyond the site boundary due to noble gases released ingaseous effluents from each unit during any specified time period shall be determined by thefollowing equations:
For gamma radiation:
D γu = (3.17E-08) Σi [(Mi) (X/Q)UNIT(Qi)] (4-1)
For beta radiation:
D βu = (3.17E-08) Σi [(Ni) (X/Q)UNIT(Qi)] (4-2)
Where:
Mi = the air dose factor due to gamma emissions for each identified noble gasradionuclide i, in mrad/yr per μCi/m3 from Table 3-3.
Ni = the air dose factor due to beta emissions for each identified noble gasradionuclide i, in mrad/yr per μCi/m3 from Table 3-3.
(X/Q)UNIT = the highest calculated annual average dispersion parameter, in sec/m3, at thesite boundary for the particular Unit, from Table 3-2. Optionally, the highestvalue may be used for any Unit calculation.
=7.47E-06 from Unit l=7.90E-06 from Unit 2=8.91E-06 from Unit 3
D γu = the total gamma air dose, for the particular unit, in mrad, due to noble gasesreleased in gaseous effluents for a specified time period at the SITEBOUNDARY.
D βu = the total beta air dose, for the particular unit, in mrad, due to noble gasesreleased in gaseous effluents for a specified time period at the SITEBOUNDARY.
Qi = the integrated release, from the particular unit, in μCi, of each identifiednoble gas radionuclide i, in gaseous effluents for a specified time period.
3.17E-08 = the inverse of seconds in a year (yr/sec).
The cumulative gamma air dose and beta air dose for a quarterly or annual evaluation shall bebased on the calculated dose contribution from each specified time period occurring during thereporting time period.
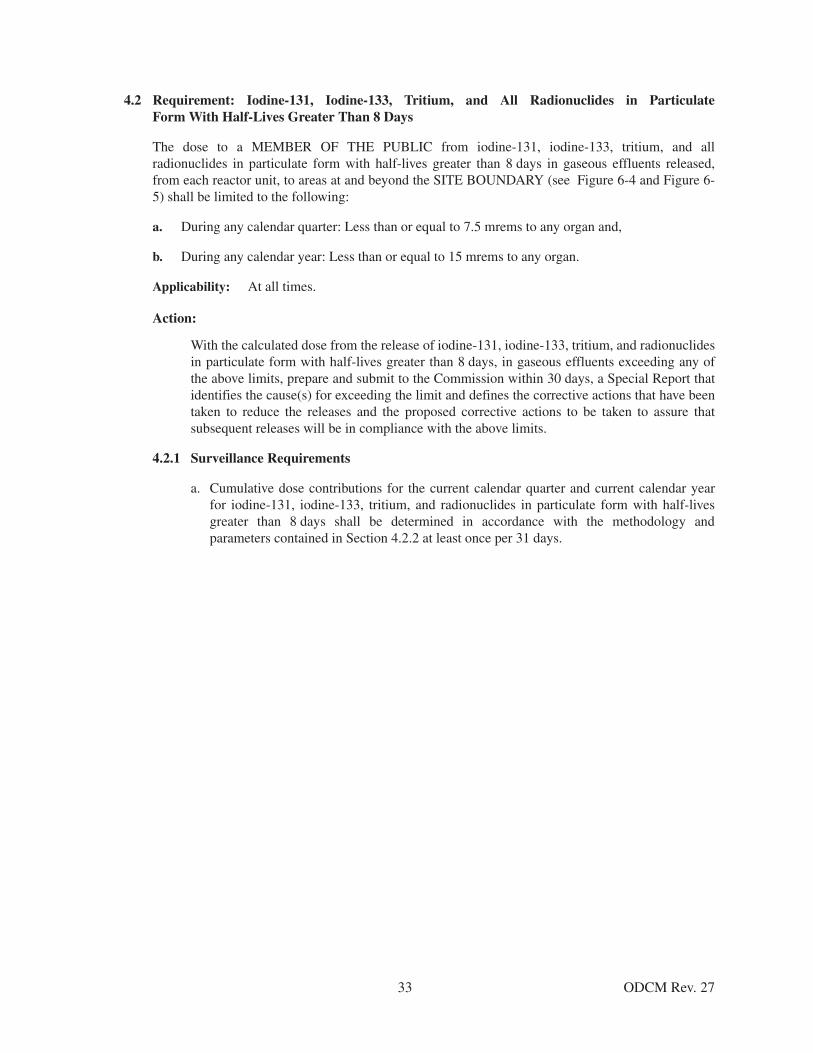
33 ODCM Rev. 27
4.2 Requirement: Iodine-131, Iodine-133, Tritium, and All Radionuclides in ParticulateForm With Half-Lives Greater Than 8 Days
The dose to a MEMBER OF THE PUBLIC from iodine-131, iodine-133, tritium, and allradionuclides in particulate form with half-lives greater than 8 days in gaseous effluents released,from each reactor unit, to areas at and beyond the SITE BOUNDARY (see Figure 6-4 and Figure 6-5) shall be limited to the following:
a. During any calendar quarter: Less than or equal to 7.5 mrems to any organ and,
b. During any calendar year: Less than or equal to 15 mrems to any organ.
Applicability: At all times.
Action:
With the calculated dose from the release of iodine-131, iodine-133, tritium, and radionuclidesin particulate form with half-lives greater than 8 days, in gaseous effluents exceeding any ofthe above limits, prepare and submit to the Commission within 30 days, a Special Report thatidentifies the cause(s) for exceeding the limit and defines the corrective actions that have beentaken to reduce the releases and the proposed corrective actions to be taken to assure thatsubsequent releases will be in compliance with the above limits.
4.2.1 Surveillance Requirements
a. Cumulative dose contributions for the current calendar quarter and current calendar yearfor iodine-131, iodine-133, tritium, and radionuclides in particulate form with half-livesgreater than 8 days shall be determined in accordance with the methodology andparameters contained in Section 4.2.2 at least once per 31 days.

34 ODCM Rev. 27
4.2.2 Implementation of the Requirement
The organ dose to an individual from I-131, I-133, tritium, and all radionuclides in particulateform, with half-lives greater than eight days, in gaseous effluents released to unrestricted areasfrom each reactor unit is calculated using the following expressions:
Dou = (3.17E-08) Σi [Σk (Rik Wk) (Qi)] (4-3)
Where:
Dou = the total accumulated organ dose from gaseous effluents for a particular unit,to a MEMBER OF THE PUBLIC, in mrem, at the SITE BOUNDARY or atthe controlling location.
Qi = the quantity of radionuclide i, in μCi, released in gaseous effluents from aparticular unit.
Rik = the dose factor for each identified radionuclide i, for pathway k (for theinhalation pathway in mrem/yr per μCi/m3 and for the food and ground planepathways in m2 - mrem/yr per μCi/sec, except H-3, which has units ofmrem/yr per μCi/m3) at the controlling location. The Rik’s for each age groupare given in Tables 4-1 through 4-15.
3.17E-08 = the inverse of seconds per year (yr/sec).
Wk = the highest annual average dispersion or deposition parameter for theparticular Unit, used for estimating the dose at the site boundary or to aMEMBER OF THE PUBLIC at the controlling location for the particularUnit. Optionally, the highest value may be used for any Unit calculation.
= (X/Q)UNIT, in sec/m3 for the inhalation pathway and for all tritiumcalculations, for organ dose at the site boundary, from Table 3-2.
=7.47E-06 from Unit 1=7.90E-06 from Unit 2=8.91E-06 from Unit 3
= (X/Q)UNIT, in sec/m3 for the inhalation pathway and for all tritiumcalculations, for organ dose at the controlling location, from Table 4-16, 4-17or 4-18.
=2.92E-06 from Unit 1=2.19E-06 from Unit 2=2.31E-06 from Unit 3
= (D/Q)UNIT, in m-2, for the food and ground plane pathways, for organ dose atthe site boundary, from Table 3-2.
=1.19E-08 from Unit 1=1.34E-08 from Unit 2=1.67E-08 from Unit 3

35 ODCM Rev. 27
= (D/Q)UNIT, in m-2, for the food and ground plane pathways, for organ dose atthe controlling location, from Table 4-16, 4-17, or 4-18.
=3.25E-09 from Unit 1=3.88E-10 from Unit 2=4.21E-10 from Unit 3
Residences, vegetable gardens and milk animals located within 5 miles of the site will beidentified during the annual land use census. The controlling pathway and location will beidentified and will be used for all MEMBER OF THE PUBLIC dose evaluations.
The Ri values were calculated in accordance with the methodologies in NUREG-0133. Thefollowing site specific information was used to calculate Ri:
Value
The length of the grazing season for milk animals (fs).Ref. ER-OL, Section 2.1.3.4.3 0.75
The length of the grazing season for meat animals (fs).Ref. ER-OL, Section 2.1.3.4.4 0.25
The fraction of daily feed derived from pasture while on pasture for milk animals (fp).Ref. ER-OL, Section 2.1.3.4.3 0.35
The fraction of daily feed derived from pasture while on pasture for meat animals (fp).Ref. ER-OL, Section 2.1.3.4.3 0.05
The fraction of year vegetables are grown, (fl) approximation.Ref. ER-OL, Section 2.1.3.4, Table 2.1-8. 0.667
The annual absolute humidity (g/m3), H,Ref. UFSAR, Table 2.3-16 6

36 ODCM Rev. 27
4.3 Requirements: Gaseous Radwaste Treatment
The GASEOUS RADWASTE SYSTEM and the VENTILATION EXHAUST TREATMENTSYSTEM shall be used to reduce radioactive materials in gaseous waste prior to their discharge whenthe projected gaseous effluent air doses due to gaseous effluent releases, from each reactor unit, fromthe site (see Figure 6-4 and Figure 6-5) when averaged over 31 days, would exceed 0.2 mrad forgamma radiation and 0.4 mrad for beta radiation. The VENTILATION EXHAUST TREATMENTSYSTEM shall be used to reduce radioactive materials in gaseous waste prior to their discharge whenthe projected doses due to gaseous effluent releases, from each reactor unit, to areas at and beyond theSITE BOUNDARY (see Figure 6-4 and Figure 6-5) when averaged over 31 days would exceed0.3 mrem to any organ of a MEMBER OF THE PUBLIC.
Applicability: At all times:
Action:
With radioactive gaseous waste being discharged without treatment and in excess of the above limits,prepare and submit to the Commission within 30 days, a Special Report which includes the followinginformation:
a. Identification of the nonfunctional equipment or subsystems and the reason for nonfunctionality,
b. Action(s) taken to restore the nonfunctional equipment to FUNCTIONAL status, and
c. Summary description of action(s) taken to prevent a recurrence.
4.3.1 Surveillance Requirements
a. Doses due to gaseous releases from the site shall be projected at least once per 31 days, inaccordance with the methodology and parameters in Section 4.3.2.
MAR 2016

37 ODCM Rev. 27
4.3.2 Implementation of the Requirement
Where possible, consideration for expected operational evolutions (i.e., outages, etc.) shouldbe taken in the dose projections.
Dose Projection - Noble Gases
The air dose, in mrads is determined using the methodology described in Section 4.1.2 of thismanual. This information is used to determine an air dose projection for the next 31 days usingthe following equations:
For gamma radiation:
31 day γ = Dγ + CDγ (4-4)
For beta radiation:
31 day β = Dβ + CDβ (4-5)
Where:
Dγ = the total gamma air dose in mrads at the site boundary due to noble gasesreleased in gaseous effluents for the previous 31 days.
Dβ = the total beta air dose in mrads at the site boundary due to noble gasesreleased in gaseous effluents for the previous 31 days.
CDγ = any current or projected change in gamma air dose, in mrads, due to noblegases released in gaseous effluents, which could have a significant impact on31 day γ.
CDβ = any current or projected change in beta air dose, in mrads, due to noble gasesreleased in gaseous effluents, which could have a significant impact on 31day β.
When performing the 31 day dose projection using the Gaseous Radioactive Effluent TrackingSystem (GRETS), Dγ and Dβ will include the dose from any release permits that fall withinthe selected 31 day time period. As a result, the actual dose projection will often be based onthe accumulated dose for a time period greater than 31 days.

38 ODCM Rev. 27
Dose Projection - I-131, I-133, tritium, and all radionuclides in particulate form with half-livesgreater than eight days
The organ dose, in mrem, is determined using the methodology described in Section 4.2.2 ofthis manual. This information is used to determine an organ dose projection for the next31 days using the following equation:
31dayo = Do + CDo (4-6)
Where:
Do = the total organ dose due to I-131, I-133, tritium, and all radionuclides inparticulate form with half-lives greater than eight days in mrem, released ingaseous effluents for the previous 31 days.
CDo = any current or projected change in organ dose, in mrem, which could have asignificant impact on 31 dayo.
When performing the 31 day dose projection using the Gaseous Radioactive Effluent TrackingSystem (GRETS), Do will include the dose from any release permits that fall within theselected 31 day time period. As a result, the actual dose projection will often be based on theaccumulated dose for a time period greater than 31 days.
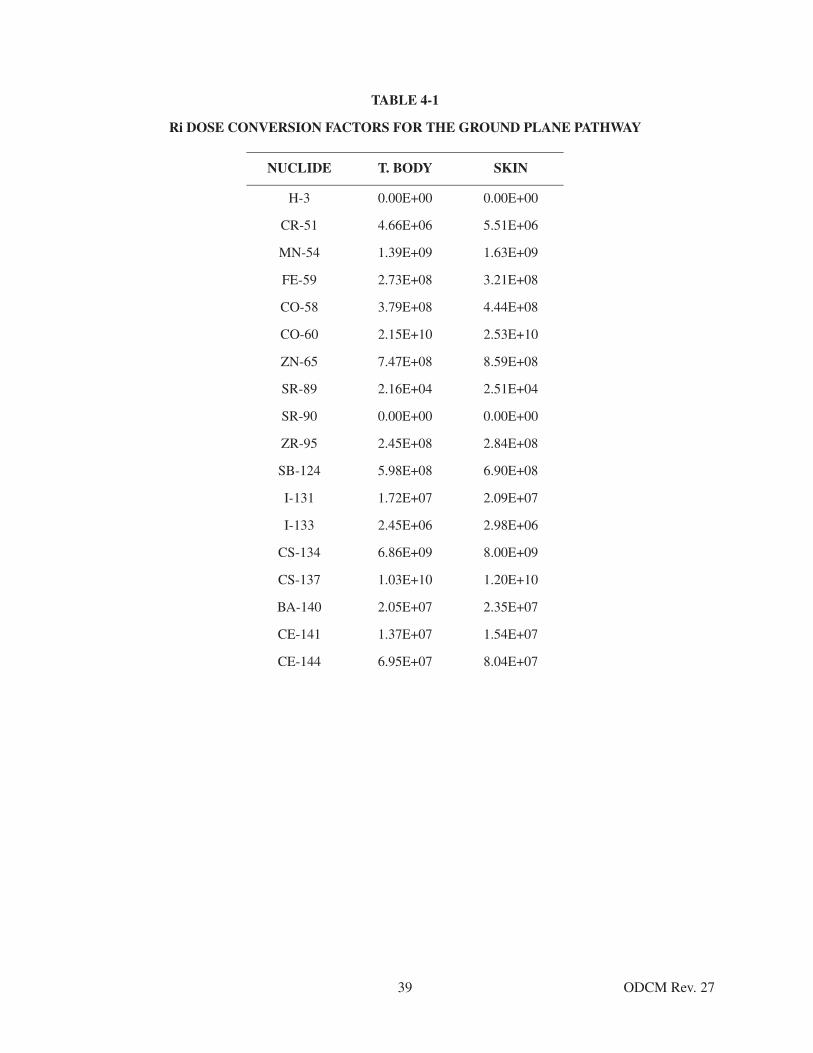
39 ODCM Rev. 27
TABLE 4-1
Ri DOSE CONVERSION FACTORS FOR THE GROUND PLANE PATHWAY
NUCLIDE T. BODY SKIN
H-3 0.00E+00 0.00E+00
CR-51 4.66E+06 5.51E+06
MN-54 1.39E+09 1.63E+09
FE-59 2.73E+08 3.21E+08
CO-58 3.79E+08 4.44E+08
CO-60 2.15E+10 2.53E+10
ZN-65 7.47E+08 8.59E+08
SR-89 2.16E+04 2.51E+04
SR-90 0.00E+00 0.00E+00
ZR-95 2.45E+08 2.84E+08
SB-124 5.98E+08 6.90E+08
I-131 1.72E+07 2.09E+07
I-133 2.45E+06 2.98E+06
CS-134 6.86E+09 8.00E+09
CS-137 1.03E+10 1.20E+10
BA-140 2.05E+07 2.35E+07
CE-141 1.37E+07 1.54E+07
CE-144 6.95E+07 8.04E+07

40 ODCM Rev. 27
TABLE 4-2
Ri DOSE CONVERSION FACTORS FOR THE VEGETATION
PATHWAY - ADULT RECEPTOR
NUCLIDE BONE LIVER T.BODY THYROID KIDNEY LUNG GI-LLI
H-3 0.00E+00 2.87E+03 2.87E+03 2.87E+03 2.87E+03 2.87E+03 2.87E+03
CR-51 0.00E+00 0.00E+00 4.00E+04 2.39E+04 8.82E+03 5.31E+04 1.01E+07
MN-54 0.00E+00 2.97E+08 5.66E+07 0.00E+00 8.83E+07 0.00E+00 9.09E+08
FE-59 1.14E+08 2.68E+08 1.03E+08 0.00E+00 0.00E+00 7.49E+07 8.93E+08
CO-58 0.00E+00 2.84E+07 6.38E+07 0.00E+00 0.00E+00 0.00E+00 5.76E+08
CO-60 0.00E+00 1.59E+08 3.51E+08 0.00E+00 0.00E+00 0.00E+00 2.99E+09
ZN-65 3.00E+08 9.56E+08 4.32E+08 0.00E+00 6.39E+08 0.00E+00 6.02E+08
SR-89 9.08E+09 0.00E+00 2.61E+08 0.00E+00 0.00E+00 0.00E+00 1.46E+09
SR-90 5.76E+11 0.00E+00 1.41E+11 0.00E+00 0.00E+00 0.00E+00 1.67E+10
ZR-95 1.08E+06 3.47E+05 2.35E+05 0.00E+00 5.45E+05 0.00E+00 1.10E+09
SB-124 9.53E+07 1.80E+06 3.78E+07 2.31E+05 0.00E+00 7.42E+07 2.71E+09
I-131 5.49E+07 7.85E+07 4.50E+07 2.57E+10 1.35E+08 0.00E+00 2.07E+07
I-133 1.39E+06 2.42E+06 7.38E+05 3.56E+08 4.22E+06 0.00E+00 2.17E+06
CS-134 4.44E+09 1.06E+10 8.64E+09 0.00E+00 3.42E+09 1.13E+09 1.85E+08
CS-137 6.06E+09 8.29E+09 5.43E+09 0.00E+00 2.81E+09 9.36E+08 1.60E+08
BA-140 9.43E+07 1.19E+05 6.18E+06 0.00E+00 4.03E+04 6.78E+04 1.94E+08
CE-141 1.73E+05 1.17E+05 1.33E+04 0.00E+00 5.44E+04 0.00E+00 4.48E+08
CE-144 3.12E+07 1.30E+07 1.67E+06 0.00E+00 7.73E+06 0.00E+00 1.05E+10

41 ODCM Rev. 27
TABLE 4-3
Ri DOSE CONVERSION FACTORS FOR THE VEGETATION
PATHWAY - TEEN RECEPTOR
NUCLIDE BONE LIVER T.BODY THYROID KIDNEY LUNG GI-LLI
H-3 0.00E+00 3.36E+03 3.36E+03 3.36E+03 3.36E+03 3.36E+03 3.36E+03
CR-51 0.00E+00 0.00E+00 5.60E+04 3.11E+04 1.23E+04 7.99E+04 9.41E+06
MN-54 0.00E+00 4.41E+08 8.74E+07 0.00E+00 1.31E+08 0.00E+00 9.04E+08
FE-59 1.69E+08 3.94E+08 1.52E+08 0.00E+00 0.00E+00 1.24E+08 9.31E+08
CO-58 0.00E+00 4.16E+07 9.59E+07 0.00E+00 0.00E+00 0.00E+00 5.74E+08
CO-60 0.00E+00 2.42E+08 5.45E+08 0.00E+00 0.00E+00 0.00E+00 3.15E+09
ZN-65 4.11E+08 1.43E+09 6.65E+08 0.00E+00 9.12E+08 0.00E+00 6.04E+08
SR-89 1.43E+10 0.00E+00 4.10E+08 0.00E+00 0.00E+00 0.00E+00 1.70E+09
SR-90 7.30E+11 0.00E+00 1.80E+11 0.00E+00 0.00E+00 0.00E+00 2.05E+10
ZR-95 1.64E+06 5.17E+05 3.56E+05 0.00E+00 7.60E+05 0.00E+00 1.19E+09
SB-124 1.47E+08 2.70E+06 5.73E+07 3.33E+05 0.00E+00 1.28E+08 2.96E+09
I-131 5.29E+07 7.41E+07 3.98E+07 2.16E+10 1.28E+08 0.00E+00 1.47E+07
I-133 1.29E+06 2.19E+06 6.68E+05 3.06E+08 3.84E+06 0.00E+00 1.66E+06
CS-134 6.90E+09 1.62E+10 7.53E+09 0.00E+00 5.16E+09 1.97E+09 2.02E+08
CS-137 9.86E+09 1.31E+10 4.57E+09 0.00E+00 4.46E+09 1.73E+09 1.87E+08
BA-140 1.07E+08 1.31E+05 6.88E+06 0.00E+00 4.44E+04 8.80E+04 1.65E+08
CE-141 2.61E+05 1.74E+05 2.00E+04 0.00E+00 8.19E+04 0.00E+00 4.98E+08
CE-144 5.11E+07 2.12E+07 2.75E+06 0.00E+00 1.26E+07 0.00E+00 1.29E+10

42 ODCM Rev. 27
TABLE 4-4
Ri DOSE CONVERSION FACTORS FOR THE VEGETATION
PATHWAY - CHILD RECEPTOR
NUCLIDES BONE LIVER T.BODY THYROID KIDNEY LUNG GI-LLI
H-3 0.00E+00 5.23E+03 5.23E+03 5.23E+03 5.23E+03 5.23E+03 5.23E+03
CR-51 0.00E+00 0.00E+00 1.08E+05 6.02E+04 1.64E+04 1.10E+05 5.75E+06
MN-54 0.00E+00 6.49E+08 1.73E+08 0.00E+00 1.82E+08 0.00E+00 5.45E+08
FE-59 3.79E+08 6.13E+08 3.05E+08 0.00E+00 0.00E+00 1.78E+08 6.38E+08
CO-58 0.00E+00 6.21E+07 1.90E+08 0.00E+00 0.00E+00 0.00E+00 3.62E+08
CO-60 0.00E+00 3.70E+08 1.09E+09 0.00E+00 0.00E+00 0.00E+00 2.05E+09
ZN-65 7.93E+08 2.11E+09 1.31E+09 0.00E+00 1.33E+09 0.00E+00 3.71E+08
SR-89 3.44E+10 0.00E+00 9.83E+08 0.00E+00 0.00E+00 0.00E+00 1.33E+09
SR-90 1.22E+12 0.00E+00 3.09E+11 0.00E+00 0.00E+00 0.00E+00 1.64E+10
ZR-95 3.72E+06 8.17E+05 7.27E+05 0.00E+00 1.17E+06 0.00E+00 8.52E+08
SB-124 3.38E+08 4.39E+06 1.19E+08 7.47E+05 0.00E+00 1.88E+08 2.12E+09
I-131 9.95E+07 1.00E+08 5.68E+07 3.31E+10 1.64E+08 0.00E+00 8.90E+06
I-133 2.36E+06 2.91E+06 1.10E+06 5.41E+08 4.85E+06 0.00E+00 1.17E+06
CS-134 1.57E+10 2.57E+10 5.43E+09 0.00E+00 7.98E+09 2.86E+09 1.39E+08
CS-137 2.34E+10 2.24E+10 3.31E+09 0.00E+00 7.31E+09 2.63E+09 1.40E+08
BA-140 2.20E+08 1.93E+05 1.28E+07 0.00E+00 6.27E+04 1.15E+05 1.11E+08
CE-141 6.15E+05 3.07E+05 4.55E+04 0.00E+00 1.34E+05 0.00E+00 3.83E+08
CE-144 1.24E+08 3.89E+07 6.62E+06 0.00E+00 2.15E+07 0.00E+00 1.01E+10

43 ODCM Rev. 27
TABLE 4-5
Ri DOSE CONVERSION FACTORS FOR THE GRASS-COW-MEAT
PATHWAY - ADULT RECEPTOR
NUCLIDE BONE LIVER T.BODY THYROID KIDNEY LUNG GI-LLI
H-3 0.00E+00 4.33E+02 4.33E+02 4.33E+02 4.33E+02 4.33E+02 4.33E+02
CR-51 0.00E+00 0.00E+00 3.44E+02 2.06E+02 7.58E+01 4.57E+02 8.65E+04
MN-54 0.00E+00 2.71E+06 5.18E+05 0.00E+00 8.08E+05 0.00E+00 8.31E+06
FE-59 2.60E+07 6.11E+07 2.34E+07 0.00E+00 0.00E+00 1.71E+07 2.04E+08
CO-58 0.00E+00 2.84E+06 6.36E+06 0.00E+00 0.00E+00 0.00E+00 5.75E+07
CO-60 0.00E+00 2.61E+07 5.76E+07 0.00E+00 0.00E+00 0.00E+00 4.90E+08
ZN-65 9.97E+07 3.17E+08 1.43E+08 0.00E+00 2.12E+08 0.00E+00 2.00E+08
SR-89 3.41E+07 0.00E+00 9.79E+05 0.00E+00 0.00E+00 0.00E+00 5.47E+06
SR-90 4.43E+09 0.00E+00 1.09E+09 0.00E+00 0.00E+00 0.00E+00 1.28E+08
ZR-95 2.68E+05 8.58E+04 5.81E+04 0.00E+00 1.35E+05 0.00E+00 2.72E+08
SB-124 2.67E+06 5.05E+04 1.06E+06 6.48E+03 0.00E+00 2.08E+06 7.59E+07
I-131 1.36E+05 1.94E+05 1.11E+05 6.37E+07 3.33E+05 0.00E+00 5.13E+04
I-133 4.56E-03 7.94E-03 2.42E-03 1.17E+00 1.39E-02 0.00E+00 7.14E-03
CS-134 2.17E+08 5.17E+08 4.23E+08 0.00E+00 1.67E+08 5.56E+07 9.05E+06
CS-137 3.11E+08 4.25E+08 2.78E+08 0.00E+00 1.44E+08 4.79E+07 8.22E+06
BA-140 4.35E+05 5.46E+02 2.85E+04 0.00E+00 1.86E+02 3.13E+02 8.95E+05
CE-141 8.87E+02 6.00E+02 6.80E+01 0.00E+00 2.79E+02 0.00E+00 2.29E+06
CE-144 4.23E+05 1.77E+05 2.27E+04 0.00E+00 1.05E+05 0.00E+00 1.43E+08
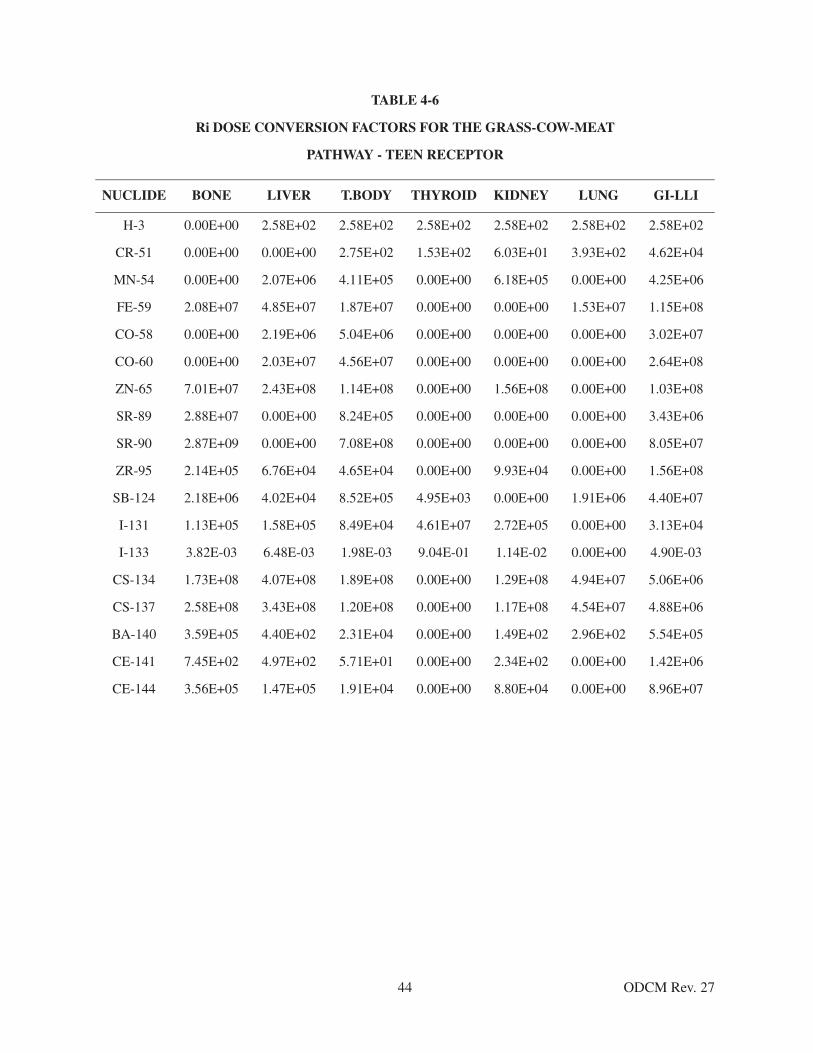
44 ODCM Rev. 27
TABLE 4-6
Ri DOSE CONVERSION FACTORS FOR THE GRASS-COW-MEAT
PATHWAY - TEEN RECEPTOR
NUCLIDE BONE LIVER T.BODY THYROID KIDNEY LUNG GI-LLI
H-3 0.00E+00 2.58E+02 2.58E+02 2.58E+02 2.58E+02 2.58E+02 2.58E+02
CR-51 0.00E+00 0.00E+00 2.75E+02 1.53E+02 6.03E+01 3.93E+02 4.62E+04
MN-54 0.00E+00 2.07E+06 4.11E+05 0.00E+00 6.18E+05 0.00E+00 4.25E+06
FE-59 2.08E+07 4.85E+07 1.87E+07 0.00E+00 0.00E+00 1.53E+07 1.15E+08
CO-58 0.00E+00 2.19E+06 5.04E+06 0.00E+00 0.00E+00 0.00E+00 3.02E+07
CO-60 0.00E+00 2.03E+07 4.56E+07 0.00E+00 0.00E+00 0.00E+00 2.64E+08
ZN-65 7.01E+07 2.43E+08 1.14E+08 0.00E+00 1.56E+08 0.00E+00 1.03E+08
SR-89 2.88E+07 0.00E+00 8.24E+05 0.00E+00 0.00E+00 0.00E+00 3.43E+06
SR-90 2.87E+09 0.00E+00 7.08E+08 0.00E+00 0.00E+00 0.00E+00 8.05E+07
ZR-95 2.14E+05 6.76E+04 4.65E+04 0.00E+00 9.93E+04 0.00E+00 1.56E+08
SB-124 2.18E+06 4.02E+04 8.52E+05 4.95E+03 0.00E+00 1.91E+06 4.40E+07
I-131 1.13E+05 1.58E+05 8.49E+04 4.61E+07 2.72E+05 0.00E+00 3.13E+04
I-133 3.82E-03 6.48E-03 1.98E-03 9.04E-01 1.14E-02 0.00E+00 4.90E-03
CS-134 1.73E+08 4.07E+08 1.89E+08 0.00E+00 1.29E+08 4.94E+07 5.06E+06
CS-137 2.58E+08 3.43E+08 1.20E+08 0.00E+00 1.17E+08 4.54E+07 4.88E+06
BA-140 3.59E+05 4.40E+02 2.31E+04 0.00E+00 1.49E+02 2.96E+02 5.54E+05
CE-141 7.45E+02 4.97E+02 5.71E+01 0.00E+00 2.34E+02 0.00E+00 1.42E+06
CE-144 3.56E+05 1.47E+05 1.91E+04 0.00E+00 8.80E+04 0.00E+00 8.96E+07
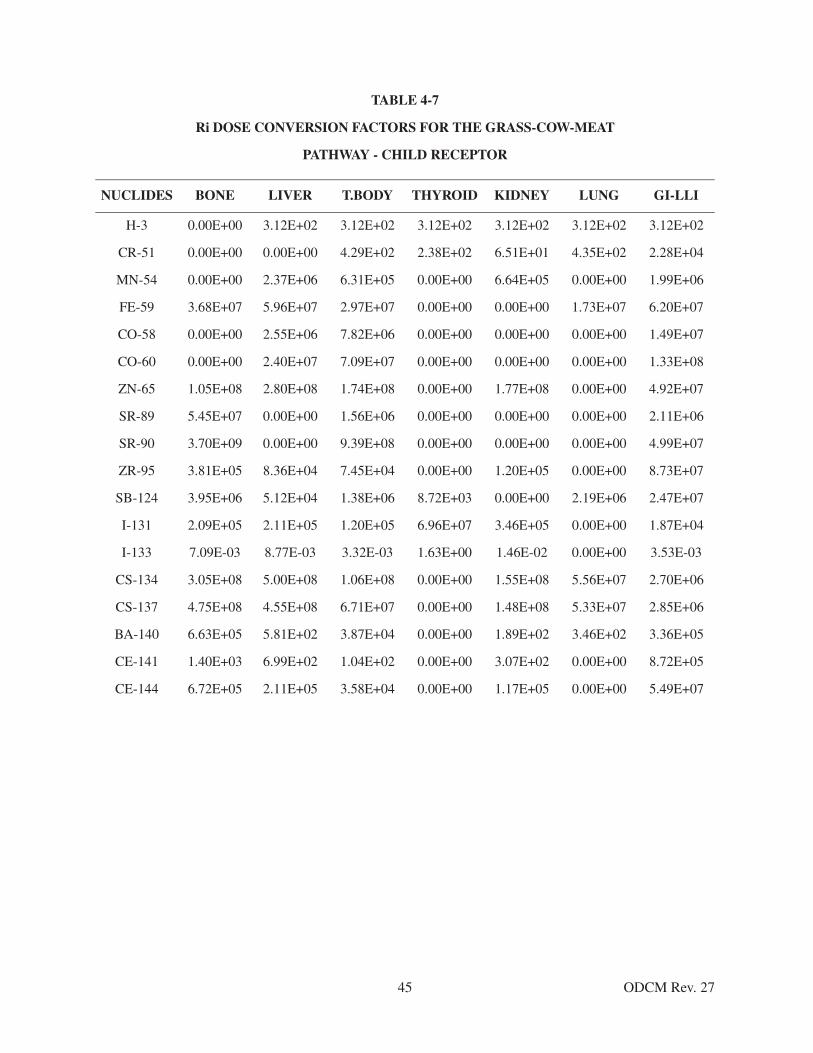
45 ODCM Rev. 27
TABLE 4-7
Ri DOSE CONVERSION FACTORS FOR THE GRASS-COW-MEAT
PATHWAY - CHILD RECEPTOR
NUCLIDES BONE LIVER T.BODY THYROID KIDNEY LUNG GI-LLI
H-3 0.00E+00 3.12E+02 3.12E+02 3.12E+02 3.12E+02 3.12E+02 3.12E+02
CR-51 0.00E+00 0.00E+00 4.29E+02 2.38E+02 6.51E+01 4.35E+02 2.28E+04
MN-54 0.00E+00 2.37E+06 6.31E+05 0.00E+00 6.64E+05 0.00E+00 1.99E+06
FE-59 3.68E+07 5.96E+07 2.97E+07 0.00E+00 0.00E+00 1.73E+07 6.20E+07
CO-58 0.00E+00 2.55E+06 7.82E+06 0.00E+00 0.00E+00 0.00E+00 1.49E+07
CO-60 0.00E+00 2.40E+07 7.09E+07 0.00E+00 0.00E+00 0.00E+00 1.33E+08
ZN-65 1.05E+08 2.80E+08 1.74E+08 0.00E+00 1.77E+08 0.00E+00 4.92E+07
SR-89 5.45E+07 0.00E+00 1.56E+06 0.00E+00 0.00E+00 0.00E+00 2.11E+06
SR-90 3.70E+09 0.00E+00 9.39E+08 0.00E+00 0.00E+00 0.00E+00 4.99E+07
ZR-95 3.81E+05 8.36E+04 7.45E+04 0.00E+00 1.20E+05 0.00E+00 8.73E+07
SB-124 3.95E+06 5.12E+04 1.38E+06 8.72E+03 0.00E+00 2.19E+06 2.47E+07
I-131 2.09E+05 2.11E+05 1.20E+05 6.96E+07 3.46E+05 0.00E+00 1.87E+04
I-133 7.09E-03 8.77E-03 3.32E-03 1.63E+00 1.46E-02 0.00E+00 3.53E-03
CS-134 3.05E+08 5.00E+08 1.06E+08 0.00E+00 1.55E+08 5.56E+07 2.70E+06
CS-137 4.75E+08 4.55E+08 6.71E+07 0.00E+00 1.48E+08 5.33E+07 2.85E+06
BA-140 6.63E+05 5.81E+02 3.87E+04 0.00E+00 1.89E+02 3.46E+02 3.36E+05
CE-141 1.40E+03 6.99E+02 1.04E+02 0.00E+00 3.07E+02 0.00E+00 8.72E+05
CE-144 6.72E+05 2.11E+05 3.58E+04 0.00E+00 1.17E+05 0.00E+00 5.49E+07

46 ODCM Rev. 27
TABLE 4-8
Ri DOSE CONVERSION FACTORS FOR THE GRASS-COW-MILK
PATHWAY - ADULT RECEPTOR
NUCLIDE BONE LIVER T.BODY THYROID KIDNEY LUNG GI-LLI
H-3 0.00E+00 1.02E+03 1.02E+03 1.02E+03 1.02E+03 1.02E+03 1.02E+03
CR-51 0.00E+00 0.00E+00 8.28E+03 4.95E+03 1.82E+03 1.10E+04 2.08E+06
MN-54 0.00E+00 3.99E+06 7.61E+05 0.00E+00 1.19E+06 0.00E+00 1.22E+07
FE-59 9.69E+06 2.28E+07 8.73E+06 0.00E+00 0.00E+00 6.36E+06 7.59E+07
CO-58 0.00E+00 1.74E+06 3.90E+06 0.00E+00 0.00E+00 0.00E+00 3.53E+07
CO-60 0.00E+00 8.41E+06 1.85E+07 0.00E+00 0.00E+00 0.00E+00 1.58E+08
ZN-65 6.34E+08 2.02E+09 9.12E+08 0.00E+00 1.35E+09 0.00E+00 1.27E+09
SR-89 4.90E+08 0.00E+00 1.41E+07 0.00E+00 0.00E+00 0.00E+00 7.86E+07
SR-90 2.43E+10 0.00E+00 5.96E+09 0.00E+00 0.00E+00 0.00E+00 7.02E+08
ZR-95 3.39E+02 1.09E+02 7.37E+01 0.00E+00 1.71E+02 0.00E+00 3.45E+05
SB-124 9.11E+06 1.72E+05 3.61E+06 2.21E+04 0.00E+00 7.09E+06 2.59E+08
I-131 7.77E+07 1.11E+08 6.37E+07 3.64E+10 1.91E+08 0.00E+00 2.93E+07
I-133 1.02E+06 1.77E+06 5.39E+05 2.60E+08 3.08E+06 0.00E+00 1.59E+06
CS-134 2.83E+09 6.73E+09 5.50E+09 0.00E+00 2.18E+09 7.23E+08 1.18E+08
CS-137 3.83E+09 5.24E+09 3.43E+09 0.00E+00 1.78E+09 5.91E+08 1.01E+08
BA-140 7.11E+06 8.93E+03 4.66E+05 0.00E+00 3.04E+03 5.11E+03 1.46E+07
CE-141 8.73E+03 5.90E+03 6.70E+02 0.00E+00 2.74E+03 0.00E+00 2.26E+07
CE-144 1.01E+06 4.21E+05 5.41E+04 0.00E+00 2.50E+05 0.00E+00 3.41E+08

47 ODCM Rev. 27
TABLE 4-9
Ri DOSE CONVERSION FACTORS FOR THE GRASS-COW-MILK
PATHWAY - TEEN RECEPTOR
NUCLIDE BONE LIVER T.BODY THYROID KIDNEY LUNG GI-LLI
H-3 0.00E+00 1.33E+03 1.33E+03 1.33E+03 1.33E+03 1.33E+03 1.33E+03
CR-51 0.00E+00 0.00E+00 1.45E+04 8.03E+03 3.17E+03 2.06E+04 2.43E+06
MN-54 0.00E+00 6.64E+06 1.32E+06 0.00E+00 1.98E+06 0.00E+00 1.36E+07
FE-59 1.69E+07 3.95E+07 1.52E+07 0.00E+00 0.00E+00 1.24E+07 9.33E+07
CO-58 0.00E+00 2.93E+06 6.76E+06 0.00E+00 0.00E+00 0.00E+00 4.04E+07
CO-60 0.00E+00 1.42E+07 3.21E+07 0.00E+00 0.00E+00 0.00E+00 1.86E+08
ZN-65 9.74E+08 3.38E+09 1.58E+09 0.00E+00 2.17E+09 0.00E+00 1.43E+09
SR-89 9.03E+08 0.00E+00 2.59E+07 0.00E+00 0.00E+00 0.00E+00 1.08E+08
SR-90 3.43E+10 0.00E+00 8.48E+09 0.00E+00 0.00E+00 0.00E+00 9.64E+08
ZR-95 5.94E+02 1.87E+02 1.29E+02 0.00E+00 2.75E+02 0.00E+00 4.32E+05
SB-124 1.62E+07 2.99E+05 6.34E+06 3.69E+04 0.00E+00 1.42E+07 3.27E+08
I-131 1.41E+08 1.98E+08 1.06E+08 5.76E+10 3.40E+08 0.00E+00 3.91E+07
I-133 1.86E+06 3.15E+06 9.60E+05 4.39E+08 5.52E+06 0.00E+00 2.38E+06
CS-134 4.91E+09 1.16E+10 5.36E+09 0.00E+00 3.67E+09 1.40E+09 1.44E+08
CS-137 6.95E+09 9.24E+09 3.22E+09 0.00E+00 3.15E+09 1.22E+09 1.32E+08
BA-140 1.28E+07 1.57E+04 8.27E+05 0.00E+00 5.33E+03 1.06E+04 1.98E+07
CE-141 1.60E+04 1.07E+04 1.23E+03 0.00E+00 5.03E+03 0.00E+00 3.06E+07
CE-144 1.86E+06 7.68E+05 9.97E+04 0.00E+00 4.59E+05 0.00E+00 4.67E+08

48 ODCM Rev. 27
TABLE 4-10
Ri DOSE CONVERSION FACTORS FOR THE GRASS-COW-MILK
PATHWAY - CHILD RECEPTOR
NUCLIDES BONE LIVER T.BODY THYROID KIDNEY LUNG GI-LLI
H-3 0.00E+00 2.09E+03 2.09E+03 2.09E+03 2.09E+03 2.09E+03 2.09E+03
CR-51 0.00E+00 0.00E+00 2.95E+04 1.64E+04 4.47E+03 2.99E+04 1.56E+06
MN-54 0.00E+00 9.94E+06 2.65E+06 0.00E+00 2.79E+06 0.00E+00 8.34E+06
FE-59 3.92E+07 6.35E+07 3.16E+07 0.00E+00 0.00E+00 1.84E+07 6.61E+07
CO-58 0.00E+00 4.48E+06 1.37E+07 0.00E+00 0.00E+00 0.00E+00 2.61E+07
CO-60 0.00E+00 2.21E+07 6.52E+07 0.00E+00 0.00E+00 0.00E+00 1.23E+08
ZN-65 1.91E+09 5.09E+09 3.17E+09 0.00E+00 3.21E+09 0.00E+00 8.95E+08
SR-89 2.23E+09 0.00E+00 6.38E+07 0.00E+00 0.00E+00 0.00E+00 8.65E+07
SR-90 5.80E+10 0.00E+00 1.47E+10 0.00E+00 0.00E+00 0.00E+00 7.81E+08
ZR-95 1.38E+03 3.03E+02 2.70E+02 0.00E+00 4.34E+02 0.00E+00 3.16E+05
SB-124 3.84E+07 4.99E+05 1.35E+07 8.49E+04 0.00E+00 2.13E+07 2.41E+08
I-131 3.42E+08 3.44E+08 1.96E+08 1.14E+11 5.65E+08 0.00E+00 3.06E+07
I-133 4.51E+06 5.57E+06 2.11E+06 1.04E+09 9.29E+06 0.00E+00 2.25E+06
CS-134 1.13E+10 1.86E+10 3.92E+09 0.00E+00 5.76E+09 2.07E+09 1.00E+08
CS-137 1.67E+10 1.60E+10 2.36E+09 0.00E+00 5.22E+09 1.88E+09 1.00E+08
BA-140 3.10E+07 2.71E+04 1.81E+06 0.00E+00 8.83E+03 1.62E+04 1.57E+07
CE-141 3.94E+04 1.97E+04 2.92E+03 0.00E+00 8.62E+03 0.00E+00 2.45E+07
CE-144 4.57E+06 1.43E+06 2.44E+05 0.00E+00 7.94E+05 0.00E+00 3.74E+08
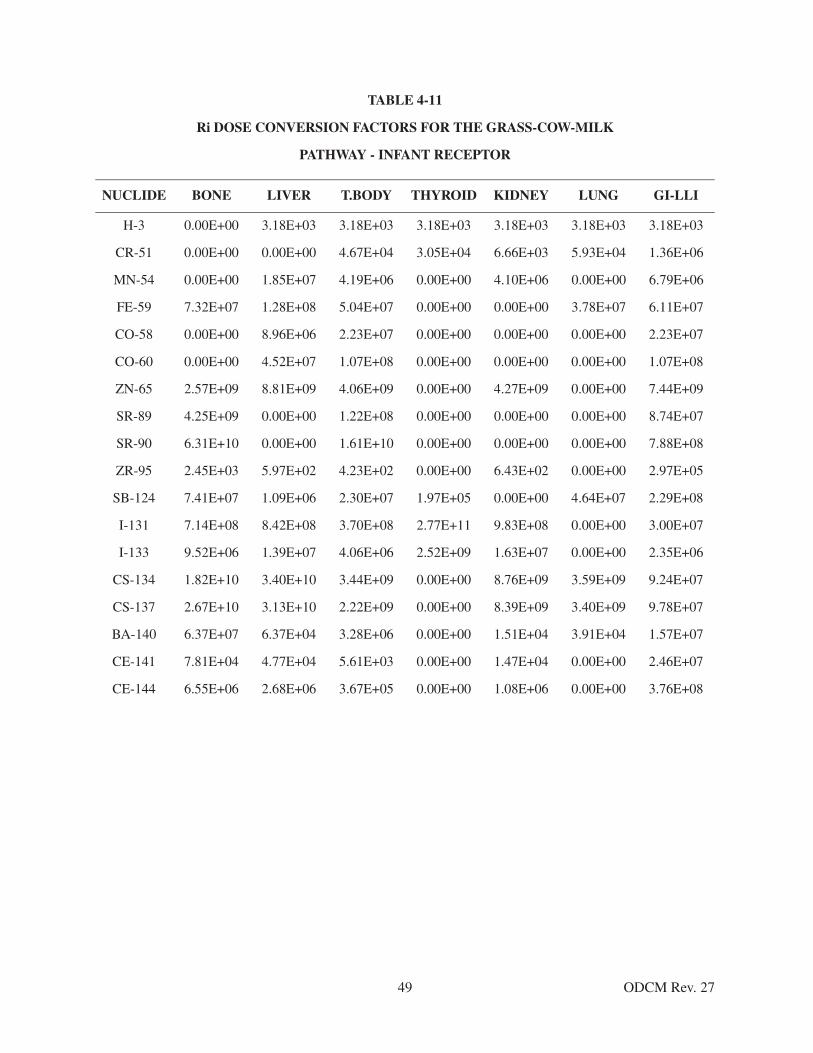
49 ODCM Rev. 27
TABLE 4-11
Ri DOSE CONVERSION FACTORS FOR THE GRASS-COW-MILK
PATHWAY - INFANT RECEPTOR
NUCLIDE BONE LIVER T.BODY THYROID KIDNEY LUNG GI-LLI
H-3 0.00E+00 3.18E+03 3.18E+03 3.18E+03 3.18E+03 3.18E+03 3.18E+03
CR-51 0.00E+00 0.00E+00 4.67E+04 3.05E+04 6.66E+03 5.93E+04 1.36E+06
MN-54 0.00E+00 1.85E+07 4.19E+06 0.00E+00 4.10E+06 0.00E+00 6.79E+06
FE-59 7.32E+07 1.28E+08 5.04E+07 0.00E+00 0.00E+00 3.78E+07 6.11E+07
CO-58 0.00E+00 8.96E+06 2.23E+07 0.00E+00 0.00E+00 0.00E+00 2.23E+07
CO-60 0.00E+00 4.52E+07 1.07E+08 0.00E+00 0.00E+00 0.00E+00 1.07E+08
ZN-65 2.57E+09 8.81E+09 4.06E+09 0.00E+00 4.27E+09 0.00E+00 7.44E+09
SR-89 4.25E+09 0.00E+00 1.22E+08 0.00E+00 0.00E+00 0.00E+00 8.74E+07
SR-90 6.31E+10 0.00E+00 1.61E+10 0.00E+00 0.00E+00 0.00E+00 7.88E+08
ZR-95 2.45E+03 5.97E+02 4.23E+02 0.00E+00 6.43E+02 0.00E+00 2.97E+05
SB-124 7.41E+07 1.09E+06 2.30E+07 1.97E+05 0.00E+00 4.64E+07 2.29E+08
I-131 7.14E+08 8.42E+08 3.70E+08 2.77E+11 9.83E+08 0.00E+00 3.00E+07
I-133 9.52E+06 1.39E+07 4.06E+06 2.52E+09 1.63E+07 0.00E+00 2.35E+06
CS-134 1.82E+10 3.40E+10 3.44E+09 0.00E+00 8.76E+09 3.59E+09 9.24E+07
CS-137 2.67E+10 3.13E+10 2.22E+09 0.00E+00 8.39E+09 3.40E+09 9.78E+07
BA-140 6.37E+07 6.37E+04 3.28E+06 0.00E+00 1.51E+04 3.91E+04 1.57E+07
CE-141 7.81E+04 4.77E+04 5.61E+03 0.00E+00 1.47E+04 0.00E+00 2.46E+07
CE-144 6.55E+06 2.68E+06 3.67E+05 0.00E+00 1.08E+06 0.00E+00 3.76E+08

50 ODCM Rev. 27
TABLE 4-12
Ri DOSE CONVERSION FACTORS FOR THE INHALATION
PATHWAY - ADULT RECEPTOR
NUCLIDE BONE LIVER T.BODY THYROID KIDNEY LUNG GI-LLI
H-3 0.00E+00 1.26E+03 1.26E+03 1.26E+03 1.26E+03 1.26E+03 1.26E+03
CR-51 0.00E+00 0.00E+00 1.00E+02 5.95E+01 2.28E+01 1.44E+04 3.32E+03
MN-54 0.00E+00 3.96E+04 6.30E+03 0.00E+00 9.84E+03 1.40E+06 7.74E+04
FE-59 1.18E+04 2.78E+04 1.06E+04 0.00E+00 0.00E+00 1.02E+06 1.88E+05
CO-58 0.00E+00 1.58E+03 2.07E+03 0.00E+00 0.00E+00 9.28E+05 1.06E+05
CO-60 0.00E+00 1.15E+04 1.48E+04 0.00E+00 0.00E+00 5.97E+06 2.85E+05
ZN-65 3.24E+04 1.03E+05 4.66E+04 0.00E+00 6.90E+04 8.64E+05 5.34E+04
SR-89 3.04E+05 0.00E+00 8.72E+03 0.00E+00 0.00E+00 1.40E+06 3.50E+05
SR-90 9.92E+07 0.00E+00 6.10E+06 0.00E+00 0.00E+00 9.60E+06 7.22E+05
ZR-95 1.07E+05 3.44E+04 2.33E+04 0.00E+00 5.42E+04 1.77E+06 1.50E+05
SB-124 3.12E+04 5.89E+02 1.24E+04 7.55E+01 0.00E+00 2.48E+06 4.06E+05
I-131 2.52E+04 3.58E+04 2.05E+04 1.19E+07 6.13E+04 0.00E+00 6.28E+03
I-133 8.64E+03 1.48E+04 4.52E+03 2.15E+06 2.58E+04 0.00E+00 8.88E+03
CS-134 3.73E+05 8.48E+05 7.28E+05 0.00E+00 2.87E+05 9.76E+04 1.04E+04
CS-137 4.78E+05 6.21E+05 4.28E+05 0.00E+00 2.22E+05 7.52E+04 8.40E+03
BA-140 3.90E+04 4.90E+01 2.57E+03 0.00E+00 1.67E+01 1.27E+06 2.18E+05
CE-141 1.99E+04 1.35E+04 1.53E+03 0.00E+00 6.26E+03 3.62E+05 1.20E+05
CE-144 3.43E+06 1.43E+06 1.84E+05 0.00E+00 8.48E+05 7.78E+06 8.16E+05
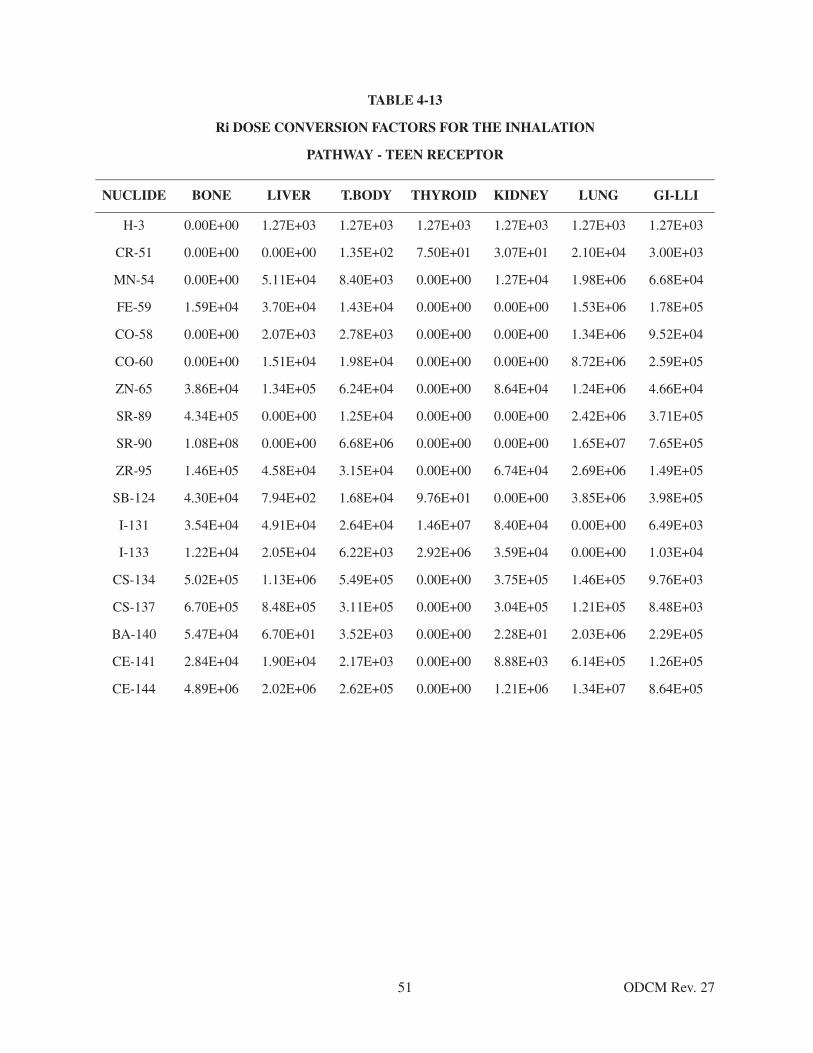
51 ODCM Rev. 27
TABLE 4-13
Ri DOSE CONVERSION FACTORS FOR THE INHALATION
PATHWAY - TEEN RECEPTOR
NUCLIDE BONE LIVER T.BODY THYROID KIDNEY LUNG GI-LLI
H-3 0.00E+00 1.27E+03 1.27E+03 1.27E+03 1.27E+03 1.27E+03 1.27E+03
CR-51 0.00E+00 0.00E+00 1.35E+02 7.50E+01 3.07E+01 2.10E+04 3.00E+03
MN-54 0.00E+00 5.11E+04 8.40E+03 0.00E+00 1.27E+04 1.98E+06 6.68E+04
FE-59 1.59E+04 3.70E+04 1.43E+04 0.00E+00 0.00E+00 1.53E+06 1.78E+05
CO-58 0.00E+00 2.07E+03 2.78E+03 0.00E+00 0.00E+00 1.34E+06 9.52E+04
CO-60 0.00E+00 1.51E+04 1.98E+04 0.00E+00 0.00E+00 8.72E+06 2.59E+05
ZN-65 3.86E+04 1.34E+05 6.24E+04 0.00E+00 8.64E+04 1.24E+06 4.66E+04
SR-89 4.34E+05 0.00E+00 1.25E+04 0.00E+00 0.00E+00 2.42E+06 3.71E+05
SR-90 1.08E+08 0.00E+00 6.68E+06 0.00E+00 0.00E+00 1.65E+07 7.65E+05
ZR-95 1.46E+05 4.58E+04 3.15E+04 0.00E+00 6.74E+04 2.69E+06 1.49E+05
SB-124 4.30E+04 7.94E+02 1.68E+04 9.76E+01 0.00E+00 3.85E+06 3.98E+05
I-131 3.54E+04 4.91E+04 2.64E+04 1.46E+07 8.40E+04 0.00E+00 6.49E+03
I-133 1.22E+04 2.05E+04 6.22E+03 2.92E+06 3.59E+04 0.00E+00 1.03E+04
CS-134 5.02E+05 1.13E+06 5.49E+05 0.00E+00 3.75E+05 1.46E+05 9.76E+03
CS-137 6.70E+05 8.48E+05 3.11E+05 0.00E+00 3.04E+05 1.21E+05 8.48E+03
BA-140 5.47E+04 6.70E+01 3.52E+03 0.00E+00 2.28E+01 2.03E+06 2.29E+05
CE-141 2.84E+04 1.90E+04 2.17E+03 0.00E+00 8.88E+03 6.14E+05 1.26E+05
CE-144 4.89E+06 2.02E+06 2.62E+05 0.00E+00 1.21E+06 1.34E+07 8.64E+05

52 ODCM Rev. 27
TABLE 4-14
Ri DOSE CONVERSION FACTORS FOR THE INHALATION
PATHWAY - CHILD RECEPTOR
NUCLIDE BONE LIVER T.BODY THYROID KIDNEY LUNG GI-LLI
H-3 0.00E+00 1.12E+03 1.12E+03 1.12E+03 1.12E+03 1.12E+03 1.12E+03
CR-51 0.00E+00 0.00E+00 1.54E+02 8.55E+01 2.43E+01 1.70E+04 1.08E+03
MN-54 0.00E+00 4.29E+04 9.51E+03 0.00E+00 1.00E+04 1.58E+06 2.29E+04
FE-59 2.07E+04 3.34E+04 1.67E+04 0.00E+00 0.00E+00 1.27E+06 7.07E+04
CO-58 0.00E+00 1.77E+03 3.16E+03 0.00E+00 0.00E+00 1.11E+06 3.44E+04
CO-60 0.00E+00 1.31E+04 2.26E+04 0.00E+00 0.00E+00 7.07E+06 9.62E+04
ZN-65 4.26E+04 1.13E+05 7.03E+04 0.00E+00 7.14E+04 9.95E+05 1.63E+04
SR-89 5.99E+05 0.00E+00 1.72E+04 0.00E+00 0.00E+00 2.16E+06 1.67E+05
SR-90 1.01E+08 0.00E+00 6.44E+06 0.00E+00 0.00E+00 1.48E+07 3.43E+05
ZR-95 1.90E+05 4.18E+04 3.70E+04 0.00E+00 5.96E+04 2.23E+06 6.11E+04
SB-124 5.74E+04 7.40E+02 2.00E+04 1.26E+02 0.00E+00 3.24E+06 1.64E+05
I-131 4.81E+04 4.81E+04 2.73E+04 1.62E+07 7.88E+04 0.00E+00 2.84E+03
I-133 1.66E+04 2.03E+04 7.70E+03 3.85E+06 3.38E+04 0.00E+00 5.48E+03
CS-134 6.51E+05 1.01E+06 2.25E+05 0.00E+00 3.30E+05 1.21E+05 3.85E+03
CS-137 9.07E+05 8.25E+05 1.28E+05 0.00E+00 2.82E+05 1.04E+05 3.62E+03
BA-140 7.40E+04 6.48E+01 4.33E+03 0.00E+00 2.11E+01 1.74E+06 1.02E+05
CE-141 3.92E+04 1.95E+04 2.90E+03 0.00E+00 8.55E+03 5.44E+05 5.66E+04
CE-144 6.77E+06 2.12E+06 3.61E+05 0.00E+00 1.17E+06 1.20E+07 3.89E+05

53 ODCM Rev. 27
TABLE 4-15
Ri DOSE CONVERSION FACTORS FOR THE INHALATION
PATHWAY - INFANT RECEPTOR
NUCLIDE BONE LIVER T.BODY THYROID KIDNEY LUNG GI-LLI
H-3 0.00E+00 6.47E+02 6.47E+02 6.47E+02 6.47E+02 6.47E+02 6.47E+02
CR-51 0.00E+00 0.00E+00 8.95E+01 5.75E+01 1.32E+01 1.28E+04 3.57E+02
MN-54 0.00E+00 2.53E+04 4.98E+03 0.00E+00 4.98E+03 1.00E+06 7.06E+03
FE-59 1.36E+04 2.35E+04 9.48E+03 0.00E+00 0.00E+00 1.02E+06 2.48E+04
CO-58 0.00E+00 1.22E+03 1.82E+03 0.00E+00 0.00E+00 7.77E+05 1.11E+04
CO-60 0.00E+00 8.02E+03 1.18E+04 0.00E+00 0.00E+00 4.51E+06 3.19E+04
ZN-65 1.93E+04 6.26E+04 3.11E+04 0.00E+00 3.25E+04 6.47E+05 5.14E+04
SR-89 3.98E+05 0.00E+00 1.14E+04 0.00E+00 0.00E+00 2.03E+06 6.40E+04
SR-90 4.09E+07 0.00E+00 2.59E+06 0.00E+00 0.00E+00 1.12E+07 1.31E+05
ZR-95 1.15E+05 2.79E+04 2.03E+04 0.00E+00 3.11E+04 1.75E+06 2.17E+04
SB-124 3.79E+04 5.56E+02 1.20E+04 1.01E+02 0.00E+00 2.65E+06 5.91E+04
I-131 3.79E+04 4.44E+04 1.96E+04 1.48E+07 5.18E+04 0.00E+00 1.06E+03
I-133 1.32E+04 1.92E+04 5.60E+03 3.56E+06 2.24E+04 0.00E+00 2.16E+03
CS-134 3.96E+05 7.03E+05 7.45E+04 0.00E+00 1.90E+05 7.97E+04 1.33E+03
CS-137 5.49E+05 6.12E+05 4.55E+04 0.00E+00 1.72E+05 7.13E+04 1.33E+03
BA-140 5.60E+04 5.60E+01 2.90E+03 0.00E+00 1.34E+01 1.60E+06 3.84E+04
CE-141 2.77E+04 1.67E+04 1.99E+03 0.00E+00 5.25E+03 5.17E+05 2.16E+04
CE-144 3.19E+06 1.21E+06 1.76E+05 0.00E+00 5.38E+05 9.84E+06 1.48E+05
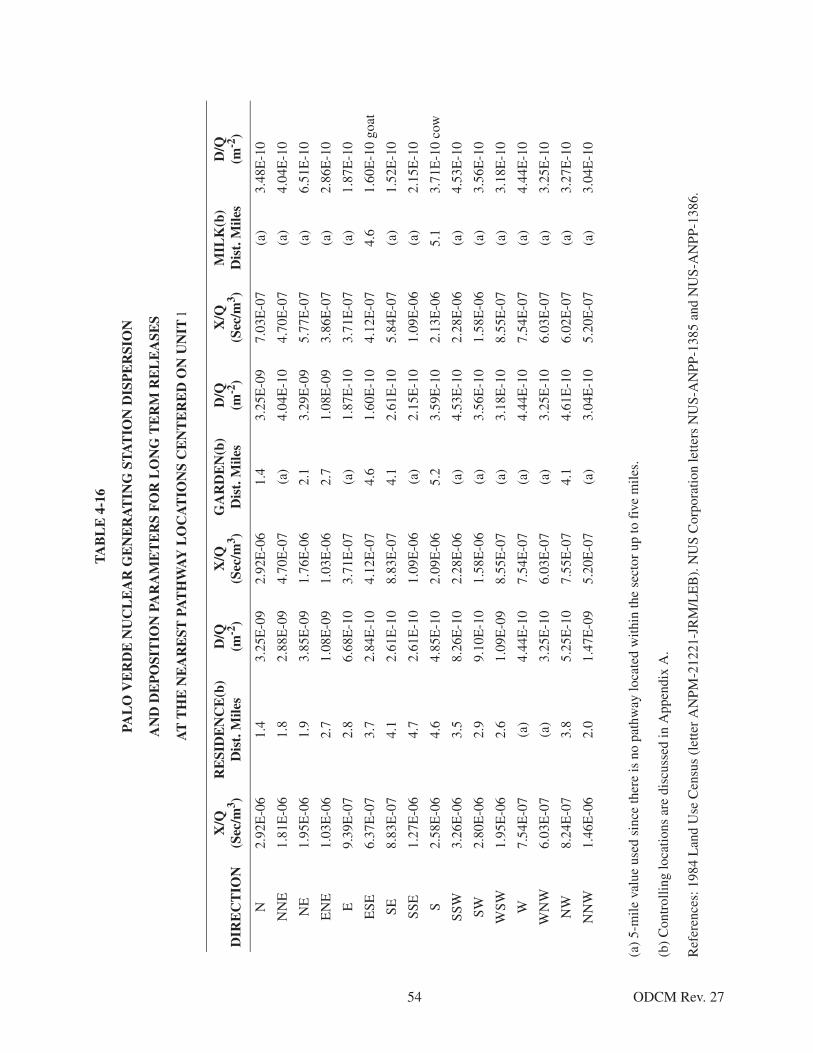
54 ODCM Rev. 27
TA
BL
E 4
-16
PAL
O V
ER
DE
NU
CL
EA
R G
EN
ER
AT
ING
ST
AT
ION
DIS
PE
RSI
ON
AN
D D
EP
OSI
TIO
N P
AR
AM
ET
ER
S F
OR
LO
NG
TE
RM
RE
LE
ASE
S
AT
TH
E N
EA
RE
ST P
AT
HW
AY
LO
CA
TIO
NS
CE
NT
ER
ED
ON
UN
IT l
(a)
5-m
ile v
alue
use
d si
nce
ther
e is
no
path
way
loca
ted
with
in th
e se
ctor
up
to f
ive
mile
s.
(b)
Con
trol
ling
loca
tions
are
dis
cuss
ed in
App
endi
x A
.
Ref
eren
ces:
198
4 L
and
Use
Cen
sus
(let
ter
AN
PM-2
1221
-JR
M/L
EB
). N
US
Cor
pora
tion
lette
rs N
US-
AN
PP-1
385
and
NU
S-A
NPP
-138
6.
DIR
EC
TIO
NX
/Q(S
ec/m
3 )R
ESI
DE
NC
E(b
)D
ist.
Mile
sD
/Q(m
-2)
X/Q
(Sec
/m3 )
GA
RD
EN
(b)
Dis
t. M
iles
D/Q
(m-2
)X
/Q(S
ec/m
3 )M
ILK
(b)
Dis
t. M
iles
D/Q
(m-2
)
N2.
92E
-06
1.4
3.25
E-0
92.
92E
-06
1.4
3.25
E-0
97.
03E
-07
(a)
3.48
E-1
0
NN
E1.
81E
-06
1.8
2.88
E-0
94.
70E
-07
(a)
4.04
E-1
04.
70E
-07
(a)
4.04
E-1
0
NE
1.95
E-0
61.
93.
85E
-09
1.76
E-0
62.
13.
29E
-09
5.77
E-0
7(a
)6.
51E
-10
EN
E1.
03E
-06
2.7
1.08
E-0
91.
03E
-06
2.7
1.08
E-0
93.
86E
-07
(a)
2.86
E-1
0
E9.
39E
-07
2.8
6.68
E-1
03.
71E
-07
(a)
1.87
E-1
03.
71E
-07
(a)
1.87
E-1
0
ESE
6.37
E-0
73.
72.
84E
-10
4.12
E-0
74.
61.
60E
-10
4.12
E-0
74.
61.
60E
-10
goat
SE8.
83E
-07
4.1
2.61
E-1
08.
83E
-07
4.1
2.61
E-1
05.
84E
-07
(a)
1.52
E-1
0
SSE
1.27
E-0
64.
72.
61E
-10
1.09
E-0
6(a
)2.
15E
-10
1.09
E-0
6(a
)2.
15E
-10
S2.
58E
-06
4.6
4.85
E-1
02.
09E
-06
5.2
3.59
E-1
02.
13E
-06
5.1
3.71
E-1
0 co
w
SSW
3.26
E-0
63.
58.
26E
-10
2.28
E-0
6(a
)4.
53E
-10
2.28
E-0
6(a
)4.
53E
-10
SW2.
80E
-06
2.9
9.10
E-1
01.
58E
-06
(a)
3.56
E-1
01.
58E
-06
(a)
3.56
E-1
0
WSW
1.95
E-0
62.
61.
09E
-09
8.55
E-0
7(a
)3.
18E
-10
8.55
E-0
7(a
)3.
18E
-10
W7.
54E
-07
(a)
4.44
E-1
07.
54E
-07
(a)
4.44
E-1
07.
54E
-07
(a)
4.44
E-1
0
WN
W6.
03E
-07
(a)
3.25
E-1
06.
03E
-07
(a)
3.25
E-1
06.
03E
-07
(a)
3.25
E-1
0
NW
8.24
E-0
73.
85.
25E
-10
7.55
E-0
74.
14.
61E
-10
6.02
E-0
7(a
)3.
27E
-10
NN
W1.
46E
-06
2.0
1.47
E-0
95.
20E
-07
(a)
3.04
E-1
05.
20E
-07
(a)
3.04
E-1
0

55 ODCM Rev. 27
TA
BL
E 4
-17
PAL
O V
ER
DE
NU
CL
EA
R G
EN
ER
AT
ING
ST
AT
ION
DIS
PE
RSI
ON
AN
D D
EP
OSI
TIO
N P
AR
AM
ET
ER
S F
OR
LO
NG
TE
RM
RE
LE
ASE
S
AT
TH
E N
EA
RE
ST P
AT
HW
AY
LO
CA
TIO
NS
CE
NT
ER
ED
ON
UN
IT 2
(a)
5-m
ile v
alue
use
d si
nce
ther
e is
no
path
way
loca
ted
with
in th
e se
ctor
up
to f
ive
mile
s.
(b)
Con
trol
ling
loca
tions
are
dis
cuss
ed in
App
endi
x A
.
Ref
eren
ces:
198
4 L
and
Use
Cen
sus
(let
ter
AN
PM-2
1221
-JR
M/L
EB
). N
US
Cor
pora
tion
lette
rs N
US-
AN
PP-1
385
and
NU
S-A
NPP
-138
6.
DIR
EC
TIO
NX
/Q(S
ec/m
3 )R
ESI
DE
NC
E(b
)D
ist.
Mile
sD
/Q(m
-2)
X/Q
(Sec
/m3 )
GA
RD
EN
(b)
Dis
t. M
iles
D/Q
(m-2
)X
/Q(S
ec/m
3 )M
ILK
(b)
Dis
t. M
iles
D/Q
(m-2
)
N2.
73E
-06
1.5
2.92
E-0
92.
39E
-06
1.7
2.35
E-0
97.
03E
-07
(a)
3.48
E-1
0
NN
E2.
20E
-06
1.5
3.87
E-0
92.
20E
-06
1.5
3.87
E-0
94.
70E
-07
(a)
4.04
E-1
0
NE
1.85
E-0
62.
03.
55E
-09
1.57
E-0
62.
32.
78E
-09
5.77
E-0
7(a
)6.
51E
-10
EN
E1.
03E
-06
2.7
1.08
E-0
91.
03E
-06
2.7
1.08
E-0
93.
86E
-07
(a)
2.86
E-1
0
E8.
80E
-07
3.0
6.06
E-1
03.
71E
-07
(a)
1.87
E-1
03.
71E
-07
(a)
1.87
E-1
0
ESE
6.25
E-0
73.
72.
76E
-10
3.96
E-0
74.
71.
51E
-10
3.96
E-0
74.
71.
51E
-10
goat
SE9.
06E
-07
4.0
2.72
E-1
09.
06E
-07
4.0
2.72
E-1
05.
84E
-07
(a)
1.52
E-1
0
SSE
1.34
E-0
64.
52.
81E
-10
1.09
E-0
6(a
)2.
15E
-10
1.09
E-0
6(a
)2.
15E
-10
S2.
63E
-06
4.5
5.01
E-1
02.
19E
-06
5.0
3.88
E-1
02.
19E
-06
5.0
3.88
E-1
0 co
w
SSW
3.48
E-0
63.
29.
19E
-10
2.28
E-0
6(a
)4.
53E
-10
2.28
E-0
6(a
)4.
53E
-10
SW2.
93E
-06
2.7
9.75
E-1
01.
58E
-06
(a)
3.56
E-1
01.
58E
-06
(a)
3.56
E-1
0
WSW
2.01
E-0
62.
51.
16E
-09
8.55
E-0
7(a
)3.
18E
-10
8.55
E-0
7(a
)3.
18E
-10
W7.
54E
-07
(a)
4.44
E-1
07.
54E
-07
(a)
4.44
E-1
07.
54E
-07
(a)
4.44
E-1
0
WN
W6.
03E
-07
(a)
3.25
E-1
06.
03E
-07
(a)
3.25
E-1
06.
03E
-07
(a)
3.25
E-1
0
NW
7.84
E-0
74.
04.
88E
-10
7.84
E-0
74.
04.
88E
-10
6.02
E-0
7(a
)3.
27E
-10
NN
W1.
46E
-06
2.0
1.47
E-0
95.
20E
-07
5.0
3.04
E-1
05.
20E
-07
(a)
3.04
E-1
0

56 ODCM Rev. 27
TA
BL
E 4
-18
PAL
O V
ER
DE
NU
CL
EA
R G
EN
ER
AT
ING
ST
AT
ION
DIS
PE
RSI
ON
AN
D D
EP
OSI
TIO
N P
AR
AM
ET
ER
S F
OR
LO
NG
TE
RM
RE
LE
ASE
S
AT
TH
E N
EA
RE
ST P
AT
HW
AY
LO
CA
TIO
NS
CE
NT
ER
ED
ON
UN
IT 3
(a)
5-m
ile v
alue
use
d si
nce
ther
e is
no
path
way
loca
ted
with
in th
e se
ctor
up
to f
ive
mile
s.
(b)
Con
trol
ling
loca
tions
are
dis
cuss
ed in
App
endi
x A
.
Ref
eren
ces:
198
4 L
and
Use
Cen
sus
(let
ter
AN
PM-2
1221
-JR
M/L
EB
). N
US
Cor
pora
tion
lette
rs N
US-
AN
PP-1
385
and
NU
S-A
NPP
-138
6.
DIR
EC
TIO
NX
/Q(S
ec/m
3 )R
ESI
DE
NC
E(b
)D
ist.
Mile
sD
/Q(m
-2)
X/Q
(Sec
/m3 )
GA
RD
EN
(b)
Dis
t. M
iles
D/Q
(m-2
)X
/Q(S
ec/m
3 )M
ILK
(b)
Dis
t. M
iles
D/Q
(m-2
)
N2.
58E
-06
1.8
2.47
E-0
92.
42E
-06
1.9
2.22
E-0
97.
03E
-07
(a)
3.48
E-1
0
NN
E1.
85E
-06
1.7
2.97
E-0
91.
85E
-06
1.7
2.97
E-0
94.
70E
-07
(a)
4.04
E-1
0
NE
1.66
E-0
62.
23.
00E
-09
1.48
E-0
62.
42.
54E
-09
5.77
E-0
7(a
)6.
51E
-10
EN
E8.
75E
-07
2.9
8.86
E-1
08.
75E
-07
2.9
8.86
E-1
03.
86E
-07
(a)
2.86
E-1
0
E8.
90E
-07
3.0
6.17
E-1
04.
06E
-07
4.6
2.15
E-1
04.
25E
-07
4.5
2.31
E-1
0 go
at
ESE
6.37
E-0
73.
72.
84E
-10
5.80
E-0
74.
02.
46E
-10
3.73
E-0
7(a
)1.
37E
-10
SE5.
84E
-07
(a)
1.52
E-1
05.
84E
-07
(a)
1.52
E-1
05.
84E
-07
(a)
1.52
E-1
0
SSE
1.36
E-0
64.
42.
88E
-10
1.09
E-0
6(a
)2.
15E
-10
1.09
E-0
6(a
)2.
15E
-10
S2.
65E
-06
4.2
5.25
E-1
02.
25E
-06
4.9
4.06
E-1
02.
31E
-06
4.8
4.21
E-1
0 co
w
SSW
3.64
E-0
63.
19.
82E
-10
2.28
E-0
6(a
)4.
53E
-10
2.28
E-0
6(a
)4.
53E
-10
SW3.
19E
-06
2.5
1.11
E-0
91.
58E
-06
(a)
3.56
E-1
01.
58E
-06
(a)
3.56
E-1
0
WSW
2.12
E-0
62.
41.
26E
-09
8.55
E-0
7(a
)3.
18E
-10
8.55
E-0
7(a
)3.
18E
-10
W7.
54E
-07
(a)
4.44
E-1
07.
54E
-07
(a)
4.44
E-1
07.
54E
-10
(a)
4.44
E-1
0
WN
W6.
03E
-07
(a)
3.25
E-1
06.
03E
-07
(a)
3.25
E-1
06.
03E
-07
(a)
3.25
E-1
0
NW
6.83
E-0
74.
34.
05E
-10
6.82
E-0
74.
34.
05E
-10
6.02
E-0
7(a
)3.
27E
-10
NN
W1.
34E
-06
2.2
1.26
E-0
95.
16E
-07
5.0
3.01
E-1
05.
20E
-07
(a)
3.04
E-1
0

57 ODCM Rev. 27
4.4 Requirements: Liquid Effluents
The dose or dose commitment to a MEMBER OF THE PUBLIC from radioactive materials in liquideffluents released, from each reactor unit, to areas at and beyond the SITE BOUNDARY (See Figure6-4 and Figure 6-5) shall be limited:
a. During any calendar quarter to less than or equal to 1.5 mrems to the total body and to less thanor equal to 5 mrems to any organ, and
b. During any calendar year to less than or equal to 3 mrems to the total body and to less than orequal to 10 mrems to any organ.
Applicability: At all times.
Action:
With the calculated dose from the release of radioactive materials in liquid effluents exceeding any ofthe above limits, prepare and submit to the Commission within 30 days, a Special Report thatidentifies the cause(s) for exceeding the limit(s) and defines the corrective actions that have beentaken to reduce the releases and the proposed corrective actions to be taken to assure that subsequentreleases will be in compliance with the above limits.
4.4.1 Surveillance Requirements
Cumulative dose contributions from liquid effluents for the current calendar quarter and thecurrent calendar year shall be determined in accordance with the methodology and parametersin the ODCM at least once per 31 days.
4.4.2 Implementation of the Requirements
This Requirement does not require implementation guidance. There are no offsite liquideffluent releases.

58 ODCM Rev. 27
5.0 TOTAL DOSE AND DOSE TO PUBLIC ONSITE
5.1 Requirement: Total Dose
The annual (calendar year) dose or dose commitment to any MEMBER OF THE PUBLIC due toreleases of radioactivity and to direct radiation from uranium fuel cycle sources shall be limited toless than or equal to 25 mrems to the total body or any organ, except the thyroid, which shall belimited to less than or equal to 75 mrems.
Applicability: At all times.
Action:
With the calculated doses from the release of radioactive materials in liquid and gaseous effluentsexceeding twice the limits of Section 4.4a, 4.4b, 4.1a, 4.1b, 4.2a or 4.2b calculations shall be madeincluding direct radiation contributions from the reactor units (including outside storage tanks, etc.) todetermine whether the above limits of Section 5.1 have been exceeded. If such is the case, prepareand submit to the Commission within 30 days, a Special Report that defines the corrective action tobe taken to reduce subsequent releases to prevent recurrence of exceeding the above limits andincludes the schedule for achieving conformance with the above limits. This Special Report, asdefined in 10 CFR 20.2203(a)(4), shall include an analysis that estimates the radiation exposure(dose) to a MEMBER OF THE PUBLIC from uranium fuel cycle sources, including all effluentpathways and direct radiation, for the calendar year that includes the release(s) covered by this report.It shall also describe levels of radiation and concentrations of radioactive material involved, and thecause of the exposure levels or concentrations. If the estimated dose(s) exceeds the above limits, andif the release condition resulting in violation of 40 CFR Part 190 has not already been corrected, theSpecial Report shall include a request for a variance in accordance with the provisions of 40 CFRPart 190. Submittal of the report within 30 days is considered a timely request, and a variance isgranted until staff action on the request is complete.
5.1.1 Surveillance Requirements
a. Cumulative dose contributions from the gaseous effluents shall be determined inaccordance with the surveillance requirements of Section 4.4.1, 4.1.1 and 4.2.1 and inaccordance with the methodology and parameters contained in Section 5.1.2.
b. Cumulative dose contributions from direct radiation from the reactor units and fromradwaste storage tanks shall be determined in accordance with the methodology andparameters in Section 5.1.2. This requirement is applicable only under conditions set forthin Section 5.1, Action.
5.1.2 Implementation of the Requirement
Since all other uranium fuel cycle sources are greater than 20 miles away, only the PVNGS siteneed be considered.
The total dose to any MEMBER OF THE PUBLIC will be determined based on a sum of thedoses from all three units’ releases and doses from direct radiation from PVNGS.

59 ODCM Rev. 27
This dose evaluation is performed annually and submitted with the Annual RadioactiveEffluent Release Report to assure compliance with 40 CFR Part 190, Environmental RadiationProtection Standards for Nuclear Power Operation. NUREG-0543, Methods forDemonstrating LWR Compliance With the EPA Uranium Fuel Cycle Standard (40 CFRPart 190), February 1980, provides a discussion on compliance with 40 CFR Part 190 inrelation to the Radiological Environmental Technical Specifications for sites of up to fournuclear power reactors. The NUREG concludes that as long as a nuclear plant site operates at alevel below the 10 CFR Part 50, Appendix I reporting requirements, and there is no significantsource of direct radiation from the site, no extra analysis is required to demonstrate compliancewith 40 CFR Part 190. As a result, this dose evaluation will also be performed whenevercalculated doses associated with effluent releases exceed twice the limits of Section 4.4a, 4.4b, 4.1a, 4.1b, 4.2a or 4.2b.
Dose Contribution from Liquid and Gaseous Effluents
The annual whole body dose accumulated by a MEMBER OF THE PUBLIC for the noblegases released in gaseous effluents is determined by using the following equation:
DWB = (3.17E-08) Σi [(Ki) (X/Q)UNIT (Qi)] (5-1)
Where:
Ki = the whole body dose factor due to gamma emissions for each identified noblegas radionuclide i, in mrem/yr per μCi/m3 from Table 3-3.
Qi = the integrated release of radionuclide i, in μCi for the previous calendar year.
(X/Q)UNIT = the highest calculated annual average dispersion parameter, in sec/m3, for aparticular unit, at the controlling location, from Table 4-16, 4-17, or 4-18, orconcurrent meteorological data if available.
=2.92E-06 from Unit 1=2.19E-06 from Unit 2=2.31E-06 from Unit 3
DWB = the annual whole body dose in mrem to a MEMBER OF THE PUBLIC at thecontrolling location due to noble gases released in gaseous effluents.
3.17E-08 = the inverse of seconds in a year (yr/sec).

60 ODCM Rev. 27
The annual dose to any organ accumulated by a MEMBER OF THE PUBLIC for iodine-131,iodine-133, tritium and all radionuclides in particulate form with half-lives greater than 8 daysreleased in gaseous effluents is determined by using the following equation:
Do = (3.17E-08) Σi [Σk(RikWk) (Qi)] (5-2)
Where:
Do = the total annual organ dose from gaseous effluents to a MEMBER OF THEPUBLIC, in mrem, at the controlling location.
Qi = the integrated release of radionuclide i, in μCi, for the previous calendar year.
Rik = the dose factor for each identified radionuclide i, for pathway k (for theinhalation pathway in mrem/yr per μCi/m3 and for the food and ground planepathways in m2-mrem/yr per μCi/sec) at the controlling location. The Rik’sfor each age group are given in Tables 4-1 through 4-15.
WK = the highest annual average dispersion or deposition parameter for theparticular unit, used for estimating the total annual organ dose to a MEMBEROF THE PUBLIC at the controlling location for the particular unit.
= (X/Q)UNIT, in sec/m3 for the inhalation pathway and for all tritiumcalculations, for organ dose at the controlling location, from Table 4-16,4-17, or 4-18, or concurrent meteorological data if available.
=2.92E-06 from Unit 1=2.19E-06 from Unit 2=2.31E-06 from Unit 3
= (D/Q)UNIT, in m-2, for the food and ground plane pathways, for organ dose atthe controlling location, from Table 4-16, 4-17, or 4-18, or concurrentmeteorological data if available.
=3.25E-09 from Unit 1=3.88E-10 from Unit 2=4.21E-10 from Unit 3
3.17E-08 = the inverse of seconds in a year (yr/sec).
61 ODCM Rev. 27
Dose Due to Direct Radiation
The component of dose to a MEMBER OF THE PUBLIC due to direct radiation will beevaluated by first determining the direct radiation dose at the site boundary in each sector, andthen extrapolating the site boundary dose to the controlling location by the inverse square lawof distance.
Dose from Radioactive Liquid and Gaseous Effluents to MEMBERS OF THE PUBLIC due totheir activities within the SITE BOUNDARY.
These activities have been determined to be limited to the vicinity of the Energy InformationCenter (EIC) located inside the SITE BOUNDARY. An assumption was made that noMEMBER OF THE PUBLIC would spend more than eight hours per year at this location.However this calculation has been historically performed assuming an occupancy factor of one(implying continuous occupancy over the entire year).
A X/Q, determined for the Energy Information Center, will be used for this assessment.
Equations 5-1 and 5-2 in Section 5.1.2 should be used for this assessment.

62 ODCM Rev. 27
6.0 RADIOLOGICAL ENVIRONMENTAL MONITORING PROGRAM (REMP)
6.1 Requirement: REMP
The radiological environmental monitoring program shall be conducted as specified in Table 6-1,based on locations determined using data from the pre-operational monitoring period; and/or theoperational monitoring period indicating a need to make changes in the program.
Applicability: At all times.
Action:
a. With the radiological environmental monitoring program not being conducted as specified inTable 6-1, prepare and submit to the Commission, in the Annual Radiological EnvironmentalOperating Report, as required by Section 7.2, a description of the reasons for not conducting theprogram as required and the plans for preventing a recurrence.
b. With the level of radioactivity as the result of plant effluents in an environmental samplingmedium at a specified location exceeding the reporting levels of Table 6-2 when averaged overany calendar quarter, prepare and submit to the Commission within 30 days, a Special Report thatidentifies the cause(s) for exceeding the limit(s) and defines the corrective actions to be taken toreduce radioactive effluents so that the potential annual dose* to A MEMBER OF THE PUBLICis less than the calendar year limits of Section 4.4, 4.1 and 4.2. When more than one of theradionuclides in Table 6-2 are detected in the sampling medium, this report shall be submitted if:
When radionuclides other than those in Table 6-2 are detected and are the result of plant effluents,this report shall be submitted if the potential annual dose* to a MEMBER OF THE PUBLIC isequal to or greater than the calendar year limits of Section 4.4, 4.1 and 4.2. This report is notrequired if the measured level of radioactivity was not the result of plant effluents; however, insuch an event, the condition shall be reported and described in the Annual RadiologicalEnvironmental Operating Report.
c. With milk or fresh leafy vegetable samples unavailable from one or more of the sample locationsrequired by Table 6-1, identify locations for obtaining replacement samples and add them to theRadiological Environmental Monitoring Program within 30 days. The specific locations fromwhich samples were unavailable may then be deleted from the monitoring program.
* The methodology and parameters used to estimate the potential annual dose to a MEMBER OFTHE PUBLIC shall be indicated in this report.
concentration (1)reporting level (1)------------------------------------------------- concentration (2)
reporting level (2)---------------------------------------------- . . . 1.0≥+ +

63 ODCM Rev. 27
6.1.1 Surveillance Requirements
a. The radiological environmental monitoring samples shall be collected pursuant toTable 6-1 from the specific locations given in Table 6-4 and Figure and Figure 6-2 and shallbe analyzed pursuant to the requirements of Table 6-1, and the detection capabilitiesrequired by Table 6-3.
6.1.2 Implementation of the Requirements
The results of the radiological environmental monitoring program are intended to supplementthe results of the radiological effluent monitoring program by verifying that the measurableconcentrations of radioactive materials and levels of radiation are not higher than expectedbased on the effluent measurements and modeling of the environmental exposure pathways.Thus the specified environmental monitoring program provides measurements of radiation andof radioactive materials in those exposure pathways and for those radionuclides which lead tothe highest potential radiation exposures to individuals resulting from station operation.
This requirement is implemented by Nuclear Administrative and Technical Manualprocedures.

64 ODCM Rev. 27
TABLE 6-1
RADIOLOGICAL ENVIRONMENTAL MONITORING PROGRAM
Exposure Pathway and/or Sample
Number of Representative Samples and Sample Locationsa
Sampling and Collection Frequencya
Type and Frequency of Analysisd
Airborne
Radioiodine and particulates
Samples from 5 locations: 4 samples at or near the SITE BOUNDARIES (#14A, 15, 29, 40) including 3 different sectors of the highest calculated annual average ground level D/Q.*
1 sample (#40) from areas of special interest, which is from the vicinity of a community having the highest calculated annual average D/Q.
1 sample (#6A) from a control location 15-30 km (9-18 mi) distant and in the least prevalent wind direction.e
Continuous sampling collected weekly, or more frequently if required by dust loading.
Gross beta weeklyc, I-131 weekly; gamma isotopic analysis of composite (by location) quarterly.
Direct radiationb Forty (40) routine monitoring stations (#5-40, #42, #44, #46, #50) either with two or more dosimeters or with one instrument for measuring and recording dose rate continuously, placed as follows:
An inner ring of stations, one in each meteorological sector in the general area of the site boundary (16 locations);
An outer ring of stations, one in each meteorological sector in the 6-8 km (4-5 mi) range from the site (16 locations); and
The balance of the stations (8 locations) to be placed in special interest areas such as population centers, nearby residences, schools, and in one or two areas to serve as control stations.
Quarterly Gamma dose quarterly.
* D/Q refers to average annual relative ground deposition rate.

65 ODCM Rev. 27
Waterborne
Surface 85 acre Water storagereservoir (#60)45 acre Water storage reservoir (#61)Evaporation pond #1 (#59)Evaporation pond #2 (#63)Evaporation pond #3 (#64)
Quarterlyh grab sample Tritium and gamma isotopic analysis quarterly.
Ground 2 onsite wellsf (#57, #58) Quarterly grab sample Tritium and gamma isotopic analysis quarterly.
Drinking (well) 3 wells from surrounding residences (#46, #48, #49) that would be affected by its discharge.
Composite sample of weekly grab samples over 2-week period when I-131 analysis is performed, monthly composite of weekly grab samples otherwise
I-131 analysis on each composite when the dose calculated for the consumption of the water is greater than 1 mrem per year.g Composite for gross beta and gamma isotopic analyses monthly. Composite for tritium analysis quarterly.
Ingestion
Milk
Samples from milking animals in 3 locations within 5 km (3 mi) distant having the highest dose potential. If there are none, 1 sample from milking animals in each of three areas between 5 and 8 km (3-5 mi) distant (#51, #54) where doses are calculated to be greater than 1 mrem per year.g
One sample from milking animals at a control location 15 to 30 km (9-18 mi) distant (#53) and in the least prevalent wind direction.e
Semimonthly for animals on pasture; otherwise, monthly.
Gamma isotopic and I-131 analysis semimonthly when animals are on pasture or monthly at other times.
TABLE 6-1
RADIOLOGICAL ENVIRONMENTAL MONITORING PROGRAM
Exposure Pathway and/or Sample
Number of Representative Samples and Sample Locationsa
Sampling and Collection Frequencya
Type and Frequency of Analysisd
MAR 2016

66 ODCM Rev. 27
Food Products * 2 samples (#47, #51) of 3 types of broad leaf vegetation (as available) from locations identified per the criteria of Section 6.2b. of this manual.
Monthly during growing season.
Gamma isotopic analysis.
1 control sample (#62) of 3 types of broad leaf vegetation (as available) grown 15 to 30 km (9-18 mi) distant in the least prevalent wind direction.e
Monthly during growing season.
Gamma isotopic analysis.
* When broad leaf vegetation samples are not available, reports from 4 existing supplemental airborne radioiodine sample locations will be substituted.
TABLE 6-1
RADIOLOGICAL ENVIRONMENTAL MONITORING PROGRAM
Exposure Pathway and/or Sample
Number of Representative Samples and Sample Locationsa
Sampling and Collection Frequencya
Type and Frequency of Analysisd
MAR 2016
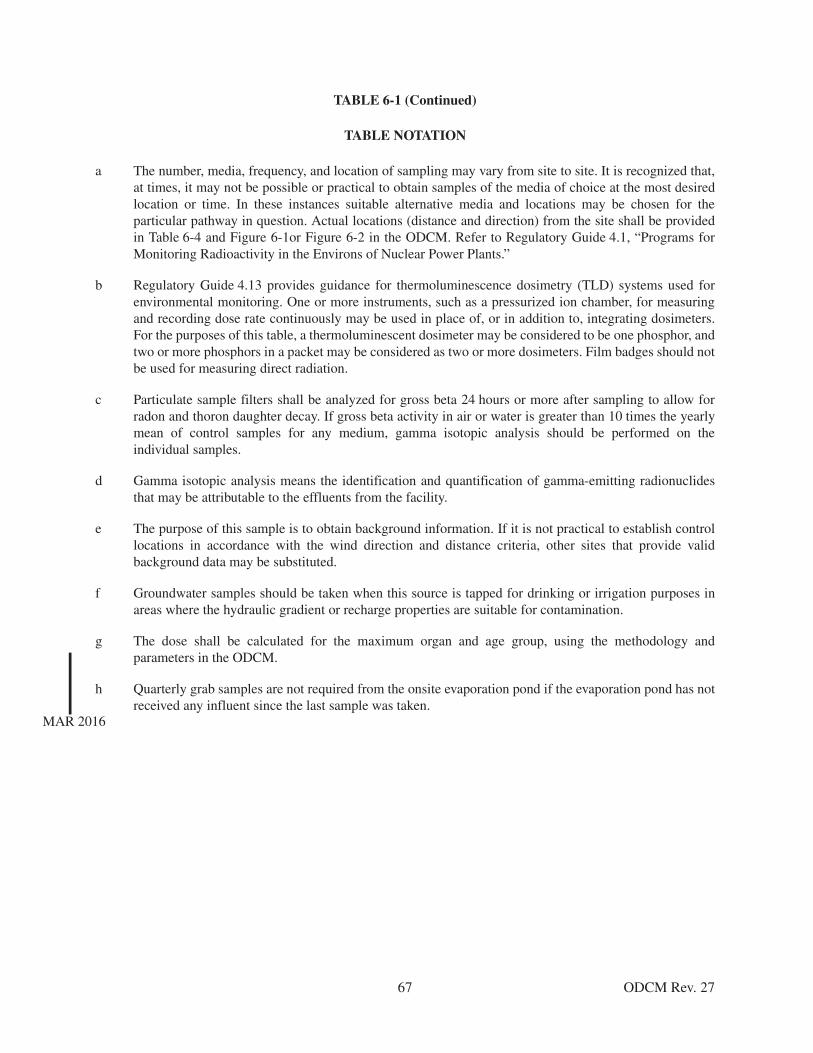
67 ODCM Rev. 27
TABLE 6-1 (Continued)
TABLE NOTATION
a The number, media, frequency, and location of sampling may vary from site to site. It is recognized that,at times, it may not be possible or practical to obtain samples of the media of choice at the most desiredlocation or time. In these instances suitable alternative media and locations may be chosen for theparticular pathway in question. Actual locations (distance and direction) from the site shall be providedin Table 6-4 and Figure 6-1or Figure 6-2 in the ODCM. Refer to Regulatory Guide 4.1, “Programs forMonitoring Radioactivity in the Environs of Nuclear Power Plants.”
b Regulatory Guide 4.13 provides guidance for thermoluminescence dosimetry (TLD) systems used forenvironmental monitoring. One or more instruments, such as a pressurized ion chamber, for measuringand recording dose rate continuously may be used in place of, or in addition to, integrating dosimeters.For the purposes of this table, a thermoluminescent dosimeter may be considered to be one phosphor, andtwo or more phosphors in a packet may be considered as two or more dosimeters. Film badges should notbe used for measuring direct radiation.
c Particulate sample filters shall be analyzed for gross beta 24 hours or more after sampling to allow forradon and thoron daughter decay. If gross beta activity in air or water is greater than 10 times the yearlymean of control samples for any medium, gamma isotopic analysis should be performed on theindividual samples.
d Gamma isotopic analysis means the identification and quantification of gamma-emitting radionuclidesthat may be attributable to the effluents from the facility.
e The purpose of this sample is to obtain background information. If it is not practical to establish controllocations in accordance with the wind direction and distance criteria, other sites that provide validbackground data may be substituted.
f Groundwater samples should be taken when this source is tapped for drinking or irrigation purposes inareas where the hydraulic gradient or recharge properties are suitable for contamination.
g The dose shall be calculated for the maximum organ and age group, using the methodology andparameters in the ODCM.
h Quarterly grab samples are not required from the onsite evaporation pond if the evaporation pond has notreceived any influent since the last sample was taken.
MAR 2016

68 ODCM Rev. 27
* For drinking water samples. This is a 40 CFR 141 value. If no drinking water pathway exists, a value of 30,000 pCi/l may be used.
** If no drinking water pathway exists, a reporting level of 20 pCi/l may be used.
TABLE 6-2
REPORTING LEVELS FOR RADIOACTIVITY CONCENTRATIONS IN
ENVIRONMENTAL SAMPLES
Analysis Water (pCi/l)Airborne Particulate
or Gas (pCi/m3)Fresh Milk
(pCi/l)Food Products (pCi/kg, wet)
H-3 20,000 *
Mn-54 1,000
Fe-59 400
Co-58 1,000
Co-60 300
Zn-65 300
Zr-Nb-95 400
I-131 2 ** 0.9 3 100
Cs-134 30 10 60 1,000
Cs-137 50 20 70 2,000
Ba-La-140 200 300

69 ODCM Rev. 27
NOTE: This list does not mean that only these nuclides are to be detected and reported. Other peaks that are measurable and identifiable, together with the above nuclides, shall also be identified and reported.
* If no drinking water pathway exists, a value of 3000 pCi/l may be used.
** If no drinking water pathway exists, a value of 15 pCi/l may be used.
TABLE 6-3
DETECTION CAPABILITIES FOR ENVIRONMENTAL ANALYSIS
Lower Limit of Detection (LLD)b
Analysis Water (pCi/l) Airborne Particulate
or Gas (pCi/m3) Fresh Milk
(pCi/l) Food Products (pCi/kg, wet)
Gross Beta 4 0.01
H-3 2000*
Mn-54 15
Fe-59 30
Co-58, -60 15
Zn-65 30
Zr-95 30
Nb-95 15
I-131 1** 0.07 1 60
Cs-134 15 0.05 15 60
Cs-137 18 0.06 18 80
Ba-140 60 60
La-140 15 15
a

70 ODCM Rev. 27
Table 6-3 (Continued)
TABLE NOTATION
a Guidance for detection capabilities for thermoluminescent dosimeters used for environmentalmeasurements is given in Regulatory Guide 4.13.
b Table 6-3 indicates acceptable detection capabilities for radioactive materials in environmental samples.These detection capabilities are tabulated in terms of the lower limits of detection (LLDs). The LLD isdefined, for purposes of this guide, as the smallest concentration of radioactive material in a sample thatwill yield a net count (above system background) that will be detected with 95% probability with only5% probability of falsely concluding that a blank observation represents a “real” signal.
For a particular measurement system (which may include radiochemical separation):
Where:
LLD is the a priori lower limit of detection as defined above (as pCi per unit mass or volume),
sb is the standard deviation of the background counting rate or of the counting rate of a blank sample asappropriate (as counts per minute),
E is the counting efficiency (as counts per disintegration),
V is the sample size (in units of mass or volume),
2.22 is the number of disintegrations per minute per picocurie,
Y is the fractional radiochemical yield (when applicable),
λ is the radioactive decay constant for the particular radionuclide, and
Δt for environmental samples is the elapsed time between sample collection (or end of the samplecollection period) and time of counting.
In calculating the LLD for a radionuclide determined by gamma-ray spectrometry the background shouldinclude the typical contributions of other radionuclides normally present in the samples (e.g.,potassium-40 in milk samples). Typical values of E, V, Y, and Δt should be used in the calculation.
It should be recognized that the LLD is defined as an a priori (before the fact) limit representing thecapability of a measurement system and not as an a posteriori (after the fact) limit for a particularmeasurement. Analyses shall be performed in such a manner that the stated LLDs will be achieved underroutine conditions. Occasionally background fluctuations, unavoidable small sample sizes, the presenceof interfering nuclides, or other uncontrollable circumstances may render these LLDs unachievable. Insuch cases, the contributing factors shall be identified and described in the Annual RadiologicalEnvironmental Operating Report.
LLD4.66sb
E * V * 2.22 * Y * exp λΔt–( )-------------------------------------------------------------------------=

71 ODCM Rev. 27
6.2 Requirement: Land Use Census
A land use census shall be conducted and shall identify within a distance of 8 km (5 miles) thelocation in each of the 16 meteorological sectors of the nearest milk animal, the nearest residence andthe nearest garden* of greater than 50 m2 (500 ft2) producing broad leaf vegetation.
Applicability: At all times.
Action:
a. With a land use census identifying a location(s) that yields a calculated dose or dose commitmentgreater than the values currently being calculated in Section 4.2.1, identify the new location(s) inthe next Annual Radioactive Effluent Release Report, pursuant to Section 7.1.
b. With a land use census identifying a location(s) that yields a calculated dose or dose commitment(via the same exposure pathway) 20% greater than at a location from which samples are currentlybeing obtained in accordance with Section 6.1, add the new location(s) to the radiologicalenvironmental monitoring program within 30 days. The sampling location(s), excluding thecontrol station location, having the lowest calculated dose or dose commitment(s), via the sameexposure pathway, may then be deleted from the monitoring program.
6.2.1 Surveillance Requirements
a. The land use census shall be conducted during the growing season annually using thatinformation that will provide the best results, such as by a door-to-door survey, aerialsurvey, or by consulting local agriculture authorities. The results of the land use censusshall be included in the Annual Radiological Environmental Operating Report pursuant toSection 7.2.
6.2.2 Implementation of the Requirements
The above Requirement is implemented by Nuclear Administrative and Technical Manualprocedures.
* Broad Leaf vegetation sampling of at least three different kinds of vegetation may be performed atthe SITE BOUNDARY in each of two different direction sectors with the highest predicted D/Qsin lieu of the garden census. Specifications for broad leaf vegetation sampling in Table 6-1 shallbe followed, including analysis of control samples.

72 ODCM Rev. 27
6.3 Requirement: Interlaboratory Comparison Program
Analyses shall be performed on radioactive materials supplied as part of an InterlaboratoryComparison Program that correspond to samples required by Table 6-1, as applicable.
Applicability: At all times.
Action:
a. With analyses not being performed as required above, report the corrective actions taken toprevent a recurrence to the Commission in the Annual Radiological Environmental OperatingReport pursuant to Section 7.2.
6.3.1 Surveillance Requirements
a. A summary of the results obtained as part of the above required InterlaboratoryComparison Program and in accordance with the methodology and parameters in thismanual shall be included in the Annual Radiological Environmental Operating Reportpursuant to Section 7.2.
6.3.2 Implementation of the Requirements
PVNGS laboratories or contract laboratories which perform analyses for the RadiologicalEnvironmental Monitoring Program (REMP) participate in an Interlaboratory ComparisonProgram. The participation includes all of the determinations (sample medium-radionuclidecombinations) that are included in the monitoring program.
If deviation from specified limits is identified an investigation is made to determine the reasonfor the deviation and corrective actions are taken as necessary. The results of all analyses madeunder this program are included in the Annual Radiological Environmental Operating Report.

73 ODCM Rev. 27
TABLE 6-4
RADIOLOGICAL ENVIRONMENTAL MONITORING SAMPLE COLLECTION LOCATIONS
SAMPLE SITE SAMPLE TYPE
NOTE (d)
LOCATION DESIGNATION
(a) LOCATION DESCRIPTION (c)
1 TLD SUP E30 Goodyear
2 TLD SUP ENE24 Scott-Libby School
3 TLD SUP E21 Liberty School
4 TLD SUP E16 Buckeye
4 Air SUP E16 Same as TLD
5 TLD (b) SP ESE11 Palo Verde School
6 TLD (b) Control SSE31 APS Gila Bend substation
6A Air (b) Control SSE13 Old US 80
7 TLD (b) SP SE7 Old US 80 and Arlington School Rd.
7A Air SUP ESE3 Arlington School
8 TLD (b) OR SSE4 Southern Pacific Pipeline Rd.
9 TLD (b) OR S5 Southern Pacific Pipeline Rd.
10 TLD (b) OR SE5 355th Ave. and Elliot Rd.
11 TLD (b) OR ESE5 339th Ave. and Dobbins Rd.
12 TLD (b) OR E5 339th Ave. and Buckeye-Salome Rd.
13 TLD (b) IR N1 N site boundary
14 TLD (b) IR NNE2 NNE site boundary
14A Air (b) NNE2 371st Ave. and Buckeye-Salome Rd.
15 TLD (b) IR NE2 NE site boundary, WRF access road
15 Air (b) NE2 Same as TLD
16 TLD (b) IR ENE2 ENE site boundary
17 TLD (b) IR E2 E site boundary
17A Air SUP E3 351st Ave.
18 TLD (b) IR ESE2 ESE site boundary
19 TLD (b) IR SE2 SE site boundary
20 TLD (b) IR SSE2 SSE site boundary
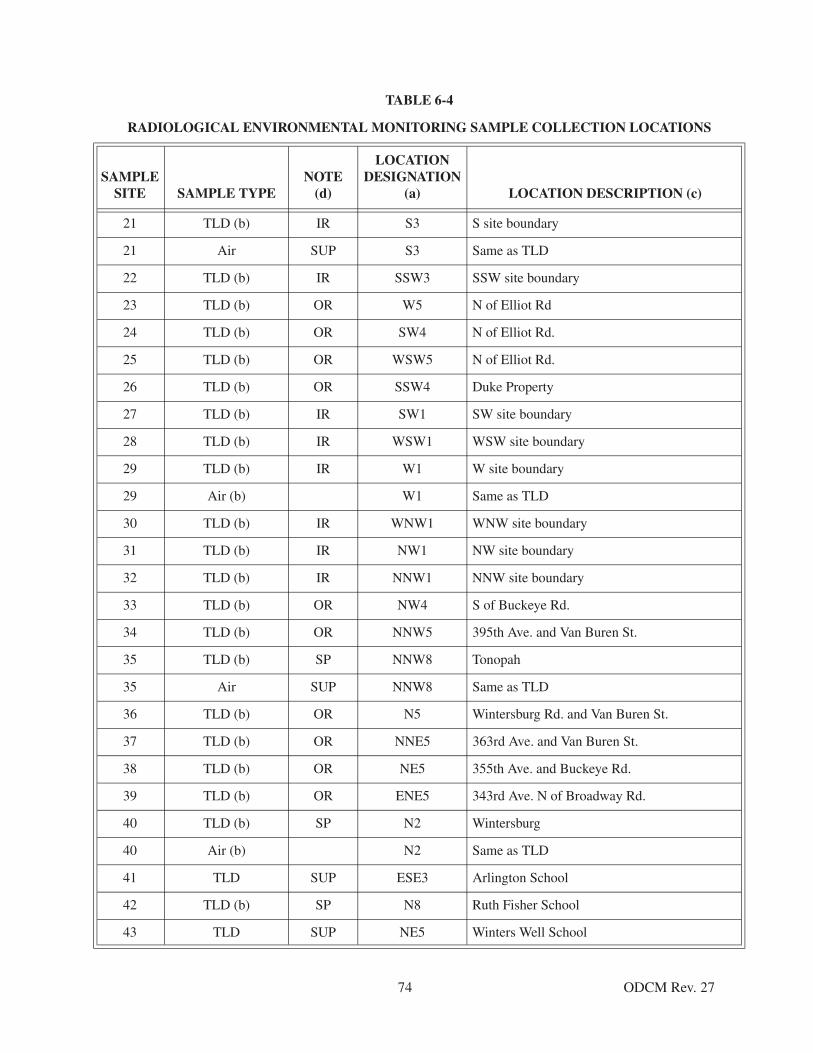
74 ODCM Rev. 27
21 TLD (b) IR S3 S site boundary
21 Air SUP S3 Same as TLD
22 TLD (b) IR SSW3 SSW site boundary
23 TLD (b) OR W5 N of Elliot Rd
24 TLD (b) OR SW4 N of Elliot Rd.
25 TLD (b) OR WSW5 N of Elliot Rd.
26 TLD (b) OR SSW4 Duke Property
27 TLD (b) IR SW1 SW site boundary
28 TLD (b) IR WSW1 WSW site boundary
29 TLD (b) IR W1 W site boundary
29 Air (b) W1 Same as TLD
30 TLD (b) IR WNW1 WNW site boundary
31 TLD (b) IR NW1 NW site boundary
32 TLD (b) IR NNW1 NNW site boundary
33 TLD (b) OR NW4 S of Buckeye Rd.
34 TLD (b) OR NNW5 395th Ave. and Van Buren St.
35 TLD (b) SP NNW8 Tonopah
35 Air SUP NNW8 Same as TLD
36 TLD (b) OR N5 Wintersburg Rd. and Van Buren St.
37 TLD (b) OR NNE5 363rd Ave. and Van Buren St.
38 TLD (b) OR NE5 355th Ave. and Buckeye Rd.
39 TLD (b) OR ENE5 343rd Ave. N of Broadway Rd.
40 TLD (b) SP N2 Wintersburg
40 Air (b) N2 Same as TLD
41 TLD SUP ESE3 Arlington School
42 TLD (b) SP N8 Ruth Fisher School
43 TLD SUP NE5 Winters Well School
TABLE 6-4
RADIOLOGICAL ENVIRONMENTAL MONITORING SAMPLE COLLECTION LOCATIONS
SAMPLE SITE SAMPLE TYPE
NOTE (d)
LOCATION DESIGNATION
(a) LOCATION DESCRIPTION (c)
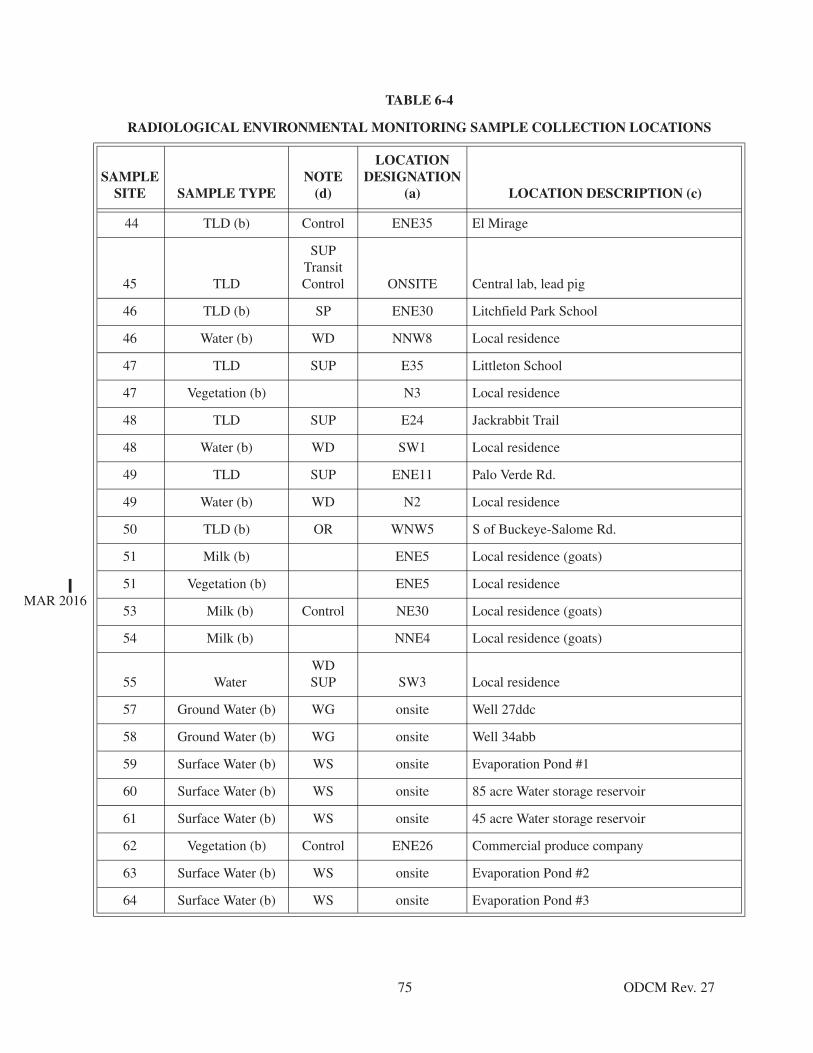
75 ODCM Rev. 27
44 TLD (b) Control ENE35 El Mirage
45 TLD
SUPTransit Control ONSITE Central lab, lead pig
46 TLD (b) SP ENE30 Litchfield Park School
46 Water (b) WD NNW8 Local residence
47 TLD SUP E35 Littleton School
47 Vegetation (b) N3 Local residence
48 TLD SUP E24 Jackrabbit Trail
48 Water (b) WD SW1 Local residence
49 TLD SUP ENE11 Palo Verde Rd.
49 Water (b) WD N2 Local residence
50 TLD (b) OR WNW5 S of Buckeye-Salome Rd.
51 Milk (b) ENE5 Local residence (goats)
51 Vegetation (b) ENE5 Local residence
53 Milk (b) Control NE30 Local residence (goats)
54 Milk (b) NNE4 Local residence (goats)
55 WaterWDSUP SW3 Local residence
57 Ground Water (b) WG onsite Well 27ddc
58 Ground Water (b) WG onsite Well 34abb
59 Surface Water (b) WS onsite Evaporation Pond #1
60 Surface Water (b) WS onsite 85 acre Water storage reservoir
61 Surface Water (b) WS onsite 45 acre Water storage reservoir
62 Vegetation (b) Control ENE26 Commercial produce company
63 Surface Water (b) WS onsite Evaporation Pond #2
64 Surface Water (b) WS onsite Evaporation Pond #3
TABLE 6-4
RADIOLOGICAL ENVIRONMENTAL MONITORING SAMPLE COLLECTION LOCATIONS
SAMPLE SITE SAMPLE TYPE
NOTE (d)
LOCATION DESIGNATION
(a) LOCATION DESCRIPTION (c)
MAR 2016

76 ODCM Rev. 27
NOTES: (a) Distance and direction are relative to the Unit 2 containment, rounded to the nearest mile.(b) These samples fulfill the requirements of the ODCM, Table 6-1.(c) Refer to Figure 6-1 and Figure 6-2 for relative locations of sample sites.(d) IR - inner ring
OR - outer ring SP - school or population centerWS - waterborne surfaceWG - waterborne groundWD - waterborne drinkingSUP -designated supplemental sampling location

77 ODCM Rev. 27
Figure 6-1Radiological Environmental
Monitoring Program Sample Sites0 - 10 miles
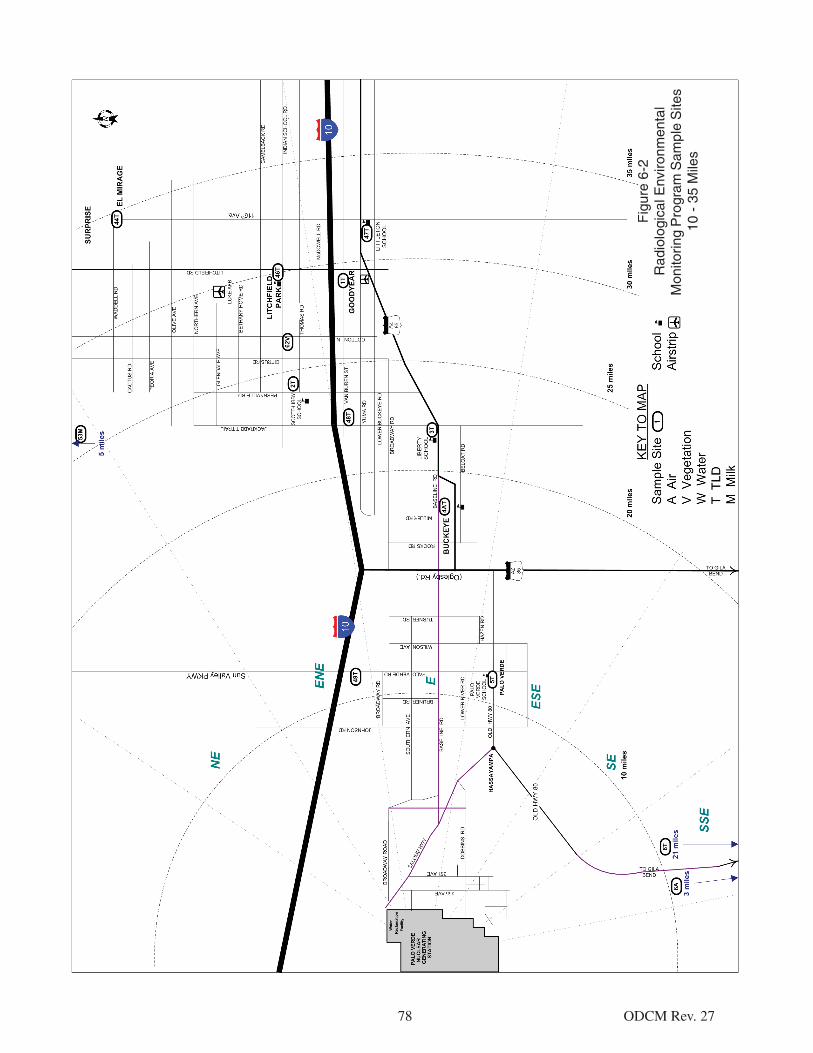
78 ODCM Rev. 27
Fig
ure
6-2
Rad
iolo
gica
l Env
ironm
enta
l M
onito
ring
Pro
gram
Sam
ple
Site
s 10
- 3
5 M
iles

79 ODCM Rev. 27
Figure 6-3Radiological Environmental Monitoring Program
Sample Sites 35 - 75 MilesDELETED
80 ODCM Rev. 27
Figure 6-4Site Exclusion Area Boundary
DELETED
Refer to UFSAR Figure 2.1-4
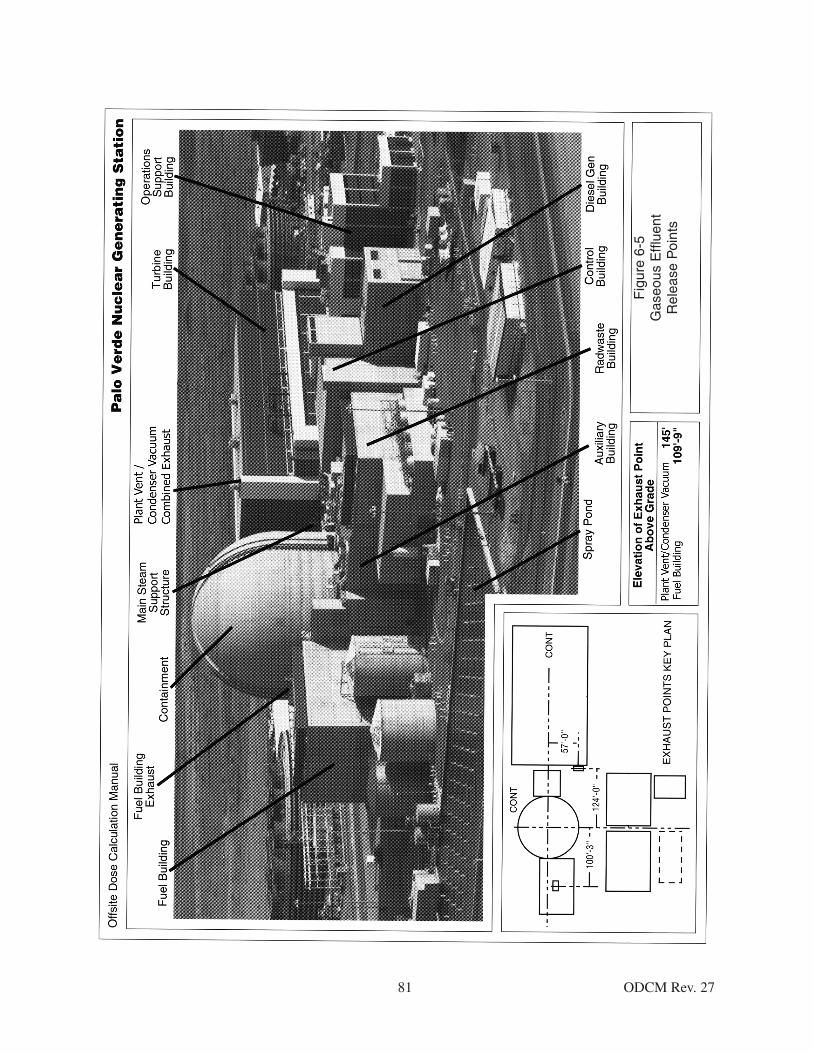
81 ODCM Rev. 27
Fig
ure
6-5
Gas
eous
Effl
uent
Rel
ease
Poi
nts

82 ODCM Rev. 27
Figure 6-6Low Population Zone
DELETED
Refer to UFSAR Figure 2.1-15

83 ODCM Rev. 27
7.0 RADIOLOGICAL REPORTS
7.1 Requirement: Annual Radioactive Effluent Release Report
Routine Annual Radioactive Effluent Release Reports covering the operation of the units during theprevious calendar year shall be submitted in accordance with Technical Specification 5.6.3.
The Annual Radioactive Effluent Release Reports shall include a summary of the quantities ofradioactive liquid and gaseous effluents and solid waste released from the unit as outlined inRegulatory Guide 1.21, “Measuring, Evaluating, and Reporting Radioactivity in Solid Wastes andReleases of Radioactive Materials in Liquid and Gaseous Effluents from Light-Water-Cooled NuclearPower Plants,” Revision 1, June 1974, with data summarized on a quarterly basis following theformat of Appendix B thereof.
The Annual Radioactive Effluent Release Report shall include an annual summary of hourlymeteorological data collected over the previous year. This annual summary may be either in the formof an hour-by-hour listing on magnetic tape of wind speed, wind direction, atmospheric stability, andprecipitation (if measured), or in the form of joint frequency distributions of wind speed, winddirection, and atmospheric stability**. This same report shall include an assessment of the radiationdoses due to the radioactive liquid and gaseous effluents released from the unit or station during theprevious calendar year. This same report shall also include an assessment of the radiation doses fromradioactive liquid and gaseous effluents to MEMBERS OF THE PUBLIC due to their activities insidethe SITE BOUNDARY (Figure 6-4) during the report period. All assumptions used in making theseassessments, i.e., specific activity, exposure time and location, shall be included in these reports. Themeteorological conditions concurrent with the time of release of radioactive materials in gaseouseffluents, as determined by sampling frequency and measurement, shall be used for determining thegaseous pathway doses. The assessment of radiation doses shall be performed in accordance with themethodology and parameters in the ODCM.
The Annual Radioactive Effluent Release Report shall also include an assessment of radiation dosesto the likely most exposed MEMBER OF THE PUBLIC from reactor releases and other nearbyuranium fuel cycle sources, including doses from primary effluent pathways and direct radiation, forthe previous calendar year to show conformance with 40 CFR Part 190, Environmental RadiationProtection Standards for Nuclear Power Operation. Acceptable methods for calculating the dosecontributions are given Section 5.0 and Regulatory Guide 1.109 Rev. 1, October 1977.
The Annual Radioactive Effluent Release Report shall also include information required by theTechnical Requirements Manual, Section 5.0.600.1.
* A single submittal may be made for a multiple unit station. The submittal should combine thosesections that are common to all units at the station; however, for units with separate radwaste systems,the submittal shall specify the releases of radioactive material from each unit.
** In lieu of submission with the Annual Radioactive Effluent Release Report, the licensee has theoption of retaining this summary of required meteorological data on site in a file that shall beprovided to the NRC upon request.
*

84 ODCM Rev. 27
The Annual Radioactive Effluent Release Reports shall include the following information for eachclass of solid waste (as defined by 10 CFR Part 61) shipped offsite during the report period:
a. Container volume,
b. Total curie quantity (specify whether determined by measurement or estimate),
c. Principal radionuclides (specify whether determined by measurement or estimate),
d. Source of waste and processing employed (e.g., dewatered spent resin, compacted dry waste,evaporator bottoms),
e. Type of container (e.g., LSA, Type A, Type B, Large Quantity), and
f. Solidification agent or absorbent (e.g., cement, urea formaldehyde).
The Annual Radioactive Effluent Release Reports shall include a list and description of unplannedreleases from the site to UNRESTRICTED AREAS of radioactive materials in gaseous and liquideffluents made during the reporting period.
Changes to the ODCM shall be submitted in the form of a complete, legible copy as part of orconcurrent with the Annual Radioactive Effluent Release Report for the period of the report in whichany change in the ODCM was made. Changes made to the Process Control Program shall besubmitted with the Annual Radioactive Effluent Release Report for the period of the report in whichany change in the Process Control Program was made.

85 ODCM Rev. 27
7.2 Requirement: Annual Radiological Environmental Operating Report
Routine Annual Radiological Environmental Operating Reports covering the operation of the unitsduring the previous calendar year shall be submitted by May 15 of each year in accordance withTechnical Specification 5.6.2.
The Annual Radiological Environmental Operating Reports shall include summaries, interpretations,and an analysis of trends of the results of the radiological environmental surveillance activities for thereport period, including a comparison with preoperational studies, with operational controls asappropriate, and with previous environmental surveillance reports, and an assessment of the observedimpacts of the plant operation on the environment. The reports shall also include the results of landuse censuses required by Section 6.2.
The Annual Radiological Environmental Operating Reports shall include the results of analysis of allradiological environmental samples and of all environmental radiation measurements taken duringthe period pursuant to the locations specified in Table 6-4 and Figure and Figure 6-2 as well assummarized and tabulated results of these analyses and measurements in the format of the table in theRadiological Assessment Branch Technical Position, Revision 1, November 1979. In the event thatsome individual results are not available for inclusion with the report, the report shall be submittednoting and explaining the reasons for the missing results. The missing data shall be submitted as soonas possible in a supplementary report.
The reports shall also include the following: a summary description of the radiological environmentalmonitoring program; at least two legible maps** covering all sampling locations keyed to a tablegiving distances and directions from the centerline of one reactor; the results of licensee participationin the Interlaboratory Comparison Program, required by Section 6.3; discussion of all deviations fromthe sampling schedule of Table 6-1; and discussion of all analyses in which the LLD required byTable 6-3 was not achievable.
* A single submittal may be made for a multiple unit station.
** One map shall cover stations near the SITE BOUNDARY; a second shall include the more distantstations.
*
86 ODCM Rev. 27
APPENDIX A DETERMINATION OF CONTROLLING LOCATION
The controlling location is the location of the MEMBER OF THE PUBLIC who receives the highest doses.
The determination of a controlling location for implementation of 10CFR50 for radioiodines and particulates isknown to be a function of:
(1) Isotopic release rates
(2) Meteorology
(3) Exposure pathway
(4) Receptor’s age
The incorporation of these parameters into Equation 5-2 results in the respective equations at the controllinglocation. The isotopic release rates are based upon the source terms calculated using the PVNGS EnvironmentalReport, Operating License Stage, Table 3.5-12, without carbon.
All of the locations and exposure pathways, identified in the 1984 Land Use Census, have been evaluated. Theseinclude cow milk ingestion, goat milk ingestion, vegetable ingestion, inhalation, and ground plane exposure. Aninfant is assumed to be present at all milk pathway locations. A child is assumed to be present at all vegetablegarden locations. The ground plane exposure pathway is only considered to be present where an infant is notpresent. Naturally, inhalation is present everywhere an individual is present.
For the determination of the controlling locations, the highest X/Q and D/Q values, based on the 9 yearmeteorological data base, for the vegetable garden, cow milk, and goat milk pathways, are selected for eachunit. The receptor organ doses have been calculated at each of these locations. Based upon these calculations, itis determined that the controlling receptor pathway is a function of unit location. For Unit 1, the controllingreceptor is a garden-child pathway; for releases from Unit 2 and Unit 3 the controlling receptor is a cow milk-infant pathway. These determinations are based upon Table 4-16, 4-17, or 4-18, which, in turn, is based upon the1984 Land Use Census. Locations of the nearest residences, gardens and milk animals, as determined in the1984 Land Use Census, are given in Table 4-16, 4-17, and 4-18.

87 ODCM Rev. 27
APPENDIX B BASES FOR REQUIREMENTS
B-2.1 RADIOACTIVE GASEOUS EFFLUENT MONITORING INSTRUMENTATION
The radioactive gaseous effluent instrumentation is provided to monitor and control, as applicable, thereleases of radioactive materials in gaseous effluents during actual or potential releases of gaseouseffluents. The alarm/trip setpoints for these instruments shall be calculated and adjusted in accordancewith the methodology and parameters in the ODCM to ensure that the alarm/trip will occur prior toexceeding the limits of 10 CFR Part 20. The OPERABILITY and use of this instrumentation isconsistent with the requirements of General Design Criteria 60, 63, 64 of Appendix A to 10 CFRPART 50.
There are two separate radioactive gaseous effluent monitoring systems: the low range effluentmonitors for normal plant radioactive gaseous effluents and the high range effluent monitors for post-accident plant radioactive gaseous effluents. The low range monitors operate at all times until theconcentration of radioactivity in the effluent becomes too high during post-accident conditions. Thehigh range monitors only operate when the concentration of radioactivity in the effluent is above thesetpoint in the low range monitors.
B-3.1 GASEOUS EFFLUENT - DOSE RATE
This requirement provides reasonable assurance that radioactive material discharged in gaseouseffluents will not result in the exposure of a MEMBER OF THE PUBLIC in an UNRESTRICTEDAREA, either at or beyond the SITE BOUNDARY, in excess of the design objectives of Appendix I to10 CFR part 50. This requirement is provided to ensure that gaseous effluents from all units on the sitewill be appropriately controlled. It provides operational flexibility for releasing gaseous effluents tosatisfy the Section II.A and II.C design objectives of Appendix I to 10 CFR part 50. For MEMBERSOF THE PUBLIC who may at times be within the SITE BOUNDARY, the occupancy of thatMEMBER OF THE PUBLIC will usually be sufficiently low to compensate for any increase in theatmospheric diffusion factor above that for the SITE BOUNDARY. Examples of calculations for suchMEMBERS OF THE PUBLIC, with the appropriate occupancy factors, shall be given in the ODCM.The specified release rate limits restrict, at all times, the corresponding gamma and beta dose ratesabove background to a MEMBER OF THE PUBLIC at or beyond the SITE BOUNDARY to less thanor equal to 500 mrems/year to the total body or to less than or equal to 3000 mrems/year to the skin.These release rate limits also restrict, at all times, the corresponding thyroid dose rate abovebackground to a child via the inhalation pathway to less than or equal to 1500 mrems/year. Thisrequirement does not affect the requirement to comply with the annual limitations of10 CFR 20.1301(a).
This requirement applies to the release of radioactive materials in gaseous effluents from all reactorunits at the site.
The required detection capabilities for radioactive materials in gaseous waste samples are tabulated interms of the lower limits of detection (LLD). Detailed discussion of the LLD and other detection limitscan be found in Currie, L. A., “Lower Limit of Detection: Definition and Elaboration of a ProposedPosition for Radiological Effluent and Environmental Measurements,” NUREG/CR-4007(September 1984), and in the HASL Procedures Manual, HASL-300 (revised annually).

88 ODCM Rev. 27
B-3.2 SECONDARY SYSTEM LIQUID WASTE DISCHARGE TO ONSITE EVAPORATIONPONDS - CONCENTRATION
This requirement is provided to ensure that the annual total effective dose equivalent to individualmembers of the public from the licensed operation does not exceed the requirements of 10 CFRPart 20, due to the accumulated activity in the evaporation ponds from the secondary systemdischarges.
Restricting the concentrations of the secondary liquid wastes discharged to the onsite evaporationponds will restrict the quantity of radioactive material that can accumulate in the ponds. This, in turn,provides assurance that in the event of an uncontrolled release of the pond’s contents to anUNRESTRICTED AREA, the resulting total effective dose equivalent to individual members of thepublic at the nearest exclusion area boundary will not exceed the requirements of 10 CFR Part 20.
This requirement applies to the secondary system liquid waste discharges of radioactive materials fromall reactor units to the onsite evaporation ponds.
The required detection capabilities for radioactive materials in gaseous waste samples are tabulated interms of the lower limits of detection (LLD). Detailed discussion of the LLD and other detection limitscan be found in Currie, L. A., “Lower Limit of Detection: Definition and Elaboration of a ProposedPosition for Radiological Effluent and Environmental Measurements,” NUREG/CR-4007(September 1984), and in the HASL Procedures Manual, HASL-300 (revised annually).
B-4.1 GASEOUS EFFLUENT - DOSE, Noble Gases
This requirement is provided to implement Sections II.B, III.A and IV.A of Appendix I, 10 CFRPart 50. This requirement implements the guides set forth in Section II.B of Appendix I. The ACTIONstatements provide the required operating flexibility and at the same time implement the guides setforth in Section IV.A of Appendix I to assure that the releases of radioactive material in gaseouseffluents to UNRESTRICTED AREAS will be kept “as low as is reasonably achievable.” Thesurveillance requirements implement the requirements in Section III.A of Appendix I that conformancewith the guides of Appendix I be shown by calculational procedures based on models and data suchthat the actual exposure of a MEMBER OF THE PUBLIC through appropriate pathways is unlikely tobe substantially underestimated. The dose calculation methodology and parameters established in theODCM for calculating the doses due to the actual release rates of radioactive noble gases in gaseouseffluents are consistent with the methodology provided in Regulatory Guide 1.109, “Calculation ofAnnual Doses to Man from Routine Releases of Reactor Effluents for the Purpose of EvaluatingCompliance with 10 CFR Part 50, Appendix I,” Revision 1, October 1977 and Regulatory Guide 1.111,“Methods for Estimating Atmospheric Transport and Dispersion of Gaseous Effluents in RoutineReleases from Light-Water Cooled Reactors,” Revision 1, July 1977. The ODCM equations providedfor determining the air doses at and beyond the SITE BOUNDARY are based upon the historicalaverage atmospheric conditions.
This requirement applies to the release of radioactive materials in gaseous effluents from each reactorunit at the site.

89 ODCM Rev. 27
B-4.2 GASEOUS EFFLUENT - DOSE - Iodine-131, Iodine-133, Tritium, and All Radionuclides inParticulate Form With Half-Lives Greater Than 8 Days
This requirement is provided to implement the requirements of Sections II.C, III.A, IV.A ofAppendix I, 10 CFR Part 50. This requirement is the guide set forth in Section II.C of Appendix I. TheACTION statements provide the required operating flexibility and at the same time implement theguides set forth in Section IV.A of Appendix I to assure that the releases of radioactive materials ingaseous effluents to UNRESTRICTED AREAS will be kept “as low as is reasonably achievable.” TheODCM calculational methods specified in the surveillance requirements implement the requirements inSection III.A of Appendix I that conformance with the guides of Appendix I be shown by calculationalprocedures based on models and data, such that the actual exposure of a MEMBER OF THE PUBLICthrough appropriate pathways is unlikely to be substantially underestimated. The ODCM calculationalmethodology and parameters for calculating the doses due to the actual release rates of the subjectmaterials are consistent with the methodology provided in Regulatory Guide 1.109, “Calculation ofAnnual Doses to Man from Routine Releases of Reactor Effluents for the Purpose of EvaluatingCompliance with 10 CFR Part 50, Appendix I,” Revision 1, October 1977 and Regulatory Guide 1.111,“Methods for Estimating Atmospheric Transport and Dispersion of Gaseous Effluents in RoutineReleases for Light-Water-Cooled Reactors,” Revision 1, July 1977. These equations also provide fordetermining the actual doses based upon the historical average atmospheric conditions. The release ratespecifications for iodine-131, iodine-133, tritium, and radionuclides in particulate form with half-livesgreater than 8 days are dependent upon the existing radionuclide pathways to man, in the areas at andbeyond the SITE BOUNDARY. The pathways that were examined in the development of thesecalculations were: (1) individual inhalation of airborne radionuclides, (2) deposition of radionuclidesonto green leafy vegetation with subsequent consumption by man, (3) deposition onto grassy areaswhere milk animals and meat-producing animals graze with consumption of the milk and meat by man,and (4) deposition on the ground with subsequent exposure of man.
This requirement applies to the release of radioactive materials in gaseous effluents from each reactorunit at the site.
B-4.3 GASEOUS RADWASTE TREATMENT
The OPERABILITY of the GASEOUS RADWASTE SYSTEM and the VENTILATION EXHAUSTTREATMENT SYSTEM ensures that the systems will be available for use whenever gaseous effluentsrequire treatment prior to release to the environment. The requirement that the appropriate portions ofthese systems be used, when specified, provides reasonable assurance that the releases of radioactivematerials in gaseous effluents will be kept “as low as reasonably achievable.” This requirementimplements the requirements of 10 CFR 50.36a, General Design Criterion 60 of Appendix A to10 CFR Part 50, and the design objectives given in Section II.D of Appendix I to 10 CFR Part 50. Thespecified limits governing the use of appropriate portions of the systems were specified as a suitablefraction of the dose design objectives set forth in Sections II.B and II.C of Appendix I, 10 CFR Part 50,for gaseous effluents.
This requirement applies to the release of radioactive materials in gaseous effluents from each reactorunit at the site.
The minimum analysis frequency of 4/M (i.e., at least 4 times per month at intervals no greater than9 days and a minimum of 48 times a year) is used for certain radioactive gaseous waste sampling inTable 3-1. This will eliminate taking double samples when quarterly and weekly samples are requiredat the same time.

90 ODCM Rev. 27
B-4.4 SECONDARY SYSTEM LIQUID WASTE DISCHARGE TO ONSITE EVAPORATIONPONDS - DOSE
This requirement is provided to implement the requirements of Sections II.A, III.A and IV.A ofAppendix I, 10 CFR Part 50. This requirement implements the guides set forth in Section II.A ofAppendix I. The ACTION statements provide the required operating flexibility and at the same timeimplement the guides set forth in Section IV.A of Appendix I to assure that the releases of radioactivematerial in liquid effluents to UNRESTRICTED AREAS will be kept “as low as is reasonablyachievable.” Also, for fresh water sites with drinking water supplies that can be potentially affected byplant operations, there is reasonable assurance that the operation of the facility will not result inradionuclide concentrations in the finished drinking water that are in excess of the requirements of40 CFR Part 141. The dose calculation methodology and parameters in the ODCM implement therequirements in Section III.A of Appendix I that conformance with the guides of Appendix I be shownby calculational procedures based on models and data, such that the actual exposure of a MEMBER OFTHE PUBLIC through appropriate pathways is unlikely to be substantially underestimated. Theequations specified in the ODCM for calculating the doses due to the actual release rates of radioactivematerials in liquid effluents are consistent with the methodology provided in Regulatory Guide 1.109,“Calculation of Annual Doses to Man from Routine Releases of Reactor Effluents for the Purpose ofEvaluating Compliance with 10 CFR Part 50, Appendix I,” Revision 1, October 1977 and RegulatoryGuide 1.113, “Estimating Aquatic Dispersion of Effluents from Accidental and Routine ReactorReleases for the Purpose of Implementing Appendix I,” April 1977.
This requirement applies to the release of liquid effluents from each reactor at the site. For units withshared radwaste treatment systems, the liquid effluents from the shared system are proportioned amongthe units sharing that system.
B-5.1 TOTAL DOSE AND DOSE TO PUBLIC ONSITE
This requirement is provided to meet the dose limitations of 40 CFR Part 190 that have beenincorporated into 10 CFR 20.1301(d). The requirement specifies the preparation and submittal of aSpecial Report whenever the calculated doses due to releases of radioactivity and to radiation fromuranium fuel cycle sources exceed 25 mrems to the whole body or any organ, except the thyroid, whichshall be limited to less than or equal to 75 mrems. Even if a site was to contain up to four reactors, it ishighly unlikely that the resultant dose to a MEMBER OF THE PUBLIC will exceed the dose limits of40 CFR Part 190 if the individual reactors remain within twice the dose design objectives ofAppendix I, and if direct radiation doses from the reactor units (including outside storage tanks, etc.)are kept small. The Special Report will describe a course of action that should result in the limitation ofthe annual dose to a MEMBER OF THE PUBLIC to within the 40 CFR Part 190 limits. For thepurposes of the Special Report, it may be assumed that the dose commitment to the MEMBER OFTHE PUBLIC from other uranium fuel cycle sources is negligible, with the exception that dosecontributions from other nuclear fuel cycle facilities at the same site or within a radius of 8 km must beconsidered. If the dose to any MEMBER OF THE PUBLIC is estimated to exceed the requirements of40 CFR Part 190, submittal of the Special Report within 30 days with a request for a variance (providedthe release conditions resulting in violation of 40 CFR Part 190 have not already been corrected), inaccordance with the provisions of 40 CFR Part 190.11 and 10 CFR Part 20.2203(a)(4), is considered tobe a timely request and fulfills the requirements of 40 CFR Part 190 until NRC staff action iscompleted. The variance only relates to the limits of 40 CFR Part 190, and does not apply in any way toother requirements for dose limitation of 10 CFR Part 20, as addressed in Section 3.2 and 3.1 of theODCM. An individual is not considered a MEMBER OF THE PUBLIC during any period in whichhe/she is engaged in carrying out any operation that is part of the nuclear fuel cycle. Demonstration ofcompliance with the limits of 40 CFR Part 190 or with the design objectives of Appendix I to 10 CFRPart 50 will be considered to demonstrate compliance with the 0.1 rem limit of 10 CFR 20.1301.

91 ODCM Rev. 27
B-6.1 RADIOLOGICAL ENVIRONMENTAL MONITORING PROGRAM (REMP)
The Radiological Environmental Monitoring Program required by this requirement providesrepresentative measurements of radiation and of radioactive materials in those exposure pathways andfor those radionuclides that lead to the highest potential radiation exposures of MEMBERS OF THEPUBLIC resulting from the station operation. This monitoring program implements Section IV.B.2 ofAppendix I to 10 CFR Part 50 and thereby supplements the radiological effluent monitoring programby verifying that the measurable concentrations of radioactive materials and levels of radiation are nothigher than expected on the basis of the effluent measurements and the modeling of the environmentalexposure pathways. Guidance for this monitoring program is provided by the Radiological AssessmentBranch Technical Position on Environmental Monitoring. The initially specified monitoring programwill be effective for at least the first 3 years of commercial operation. Following this period, programchanges may be initiated based on operational experience.
The required detection capabilities for environmental sample analyses are tabulated in terms of thelower limits of detection (LLD). The LLDs required by Table 6-3 are considered optimum for routineenvironmental measurements in industrial laboratories. It should be recognized that the LLD is definedas an a priori (before the fact) limit representing the capability of a measurement system and not as ana posteriori (after the fact) limit for a particular measurement.
Detailed discussion of the LLD and other detection limits can be found in Currie, L. A., “Lower Limitof Detection: Definition and Elaboration of a Proposed Position for Radiological Effluent andEnvironmental Measurements,” NUREG/CR-4007 (September 1984), and in the HASL ProceduresManual, HASL-300 (revised annually).
B-6.2 LAND USE CENSUS
This requirement is provided to ensure that changes in the use of areas at and beyond the SITEBOUNDARY are identified and that modifications to the radiological environmental monitoringprogram are made if required by the results of this census. The best information from the door-to-doorsurvey, from aerial survey or from consulting with local agricultural authorities shall be used. Thiscensus satisfies the requirements of Section IV.B.3 of Appendix I to 10 CFR Part 50. Restricting thecensus to gardens of greater than 50 m2 provides assurance that significant exposure pathways via leafyvegetables will be identified and monitored since a garden of this size is the minimum required toproduce the quantity (26 kg/year) of leafy vegetables assumed in Regulatory Guide 1.109 forconsumption by a child. To determine this minimum garden size, the following assumptions weremade: (1) 20% of the garden was used for growing broad leaf vegetation (i.e., similar to lettuce andcabbage), and (2) a vegetation yield of 2 kg/m2.
B-6.3 INTERLABORATORY COMPARISON PROGRAM
The requirement for participation in an Interlaboratory Comparison Program is provided to ensure thatindependent checks on the precision and accuracy of the measurements of radioactive material inenvironmental sample matrices are performed as part of the quality assurance program forenvironmental monitoring in order to demonstrate that the results are valid for the purposes ofSection IV.B.2 of Appendix I to 10 CFR Part 50.
92 ODCM Rev. 27
APPENDIX C
DEFINITIONS
Note:
The following definitions were derived from the Palo Verde Nuclear Generating Station TechnicalSpecifications. These selected definitions support those portions of the Technical Specifications which weretransferred to the ODCM and have been incorporated into the Requirements sections of the ODCM.
Definitions:
The defined terms of this section appear in capitalized type and are applicable throughout the Requirementssections of this ODCM.
ACTION
ACTION shall be that part of a requirement which prescribes remedial measures required under designatedconditions.
CHANNEL CALIBRATION
See the Technical Specification definition.
CHANNEL CHECK
See the Technical Specification definition.
CHANNEL FUNCTIONAL TEST
See the Technical Specification definition.
DOSE EQUIVALENT I-131
See the Technical Specification definition.
FUNCTIONAL-FUNCTIONALITY
Functionality is an attribute of a structure, system, or component SSC(s) that is not controlled by the TechnicalSpecifications (TSs). An SSC not controlled by Tss is functional or has functionality when it is capable ofperforming its function(s) as set forth in the current licensing basis (CLB). These CLB function(s) may includethe capability to perform a necessary and related support function for an SSC(s) controlled by TSs.
FREQUENCY NOTATION
The FREQUENCY NOTATION specified for the performance of Surveillance Requirements shall correspondto the intervals defined in Table C-1.
GASEOUS RADWASTE SYSTEM
A GASEOUS RADWASTE SYSTEM shall be any system designed and installed to reduce radioactive gaseouseffluents by collecting primary coolant system offgases from the primary system and providing for delay orholdup for the purpose of reducing the total radioactivity prior to release to the environment.
MAR 2016

93 ODCM Rev. 27
APPENDIX C
DEFINITIONS (Continued)
MEMBER(S) OF THE PUBLIC
MEMBER(S) OF THE PUBLIC shall include all persons who are not occupationally associated with the plant.This category does not include employees of the licensee, its contractors, or vendors. Also excluded from thiscategory are persons who enter the site to service equipment or to make deliveries. This category does includepersons who use portions of the site for recreational, occupational, or other purposes not associated with theplant.
OPERABLE-OPERABILITY
A system, subsystem, train, component or device shall be OPERABLE or have OPERABILITY when it iscapable of performing its specified function(s), and when all necessary attendant instrumentation, controls,electrical power, cooling or seal water, lubrication or other auxiliary equipment that are required for the system,subsystem, train, component or device to perform its function(s) are also capable of performing their relatedsupport function(s).
MODE
See the Technical Specification definition.
PROCESS CONTROL PROGRAM
The PROCESS CONTROL PROGRAM shall contain the current formulas, sampling, analyses, test, anddeterminations to be made to ensure that processing and packaging of solid radioactive wastes based ondemonstrated processing of actual or simulated wet solid wastes will be accomplished in such a way as to assurecompliance with 10 CFR Parts 20, 61, and 71, State regulations, burial ground requirements, and otherrequirements governing the disposal of solid radioactive waste.
PURGE-PURGING
PURGE or PURGING shall be the controlled process of discharging air or gas from a confinement to maintaintemperature, pressure, humidity, concentration, or other operating condition, in such a manner that replacementair or gas is required to purify the confinement.
RATED THERMAL POWER
See the Technical Specification definition.
SITE BOUNDARY
The SITE BOUNDARY shall be that line beyond which the land is neither owned, nor leased, nor otherwisecontrolled by the licensee.
SOLIDIFICATION
SOLIDIFICATION shall be the conversion of radioactive wastes from liquid systems to a homogeneous(uniformly distributed), monolithic, immobilized solid with definite volume and shape, bounded by a stablesurface of distinct outline on all sides (free-standing).

94 ODCM Rev. 27
APPENDIX C
DEFINITIONS (Continued)
SOURCE CHECK
A SOURCE CHECK shall be the qualitative assessment of channel response when the channel sensor isexposed to a source of increased radioactivity.
THERMAL POWER
THERMAL POWER shall be the total reactor core heat transfer rate to the reactor coolant.
UNRESTRICTED AREA
An UNRESTRICTED AREA shall be any area at or beyond the SITE BOUNDARY access to which is notcontrolled by the licensee for the purposes of protection of individuals from exposure to radiation andradioactive materials, or any area within the SITE BOUNDARY used for residential quarters or for industrial,commercial, institutional, and/or recreational purposes.
VENTILATION EXHAUST TREATMENT SYSTEM
A VENTILATION EXHAUST TREATMENT SYSTEM shall be any system designed and installed to reducegaseous radioiodine or radioactive material in particulate form in effluents by passing ventilation or ventexhaust gases through charcoal adsorbers and/or HEPA filters for the purpose of removing iodines orparticulates from the gaseous exhaust stream prior to the release to the environment. Such a system is notconsidered to have any effect on noble gas effluents. Engineered Safety Feature (ESF) atmospheric cleanupsystems are not considered to be VENTILATION EXHAUST TREATMENT SYSTEM components.
VENTING
VENTING shall be the controlled process of discharging air or gas from a confinement to maintain temperature,pressure, humidity, concentration, or other operating condition, in such a manner that replacement air or gas isnot provided or required during VENTING. Vent, used in system names, does not imply a VENTING process.

95 ODCM Rev. 27
*The specified Frequency for each Surveillance Requirement and Sampling Requirement is met if the Surveillance Requirement or Sampling Requirement is performed within 1.25 times the interval specified in the Frequency, as measured from the previous performance or as measured from the time a specified condition of the Frequency is met.
TABLE C-1
FREQUENCY NOTATION
NOTATION FREQUENCY*
S At least once per 12 hours.
D At least once per 24 hours.
W At least once per 7 days.
4/MAt least 4 times per month at intervals no greater than 9 days and a minimum of 48 times per year.
M At least once per 31 days.
Q At least once per 92 days.
SA At least once per 184 days.
ANNUALLY At least once per 365 days
R At least once per 18 months.
P Completed prior to each release.
S/U Prior to reactor startup.
N.A. Not Applicable.
MAR 2016
MAR 2016
96 ODCM Rev. 27
APPENDIX DREFERENCES
1 Title 10, Code of Federal Regulations, Part 20, "Standards for Protection Against Radiation.”
2 Title 10, Code of Federal Regulations, Part 50, "Domestic Licensing of Production and UtilizationFacilities."
3 Title 40, Code of Federal Regulations, Part 190, Environmental Radiation Protection Standardsfor Nuclear Power Operations.”
4 Federal Register, Vol. 58, No. 245, Thursday, December 23, 1993, Notices, pages 68170-68179.
5 Regulatory Guide 1.21, “Measuring, Evaluating, and Reporting Radioactivity in Solid Wastes andReleases of Radioactive Materials in Liquid and Gaseous Effluents from Light-Water-CooledNuclear Power Plants,” Revision 1, June 1974.
6 Regulatory Guide 1.109, “Calculation of Annual Doses to Man from Routine Releases of ReactorEffluents for the Purpose of Evaluating Compliance with 10 CFR Part 50, Appendix I,”Revision 1, October 1977.
7 Regulatory Guide 1.111, “Methods for Estimating Atmospheric Transport and Dispersion ofGaseous Effluents in Routine Releases from Light-Water Cooled Reactors,” Revision 1,July 1977.
8 Regulatory Guide 4.1, “Programs for Monitoring Radioactivity in the Environs of Nuclear PowerPlants,” Revision 1, April 1975.
9 NUREG-0133, Preparation of Radiological Effluent Technical Specifications For Nuclear PowerPlants, Oct. 1978.
10 NUREG 0841, “Final Environmental Statement Related to the Operation of Palo Verde NuclearGenerating Station, Units 1, 2, and 3”, Section 5.9.1.4, February, 1982.
11 NUREG-1301, “Offsite Dose Calculation Manual Guidance: Standard Radiological EffluentControls for Pressurized Water Reactor”, Arpil 1991.
12 Environmental Report Operating License Stage, Palo Verde Nuclear Generating Station,December 1981.
13 PVNGS Updated Final Safety Analysis Report
14 Calculation 13-NC-ZY-252, “Annual Average Dose from Normal Operation Liquid Dischargefrom the Evaporation Pond”, Rev 0.
15 Calculation 13-NC-ZY-253, “Annual Average Dose from Normal Operation Airborne Direct andSky Shine from the Evaporation Pond”, Rev 0.
16 Calculation 13-NC-ZY-254, “Radiation Dose Due to an Evaporation Pond Dike Failure During aSeismic Event”, Rev. 0.

Appendix F
Correction to the 2013 and 2015 PVNGS
Annual Radiological Effluent Release Reports

Osps A subsidiary of Pinnacle West Capital Corporation
ID #: DATE:TO:Sta. # Ext. #
FROM: Sta. # Ext. #
SUBJECT:
218-0412804/14/2017File
Joshua McDowell739782-5482
Company Correspondence
McDowell,Digitally signed by McDowell, Joshua (Z08270)
DN; cn=McDowell, Joshua (Z08270)
Joshua (Z08270)Date: 2017.04.14 03:52:25 -07'00'
Correction to Annual Radioactive Effluent Release Reports for 2015 and 2013 Palo Verde Nuclear Generating Station - Units 1,2, and 3
REFERENCES: 1. PVNGS Annual Radioactive Effluent Release Report for 20152. PVNGS Annual Radioactive Effluent Release Report for 2016
Dear Sir or Madam:
In accordance with Palo Verde Nuclear Generating Station (PVNGS) Technical Specification (TS) 5.6.2, PVNGS submitted the Annual Radioactive Effluent Release Report (ARERR) for 2015 via Reference 1. It was discovered that a refueling purge permit had been revised after data was gathered for this report. This led to particulate activity not being accounted for in the annual report. The following 2015 ARERR tables were impacted and therefore revised in this submittal:
• 2 Batch Release Data• 12 Unit 2 Gaseous Effluents - Summation of All Releases• 15 Unit 2 Gaseous Effluents - Ground Level Releases - Batch - Fission Gases and Iodines• 16 Unit 2 Gaseous Effluents - Ground Level Releases - Batch - Particulates• 17 Unit 2 Gaseous Effluents - Continuous and Batch - Fission Gases and Iodines• 18 Unit 2 Gaseous Effluents - Continuous and Batch - Particulates• 30 Units 1, 2, and 3 Gaseous Effluents - Batch - Fission Gases and Iodines - Total By Quarter• 31 Units 1, 2, and 3 Gaseous Effluents - Batch - Particulates - Total By Quarter• 32 Units 1, 2, and 3 Gaseous Effluents - Continuous and Batch - Fission Gases and Iodines -
Total By Quarter• 33 Units 1, 2, and 3 Gaseous Effluents - Continuous and Batch - Particulates - Total By
Quarter• 36 Units 1, 2 and 3 Gaseous Effluents- Batch - Fission Gases and Iodine - Total By Unit• 37 Units 1, 2 and 3 Gaseous Effluents- Batch - Particulates - Total By Unit• 38 Units 1,2 and 3 Gaseous Effluents- Continuous and Batch - Fission Gases and Iodine -
Total By Unit• 39 Units 1, 2 and 3 Gaseous Effluents - Continuous and Batch - Particulates - Total By Unit• 43 Doses To Special Locations For 2014• 44 Integrated Population Dose for 2014

• 45 Summary of Individual Doses for 2014 These deviations were documented through Corrective Action program document Condition Report (CR) 17-01056. The Nuclear Regulatory Commission questioned a 2013 release of Xenon-133 as documented on the 2013 PVNGS ARERR. In response to this question, it was discovered that an overly conservative value had been applied to a release permit. This is documented through CR 17-05289. The following 2013 ARERR tables were impacted and therefore revised in this submittal:
• 20 Unit 3 Gaseous Effluents - Summation Of All Releases • 25 Unit 3 Gaseous Effluents - Continuous and Batch - Fission Gases and Iodines • 27 Unit 3 Radiation Doses At And Beyond The Site Boundary • 30 Units 1, 2, and 3 Gaseous Effluents - Batch - Fission Gases and Iodines - Total By Quarter • 32 Units 1, 2, and 3 Gaseous Effluents - Continuous and Batch - Fission Gases and Iodines -
Total By Quarter • 36 Units 1, 2 and 3 Gaseous Effluents- Batch - Fission Gases and Iodine - Total By Unit • 38 Units 1, 2 and 3 Gaseous Effluents- Continuous and Batch - Fission Gases and Iodine -
Total By Unit

Table 20:
Unit 3 Gaseous Effluents - Summation Of All Releases
Unit
Quarter 1
Quarter 2
Quarter 3
Quarter 4
Total For Year
Est. Total Error % (1)
A. Fission & activation gases
1. Total release Ci 5.83E-02 6.98E-02 2.05E-01 2.46E+01 2.49E+01 3.54E+01
2. Average release rate for period μCi/sec 7.42E-03 8.88E-03 2.58E-02 3.09E+00 7.87E-01
3. Percent of ODCM Requirement limit % NA (2) NA (2) NA (2) NA (2) NA (2)
B. Iodine 131
1. Total Iodine 131 Ci 0.00E+00 0.00E+00 0.00E+00 6.58E-06 6.58E-06 3.32E+01
2. Average release rate for period μCi/sec 0.00E+00 0.00E+00 0.00E+00 8.28E-07 2.08E-07
3. Percent of ODCM Requirement limit % NA (2) NA (2) NA (2) NA (2) NA (2)
C. Particulates
1. Particulates with half- lives > 8 days Ci 1.51E-06 1.27E-06 2.72E-06 3.50E-04 3.56E-04 3.43E+01
2. Average release rate for period μCi/sec 1.92E-07 1.61E-07 3.42E-07 4.40E-05 1.12E-05
3. Percent of ODCM Requirement limit % NA (2) NA (2) NA (2) NA (2) NA (2)
4. Gross Alpha radioactivity Ci < LLD < LLD < LLD < LLD < LLD
D. Tritium
1. Total release Ci 7.03E+01 1.35E+02 5.17E+02 2.13E+02 9.36E+02 3.85E+01
2. Average release rate for period μCi/sec 8.94E+00 1.72E+01 6.50E+01 2.68E+01 2.96E+01
3. Percent of ODCM Requirement limit % NA (2) NA (2) NA (2) NA (2) NA (2)
(1) Estimated total error methodology is presented in Table 40.
(2) See Table 27 for percent of ODCM Requirement limits.
35P
VN
GS
AR
ER
R2014

40 PVNGS ARERR 2014
Table 25: Unit 3
Gaseous Effluents - Continuous and Batch - Fission Gases and Iodines
Nuclides Released Unit Quarter 1 Quarter 2 Quarter 3 Quarter 4 Year total
1. Fission gases
Ar-41 Ci 5.21E-02 6.17E-02 1.84E-01 4.93E-01 7.90E-01 Kr-83m Ci 0.00E+00 0.00E+00 0.00E+00 0.00E+00 0.00E+00 Kr-85 Ci 0.00E+00 0.00E+00 0.00E+00 0.00E+00 0.00E+00 Kr-85m Ci 0.00E+00 0.00E+00 3.95E-08 0.00E+00 3.95E-08 Kr-87 Ci 0.00E+00 0.00E+00 0.00E+00 0.00E+00 0.00E+00 Kr-88 Ci 0.00E+00 0.00E+00 0.00E+00 0.00E+00 0.00E+00 Kr-89 Ci 0.00E+00 0.00E+00 0.00E+00 0.00E+00 0.00E+00 Kr-90 Ci 0.00E+00 0.00E+00 0.00E+00 0.00E+00 0.00E+00 Xe-131m Ci 0.00E+00 0.00E+00 0.00E+00 0.00E+00 0.00E+00 Xe-133 Ci 6.25E-03 8.00E-03 2.15E-02 1.06E+00 1.10E+00 Xe-133m Ci 0.00E+00 0.00E+00 3.41E-07 8.13E+00 8.13E+00 Xe-135 Ci 0.00E+00 5.03E-05 1.67E-06 1.49E+01 1.49E+01 Xe-135m Ci 0.00E+00 0.00E+00 0.00E+00 0.00E+00 0.00E+00 Xe-137 Ci 0.00E+00 0.00E+00 0.00E+00 0.00E+00 0.00E+00 Xe-138 Ci 0.00E+00 0.00E+00 0.00E+00 0.00E+00 0.00E+00 Total Ci 5.83E-02 6.98E-02 2.05E-01 2.46E+01 2.49E+01
2. Iodines I-131 Ci 0.00E+00 0.00E+00 0.00E+00 6.58E-06 6.58E-06 I-132 Ci 0.00E+00 0.00E+00 0.00E+00 0.00E+00 0.00E+00 I-133 Ci 0.00E+00 0.00E+00 0.00E+00 0.00E+00 0.00E+00 I-134 Ci 0.00E+00 0.00E+00 0.00E+00 0.00E+00 0.00E+00 I-135 Ci 0.00E+00 0.00E+00 0.00E+00 0.00E+00 0.00E+00 Total Ci 0.00E+00 0.00E+00 0.00E+00 6.58E-06 6.58E-06

3 PVNGS ARERR 2014
Table 27: Unit 3
Radiation Doses At And Beyond The Site Boundary
Unit Quarter 1 Quarter 2 Quarter 3 Quarter 4 Year total
Gamma Air Dose mrad 1.37E-04 1.63E-04 4.84E-04 1.02E-02 1.10E-02 ODCM Req 4.1 Limit mrad 5.00E+00 5.00E+00 5.00E+00 5.00E+00 1.00E+01
% ODCM Limit % 2.74E-03 3.26E-03 9.68E-03 2.04E-01 1.10E-01
Beta Air Dose mrad 5.01E-05 5.96E-05 1.76E-04 1.45E-02 1.48E-02
ODCM Req 4.1 Limit mrad 1.00E+01 1.00E+01 1.00E+01 1.00E+01 2.00E+01
% ODCM Limit % 5.01E-04 5.96E-04 1.76E-03 1.45E-01 7.40E-02
Maximum Organ Dose (excluding skin)
mrem 2.52E-02 4.86E-02 1.85E-01 7.67E-02 3.36E-01
Age Teen Teen Teen Teen Teen
Organ Thyroid 4.86E-02 Thyroid Lung 3.36E-01
ODCM Req. 4.2 Limit mrem 7.50E+00 7.50E+00 7.50E+00 7.50E+00 1.50E+01
% ODCM Limit % 3.36E-01 6.48E-01 2.47E+00 1.02E+00 2.24E+00
Calculations are based on parameters and methodologies of the ODCM using historical meteorology. Dose is calculated to a hypothetical individual. In contrast, Appendix C dose calculations are based on concurrent meteorology, a real individual, and only the actual pathways present.
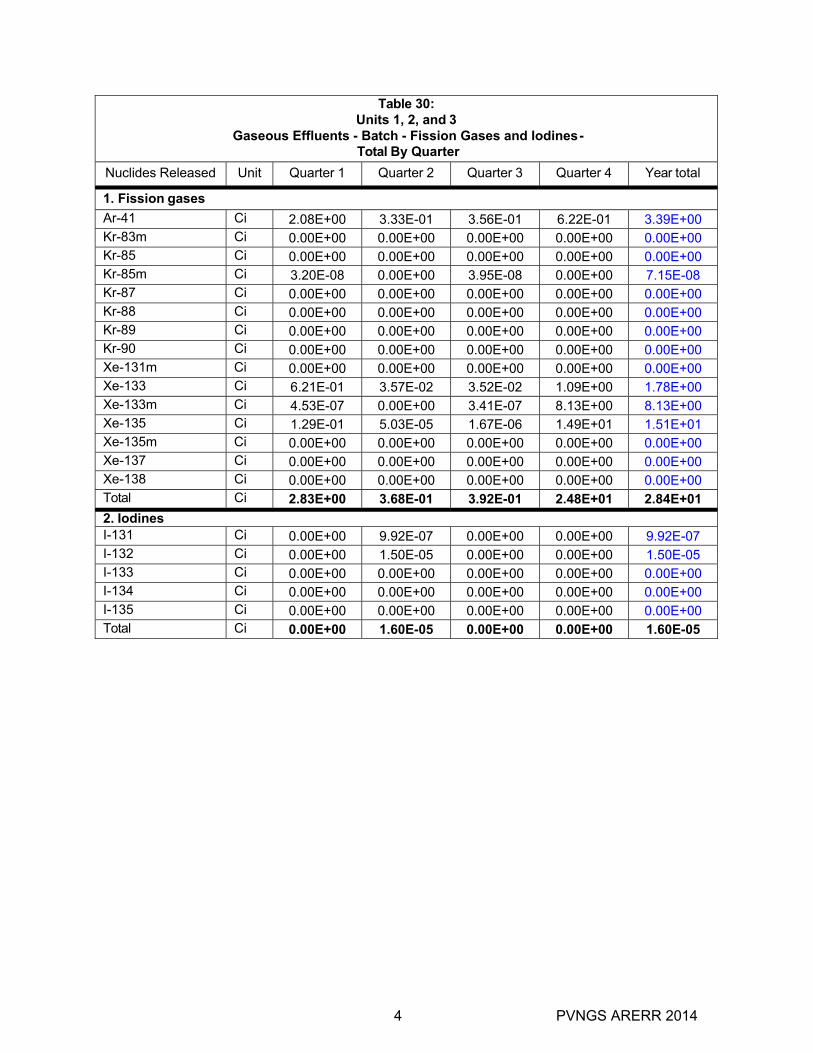
4 PVNGS ARERR 2014
Table 30: Units 1, 2, and 3
Gaseous Effluents - Batch - Fission Gases and Iodines - Total By Quarter
Nuclides Released Unit Quarter 1 Quarter 2 Quarter 3 Quarter 4 Year total
1. Fission gases
Ar-41 Ci 2.08E+00 3.33E-01 3.56E-01 6.22E-01 3.39E+00 Kr-83m Ci 0.00E+00 0.00E+00 0.00E+00 0.00E+00 0.00E+00 Kr-85 Ci 0.00E+00 0.00E+00 0.00E+00 0.00E+00 0.00E+00 Kr-85m Ci 3.20E-08 0.00E+00 3.95E-08 0.00E+00 7.15E-08 Kr-87 Ci 0.00E+00 0.00E+00 0.00E+00 0.00E+00 0.00E+00 Kr-88 Ci 0.00E+00 0.00E+00 0.00E+00 0.00E+00 0.00E+00 Kr-89 Ci 0.00E+00 0.00E+00 0.00E+00 0.00E+00 0.00E+00 Kr-90 Ci 0.00E+00 0.00E+00 0.00E+00 0.00E+00 0.00E+00 Xe-131m Ci 0.00E+00 0.00E+00 0.00E+00 0.00E+00 0.00E+00 Xe-133 Ci 6.21E-01 3.57E-02 3.52E-02 1.09E+00 1.78E+00 Xe-133m Ci 4.53E-07 0.00E+00 3.41E-07 8.13E+00 8.13E+00 Xe-135 Ci 1.29E-01 5.03E-05 1.67E-06 1.49E+01 1.51E+01 Xe-135m Ci 0.00E+00 0.00E+00 0.00E+00 0.00E+00 0.00E+00 Xe-137 Ci 0.00E+00 0.00E+00 0.00E+00 0.00E+00 0.00E+00 Xe-138 Ci 0.00E+00 0.00E+00 0.00E+00 0.00E+00 0.00E+00 Total Ci 2.83E+00 3.68E-01 3.92E-01 2.48E+01 2.84E+01
2. Iodines I-131 Ci 0.00E+00 9.92E-07 0.00E+00 0.00E+00 9.92E-07 I-132 Ci 0.00E+00 1.50E-05 0.00E+00 0.00E+00 1.50E-05 I-133 Ci 0.00E+00 0.00E+00 0.00E+00 0.00E+00 0.00E+00 I-134 Ci 0.00E+00 0.00E+00 0.00E+00 0.00E+00 0.00E+00 I-135 Ci 0.00E+00 0.00E+00 0.00E+00 0.00E+00 0.00E+00 Total Ci 0.00E+00 1.60E-05 0.00E+00 0.00E+00 1.60E-05

5 PVNGS ARERR 2014
Table 32: Units 1, 2, and 3
Gaseous Effluents - Continuous and Batch - Fission Gases and Iodines - Total By Quarter
Nuclides Released Unit Quarter 1 Quarter 2 Quarter 3 Quarter 4 Year total
1. Fission gases
Ar-41 Ci 2.08E+00 3.33E-01 3.56E-01 6.22E-01 3.39E+00 Kr-83m Ci 0.00E+00 0.00E+00 0.00E+00 0.00E+00 0.00E+00 Kr-85 Ci 0.00E+00 0.00E+00 0.00E+00 0.00E+00 0.00E+00 Kr-85m Ci 3.20E-08 0.00E+00 3.95E-08 0.00E+00 7.15E-08 Kr-87 Ci 0.00E+00 0.00E+00 0.00E+00 0.00E+00 0.00E+00 Kr-88 Ci 0.00E+00 0.00E+00 0.00E+00 0.00E+00 0.00E+00 Kr-89 Ci 0.00E+00 0.00E+00 0.00E+00 0.00E+00 0.00E+00 Kr-90 Ci 0.00E+00 0.00E+00 0.00E+00 0.00E+00 0.00E+00 Xe-131m Ci 0.00E+00 0.00E+00 0.00E+00 0.00E+00 0.00E+00 Xe-133 Ci 6.21E-01 3.57E-02 3.52E-02 1.09E+00 1.78E+00 Xe-133m Ci 4.53E-07 0.00E+00 3.41E-07 8.13E+00 8.13E+00 Xe-135 Ci 1.29E-01 5.03E-05 1.67E-06 1.49E+01 1.51E+01 Xe-135m Ci 0.00E+00 0.00E+00 0.00E+00 0.00E+00 0.00E+00 Xe-137 Ci 0.00E+00 0.00E+00 0.00E+00 0.00E+00 0.00E+00 Xe-138 Ci 0.00E+00 0.00E+00 0.00E+00 0.00E+00 0.00E+00 Total Ci 2.83E+00 3.68E-01 3.92E-01 2.48E+01 2.84E+01
2. Iodines I-131 Ci 5.35E-06 5.61E-05 0.00E+00 6.58E-06 6.80E-05 I-132 Ci 1.39E-04 4.29E-04 0.00E+00 0.00E+00 5.68E-04 I-133 Ci 6.29E-06 0.00E+00 0.00E+00 0.00E+00 6.29E-06 I-134 Ci 0.00E+00 0.00E+00 0.00E+00 0.00E+00 0.00E+00 I-135 Ci 0.00E+00 0.00E+00 0.00E+00 0.00E+00 0.00E+00 Total Ci 1.51E-04 4.85E-04 0.00E+00 6.58E-06 6.42E-04

51 PVNGS ARERR 2014
Table 36: Units 1, 2 and 3
Gaseous Effluents- Batch - Fission Gases and Iodine - Total By Unit
Nuclides Released Unit Unit 1 Unit 2 Unit 3 Total Units 1, 2 and 3
1. Fission gases
Ar-41 Ci 2.07E+00 5.31E-01 7.90E-01 3.39E+00 Kr-83m Ci 0.00E+00 0.00E+00 0.00E+00 0.00E+00 Kr-85 Ci 0.00E+00 0.00E+00 0.00E+00 0.00E+00 Kr-85m Ci 3.20E-08 0.00E+00 3.95E-08 7.15E-08 Kr-87 Ci 0.00E+00 0.00E+00 0.00E+00 0.00E+00 Kr-88 Ci 0.00E+00 0.00E+00 0.00E+00 0.00E+00 Kr-89 Ci 0.00E+00 0.00E+00 0.00E+00 0.00E+00 Kr-90 Ci 0.00E+00 0.00E+00 0.00E+00 0.00E+00 Xe-131m Ci 0.00E+00 0.00E+00 0.00E+00 0.00E+00 Xe-133 Ci 6.09E-01 7.37E-02 1.10E+00 1.78E+00 Xe-133m Ci 4.53E-07 0.00E+00 8.13E+00 8.13E+00 Xe-135 Ci 1.29E-01 0.00E+00 1.49E+01 1.51E+01 Xe-135m Ci 0.00E+00 0.00E+00 0.00E+00 0.00E+00 Xe-137 Ci 0.00E+00 0.00E+00 0.00E+00 0.00E+00 Xe-138 0.00E+00 0.00E+00 0.00E+00 0.00E+00 Total Ci 2.80E+00 6.05E-01 2.49E+01 2.84E+01
2. Iodines I-131 Ci 9.92E-07 0.00E+00 0.00E+00 9.92E-07 I-132 Ci 1.50E-05 0.00E+00 0.00E+00 1.50E-05 I-133 Ci 0.00E+00 0.00E+00 0.00E+00 0.00E+00 I-134 Ci 0.00E+00 0.00E+00 0.00E+00 0.00E+00 I-135 Ci 0.00E+00 0.00E+00 0.00E+00 0.00E+00 Total Ci 1.60E-05 0.00E+00 0.00E+00 1.60E-05

PVNGS ARERR 201452
Table 38: Units 1, 2 and 3
Gaseous Effluents- Continuous and Batch - Fission Gases and Iodine - Total By Unit
Nuclides Released Unit Unit 1 Unit 2 Unit 3 Total Units 1, 2 and 3
1. Fission gases
Ar-41 Ci 2.07E+00 5.31E-01 7.90E-01 3.39E+00 Kr-83m Ci 0.00E+00 0.00E+00 0.00E+00 0.00E+00 Kr-85 Ci 0.00E+00 0.00E+00 0.00E+00 0.00E+00 Kr-85m Ci 3.20E-08 0.00E+00 3.95E-08 7.15E-08 Kr-87 Ci 0.00E+00 0.00E+00 0.00E+00 0.00E+00 Kr-88 Ci 0.00E+00 0.00E+00 0.00E+00 0.00E+00 Kr-89 Ci 0.00E+00 0.00E+00 0.00E+00 0.00E+00 Kr-90 Ci 0.00E+00 0.00E+00 0.00E+00 0.00E+00 Xe-131m Ci 0.00E+00 0.00E+00 0.00E+00 0.00E+00 Xe-133 Ci 6.09E-01 7.37E-02 1.10E+00 1.78E+00 Xe-133m Ci 4.53E-07 0.00E+00 8.13E+00 8.13E+00 Xe-135 Ci 1.29E-01 0.00E+00 1.49E+01 1.51E+01 Xe-135m Ci 0.00E+00 0.00E+00 0.00E+00 0.00E+00 Xe-137 Ci 0.00E+00 0.00E+00 0.00E+00 0.00E+00 Xe-138 Ci 0.00E+00 0.00E+00 0.00E+00 0.00E+00 Total Ci 2.80E+00 6.05E-01 2.49E+01 2.84E+01
2. Iodines I-131 Ci 6.14E-05 0.00E+00 6.58E-06 6.80E-05 I-132 Ci 5.68E-04 0.00E+00 0.00E+00 5.68E-04 I-133 Ci 6.29E-06 0.00E+00 0.00E+00 6.29E-06 I-134 Ci 0.00E+00 0.00E+00 0.00E+00 0.00E+00 I-135 Ci 0.00E+00 0.00E+00 0.00E+00 0.00E+00 Total Ci 6.36E-04 0.00E+00 6.58E-06 6.42E-04

Table 1: Evaporation Pond Data
Evaporation Pond 1(1A, 1B, 1C) Quarter 1 Quarter 2 Quarter 3 Quarter 4 YearHistorical volume of water evaporated (ml)
3.22E+11 8.85E+11 8.85E+11 3.22E+11
Tritium Concentration (uCi/cc) 4.85E-06 3.34E-06 3.65E-06 2.98E-06 Tritium Curies 1.83E-01 1.16E+00 1.21E+00 3.52E-01 2.91E+00 Evaporation Pond 2 (2A and 2B) Quarter 1 Quarter 2 Quarter 3 Quarter 4 Year
Historical volume of water evaporated (ml)
2.40E+11 7.97E+11 7.97E+11 2.90E+11
Tritium Concentration (uCi/cc) 1.45E-06 1.46E-06 1.75E-06 1.12E-06 Tritium curies 1.80E-01 4.91E-01 6.04E-01 1.45E-01 1.42E+00 Evaporation Pond 3 (3A and 3B) Quarter 1 Quarter 2 Quarter 3 Quarter 4 Year
Historical volume of water evaporated (ml)
2.22E+11 3.05E+11 3.05E+11 1.11E+11
3B Tritium Concentration (uCi/cc) 1.65E-06 1.08E-06 1.24E-06 8.76E-07 3B Tritium curies 1.81E-01 3.25E-01 3.73E-01 9.62E-02 9.76E-01 Dose (mRem) Quarter 1 Quarter 2 Quarter 3 Quarter 4 Year
Pond 1 7.61E-03 1.43E-02 1.50E-02 4.16E-03 4.12E-02Pond 2 2.50E-03 6.81E-03 8.38E-03 2.01E-03 1.97E-02 Pond 3 2.51E-03 4.51E-03 5.18E-03 1.33E-03 1.35E-02 Total 6.71E-03 2.57E-02 2.86E-02 7.51E-03 7.44E-02
Table 2: Batch Release DataAll times are in hours Unit 1 Unit 2 Unit 3
January - June Number of batch releases 20 24 43 Total time period for batch releases 114.54 366.34 1275.06 Maximum time period for a batch release 92.00 105.90 168.00 Average time period for a batch release 5.73 15.26 29.65 Minimum time period for a batch release 0.53 0.51 0.10 July - December Number of batch releases 21 42 19 Total time period for batch releases 161.18 1501.48 198.17 Maximum time period for a batch release 103.80 168.00 123.75 Average time period for a batch release 7.68 35.75 10.43 Minimum time period for a batch release 0.52 0.18 0.50 January - December Number of batch releases 41 66 62 Total time period for batch releases 275.72 1867.82 1473.23 Maximum time period for a batch release 103.80 168.00 168.00 Average time period for a batch release 6.72 28.30 23.76 Minimum time period for a batch release 0.52 0.18 0.10
Deleted
Deleted
Deleted
Deleted
Deleted
Deleted
Deleted
Deleted
Deleted
Deleted
Deleted
Deleted
Deleted
Deleted
Deleted
Deleted
Deleted
Deleted
Deleted
Deleted
Deleted
Deleted
Deleted
Deleted
Deleted
Deleted
Deleted
Deleted
Deleted
Deleted
Deleted
Deleted
Deleted
Deleted
Deleted
Deleted
Deleted
Deleted
Deleted
Deleted
Deleted
Deleted
Deleted
Deleted
Deleted
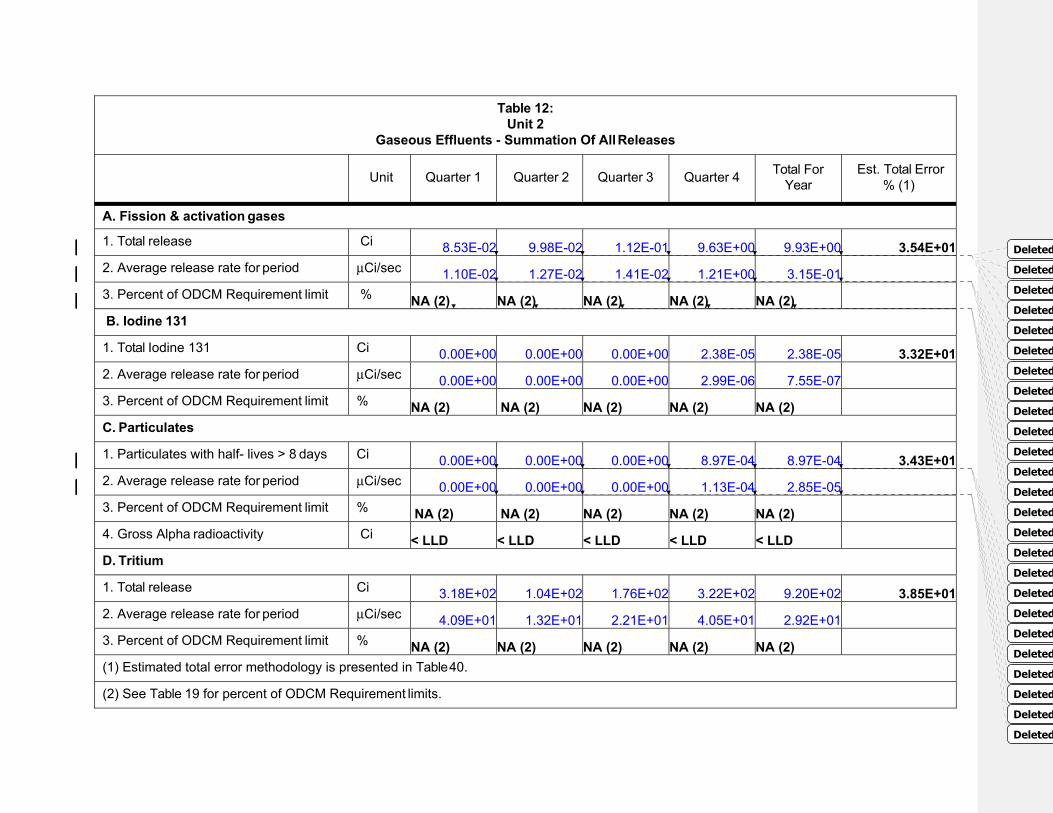
Table 12:
Unit 2 Gaseous Effluents - Summation Of All Releases
Unit
Quarter 1
Quarter 2
Quarter 3
Quarter 4
Total For Year
Est. Total Error % (1)
A. Fission & activation gases
1. Total release Ci 8.53E-02 9.98E-02 1.12E-01 9.63E+00 9.93E+00 3.54E+01
2. Average release rate for period μCi/sec 1.10E-02 1.27E-02 1.41E-02 1.21E+00 3.15E-01
3. Percent of ODCM Requirement limit % NA (2) NA (2) NA (2) NA (2) NA (2)
B. Iodine 131
1. Total Iodine 131 Ci 0.00E+00 0.00E+00 0.00E+00 2.38E-05 2.38E-05 3.32E+01
2. Average release rate for period μCi/sec 0.00E+00 0.00E+00 0.00E+00 2.99E-06 7.55E-07
3. Percent of ODCM Requirement limit % NA (2) NA (2) NA (2) NA (2) NA (2)
C. Particulates
1. Particulates with half- lives > 8 days Ci 0.00E+00 0.00E+00 0.00E+00 8.97E-04 8.97E-04 3.43E+01
2. Average release rate for period μCi/sec 0.00E+00 0.00E+00 0.00E+00 1.13E-04 2.85E-05
3. Percent of ODCM Requirement limit % NA (2) NA (2) NA (2) NA (2) NA (2)
4. Gross Alpha radioactivity Ci < LLD < LLD < LLD < LLD < LLD
D. Tritium
1. Total release Ci 3.18E+02 1.04E+02 1.76E+02 3.22E+02 9.20E+02 3.85E+01
2. Average release rate for period μCi/sec 4.09E+01 1.32E+01 2.21E+01 4.05E+01 2.92E+01
3. Percent of ODCM Requirement limit % NA (2) NA (2) NA (2) NA (2) NA (2)
(1) Estimated total error methodology is presented in Table 40.
(2) See Table 19 for percent of ODCM Requirement limits.
Deleted
Deleted
Deleted
Deleted
Deleted
Deleted
Deleted
Deleted
Deleted
Deleted
Deleted
Deleted
Deleted
Deleted
Deleted
Deleted
Deleted
Deleted
Deleted
Deleted
Deleted
Deleted
Deleted
Deleted
Deleted

30 PVNGS ARERR 2014
Table 15: Unit 2
Gaseous Effluents - Ground Level Releases - Batch - Fission Gases and Iodines
Nuclides Released Unit Quarter 1 Quarter 2 Quarter 3 Quarter 4 Year total
1. Fission gases
Ar-41 Ci 7.29E-02 8.42E-02 9.39E-02 7.60E+00 7.86E+00Kr-83m Ci 0.00E+00 0.00E+00 0.00E+00 0.00E+00 0.00E+00Kr-85 Ci 0.00E+00 0.00E+00 0.00E+00 0.00E+00 0.00E+00Kr-85m Ci 0.00E+00 0.00E+00 0.00E+00 0.00E+00 0.00E+00Kr-87 Ci 0.00E+00 0.00E+00 0.00E+00 0.00E+00 0.00E+00Kr-88 Ci 0.00E+00 0.00E+00 0.00E+00 0.00E+00 0.00E+00Kr-89 Ci 0.00E+00 0.00E+00 0.00E+00 0.00E+00 0.00E+00Kr-90 Ci 0.00E+00 0.00E+00 0.00E+00 0.00E+00 0.00E+00Xe-131m Ci 0.00E+00 0.00E+00 0.00E+00 9.77E-04 9.77E-04Xe-133 Ci 1.24E-02 1.56E-02 1.79E-02 1.73E+00 1.77E+00Xe-133m Ci 0.00E+00 0.00E+00 0.00E+00 1.38E-03 1.38E-03Xe-135 Ci 0.00E+00 0.00E+00 9.12E-05 0.00E+00 9.12E-05Xe-135m Ci 0.00E+00 0.00E+00 0.00E+00 0.00E+00 0.00E+00Xe-137 Ci 0.00E+00 0.00E+00 0.00E+00 0.00E+00 0.00E+00Xe-138 Ci 0.00E+00 0.00E+00 0.00E+00 0.00E+00 0.00E+00Total Ci 8.53E-02 9.98E-02 1.12E-01 9.34E+00 9.63E+002. Iodines I-131 Ci 0.00E+00 0.00E+00 0.00E+00 0.00E+00 0.00E+00I-132 Ci 0.00E+00 0.00E+00 0.00E+00 7.30E-05 7.30E-05I-133 Ci 0.00E+00 0.00E+00 0.00E+00 0.00E+00 0.00E+00I-134 Ci 0.00E+00 0.00E+00 0.00E+00 0.00E+00 0.00E+00I-135 Ci 0.00E+00 0.00E+00 0.00E+00 0.00E+00 0.00E+00Total Ci 0.00E+00 0.00E+00 0.00E+00 0.00E+00 0.00E+00
Deleted
Deleted
Deleted
Deleted
Deleted
Deleted
Deleted
Deleted
Deleted
Deleted
Deleted
Deleted
Deleted
Deleted
Deleted
Deleted
Deleted
Deleted
Deleted
Deleted
Deleted
Deleted
Deleted
Deleted
Deleted
Deleted
Deleted
Deleted
Deleted
Deleted