panel 2: the pathways to net zero by 2045/2050
TRANSCRIPT

Panel 2: The Pathways to Net Zero by 2045/2050
Panelists will discuss Virginia’s pathways to net zero with an ever-evolving portfolio of generation assets and the impact on grid resilience in light of current events.
Moderator: Andrew M. Vehorn
Vice President of Government Affairs The Virginia, Maryland & Delaware Association of Electric Cooperatives
Panelists: Jesse D. Jenkins, PhD
Assistant Professor Department of Mechanical and Aerospace Engineering and the Andlinger Center for Energy and Environment, Princeton University
Darlene Phillips Executive Director, Operations Engineering Support PJM Interconnection, LLC
Outline
1. Introduction – overview Net Zero and definition, discussing key provisions, policy goals, and requirements of Virginia’s Investor Owned Utilities.
2. Net Zero Transition – the panelists will contextualize Net Zero goals in Virginia, where we stand now with current generation portfolio mix and how we can transition to Net Zero
3. Pathways - the panelists will discuss opportunities and challenges of reaching Net Zero. Topics will include the role of PJM to monitor climate change, severe weather events, and resiliency. Additionally, panelists will speak on how utilities, regulators and corporations are progressing toward Net Zero goals and its potential pathways, infrastructure, and impacts.
4. Net Zero Implementation and Status - Panelists will discuss integration of clean energy, renewables, natural gas, and nuclear power and its impact on energy pricing and capacity availability.
5. Audience Q&A
Speaker Biographies Andrew M. Vehorn Vice President of Government Affairs The Virginia, Maryland, and Delaware Association of Electric Cooperatives Andrews is responsible for coordinating public policy initiatives and public affairs activities at the state and federal level for electric cooperatives in Virginia, Maryland, and Delaware. Prior to joining the co-ops, Andrew spent 10 years representing energy, insurance, and financial services clients before the Virginia General Assembly. Andrew resides in the West End of Henrico County with his wife, Cristen, and two daughters.
* * * Jesse D. Jenkins Assistant Professor Department of Mechanical and Aerospace Engineering and the Andlinger Center for Energy and Environment Princeton University Jesse D. Jenkins is an assistant professor at Princeton University with a joint appointment in the Department of Mechanical and Aerospace Engineering and the Andlinger Center for Energy and Environment and courtesy appointments at the School of Public and International Affairs and the High Meadows Environmental Institute. He is a macro-scale energy systems engineer with a focus on the rapidly evolving electricity sector, including the transition to zero-carbon resources, the proliferation of distributed energy resources, and the role of electricity in economy-wide decarbonization. Jesse leads the Princeton ZERO Lab (Zero-carbon Energy systems Research and Optimization Laboratory), which focuses on improving and applying optimization-based energy systems models to evaluate low-carbon energy technologies and generate insights to guide policy and planning decisions in national and sub-national jurisdictions transitioning to net-zero emissions energy systems. Jesse earned a PhD and SM from MIT, worked previously as a postdoctoral fellow at the Harvard Kennedy School, and spent six years as an energy and climate policy analyst prior to embarking on his academic career.

News and insights from PJM
at insidelines.pjm.com (610) 666-8980 | www.pjm.com
PJM Interconnection, founded in 1927, ensures the reliability of the high-voltage electric power system serving 65 million people in all or parts of Delaware,
Illinois, Indiana, Kentucky, Maryland, Michigan, New Jersey, North Carolina, Ohio, Pennsylvania, Tennessee, Virginia, West Virginia and the District of
Columbia. PJM coordinates and directs the operation of the region’s transmission grid, which includes over 84,236 miles of transmission lines; administers
a competitive wholesale electricity market; and plans regional transmission expansion improvements to maintain grid reliability and relieve congestion.
PJM’s regional grid and market operations produce annual savings of $2.8 billion to $3.1 billion.
Darlene J. Phillips Executive Director – Operations Engineering Support
Darlene J. Phillips, Senior Director – Operations
Engineering Support leads the model management,
EMS technology, transmission services, and real-time
data management efforts supporting control room
operations.
Ms. Phillips previously served as senior director,
Strategic Policy & External Affairs, leading State
Government Policy regulatory and legislative efforts
and driving strategic communication efforts on key
industry matters.
Prior to joining PJM, Ms. Phillips was a member of the senior
leadership team in the Midcontinent Independent System
Operator, Inc. External Affairs division focusing on supporting
engagement efforts with the regions’ regulatory and stakeholder
community. Leading the Issues Management, Corporate
Communications and External Training Departments, Ms.
Phillips was responsible for synthesizing MISO’s complex
business functions and strategies for decision makers, driving
media and other outreach strategies and leading external
education efforts. During her 11 year MISO career, Ms. Phillips
also held leadership roles in the Market Operations, Information
Technology and Business Services divisions.
Prior to joining MISO, Ms. Phillips spent time as a member of
the management teams for both Arthur Andersen and
BearingPoint, overseeing numerous projects in both
organizations’ National Energy Practice Groups. There she
worked on key projects for MISO start-up activities: New York
Independent System Operator, ERCOT and many energy
related projects.
Ms. Phillips began her career in the energy industry as a control
room engineer for Michigan Electric Power Coordination Center
in Ann Arbor.
Ms. Phillips is on the Department of Energy’s Electricity
Advisory Committee where she serves as the Vice-Chair of the
Smart Grid Subcommittee.
Ms. Phillips holds a Juris Doctorate from Indiana University
School of Law at Indianapolis (cum laude); a Master of
Business Administration and Bachelor of Science in electrical
engineering from the University of Michigan, Ann Arbor. Ms.
Phillips is a licensed attorney in the state of Indiana and is a
member of the Indiana State and Energy Bar Associations.

1
E. Larson, C. Greig, J. Jenkins, E. Mayfield, A. Pascale, C. Zhang, J. Drossman, R. Williams, S. Pacala, R. Socolow, EJ Baik, R. Birdsey, R. Duke, R. Jones, B. Haley, E. Leslie, K. Paustian, and A. Swan, Net-Zero America: Potential Pathways, Infrastructure, and Impacts, interim report (345 pages), Princeton University, Princeton, NJ, December 15, 2020. Report, annexes, and data downloadable at
1
38th annual National Regulatory Conference 26 May 2021
https://netzeroamerica.princeton.edu
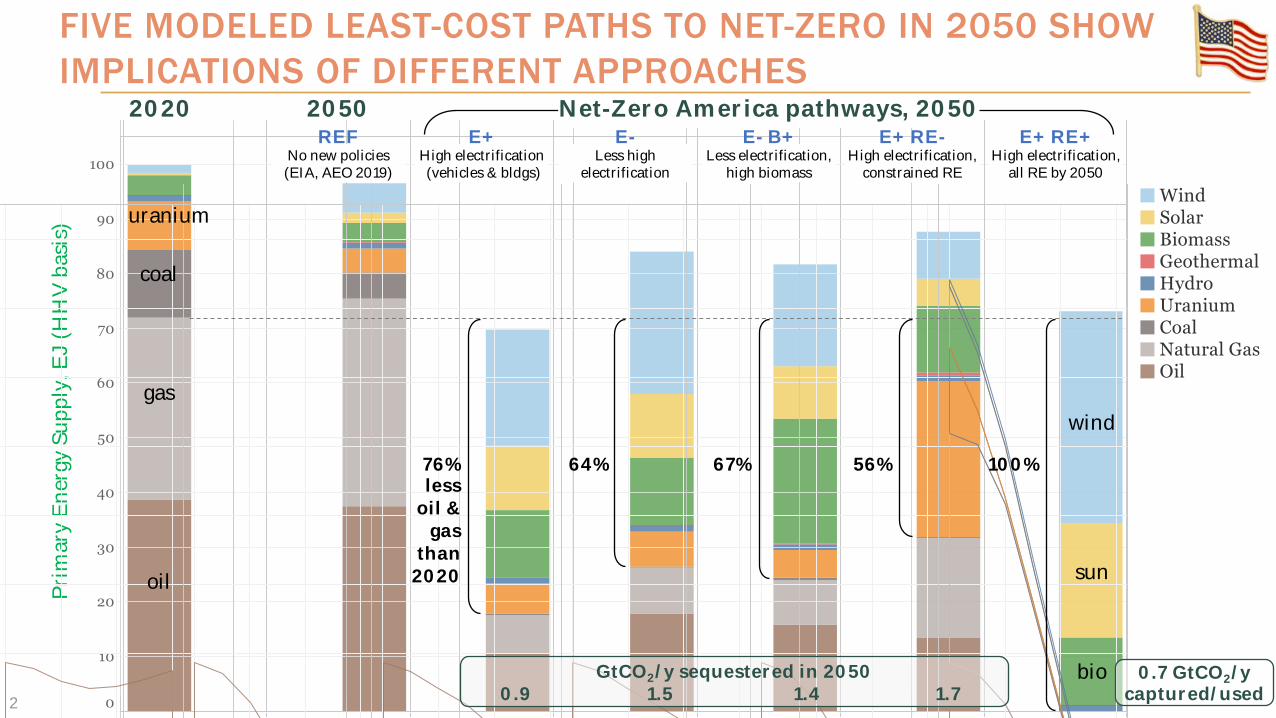
FIVE MODELED LEAST-COST PATHS TO NET-ZERO IN 2050 SHOW IMPLICATIONS OF DIFFERENT APPROACHES
2
Prim
ary
Ener
gy S
uppl
y, E
J (H
HV
basi
s)
High electrification(vehicles & bldgs)
Less high electrification
Less electrification, high biomass
High electrification, constrained RE
High electrification, all RE by 2050
No new policies(EIA, AEO 2019)
REF E+ E- E- B+ E+ RE- E+ RE+2020 2050 Net-Zero America pathways, 2050
56% 100%
coal
oil
gas
uranium
wind
sun
bio
76%less
oil & gas
than 2020
64% 67%
GtCO2/y sequestered in 2050 0.7 GtCO2/y captured/used0.9 1.5 1.4 1.7

3
End-use energy efficiency and electrification1
Enhanced land sinks6
Reduced non-CO2 emissions5
CO2 capture, utilization, and storage4
Bioenergy and other zero-carbon fuels and feedstocks3
Clean electricity: wind & solar generation, transmission, firm power 2
ALL PATHS EMPLOY SIX KEY PILLARS OF DECARBONIZATION
Energy/Industrial System

Ene
rgy
Syst
em C
ost (
% o
f GD
P)
Energy System Cost(% of GDP)
4
Global financial crisis
Oil price shocks
E-
E+ RE-
E+ RE+
E+
REF
E- B+
REF
E- B+E-
E+ RE-E+
E+ RE+
Notes
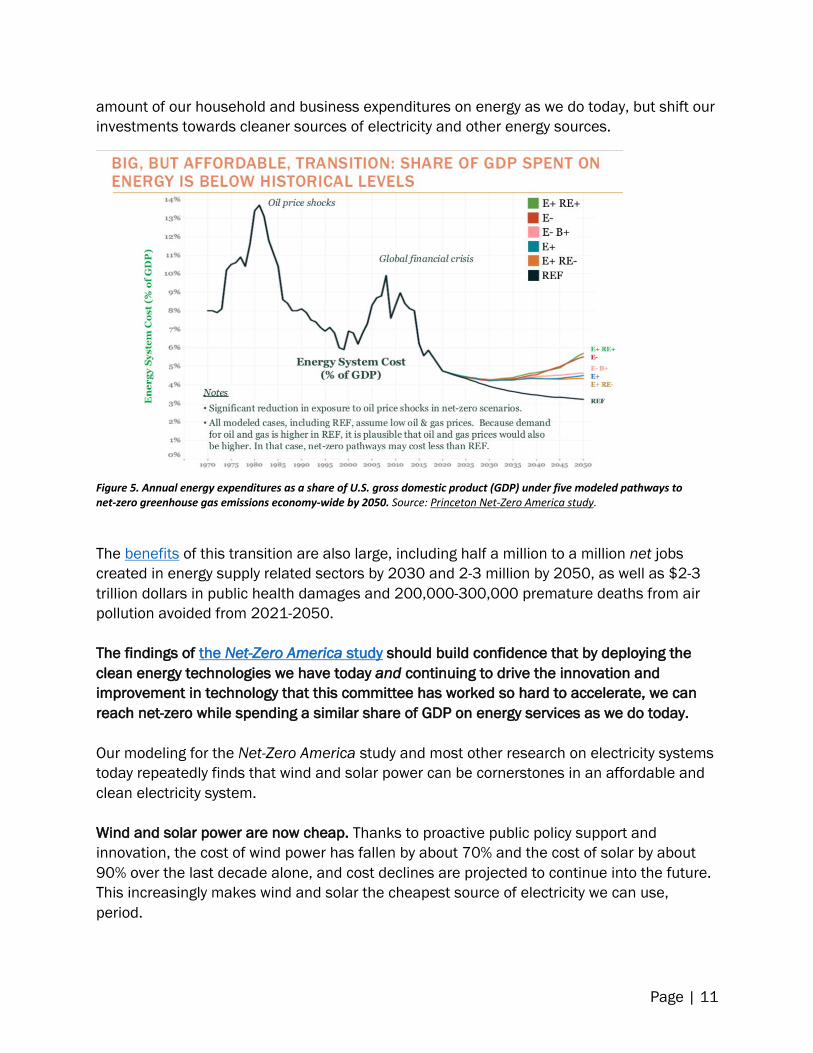
• Significant reduction in exposure to oil price shocks in net-zero scenarios.• All modeled cases, including REF, assume low oil & gas prices. Because demand
for oil and gas is higher in REF, it is plausible that oil and gas prices would also be higher. In that case, net-zero pathways may cost less than REF.
BIG, BUT AFFORDABLE, TRANSITION: SHARE OF GDP SPENT ON ENERGY IS BELOW HISTORICAL LEVELS

5
Capital mobilization1
Air pollution and public health4
Physical infrastructure3
Energy workforce2
AFFORDABLE, BUT TRANSFORMATIONAL
Four Transformation Changes on the Path to Net-Zero

ENERGY SYSTEM REQUIRES MUCH MORE CAPITAL INVESTMENT: 2.5 T$ OF ADDITIONAL CAPITAL DURING THE 2020’s
6
Total additional capital invested, 2021-2030, by sector and subsector for any of the net-zero pathways vs. REF (billion 2018$)
Includes capital invested pre-financial investment decision (pre-FID) and capital committed to projects under construction in 2030 but in-service in later years. All values rounded to nearest $10b and should be considered order of magnitude estimates. Incremental capital investment categories totaling less than $5B excluded from graphic. Other potentially significant capital expenditures not estimated in this study include establishment of bioenergy crops, decarbonization measures in other industries besides steel and cement, non-CO2 GHG mitigation efforts, and establishing enhanced land sinks.
7
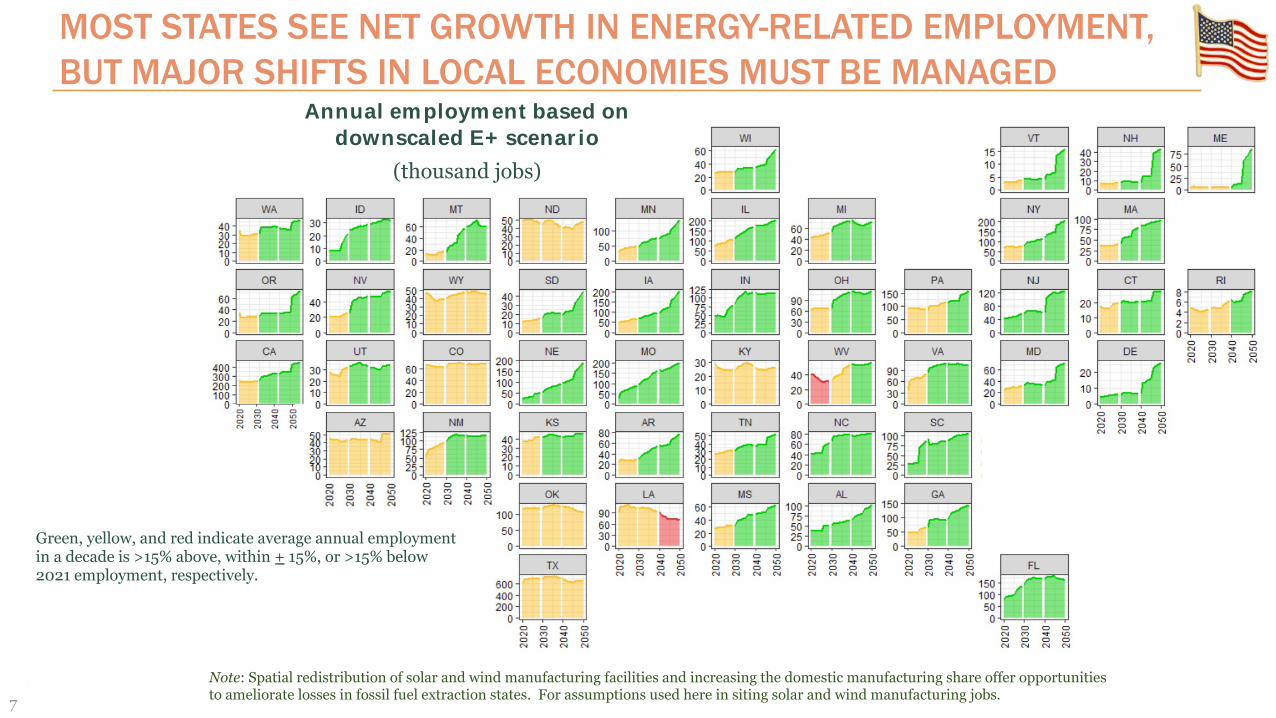
Annual employment based on downscaled E+ scenario
(thousand jobs)
Green, yellow, and red indicate average annual employment in a decade is >15% above, within + 15%, or >15% below 2021 employment, respectively.
Note: Spatial redistribution of solar and wind manufacturing facilities and increasing the domestic manufacturing share offer opportunities to ameliorate losses in fossil fuel extraction states. For assumptions used here in siting solar and wind manufacturing jobs.
MOST STATES SEE NET GROWTH IN ENERGY-RELATED EMPLOYMENT, BUT MAJOR SHIFTS IN LOCAL ECONOMIES MUST BE MANAGED

8
2020
CURRENT U.S. WIND & SOLAR CAPACITY AND HIGH-VOLTAGE TRANSMISSION NETWORK
Transmission Capacity (GW)
As of end of 2020 (modeled year)
Wind SolarCapacity installed (TW)
0.15 0.07Land used (1000 km2)
Total 58 1.08Direct 0.6 0.97
Transmission capacityGW-km 320,000

9
MORE THAN 700 GW OF WIND AND SOLAR CAPACITY AND A 60% EXPANSION OF TRANSMISSION ACROSS THE U.S. BY 2030
2020 - 2030 (cumulative)
Wind SolarCapacity installed (TW)
0.41 0.32Land used (1000 km2)
Total 157 7.8Direct 1.6 7.0
Capital invested (2018$)Trillion $ 0.37 0.30
Transmission capacity
GW-km 516,000 (1.6x 2020)
Transmission Capacity (GW)
Note: Transmission expansion is visualized along existing rights of way (>160 kV); paths are indicative not definitive.
2030 E+

10
Transmission Capacity (GW)
Note: Transmission expansion is visualized along existing rights of way (>160 kV); paths are indicative not definitive.
1.5 TW EACH OF SOLAR & WIND CAPACITY (8x 2020 LEVEL); TRANSMISSION CAPACITY TRIPLE 2020 LEVEL
2020 - 2050 (cumulative)
Wind SolarCapacity installed (TW)
1.48 1.45Land used (1000 km2)
Total 550 38.3Direct 5.5 34.5
Capital invested (2018$)Trillion $ 1.84 1.39
Transmission capacity
GW-km 1,012,000 (3.2x 2020)
2050 E+

11
2050 E+The 2050 U.S. CO2transport network
• ~1 billion tCO2/yrtransported
• ~106,00 km of pipelines
• $170 billion in capital
A NEW NATIONAL CO2 TRANSPORT & STORAGE NETWORK

12
CLEAN ELECTRICITY PLUS ELECTRIFIED VEHICLES DELIVER LARGE AIR QUALITY AND PUBLIC HEALTH BENEFITS ACROSS STATES
Coal Plants
Motor Vehicles
Coal power plant
premature deaths per county (log scale)
- 300
premature deaths per county per 100,000 people
2020

13
200,000 TO 300,000 PREMATURE DEATHS AVOIDED THROUGH 2050 BY A NET-ZERO TRANSITION (~2 TO 3 T$ IN DAMAGES)
Coal Plants
Motor Vehicles
Coal power plant
premature deaths per county (log scale)
- 300
premature deaths per county per 100,000 people
2050 E+

14
THANK YOU.
Contacts: Eric Larson ([email protected])Chris Greig ([email protected])Jesse Jenkins ([email protected])Erin Mayfield ([email protected])
14
http://netzeroamerica.princeton.edu

Testimony of Dr. Jesse D. Jenkins
Assistant Professor
Princeton University
Committee on Science, Space, and Technology
United States House of Representatives
Lessons Learned from the Texas Blackouts: Research Needs for a Secure and Resilient Grid
March 18, 2021

Page | 2
My name is Jesse Jenkins. I am an energy systems engineer and an assistant professor at Princeton University with a joint appointment in the Department of Mechanical and Aerospace Engineering and the Andlinger Center for Energy and Environment. I am also an affiliated faculty at the Center for Policy Research in Energy and Environment at Princeton’s School of Public and International Affairs and at the High Meadows Environment Institute. My research focuses on the rapidly evolving electricity sector, including the transition to zero-carbon resources, the proliferation of distributed energy resources, and the role of electricity in economy-wide decarbonization. Let me first describe my professional background and qualifications. I received a PhD in Engineering Systems and S.M. in Technology and Policy from the Massachusetts Institute of Technology and a B.S. in Computer and Information Science from the University of Oregon. I have served previously as a postdoctoral Environmental Fellow at the Harvard Kennedy School and the Harvard University Center for the Environment, a researcher at the MIT Energy Initiative, a research fellow at Argonne National Laboratory, the Director of Energy and Climate Policy at the Breakthrough Institute, and a Policy and Research Associate at Renewable Northwest. Since 2012, I have also provided decision support, analytics, and policy advisory services to various non-profit and for-profit clients working to accelerate the deployment of clean energy. I have published thirteen peer reviewed journal articles as well as multiple working papers, technical reports, and policy briefs. I am one of the principle investigators of the recently-released Princeton Net-Zero America study and currently serve as a member of the National Academies of Science Engineering and Medicine (NASEM) Committee on Accelerating Decarbonization of the U.S. Energy System. The views expressed in this testimony are my own, and I am not speaking as an official representative of Princeton University, the NASEM Committee, or any of my co-authors or consulting clients. I would like to thank Chair Johnson, Ranking Member Lucas, and the members of the Committee for inviting this testimony. I commend the Committee for holding this hearing and for trying to get to the bottom of what went wrong in Texas during last month’s extreme cold—and for working to identify what this Committee and Congress can do to better prepare all Americans for similar threats. The truth is there is plenty of blame to go around. Failures to plan for and build resilience to this extreme cold were systemic. All sources of power experienced failures from natural gas and coal plants to wind turbines and even one of the state’s four nuclear reactors. Natural gas wells and pipelines froze, cutting off gas supply just as it was needed most. And state and federal policymakers alike all failed to require more robust winterization measures after a 2011 winter storm triggered blackouts and provided ample warning of the fragility of Texas’s energy infrastructure to extreme cold.

Page | 3
These systemic failures make it all too easy to cherry-pick claims that advance one’s preferred narrative or confirm one’s priors. The dozens of Texans who died and the millions who suffered through the days-long crisis – many of whom are still rebuilding today – deserve a full account of what went wrong. Americans all across the country in each of your districts can learn from the Texas crisis and take steps to prepare for the extreme weather threats we all face, threats that climate change is making more severe.
1. What went wrong The general factors behind Texas’s grid failure are now well understood—although a full timeline of all critical details on what caused specific power plant and gas system failures is still not available at this time. What we know is that on February 14th, a rare burst of Arctic air spread across the central U.S. and into Texas, dropping temperatures there into the single digits and sending electricity demand to a new winter peak of 69,222 megawatts (MW), nearly 5% higher than both the previous record and the “Extreme Peak Load” scenario considered by the Texas grid operator, ERCOT, in its winter reliability plan. That was before temps dropped even further overnight, sending the entire state under a winter storm warning for the first time and setting new record cold temperatures everywhere from Lubbock to Corpus Christi.
Figure 1. Timeline of the start of the Texas electricity system crisis on February 14th-15th. Source: ERCOT.

Page | 4
Very early on February 15th, things fell apart. Shortly after midnight, about 8,000 MW of natural gas power plants and 2,000 MW of wind turbines were forced offline by the cold. ERCOT deployed system operating reserves, which are standby generators prepared to ramp up to compensate for this kind of unplanned outage. The system remained stable, but entered emergency operations, as now-depleted reserves left the system in a fragile state. The next hour, 1:00-2:00am, nearly brought the entire Texas grid down. Several thousand more MW of natural gas and coal power plants failed in rapid succession. By 1:25am Monday, over 30,000 megawatts of thermal power plants were offline, more than 40% of the total needed to meet demand — and more than twice level ERCOT considered in an “Extreme Generator Outage” winter planning scenario. Faced with record demand, depleted operating reserves, and far less generation than the “extreme” scenarios they’d planned for, ERCOT had no choice but to order transmission utilities to start emergency disconnections of millions of customers. Many of them would go without power for days. The central challenge is that electricity supply and demand have to be kept in balance at all times. If demand exceeds supply, generators strain to meet the greater load, which results in a decline in the frequency at which the alternating current grid reverses polarity (60 hertz, or 60 times per second during normal operations) as synchronized generators slow their rotation under the strain. If the imbalance is too large and frequency drops less than 1% below the nominal 60 hertz (or less than 59.4 hertz) for more than a few minutes, generators will automatically disconnect to avoid damage, triggering a cascading failure that can result in a total systemwide blackout. A grid operator’s primary duty is to avoid this outcome. According to ERCOT, the Texas grid was just “minutes and second away” from this total system failure. If that scenario had occurred, it could have left Texans without electricity for weeks, requiring a “black start,” a delicately orchestrated operation to carefully bring power plants and transmission lines back, one-by-one. While ERCOT and other system operators drill and plan for black starts, the operation has never actually been performed, as the Texas grid has never suffered a complete system-wide blackout.

Page | 5
Figure 3. ERCOT system frequency (in hertz) during the height of the grid crisis, circa 1:00-2:00am, February 15th. If alternating current frequency drops less than 1 percent below the nominal 60 hertz (or less than 59.4 hertz) for more than a few minutes, generators will automatically disconnect to avoid damage, triggering a cascading failure that can result in a total systemwide blackout. Source: ERCOT
Figure 2. Timeline of generation capacity outages reported to ERCOT. Note that wind and solar power capacity outages are reported against maximum rated capacity, but ERCOT does not plan on wind or solar resources to supply this much generation during winter peak load events. In their Winter Seasonal Assessment of Resource Adequacy (SARA) report, ERCOT ‘derates’ wind capacity to about 25% of installed capacity on average (varying by location) and solar to 7% on average, and it plans for as little as zero solar and less than 6% of installed wind capacity in ‘extreme’ low wind output scenarios. ERCOT also plans for about 4,000 MW of planned maintenance outages for thermal power plants (natural gas, coal and nuclear) during winter peak demand periods; 32,000 MW of thermal outages were reported at maximum. Source: ERCOT

Page | 6
The specific causes of generator outages during the night of February 15th remain unknown, as investigations continue and we wait for ERCOT to release more detailed reports on what triggered plant failures, where, and when. These details will be critical to precisely diagnose the chain of events and understand where along that chain interventions could have prevented the blackouts.
We do know that all sources of power generation were hammered by the storm, and all failed to some degree. Wind turbines and coal piles iced up. Other power plants were knocked offline by frozen feedwater pipes, instrumentation, valves, and other equipment. For example, one of the state’s four nuclear reactors, a 1,300 MW reactor at the South Texas Station half way between Houston and Corpus Christi, went offline for about 36 hours due to a frozen sensor on a feedwater pipe that supplies coolant water for the plant, triggering faulty sensor readings that forced a precautionary shutdown of the reactor. There was no real imminent danger, but reactor operators are extremely cautious, requiring the shutdown until the instrumentation could be restored. Critically, the energy system failures were not the power grid’s alone. Texas’s abundant but liquids-rich natural gas fields saw wells and gathering lines freeze up, which cut gas field production in the state in half. Dozens of compressor stations along the gas pipeline system built during Texas’s recent natural gas boom apparently failed to register with the transmission utilities as “critical loads,” and many thus lost power during the blackouts, further exacerbating the gas supply shortages. Gas delivery pipelines can also freeze off, as water in the lines turns to ice, causing pressure swings that force pipelines to shut down to ensure safety. The greatest share of power generation outages were at natural gas power plants, which the state relies on for about two-thirds of its winter peaking capacity. How much of this capacity was lost due to failures in gas supply wells and pipeline networks and how much was due to failures at the power plants themselves is still not clear. But what is clear is that this loss of over 26,000 MW of gas-fired capacity was the single biggest contributor to the Texas blackouts.
2. The cost of extreme weather and the value of resilience In the end, a state known for its abundant energy resources experienced widespread failures of natural gas and electricity systems that left more than 4.5 million Texans without power, most of them for several days. The winter storm, the coldest in 30 years, left dozens dead and caused about $155 billion in damages and economic losses ($130 billion in Texas), according to estimates from AccuWeather. That rivals the economic toll of Hurricane

Page | 7
Harvey in 2017, and is nearly 2.5-times larger than the cost of the entire Atlantic basin hurricane season. With such a devastating toll, the Texas blackouts are a tragic reminder of the sometimes-deadly fragility of our critical infrastructure systems during extreme weather conditions. The challenge is that critical infrastructure is resilient only up to a point. When pushed a little bit further – a few degrees colder or hotter, an inch more rain, a day longer drought – these systems can fail in catastrophic ways. Investment and action to push back that point of failure – and to prepare response strategies that mitigate the harms when systems do fail – can be well worth it. Extreme weather tends to cause multiple parts of critical systems to fail at the same time. These kinds of simultaneous (or correlated) failures are far more probable and dangerous than one might think. If 10 power plants each have a 10% chance of failure but these probabilities are all independent, the chance that they all fail simultaneously is infinitesimal (0.00000001%). A 1% chance (equal to the probability of a once-in-a-century storm) that 10 power plants all fail at once is far more worrisome. Building resilient infrastructure means paying close attention to extreme events that can slam large parts of the system all at once, whether that’s a winter storm, wildfire, hurricane, or flood. While the scientific jury is still out on whether these ‘polar vortex’ cold snaps are related to climate change, we do know that climate change increases the frequency of extreme heat waves, droughts, wildfires, rainfall events and coastal flooding. And it is these extreme events that test our systems to the breaking point, just as they did in Texas last month. This is the Science & Technology Committee, so questions of R&D and new innovations will deservedly be at the center of discussion during today’s hearing. But at some level, the Texas crisis was not a failure of technology, per se. Energy systems can and should be made more resilient to extreme weather with existing technology. After all, wind turbines operate today in Antarctica, gas plants in Alberta, and gas wells in Alaska. Weatherization can be costly, but the most affordable steps, such as winterizing wind turbines or using heat tracing to keep pressure sensors from freezing up at natural gas or nuclear power plants, can be well worth it. More costly measures could include burying gas-field gathering lines to insulate against the cold surface and housing gas wells and liquids separation facilities in heated buildings. “Dual fuel” power plants can switch from gas to petroleum stored on site when gas supplies

Page | 8
are disrupted. Long-distance power lines can link up with far away regions facing less severe challenges. All of this is possible with current technology, but all of it comes at an added cost, a cost paid every year in the hopes that devastating but rare crises are avoided. In this way, building resilience to extreme events is a bit like buying fire insurance for your home. Most of us buy insurance not because we ever expect our home to burn down. But we know that if such a tragedy should occur, however rare, the results would be catastrophic. Without insurance, we’d lose everything and building our lives back may be impossible. So, we pay the premium every year, even though we don’t ever expect to use it. If a crisis does strike, paying the premiums can look like the perfect decision in hindsight. The problem, of course, is that we have to plan using our foresight, not hindsight. Determining how much ‘insurance’ – in the form of investment in grid resilience – is worth it and what kinds of crises we wish to protect against is the key challenge. Texas is well prepared for summertime peaks in demand driven by heat waves, just as New England is well prepared for winter cold and gas supply shortages. These happen frequently enough that it’s clear we must make investments to mitigate these risks. Planning for rarer events is much more difficult. But just as with the decision to purchase fire insurance, the calculus should come down to not only how frequent such events are but also how severe their impacts are when they occur. A once-in-a-decade cold snap or heat wave that causes a few hours of rotating blackouts may be something we can live with. But as the Texas crisis reveals, several days without power and heat during sub-freezing temperatures costs far too much in both lives lost and economic damages incurred. The changing climate makes planning and building resilience more difficult, as it means the past is no longer a safe guide to the future. The entire country must get much better at preparing for the unexpected. Going forward, any new infrastructure we invest in should be prepared for not only today’s climate, but also the climate we’ll have decades into the future. For each upgrade we make, we must decide what range of climate extremes it should be able to withstand. This is where research can make a difference. Expanded investment in climate science could help planners build more resilient systems. The focus of this research should be on assessing impacts on critical infrastructures and proactively identifying failure modes that can bring correlated or simultaneous failures of the kind experienced in Texas.

Page | 9
3. Building a resilient and affordable clean electricity system.
The U.S. electricity system in transition. About half of all U.S. electricity sales are now covered by states or electric utilities that have now committed to transition to 100% clean electricity. Federal legislation requiring a transition to 100% clean electricity nationwide has also been introduced. The direction of travel towards a 100% carbon-free grid is clear, even if the pace remains uncertain.
Figure 4. States with legally binding 100% clean energy or renewable energy requirements and utilities with voluntary commitments to transition to overwhelmingly clean electricity supplies. These commitments now cover about half of all U.S. retail sales of electricity. Source: Clean Air Task Force and Highland Energy Analytics.

Page | 10
This transition is critical, because clean electricity is the linchpin in any successful and affordable transition to a net-zero emissions U.S. economy by 2050 or sooner. As the National Academies study on Accelerating Decarbonization of the U.S. Energy System makes clear, pathways to cost-effectively reach net-zero greenhouse emissions entail twin challenges for the electricity sector: 1. As the source of more than a quarter of U.S. greenhouse gas emissions and with
multiple scalable, affordable alternatives to fossil fueled power plants available today, the electricity sector must (and can) cut emissions faster and deeper than any other sector.
2. Electricity generation must substantially expand—approximately 10−20% by 2030 and 120−170% by 2050—to fuel a greater share of energy use in transportation, building space heating, and low- and medium-temperature industrial process heat as well as produce hydrogen from electrolysis and even power direct air capture.
Rapidly reduce greenhouse gas emissions and transitioning to net-zero emissions nationwide is a critical and achievable goal. Until we reach net-zero emissions globally, the concentration of climate-warming gases will continue to increase, destabilizing our weather and driving more frequent and severe extreme events that are electricity systems and other critical infrastructure are so vulnerable to. The U.S. can and should lead in this transition. We have the economic and technical means to do so, and our leadership can not do our part to reduce our share of global emissions, but can also serve to drive the American ingenuity and innovation that will make clean energy and climate solutions affordable and available for the world. The Princeton Net-Zero America study, for which I served as co-principal investigator, concluded that this transition to net-zero emissions and 100% carbon-free electricity is an enormous national undertaking, but one that is ultimately affordable. We modeled and analyzed with unprecedented granularity five distinct pathways to affordably reach net-zero economy-wide by 2050. These paths all rely on technologies we fundamentally know how to build today, although several require continued innovation and cost declines to realize their full potential, and none depend on widescale behavioral changes such as shifts to vegetarian diets or major reductions in vehicle travel. The Net-Zero America study concludes that all of these paths to net-zero emissions require spending no more (and in many case less) as a share of our national gross domestic product on energy services as we do today. In other words, getting to net-zero does not require widespread economic sacrifice or a World War Two style mobilization of 20% of our GDP to build a clean energy infrastructure. Instead, we need to continue spending about the same
Page | 11
amount of our household and business expenditures on energy as we do today, but shift our investments towards cleaner sources of electricity and other energy sources.
The benefits of this transition are also large, including half a million to a million net jobs created in energy supply related sectors by 2030 and 2-3 million by 2050, as well as $2-3 trillion dollars in public health damages and 200,000-300,000 premature deaths from air pollution avoided from 2021-2050. The findings of the Net-Zero America study should build confidence that by deploying the clean energy technologies we have today and continuing to drive the innovation and improvement in technology that this committee has worked so hard to accelerate, we can reach net-zero while spending a similar share of GDP on energy services as we do today. Our modeling for the Net-Zero America study and most other research on electricity systems today repeatedly finds that wind and solar power can be cornerstones in an affordable and clean electricity system. Wind and solar power are now cheap. Thanks to proactive public policy support and innovation, the cost of wind power has fallen by about 70% and the cost of solar by about 90% over the last decade alone, and cost declines are projected to continue into the future. This increasingly makes wind and solar the cheapest source of electricity we can use, period.
Figure 5. Annual energy expenditures as a share of U.S. gross domestic product (GDP) under five modeled pathways to net-zero greenhouse gas emissions economy-wide by 2050. Source: Princeton Net-Zero America study.

Page | 12
Yet during the Texas crisis, wind and solar power provided at times as little as 1,000 MW of output, a tiny fraction of the more than 30,000 MW of installed capacity. That performance during the winter storm has led some to question: Can we assure a clean and resilient grid with a larger role for wind and solar power? The answer is yes. To understand why, we need to understand the role of each resource in the electricity system. We don’t need every source of electricity to be reliable all the time. What we need is the system to be reliable, and that requires a mix of electricity resources all playing the right role on the electricity team. Wind and solar don’t deliver value by being dependable, and this should come as no surprise to anyone. The simple truth is that wind and solar are reliably unreliable. We know the wind is inconstant and that nights affect solar output. Grid planners, including ERCOT, thus heavily discount the contribution of wind and solar during peak demand or extreme weather conditions. And they should. The fact that wind and solar are unreliable does not mean they have no value. This simply isn’t their job. Wind and solar deliver real value to electricity systems and ratepayers as fuel-saving resources. When available, wind and solar power are the cheapest ways we have to produce electricity. Without fuel, they are nearly free on the margin; when the wind is blowing and the sun is shining, these resources displace costlier sources of electricity, namely from fuel consuming resources like natural gas and coal. That saves billions of dollars and helps reduce the carbon dioxide emissions fueling more extreme weather that threatens the resilience of our electricity systems. Remember that Texas has no mandate for wind or solar power. The state was one of the first states implement a renewable portfolio standard in 1999, requiring 5,000 MW of wind power by 2015 and 10,000 MW by 2025, but Texas surpassed this 2025 target fourteen years early in 2009. Since then, every single megawatt of wind or solar power installed in the state has been installed because it makes more money for its investors and saves more money for Texas electricity consumers than any alternative. Wind and solar aren’t chosen because of onerous regulations, but because they make economic sense.

Page | 13
What every power system with a bigger role for wind and solar need is to maintain sufficient firm generating capacity to deliver necessary reliability. Firm electricity resources are available on demand, any time of the year, for as long as needed.1 These characteristics make firm resources a critical complement to weather-dependent variable renewable energy sources like wind and solar power, as well as resources such as batteries or strategies like demand flexibility (which permits consumers to reduce their electricity use in periods when supplies are strained) that are best suited to fast bursts of use, rather than sustained output over days or weeks.
The U.S. has about 950 gigawatts (GW) of firm generating capacity installed today, primarily natural gas (547 GW), coal (238 GW), and nuclear (101 GW) power plants. Going forward, modeling for Princeton’s Net-Zero America study finds that the U.S. needs to maintain between 500 and 1,000 GW of firm generating capacity as it transitions to net-zero greenhouse gas emissions and a 100% carbon-free electricity system.
1 Sepulveda, Jenkins, de Sisternes & Lester (2018), “The role of firm low-carbon resources in deep decarbonization of electric power systems,” Joule. https://doi.org/10.1016/j.joule.2018.08.006
Figure 6. A taxonomy of low-carbon electricity resources. “Firm” low-carbon resources are available on demand, any time of the year, for as long as needed, and are a critical complement to weather-dependent fuel-saving variable renewables and limited-duration “fast burst” balancing resources like batteries. Source: Sepulveda, Jenkins, de Sisternes & Lester (2018), “The role of firm low-carbon resources in deep decarbonization of electric power systems,” Joule 2(11). Full paper pdf at http://bit.ly/FirmLowCarbon

Page | 14
Figure 7. Clean firm capacity requirements in the Princeton Net-Zero America. Five net-zero emissions pathways for the United States and a reference case with no new policies are presented. Between 500-1000 GW of firm capacity is maintained in all cases, including a mix of combustion turbines and combined cycle power plants running on 60-100% hydrogen blend, natural gas and biomass-fired power plants with carbon capture, and nuclear power plants. This compares to about 950 GW of firm capacity in the U.S. grid today, mostly from natural gas and coal power plants. Source: Princeton Net-Zero America study.
Over time, the U.S. therefore needs to scale-up a range of sources of clean firm power. Clean firm resources are firm generation sources that can produce electricity with zero or near-zero emissions of greenhouse gases. This includes:
• nuclear power plants; • coal or natural gas-fired power plants that capture and permanently store carbon
emissions (carbon capture and sequestration or CCS); • use of hydrogen or other zero-carbon fuels in combustion turbines or fuel cells; • geothermal energy; and • biomass power plants that capture and store carbon emissions.2
2 Some hydro dams with very large reservoirs capable of seasonal storage can substitute for firm generation. Ultra-low cost long duration energy storage technologies with storage capacity costs in the range of $1-5/kWh and with suitable power cost and efficiency combinations can also partially substitute for or reduce the need for firm generation capacity. See Sepulveda, Jenkins, Edington, Mallpragada & Lester, (2021), “The design space for long-duration energy storage in decarbonized power systems,” Nature Energy (forthcoming).

Page | 15
Over the next decade, ample existing natural gas capacity and existing nuclear reactors can act as firm resources and ensure reliability as wind and solar power expand and displace coal and gas-fired generation. That means that CO2 emissions in the electricity sector can be reduced over the next decade by 70-80% by (1) phasing out coal-fired power plants; (2) maintaining existing nuclear and gas capacity; (3) reducing the total generation from natural gas power plants; and (4) increasing electricity generation from wind and solar power to roughly 50% of U.S. electricity (up from ~10% today). Reaching 100% carbon-free or deeply decarbonized electricity systems sometime after 2030 will ultimately require some combination of (1) replacing existing fossil-fueled firm capacity with new clean firm capacity; (2) retrofitting existing fossil capacity to capture carbon emissions or (3) converting gas power plants to use zero-carbon fuels such as hydrogen.3 New clean firm capacity will also be needed to replace any aging nuclear power plants that retire in coming years. The time to invest in clean firm power technologies is now. All clean firm generation technologies are all less mature and/or more costly today than is required for widespread and affordable use. This includes: small modular and advanced nuclear reactors; advanced geothermal (such as enhanced geothermal systems or closed loop geothermal); large frame combustion turbines capable of burning 60-100% hydrogen (and technologies for affordably producing hydrogen without CO2 emissions); biomass gasification plants; Allam-Fetvedt cycle power plants; and post-combustion carbon capture systems for fossil and biomass fueled power plants. As this Committee knows, it takes time to improve, scale-up, and drive down the cost of novel energy technologies. Wind power, solar photovoltaics, Lithium-ion batteries, LEDs, and even hydraulic fracturing all required a decade or more of proactive public policy support — including funding for R&D, demonstration projects, and the creation of early market opportunities. These efforts transformed these technologies from expensive ‘alternative technologies’ to affordable mainstream options. This proven process of making clean energy cheap and scalable must now be replicated for a full portfolio of clean firm generation technologies. What is needed now is proactive investment over the next decade in R&D, first-N-of-a-kind deployments, and early market scale-up, to ensure several clean firm technologies are affordable and ready to deploy 100s of gigawatts of capacity in the 2030s and 2040s.
3 Alternatively, some gas-fired generating capacity could be maintained as firm capacity and used very infrequently, if the CO2 emissions from these generators are offset by negative emissions technologies that permanently store CO2 from biomass or direct air capture in geologic formations. That would make these generators net-zero emissions firm resources. Note that storage of carbon in the ‘shallow’ carbon cycle in the terrestrial biome (e.g. forestry or land use offsets) is not an equivalently secure form of negative emissions as geologic storage.
Page | 16
In the Energy Act of 2020, this Committee worked on a bipartisan basis to enact critical new authorizations to advance many of these innovative clean firm technologies, including advanced nuclear reactors, carbon capture, hydrogen, geothermal energy, and fusion technologies. More effort and investment will be required to scale up and improve these critical clean firm technologies in the years ahead, beginning with appropriations this year to make the new authorizations in the Energy Act of 2020 a reality. And as the Texas crisis should show us all, we must ensure that these firm resources are actually firm. Firm resources are the resources we count on to be there when we need them. If they fail us – as the natural gas, coal, and even nuclear power plants did in Texas – that is when true disaster strikes. Innovation and research should thus focus on ensuring we have adequate and truly firm capacity to secure a reliable, resilient, and carbon-free electricity system. Thank you for having me today. I look forward to engaging with you on these critical issues.
###

4/20/2021 Decarbonizing California’s Grid Requires More than Wind and Solar
https://issues.org/california-decarbonizing-power-wind-solar-nuclear-gas/ 1/14
M A R C H 2 4 , 2 0 2 1
Clean Firm Power is the Key to California’sCarbon-Free Energy Future
B Y J A N E C . S . L O N G , E J E O N G B A I K , J E S S E D . J E N K I N S , C L E A
K O L S T E R , K I R A N C H A W L A , A R N E O L S O N , A R M O N D C O H E N , M I C H A E L
C O LV I N , S A L LY M . B E N S O N , R O B E R T B . J A C K S O N , D A V I D G . V I C T O R ,
S T E V E N P . H A M B U R G
California’s plan to make all of its electricity carbon free by 2045 will doubleelectricity demand. Three groups of analysts optimize its grid to be economicallyand environmentally sustainable.
California’s government has set ambitious goals to eliminate greenhouse gas emissions,starting with electricity. A 2018 law mandated that, by 2045, all retail sales of electricity in thestate must derive from carbon-free sources. Jerry Brown, who was then the governor, issuedan accompanying executive order requiring the entire state, not just the electric sector, tozero-out net emissions also by 2045. Policymakers have to grapple with achieving these goals.Reducing emissions in the economy as a whole will increase demand for electricity, which willbe used to power cars and heat buildings in place of fossil fuels. Energy planners estimate that
NATIONAL ACADEMIES OF SCIENCES ,NATIONAL ACADEMIES OF SCIENCES ,
ENGINEERING , AND MEDICINEENGINEERING , AND MEDICINE
ARIZONA STATE UNIVERSITYARIZONA STATE UNIVERSITY

4/20/2021 Decarbonizing California’s Grid Requires More than Wind and Solar
https://issues.org/california-decarbonizing-power-wind-solar-nuclear-gas/ 2/14
such electrification will increase California’s peak demand for electricity from 50 gigawattstoday to 100 gigawatts midcentury.
CAN THIS DEMAND BE MET?
The Environmental Defense Fund and the Clean Air Task Force convened three groups ofenergy system experts to model California’s electricity system in order to figure out how thestate might make that much affordable, clean, and reliable electricity. Groups from PrincetonUniversity, Stanford University, and Energy and Environmental Economics (E3), a SanFrancisco-based consulting firm, each ran separate models that sought to estimate not onlyhow much electricity would cost under a variety of scenarios, but also the physicalimplications of building the decarbonized grid. How much new infrastructure would beneeded? How fast would the state have to build it? How much land would that infrastructurerequire? Although each of these models offered its own depictions of the California electricitysystem and independently explored the ways it would be optimized, they all used the samethey all used the samethey all used the samethey all used the samethey all used the same
datadatadatadatadata with respect to past conditions and they all used the same estimates for futuretechnology costs. Despite distinct approaches to the calculations, all the models yielded verysimilar conclusions. The most important of these was that solar and wind can’t do the jobalone.
Despite distinct approaches to the calculations, all the models yielded very similar
conclusions. The most important of these was that solar and wind can’t do the job
alone.
Solar and wind have become mature technologies and enjoy substantial public support.However, they present challenges because they depend on the weather, which varies inpredictable and unpredictable ways. Although the costs of solar and wind power are now fullycompetitive with other sources per kilowatt-hour, their inescapable variability createsreliability problems. Average daily output from today’s California solar and windCalifornia solar and windCalifornia solar and windCalifornia solar and windCalifornia solar and wind
infrastructureinfrastructureinfrastructureinfrastructureinfrastructure in the winter declines to about a third of the summer peak. Periodic large-scaleweather patterns extending over 1,000 kilometers or more, known as dunkelflaute (theGerman word for dark doldrums), can also drive wind and solar output to low levels acrossthe region that can last days, or even several months. Average wind and solar outputs alsovary from year to year, particularly for wind power.
Batteries have been improving, and can help make up for fluctuations that last for multiplehours, but they cannot make up for the longer fluctuations. For this reason, having enough

4/20/2021 Decarbonizing California’s Grid Requires More than Wind and Solar
https://issues.org/california-decarbonizing-power-wind-solar-nuclear-gas/ 3/14
capacity for the slack periods would necessitate building an enormous amount of solar andwind power that would exceed the grid’s peak demand during more sunny and windy periods.Our modelers sought to figure out just how big the overcapacity would need to be to ensurereliable electricity availability. The models include energy imported from other states whenthat makes sense economically, but limit imports to a share that does not cause emissions togo up elsewhere. We simulated hundreds of possible scenarios for the weather over the courseof a year to estimate how much energy-generating and storage capacity is likely to benecessary.
Solar energy has much more generating potential in California than wind energy, so solarpower will dominate the renewable portfolio as a result. Because solar resources providepower only when the sun is shining, we found that reliably generating the electricity neededin 2045 from solar and wind power would require building the system up to nearly 500gigawatts of power-generating capacity. This is roughly half the capacity of the entire UnitedStates electricity generating system today, including nuclear, gas and coal generating stations,hydroelectric dams, and everything else, as shown in Figure 1.
If wind and solar are pushed to do all the heavy lifting themselves, the system
requires enormous excess generating capacity and storage (most of which is
seldom used) to provide reliable electricity and completely drive out greenhouse
emissions. This strategy ends up being much more expensive and much more
demanding of land and infrastructure than other possible pathways.
This excess capacity would be expensive. We estimate that wholesale electricity rates wouldincrease by about 65% over today if renewable energy and currently available storagetechnologies alone were to be used to meet demand in 2045. Furthermore, even if consumerswere willing to pay that premium, it may simply not be possible to build renewable facilitiesat this scale. Getting to nearly 500 gigawatts by 2045 would require expanding solar capacityat a rate 10 times higher10 times higher10 times higher10 times higher10 times higher than has ever been done before. There may not be enough people,supplies, or land to do this.
This is the great challenge with intermittent energy sources. On a dollar-per-kilowatt-hourbasis, they are now cheaper than carbon-intensive sources of electricity such as coal or evengas. They can play a central role in delivering an affordable carbon-free grid. But if wind andsolar are pushed to do all the heavy lifting themselves, the system requires enormous excessgenerating capacity and storage (most of which is seldom used) to provide reliable electricityand completely drive out greenhouse emissions. This strategy ends up being much more

4/20/2021 Decarbonizing California’s Grid Requires More than Wind and Solar
https://issues.org/california-decarbonizing-power-wind-solar-nuclear-gas/ 4/14
expensive and much more demanding of land and infrastructure than other possiblepathways.
Figure 1. Scenarios showing different modeled mixes of electricty capacity needed to meetCalifornia’s needs, and assuming zero emssions by 2045. The red curve is renewables plus batteriesonly. Other curves show different technological mixes. The bars on the right show the range of resultsobtained by the different models.
A CLEAN F IRM SOLUTION
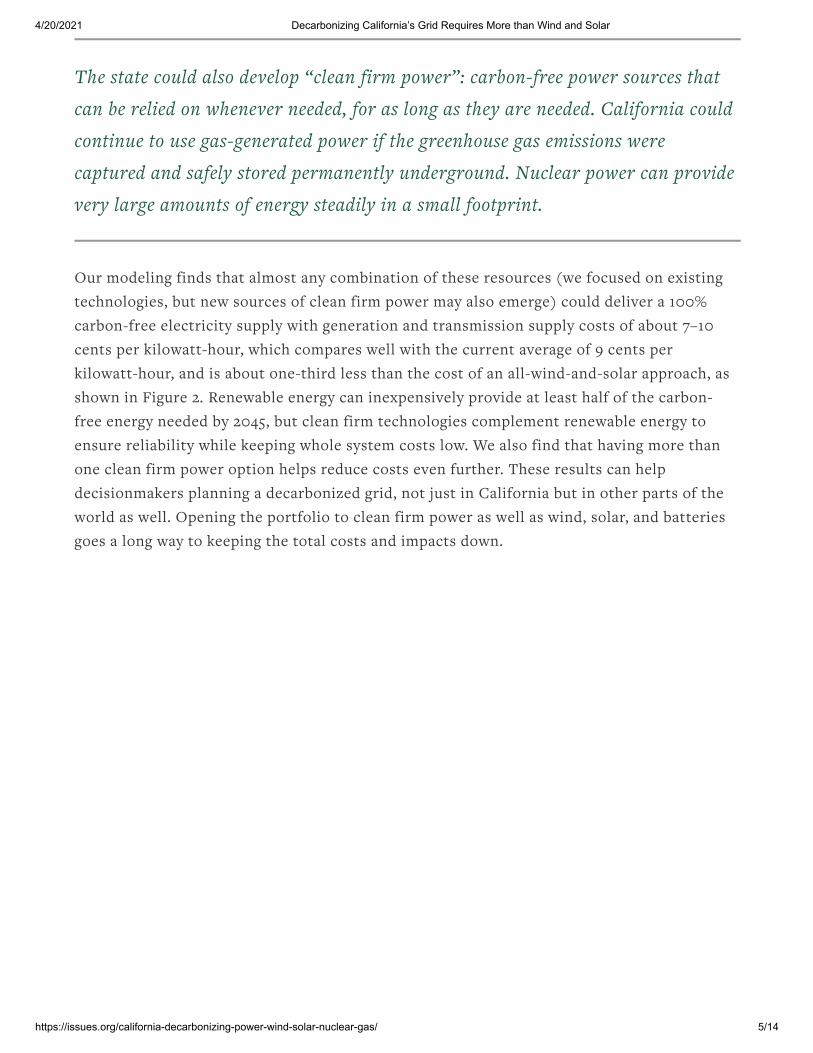
There is a better solution. The state could also develop “clean firm power”: carbon-free powersources that can be relied on whenever needed, for as long as they are needed. Californiacould continue to use gas-generated power if the greenhouse gas emissions were captured andsafely stored permanently underground. Nuclear power can provide very large amounts ofenergy steadily in a small footprint. California is currently phasing out the last of its nuclearpower stations, but in the future ongoing advances in nuclear technology could allow thedeployment of lower-cost reactors with much-diminished accident risk and less wastegeneration. Geothermal power takes energy from a steady source of heat in the ground.California’s geology already provides The Geysers, the largest geothermal plant in the world.Advances in geothermal technology could plausibly expand this resource beyond the specialconditions of The Geysers. Hydrogen and other fuels made without life-cycle emissions couldalso be sources of clean firm power.
4/20/2021 Decarbonizing California’s Grid Requires More than Wind and Solar
https://issues.org/california-decarbonizing-power-wind-solar-nuclear-gas/ 5/14
The state could also develop “clean firm power”: carbon-free power sources that
can be relied on whenever needed, for as long as they are needed. California could
continue to use gas-generated power if the greenhouse gas emissions were
captured and safely stored permanently underground. Nuclear power can provide
very large amounts of energy steadily in a small footprint.
Our modeling finds that almost any combination of these resources (we focused on existingtechnologies, but new sources of clean firm power may also emerge) could deliver a 100%carbon-free electricity supply with generation and transmission supply costs of about 7–10cents per kilowatt-hour, which compares well with the current average of 9 cents perkilowatt-hour, and is about one-third less than the cost of an all-wind-and-solar approach, asshown in Figure 2. Renewable energy can inexpensively provide at least half of the carbon-free energy needed by 2045, but clean firm technologies complement renewable energy toensure reliability while keeping whole system costs low. We also find that having more thanone clean firm power option helps reduce costs even further. These results can helpdecisionmakers planning a decarbonized grid, not just in California but in other parts of theworld as well. Opening the portfolio to clean firm power as well as wind, solar, and batteriesgoes a long way to keeping the total costs and impacts down.

4/20/2021 Decarbonizing California’s Grid Requires More than Wind and Solar
https://issues.org/california-decarbonizing-power-wind-solar-nuclear-gas/ 6/14
Figure 2. Modeled estimates of wholesale generation and transmission costs for 100% carbon-freeelectricity for 2045. The three colored bars indicate results from our three models for severaltechnology sceanrios. The bar on the rigtht is for the all-renewable option. GenX is the Princetonmodel, URBS is from Standford and Resolve is from E3.
California today has 48 gigawatts of total firm power capacity, most of which (42 gigawatts)come from natural gas-fired powerplants. The remaining gigawatts come from nuclear power,geothermal, and a small amount from coal. California plans to decommission its last nuclearpower plant, at Diablo Canyon, in 2025, which will take 2.2 gigawatts of firm and zero-carboncapacity offline. Our modeling concludes that replacing the gas fleet with 25–40 gigawatts ofclean firm power, as an addition to solar or wind, will minimize costs while maintainingreliability. By 2045 the clean firm power portfolio could eliminate the need for some 250–400gigawatts of additional renewable energy.
Each of these clean firm power resources would play a different role in eliminatingovercapacity. For example, nuclear power would act as a “flexible base” power source,generally providing a steady amount of electricity but somewhat reducing output during theheight of solar output, enabling nuclear plants to conserve their fuel for longer refuelingcycles. Although we did not model geothermal generation explicitly, we would expect it to actquite similarly to nuclear power as it also has large up-front costs and minimal variableexpenses. For natural gas plants with carbon dioxide capture and storage (CCS), the modelsfind that it would be economical to vary output as needed, ramping it down at night and up

4/20/2021 Decarbonizing California’s Grid Requires More than Wind and Solar
https://issues.org/california-decarbonizing-power-wind-solar-nuclear-gas/ 7/14
during peak daytime periods, and shutting the plants entirely for longer stretches in thespring. In general, all forms of carbon-free fuels provide expensive electricity. So, powerplants using these costly carbon-free fuels would be utilized only occasionally when solar,wind and storage options were unavailable. Any of these resources could adjust to fill the gapduring times of dunkelflaute.
Decarbonized electricity systems with clean firm power have other key advantages oversystems that are solely based on variable renewable energy and batteries (Table 1). Variousmodeled portfolios that include clean firm power alongside solar and wind in a 100% carbon-free electric system would require between 625 and 2,500 square miles dedicated to utility-scale solar and wind. Without clean firm power, more than 6,250 square miles of land wouldbe required—bigger than the combined size of Connecticut and Rhode Island. RecentRecentRecentRecentRecent
assessmentsassessmentsassessmentsassessmentsassessments of the solar resource in California indicate that 6,250 square miles may actuallyexceed the amount of land fit for utility-scale solarland fit for utility-scale solarland fit for utility-scale solarland fit for utility-scale solarland fit for utility-scale solar and not subject to restrictions (such asconservation easements or national park status). Moreover, the estimates of available land forutility-scale solar do not account for other possible restrictions, such as excessive slope,ownership problems, and access to transmission lines. New assessments currently underwaywill account for these and so will probably decrease estimates of land availability. Should theexisting out-of-state supplies of hydro and nuclear power become unavailable, the disparitiesbetween all-renewable and renewable-plus-firm power land use demands would be even moreextreme.

4/20/2021 Decarbonizing California’s Grid Requires More than Wind and Solar
https://issues.org/california-decarbonizing-power-wind-solar-nuclear-gas/ 8/14
Table 1. Summary of issues related to the need for clean firm power.
Including clean firm power also reduces the need for millions of megawatt-miles oftransmission lines. California currently has approximately 15 million megawatt-miles oftransmission lines, carried on about 26,000 circuit miles of power line. All modeled portfoliosthat include clean firm power add 2 million to 3 million megawatt-miles of new in-statetransmission lines to meet the goal of zero emissions by 2045. Some of this might well bebuilt along existing rights-of-way, but even so, getting the necessary permits quickly willpresent regulatory challenges and face local opposition. Yet an all-renewable portfolio couldrequire 9 million megawatt-miles, hugely increasing challenges of siting, land use, impacts onwildlife, and other considerations.
Better batteries play a key role in a carbon-free grid; they provide flexibility on
hourly and diurnal time scales, for instance by saving some solar-generated

4/20/2021 Decarbonizing California’s Grid Requires More than Wind and Solar
https://issues.org/california-decarbonizing-power-wind-solar-nuclear-gas/ 9/14
electricity from late afternoon into the evening. But economical batteries cannot
provide energy for weeks at a time.
Our models counted on a significant amount of new battery storage in addition to California’sexisting energy storage facilities, such as pumped water storage. California’s energy policiesfocus strongly on battery development, and some of the world’s biggest battery installationshave followed. the largest battery storage facility in the world is being built at Morro Bay atthe site of a retired power plant and will have a capacity of 0.6 gigawatts and will be able toprovide power for 4 hours, or 2.4 gigawatt-hours, enough to power 80,000 homes for about aday. Models with different mixes of clean firm power required between 20 and 100 gigawattsof new battery storage to deliver about 100 to 800 gigawatt-hours of energy storage. Thisrequires dozens of Morro Bay-sized facilities. Without clean firm power, the models requireabout 160 gigawatts of short-term battery storage to deliver nearly 1,000 gigawatt-hours ofenergy—the equivalent of more than 400 Morro Bay-sized batteries.
Better batteries play a key role in a carbon-free grid; they provide flexibility on hourly anddiurnal time scales, for instance by saving some solar-generated electricity from lateafternoon into the evening. But economical batteries cannot provide energy for weeks at atime. We did examine a class of technologies called “long duration storage” to see if thesecould substitute for clean firm power. Long duration storage technologies, such as electrolysisand underground storage of hydrogen or advances in ultra-cheap metal-air batteries, couldpotentially provide storage for longer than a few days, but modeling for this study and otherrecent work indicates these resources are cost-effective only as complements, not substitutesfor clean firm power. If long duration storage and clean firm power are available, costs remainlow. But if long duration storage is available but not clean firm power, the total energygeneration costs increase by about 25%. Long duration storage may provide another usefularrow in the quiver, but systems with clean firm power remain meaningfully less expensive.
DELIVERING A CLEAN , AFFORDABLE AND REL IABLE FUTURE
Weather-dependent renewable resources such as solar and wind will play a starring role inCalifornia’s low carbon energy future. Even with substantial clean firm power installations,our models show that at least 60% of the electric energy can come from renewable resources.Our models also show that, moving toward 2045, even without clean firm power, Californiacan perhaps abate over 80% of greenhouse gas emissions by building out renewable energywhile providing firm, but not clean, power from existing natural gas-fired generators. Whilecarbon emitting, these generators can nevertheless act as firm power in the coming decades,and their use can be decreased to the level essential for accommodating long periods of lowsun or wind. But if emissions need to drop to zero by 2045, California will need to replace

4/20/2021 Decarbonizing California’s Grid Requires More than Wind and Solar
https://issues.org/california-decarbonizing-power-wind-solar-nuclear-gas/ 10/14
these carbon-emitting resources with clean firm power or retrofit them with carbon captureand storage or adjustments to burn clean fuels.
Our model results show that squeezing out the last increments of carbon from powergeneration while maintaining affordability and reliability will require clean firm power. Anambitious but achievable investment in clean firm power with a capacity on the order ofCalifornia’s existing gas fleet could, on the upside, eliminate the need for 10 times thatamount of renewable energy. This can help keep generation and transmission costs in linewith today’s, cut the land area needed for utility-scale solar facilities and energy storage by afactor of 10, and reduce transmission infrastructure needs by a factor of four by 2045. Theseadvantages will help increase the likelihood of achieving climate goals in California by makingthem more economically and politically feasible.
An ambitious but achievable investment in clean firm power with a capacity on
the order of California’s existing gas fleet could, on the upside, eliminate the need
for 10 times that amount of renewable energy. This can help keep generation and
transmission costs in line with today’s, cut the land area needed for utility-scale
solar facilities and energy storage by a factor of 10, and reduce transmission
infrastructure needs by a factor of four by 2045.
California needs to start planning now to obtain clean firm power supplies. The state couldinitially target deployment of approximately 30 gigawatts of clean firm power by 2045, withinterim milestones along the way to avoid high system costs and loss of reliability in thefuture. These technologies are currently more expensive per kilowatt hour than renewableenergy, so deployment will require policy support. Many clean firm power options also facechallenges in public acceptance. It takes a long time to develop new technologies and to getregulators to approve them; waiting a decade will put California at risk of failure. Because allthese technologies keep costs low in the long run, California can work to scale several ofthese clean firm options simultaneously and expand whichever ones ultimately prove mostfeasible and cost-effective.
We don’t yet know the best choices and mixes of clean firm power. Consequently, the stateshould design an adaptive investment strategy—one that deploys and tests a diverse portfolioof clean firm power choices until experience identifies the best and most politically andtechnologically feasible options. A broad portfolio approach will increase chance of success,help to avoid technological cul-de-sacs, and thus will help ensure affordability and reliabilityin the long run. California’s government could require utilities to build some form of clean

4/20/2021 Decarbonizing California’s Grid Requires More than Wind and Solar
https://issues.org/california-decarbonizing-power-wind-solar-nuclear-gas/ 11/14
firm power now and allow cost recovery for their implementation. Leaving the form of cleanfirm power up to the utilities themselves—with oversight from California’s regulators focusedon evaluating what the utilities do on the ground—will allow experimentation and learning.
The federal government can also help, not just California but the entire nation, by makingsizeable investments in clean firm power—including investment in innovations needed forthe next generations of these sources.
Governments and electric system planners worldwide are pushing hard to deploy vastquantities of renewable power. Our analysis, and manymanymanymanymany othersothersothersothersothers, show how these power sourcescan be integrated reliably with clean firm power to meet other goals such as wise landstewardship and improved reliability, accessibility, and affordability. By adopting an approachthat combines the best attributes of both renewable and firm, carbon-free energy, Californiacan pave the way for a fundamental change in how energy is made and used.
Jane C. S. Long is a senior contributing scientist at the Environmental Defense Fund. She formerly was theassociate director for energy and environment at Lawrence Livermore National Laboratory and dean of
Mackay School of Mines at the University of Nevada, Reno. Ejeong Baik is a PhD student in the
Department of Energy Resource Engineering at Stanford University. Jesse D. Jenkins is an assistantprofessor in the Department of Mechanical and Aerospace Engineering and the Andlinger Center for
Energy and Environment at Princeton University. Clea Kolster is the director of science at LowercarbonCapital, and leads the firm’s technical research, development, diligence, and scientific strategy efforts.
Kiran Chawla is a graduate student in the Emmett Interdisciplinary Program in Environment and
Resources at Stanford University. Arne Olson is a senior partner at Energy and Environmental Economics
(E3), based in San Francisco. Armond Cohen is cofounder and executive director of the Clean Air Task
Force, which he has led since its formation in 1996. Michael Colvin is the director of regulatory and
legislative affairs for the Environmental Defense Fund. Sally M. Benson is codirector of the Precourt
Institute and a professor in the Department of Energy Resources at Stanford University. Robert B. Jackson
is a professor and senior fellow at the Woods Institute for the Environment and the Precourt Institute for
Energy at Stanford University. David G. Victor is codirector of the Deep Decarbonization Initiative, andthe Center for Global Transformation Endowed Chair in Innovation and Public Policy at the UC SanDiego School of Global Policy and Strategy. He is also adjunct senior fellow at the Brookings Institute.
Steven P. Hamburg is chief scientist of the Environmental Defense Fund.
YOUR PARTICIPATION ENRICHES THE CONVERSATION
Respond to the ideas raised in this essay by writing to [email protected]. And read whatothers are saying in our lively Forum section.
4/20/2021 Decarbonizing California’s Grid Requires More than Wind and Solar
https://issues.org/california-decarbonizing-power-wind-solar-nuclear-gas/ 12/14
CITE THIS ARTICLE
Long, Jane C.S., Ejeong Baik, Jesse D. Jenkins, Clea Kolster, Kiran Chawla, Arne Olson,Armond Cohen, Michael Colvin, Sally M. Benson, Robert B. Jackson, David G. Victor, andSteven P. Hamburg. “Clean Firm Power is the Key to California’s Carbon-Free EnergyFuture.” Issues in Science and Technology (March 24, 2021).
NEWSLETTER S IGN -UP
Sign-up for the Issues newsletter and be the first to get access to new articles.
IN FOCUS
COVID-19
The essays here deliver fresh insights on the social, political, and scientific aspects of thepandemic, which can help you more fully understand and respond to the complex and difficultevents that are now unfolding.
RELATED ARTICLES
China’s Green Dreams
F O R U M
Reader responses to Ran Ran’s article explaining the gap between China’s ambitiousgreen promises and grim environmental reality.
R E A D M O R E

For Public Use
U.S. Senate Committee on Energy & Natural Resources Testimony of Manu Asthana President and CEO, PJM Interconnection March 11, 2021

Testimony of Manu Asthana
President & CEO, PJM Interconnection
PJM © 2021 www.pjm.com | For Public Use i | P a g e
This page is intentionally left blank.

Testimony of Manu Asthana
President & CEO, PJM Interconnection
PJM © 2021 www.pjm.com | For Public Use ii | P a g e
Contents Introduction .................................................................................................................................................................. 1
Executive Summary ..................................................................................................................................................... 2
Reliability: Job #1......................................................................................................................................................... 3
Stress Testing: A Key Component of Reliable Operations .................................................................................. 4
Addressing Extreme Weather Conditions ............................................................................................................. 5
Resilience: Beyond Reliability .................................................................................................................................... 6
Learning from Extreme Events ............................................................................................................................... 7
PJM Markets Reinforce Reliability & Support Affordability ..................................................................................... 7
Available & Affordable Electricity .......................................................................................................................... 9
The Energy Transition ................................................................................................................................................. 9
In Conclusion ............................................................................................................................................................. 12

Testimony of Manu Asthana
President & CEO, PJM Interconnection
PJM © 2021 www.pjm.com | For Public Use 1 | P a g e
Introduction
I am Manu Asthana, president and CEO of PJM Interconnection. On behalf of PJM, it is a pleasure to participate in
this hearing and share PJM’s perspective on the reliability, resilience and affordability of the bulk power grid.
Based in Valley Forge, Pennsylvania, PJM Interconnection ensures the reliable flow of power to 65 million customers
in 13 states and Washington, D.C. As such, we’re responsible for ensuring reliable and efficient delivery of electricity
over the bulk electric system to one-fifth of the nation.
The PJM grid consists of 85,103 miles of transmission lines and approximately 1,200 generation sources, along with
more than 500 demand response and energy efficiency providers. We are interconnected with our neighboring
systems in the Eastern Interconnection, which geographically includes over two-thirds of the United States and
Canada. PJM delivers power from the high-voltage transmission grid to local distribution utilities, who then are
responsible for delivery to end-use customers.
PJM Service Territory
Our markets exist to reinforce grid reliability by ensuring that, in addition to our reliability requirements on generators,
market signals work in tandem with those requirements to support reliable operations. For example, our capacity
market is designed to procure resources available to meet projected peak demand and other contingencies three
years ahead of time. Through our Day-Ahead and Real-Time markets, we produce a security-constrained economic
dispatch across our footprint, ensuring that the most efficient and cost-effective mix of resources are called on each
hour of each day to achieve reliability at the least cost to customers. In addition, in any given hour we either export
excess power supplies to our neighbors or import needed power from those neighbors, which helps support reliable
and cost-effective operations throughout the Eastern Interconnection.
Testimony of Manu Asthana
President & CEO, PJM Interconnection
PJM © 2021 www.pjm.com | For Public Use 2 | P a g e
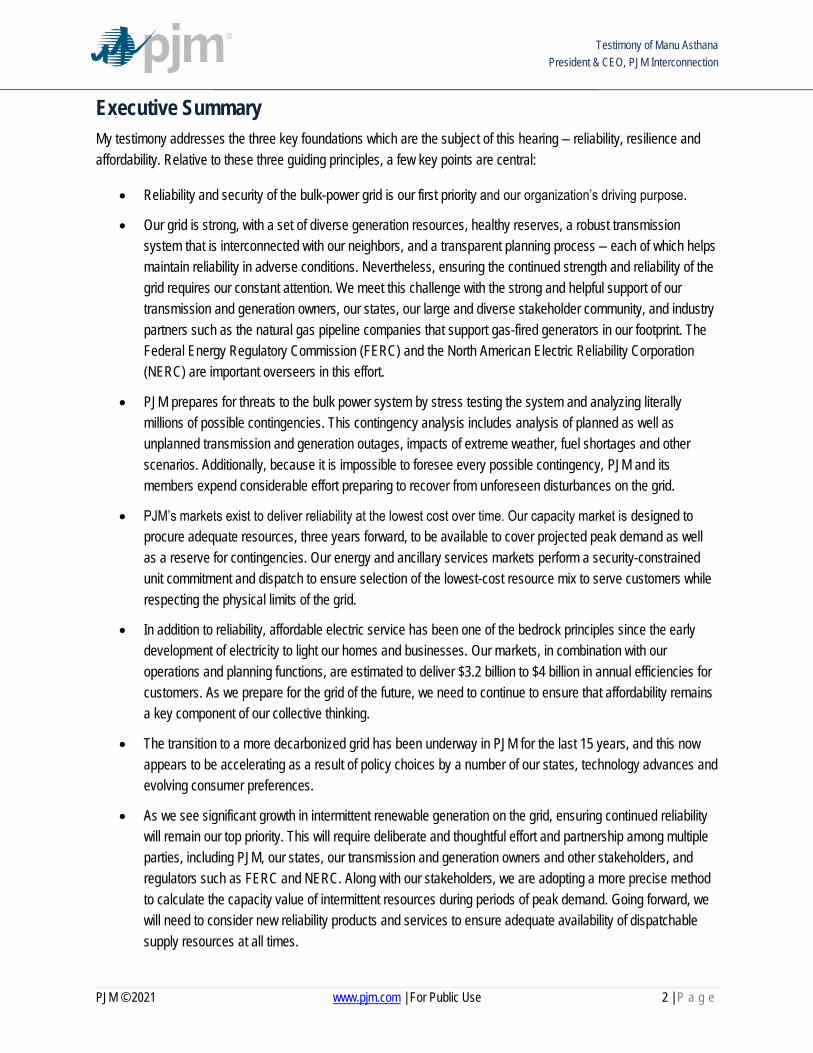
Executive Summary
My testimony addresses the three key foundations which are the subject of this hearing – reliability, resilience and
affordability. Relative to these three guiding principles, a few key points are central:
Reliability and security of the bulk-power grid is our first priority and our organization’s driving purpose.
Our grid is strong, with a set of diverse generation resources, healthy reserves, a robust transmission
system that is interconnected with our neighbors, and a transparent planning process – each of which helps
maintain reliability in adverse conditions. Nevertheless, ensuring the continued strength and reliability of the
grid requires our constant attention. We meet this challenge with the strong and helpful support of our
transmission and generation owners, our states, our large and diverse stakeholder community, and industry
partners such as the natural gas pipeline companies that support gas-fired generators in our footprint. The
Federal Energy Regulatory Commission (FERC) and the North American Electric Reliability Corporation
(NERC) are important overseers in this effort.
PJM prepares for threats to the bulk power system by stress testing the system and analyzing literally
millions of possible contingencies. This contingency analysis includes analysis of planned as well as
unplanned transmission and generation outages, impacts of extreme weather, fuel shortages and other
scenarios. Additionally, because it is impossible to foresee every possible contingency, PJM and its
members expend considerable effort preparing to recover from unforeseen disturbances on the grid.
PJM’s markets exist to deliver reliability at the lowest cost over time. Our capacity market is designed to
procure adequate resources, three years forward, to be available to cover projected peak demand as well
as a reserve for contingencies. Our energy and ancillary services markets perform a security-constrained
unit commitment and dispatch to ensure selection of the lowest-cost resource mix to serve customers while
respecting the physical limits of the grid.
In addition to reliability, affordable electric service has been one of the bedrock principles since the early
development of electricity to light our homes and businesses. Our markets, in combination with our
operations and planning functions, are estimated to deliver $3.2 billion to $4 billion in annual efficiencies for
customers. As we prepare for the grid of the future, we need to continue to ensure that affordability remains
a key component of our collective thinking.
The transition to a more decarbonized grid has been underway in PJM for the last 15 years, and this now
appears to be accelerating as a result of policy choices by a number of our states, technology advances and
evolving consumer preferences.
As we see significant growth in intermittent renewable generation on the grid, ensuring continued reliability
will remain our top priority. This will require deliberate and thoughtful effort and partnership among multiple
parties, including PJM, our states, our transmission and generation owners and other stakeholders, and
regulators such as FERC and NERC. Along with our stakeholders, we are adopting a more precise method
to calculate the capacity value of intermittent resources during periods of peak demand. Going forward, we
will need to consider new reliability products and services to ensure adequate availability of dispatchable
supply resources at all times.

Testimony of Manu Asthana
President & CEO, PJM Interconnection
PJM © 2021 www.pjm.com | For Public Use 3 | P a g e
By the same token, improvements to load and renewable generation forecasting, the setting of reserve
margin targets (including consideration of the potential for extreme weather events), as well as enhancing
the visibility and dispatchability of distributed energy resources, will all need further development going
forward. Thoughtful approaches and carefully synchronized timing of all of these efforts will be needed, both
at the PJM stakeholder level and at FERC, to ensure this transition is successful.
As we have seen in many past situations, events such as extreme temperatures do not always occur as
simple stand-alone events. Rather, there is often a correlation of events, such as extremely cold
temperatures coupled with ice storms or the potential for multiple cybersecurity intrusions for which we need
to plan. PJM is committed to learning from extreme grid events, whether they happen in our region or
elsewhere. We will evaluate the analyses of the recent events in Texas in light of lessons learned from our
own past experiences. Some key questions we are considering include:
o While most generation on our system has prepared for cold weather, should additional FERC
policies, NERC standards and PJM rules be established to focus on winterization of resources, and
to address additional areas of resilience of both the grid and generating units?
o Should enhanced “circuit breakers” be established in power and gas markets to protect consumers
from extreme prices during periods of extended scarcity, market dysfunction or compromised
system operation?
o What further coordination with transmission and distribution providers, fuel suppliers and
generation owners is warranted to lower the risk that supply of fuel and other critical inputs to the
production of electricity is disrupted during stress conditions?
Answering these questions will require coordination among PJM, FERC, NERC, the gas industry, states and
stakeholders.
PJM believes that our markets should be designed to accommodate state policies related to the generation
resource mix, while also ensuring that we have the products (and adequate compensation to providers) in
place, in a timely manner, to meet the reliability needs of the system going forward. We are presently
involved in a series of workshops with our stakeholders on these very issues, and it will take continued
federal leadership, coordination with our members, states and other stakeholders to accomplish this goal.
Reliability: Job #1
At PJM, reliability is our top priority. We understand the profound implications of what we do and how important
electricity is to daily life. We understand that we must prove ourselves every day by ensuring the reliable delivery of
electricity that is so central to the economy and health and well-being of the 65 million Americans in our footprint.1
PJM has been ensuring reliability at the bulk power level to our region going back to 1927, when three utilities
recognized the synergies of sharing power and created the first continuous power pool.
1 I am attaching to this testimony the white paper “Reliability in PJM: Today and Tomorrow,” which provides additional
explanation of how PJM addresses reliability through our markets, planning and operations functions.

Testimony of Manu Asthana
President & CEO, PJM Interconnection
PJM © 2021 www.pjm.com | For Public Use 4 | P a g e
That value proposition endures today: Both in regions with regional transmission organizations (RTOs) and those
without RTOs, the industry has a long history of mutual support. However, PJM’s regional approach, operating
across a very large footprint with many more resources and tools available, ensures a stronger grid than might exist if
every utility in our system had to ensure reliability solely on their own. PJM’s rigorous planning process ensures a
reliably planned system for the long term over a wide range of operating conditions.
Reliable operation is complex, involving multiple layers of protection. It involves 24/7 system monitoring and dispatch
by trained operators, coordination with other operating entities and industry sectors in real time, markets that support
reliability and resource adequacy over the long term, and extensive regional transmission planning to ensure the grid
is equipped to serve future needs.
Stress Testing: A Key Component of Reliable Operations
Testing for different scenarios and stress testing the system is an integral part of both daily operations and our long-
term planning. By way of example, we analyze changes to the expected load forecast due to weather conditions, the
effect of the pandemic, and other near-term events, including:
Maintenance outages of transmission and generating facilities
Impact of sudden unplanned outages of generation or transmission
Forecasted adverse weather conditions across the footprint
Fuel-related contingencies such as loss of pressure or supply on natural gas pipelines that serve PJM
System stability including the impact of periods of low wind availability
In addition, through our open and transparent transmission planning process, we are analyzing the need for
upgrades and new transmission build-outs through a five, eight and 15-year-forward, multi-scenario analysis,
which includes:
Producing a load forecast that accounts for multiple scenarios including factors such as changing weather
patterns, different levels of economic growth, and customer-driven energy efficiency and demand response
actions that impact electricity demand
Examining fuel security by analyzing 324 winter scenarios in which we varied factors such as the generation
fuel mix, winter weather severity and duration, level of gas availability, oil refueling capability, system-wide
forced outage levels, and the number, severity and duration of pipeline disruptions
Developing an annual Installed Reserve Margin (14.7 percent in 2021) to ensure the availability of sufficient
generation resources during stressed system conditions
Ensuring the stability of the system both under normal and adverse conditions
Complying with NERC and local reliability criteria
Finding opportunities to use transmission to lower customer costs through market efficiency projects
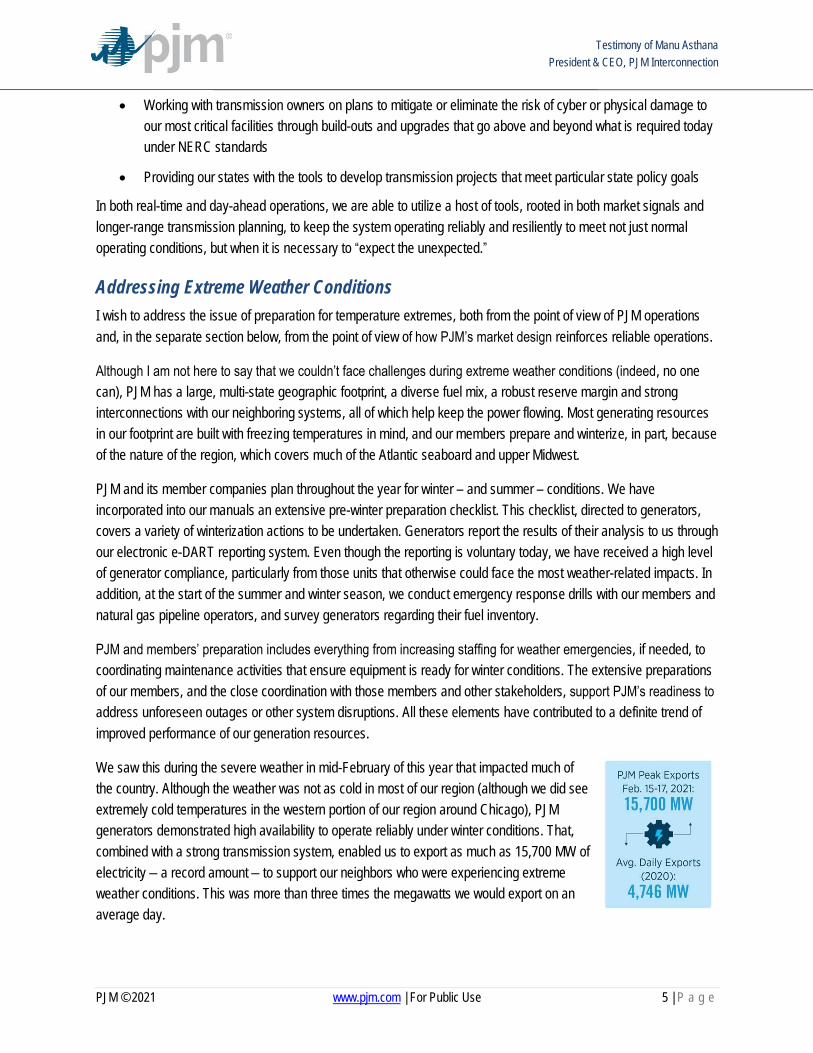
Testimony of Manu Asthana
President & CEO, PJM Interconnection
PJM © 2021 www.pjm.com | For Public Use 5 | P a g e
Working with transmission owners on plans to mitigate or eliminate the risk of cyber or physical damage to
our most critical facilities through build-outs and upgrades that go above and beyond what is required today
under NERC standards
Providing our states with the tools to develop transmission projects that meet particular state policy goals
In both real-time and day-ahead operations, we are able to utilize a host of tools, rooted in both market signals and
longer-range transmission planning, to keep the system operating reliably and resiliently to meet not just normal
operating conditions, but when it is necessary to “expect the unexpected.”
Addressing Extreme Weather Conditions
I wish to address the issue of preparation for temperature extremes, both from the point of view of PJM operations
and, in the separate section below, from the point of view of how PJM’s market design reinforces reliable operations.
Although I am not here to say that we couldn’t face challenges during extreme weather conditions (indeed, no one
can), PJM has a large, multi-state geographic footprint, a diverse fuel mix, a robust reserve margin and strong
interconnections with our neighboring systems, all of which help keep the power flowing. Most generating resources
in our footprint are built with freezing temperatures in mind, and our members prepare and winterize, in part, because
of the nature of the region, which covers much of the Atlantic seaboard and upper Midwest.
PJM and its member companies plan throughout the year for winter – and summer – conditions. We have
incorporated into our manuals an extensive pre-winter preparation checklist. This checklist, directed to generators,
covers a variety of winterization actions to be undertaken. Generators report the results of their analysis to us through
our electronic e-DART reporting system. Even though the reporting is voluntary today, we have received a high level
of generator compliance, particularly from those units that otherwise could face the most weather-related impacts. In
addition, at the start of the summer and winter season, we conduct emergency response drills with our members and
natural gas pipeline operators, and survey generators regarding their fuel inventory.
PJM and members’ preparation includes everything from increasing staffing for weather emergencies, if needed, to
coordinating maintenance activities that ensure equipment is ready for winter conditions. The extensive preparations
of our members, and the close coordination with those members and other stakeholders, support PJM’s readiness to
address unforeseen outages or other system disruptions. All these elements have contributed to a definite trend of
improved performance of our generation resources.
We saw this during the severe weather in mid-February of this year that impacted much of
the country. Although the weather was not as cold in most of our region (although we did see
extremely cold temperatures in the western portion of our region around Chicago), PJM
generators demonstrated high availability to operate reliably under winter conditions. That,
combined with a strong transmission system, enabled us to export as much as 15,700 MW of
electricity – a record amount – to support our neighbors who were experiencing extreme
weather conditions. This was more than three times the megawatts we would export on an
average day.
Testimony of Manu Asthana
President & CEO, PJM Interconnection
PJM © 2021 www.pjm.com | For Public Use 6 | P a g e
The entire Eastern Interconnection, although stressed in the southwest, was certainly stronger as a result of this
massive level of exports and support by PJM to neighboring systems. And, as noted previously, our neighbors have
provided us support at times when the shoe was on the other foot, and system conditions in PJM could be alleviated
with imports from our neighbors.
Resilience: Beyond Reliability
As we have said, the system is sound today. PJM’s transmission system consists of a robust 500 kV and 765 kV
“backbone” that has withstood extreme weather conditions and has continued to perform well. However, the grid
needs constant attention. Part of that task requires policymakers, transmission owners and grid operators like PJM to
address the need for specific improvements to ensure that the grid is not just reliable, but also is resilient going
forward, to withstand some of the extreme conditions we could well be experiencing in the future.
The distinction between resilience and reliability has been extensively debated in a now-closed docket before FERC.
PJM defines resilience as: “preparing for, operating through, and recovering from events that impose operational risk,
including but not limited to, high-impact, low-frequency events that today are not typically addressed by industry
reliability standards.”
Perhaps as a prime example: We are in the middle of a high-impact, and hopefully low-frequency, event in the form
of the COVID-19 pandemic. And while PJM has had a pandemic response plan in place since 2006, this event has
demonstrated how we need to “expect the unexpected” and ensure that the system is resilient to withstand those
unexpected events.
PJM has responded to this challenge by staying focused on building resilience to the impacts of the pandemic into
our operations, remaining flexible and learning as we go. We have successfully run our operations, planning and
markets with 90 percent of our workforce working remotely. Operators on campus are now in their second round of
sequestration to ensure continued operation of the grid. We improvised a third control room as a backup to our two
existing control rooms, which normally support each other. And we have managed to conduct about 400 meetings
with our stakeholders, all remotely.
Another example of PJM preparing for a resilient grid can be seen through detailed work we performed on:
Impacts of future generation unit retirements and changing fuel mix2
Analysis of the security of fuel supplies and fuel delivery mechanisms in PJM3
Potential security disruptions to the natural gas pipeline system and its impact on PJM generation
PJM and its stakeholders continue to add extreme scenarios for consideration in our operations and planning
processes.
2 PJM’s Evolving Resource Mix and System Reliability, March 30, 2017
3 Fuel Security Analysis: A PJM Resilience Initiative, Dec. 17, 2018
Testimony of Manu Asthana
President & CEO, PJM Interconnection
PJM © 2021 www.pjm.com | For Public Use 7 | P a g e
Learning from Extreme Events
PJM is committed to learning from extreme grid events, whether these occur in our region or elsewhere, and to using
these lessons learned to improve the reliability and resilience of our system. Some examples include:
Review of Southwest 2011 Winter Event: PJM established winterization steps to be taken by generation unit
owners and established a reporting system to PJM, as well as provisions to secure additional reserves to
address both winter and summer stressed conditions.
2014 Polar Vortex Event: PJM made changes to its capacity market design to provide significant penalties
for poor generator performance and payments for superior generating performance during identified
stress conditions.
Gas/Electric Coordination: PJM established protocols with natural gas pipelines serving our region to ensure
real-time communication and contingency analysis during times of stressed conditions on the interstate
pipeline system.
2021 Cold Weather Grid Operations: PJM is carefully monitoring the information coming out of the various
reviews in ERCOT and will evaluate lessons learned from that analysis, with an eye toward examining what is
applicable to our region. However, I believe at least three important questions arise for broader consideration by
PJM, our members and our regulators, given what we know so far:
1) While most generation on our system has prepared for cold weather, should additional FERC policies,
NERC standards and PJM rules be established to focus on winterization of resources and to address
additional areas of resilience of both the grid and generating units?
2) Should enhanced “circuit breakers” be established in power and gas markets to protect consumers from
extreme prices during periods of extended scarcity, market dysfunction or compromised system
operation?
3) What further coordination with transmission and distribution providers, fuel suppliers and generation
owners is warranted to lower the risk that supply of fuel and other critical inputs to the production of
electricity is disrupted during stress conditions?
Answering these questions will require sound coordination among PJM, generation, transmission and distribution
owners, FERC, NERC, the gas industry, states and other stakeholders.
PJM Markets Reinforce Reliability & Support Affordability
As I stated earlier, the markets PJM administers serve to reinforce reliable grid operation efficiently. The markets
have also opened the door to new, innovative products such as Energy Efficiency and Demand Response, which
function to reduce electricity demand and save customers money.
Even fully regulated states benefit from the organized wholesale markets. Utilities located in those states can buy
and sell electricity in the markets when they need to, or when it makes economic sense. Regulated utilities and states
also benefit from the transparency of wholesale market prices – using them as a comparison when making electricity
supply investment decisions.

Testimony of Manu Asthana
President & CEO, PJM Interconnection
PJM © 2021 www.pjm.com | For Public Use 8 | P a g e
The PJM market design integrates reliability with affordability by selecting the lowest-cost power source, wherever it
is located, to provide electricity to wherever it is needed, subject to physical network transfer limits over a wide
region. Our primary markets are the energy and capacity markets. Each market serves a separate function, but they
work in tandem.
I will describe the capacity market first, because although it represents about 20 percent of our total market, it is
squarely aimed at maintaining reliability. PJM’s capacity market was implemented to secure enough power supplies
at locations they are needed to make sure that sufficient supply is available to meet peak demand three years into
the future, taking into account anticipated outages of individual resources and required reserves for other
contingencies. Under a normal schedule, we hold a three-year-forward auction in May. That is extremely valuable
from a reliability perspective.
The capacity market also helps provide an investment signal to attract new efficient generation and to retire older,
less efficient generation. It can help to avoid some of the volatility we would otherwise see in an energy-only market.
The design of the capacity market also results in the purchase of resources beyond the minimum reliability
requirement, providing additional reliability for unforeseen events, with each megawatt of reliable supplies beyond the
minimum being procured at a declining cost to the customer. Moreover, as noted below, the capacity market has
encouraged innovation and led to the penetration of Energy Efficiency and Demand Response as market products
that can be called upon to cut demand in times of stress, further bolstering reliability.
Increasing Demand Resources in the Capacity Market
As a result of extreme weather conditions our region realized during the Polar Vortex of 2014, we made notable
changes to our market design to ensure that the market both rewards superior generator unit performance and
penalizes poor generator unit performance. During the 2014 Polar Vortex, up to 22 percent of generators in our
footprint were unavailable as a result of forced outages.
As a result of the winterization procedures, which I described above, along with the incentive and penalty reforms we
instituted in 2016, we have seen a notable improvement in generator performance including during periods of
extreme weather. Forced outages during the recent cold weather in the PJM region peaked at 9.8 percent during the
coldest weather of Feb. 15-17, compared with the 22 percent during the 2014 Polar Vortex, as noted above.

Testimony of Manu Asthana
President & CEO, PJM Interconnection
PJM © 2021 www.pjm.com | For Public Use 9 | P a g e
Nevertheless, we are not resting on these past achievements but looking forward to ensure that grid reliability is
maintained under a paradigm of more extreme weather and a changing generation portfolio. I address this further in
The Energy Transition section on page 10.
The largest of the PJM markets is the Energy Market, making up the majority of wholesale electricity costs. While the
capacity market prepares for the future, the Energy Market addresses near-term need. Energy prices are produced
on average every five minutes, as the most cost-effective resources across the PJM region are dispatched to serve
ever-changing demand.
Available & Affordable Electricity
In aggregate, our markets have helped support an overall decline in total wholesale costs in recent years. Total
wholesale prices were $43.41 in 2020, down 38 percent from 2014. PJM’s wholesale prices have been essentially
flat for two decades and are competitive with other regions of the country. The Energy Market, which is about 60
percent of the PJM markets, saw historic low prices in 2020.
Total Wholesale Cost (2014-2021)
I should also note that wholesale costs are just one component of the overall customer bill. Customer bills include
generation and transmission charges for services that flow through PJM as well as distribution-level charges of each
utility and, in some cases, additional charges from competitive retailers. Those distribution charges are determined
by each state public utility commission.
The Energy Transition
The transition to a more decarbonized grid has been underway in PJM for the last 15 years. Emissions rates in
PJM are down drastically since 2005 – CO2 by nearly 40 percent, sulfur dioxide by 95 percent and nitrogen oxides
by 86 percent, driven in part by a transition from coal to natural gas-fired generation.

Testimony of Manu Asthana
President & CEO, PJM Interconnection
PJM © 2021 www.pjm.com | For Public Use 10 | P a g e
PJM System Average Emission Rates
As a result of policy choices by some PJM states, evolving consumer preferences and technology advancements,
this decarbonization trend appears to be accelerating. PJM’s interconnection queue, consisting of generator projects
studying the possibility of development and interconnection into PJM’s grid, has expanded significantly and is
dominated by wind, solar, battery or hybrid projects.
Profile of New Generation Seeking to Interconnect onto the PJM Grid
The continued move toward decarbonization of the electric sector is a reality that PJM is committed to help facilitate
in a manner that ensures grid reliability and uses our regional scale and competitive markets, wherever possible, to
deliver efficiency for customers. It is a change that has great promise to spur new innovative technologies that can
support grid reliability.
Nevertheless, ensuring grid reliability through this transition will require deliberate and thoughtful effort and
partnership by and among several parties, including PJM, our states, our transmission and generation owners and
other stakeholders, FERC and NERC. The transition drives us and our stakeholders to consider a number of
overarching issues, including:

Testimony of Manu Asthana
President & CEO, PJM Interconnection
PJM © 2021 www.pjm.com | For Public Use 11 | P a g e
As we see an increasing level of intermittent resources in the supply portfolio serving PJM customers, we
could face energy prices falling significantly, due to declining marginal costs and the fact that these
resources using the wind or sun to generate power effectively have no fuel costs. At the same time, we will
need to ensure adequate compensation mechanisms for the back-up dispatchable generation – be it fossil
generation or batteries – that will be needed given the intermittent nature of renewables. This may make the
capacity market even more important in ensuring that we have adequate reserves. As an alternative, RTOs
and ISOs could develop and provide compensation mechanisms for new flexible ancillary services. PJM has
begun this process with FERC’s approval last year of our proposal to improve our overall pricing of reserves
needed to maintain reliability each day.
While the output of intermittent resources is less predictable on an individual unit basis, a substantial
portfolio of such resources across a wide, diversified geography will contribute to the capacity needs of
the system during peak periods. Along with our stakeholders, PJM is in the process of adopting a more
accurate approach, called effective load carrying capability, to calculate the capacity value of intermittent
resources during periods of peak demand. This will be an important component of our approach to
reliability in coming years.
Load forecasting, particularly in a post-COVID-19 environment, will prove to be more challenging. We have
already made substantial improvements in our load forecasting within PJM. However, as we face the
potential for more extreme weather, questions will be raised as to the extent to which we consider the
possibility of extreme weather conditions dramatically affecting the demand for electricity, and the level of
reserves that we need in order to “expect the unexpected.”
The proliferation of “behind-the-meter” distributed energy resources can enhance reliability and provide
customers with new self-help opportunities in times of system stress. However, for this to work well, we will
need to ensure adequate visibility as the system operator and the ability, with customer consent, to dispatch
those resources as a tool to ensure reliability. We have made a good start on this path through FERC’s
Order 2222, but this effort will require a great deal of communication, coordination and cooperation among
resource aggregators, customers, the system operator and the distribution utility.
In today’s paradigm, we set reliability requirements to avoid a triggering event that could occur in the loss of
load under a “one day in ten years” standard. However, as we have seen in many past situations, events
such as extreme temperatures don’t often occur as simple stand-alone events. Rather, there is often a
correlation of events, such as extremely cold temperatures coupled with ice storms, or the potential for
multiple cybersecurity intrusions, for which we need to plan. Great strides have been made in how we drill
and plan for these multiple events all hitting us at once, as I noted above. But the industry planning
standards will need to continue to evolve to incorporate the potential for an increased correlation of multiple
events occurring at the same time, and indeed, planning for more extreme scenarios is likely to come at
additional cost, which will need to be carefully considered. This will require an increased focus from the
industry as a whole as well, as by NERC and state and federal regulators.
I present these not as insurmountable challenges by any means, but as illustration of the need to coordinate the
timing and substance of policymaking, industry evolution and technological development, so as to ensure that we
continue to maintain a reliable power grid as we transition to a more decarbonized world.
Testimony of Manu Asthana
President & CEO, PJM Interconnection
PJM © 2021 www.pjm.com | For Public Use 12 | P a g e
Both the Congress and FERC play a key role in ensuring that the transition I described above occurs smoothly and
enhances grid reliability. For one, we need to ensure that the laws and the decarbonization goals that Congress,
FERC and the states set can be reliably implemented. The industry can adapt, and RTOs are an excellent vehicle –
as are the markets they administer – to reflect those policies in investment signals that help develop a cleaner
generation fleet. Communication between policymakers and grid operators will be key to crafting workable goals and
laws going forward.
On the markets side, there will need to be regulatory support for accommodating state policies regarding the
generation resource mix while also ensuring that we have the products (and adequate compensation to providers) in
place, in a timely manner, to meet the reliability needs of the system going forward. We are presently involved in a
series of workshops with our stakeholders on these very issues.
We are encouraged by a series of technical conferences which the Commission just announced to analyze the
impact of climate change on ensuring a resilient grid. At the end of the day, although regional differences exist, policy
direction would be helpful to ensure that all regions are working seamlessly toward the same goal using the same
playbook and applying the same minimum standards. By the same token, modernizing the existing transmission
system will provide a multitude of benefits, including designs that can withstand more extreme events, lower
frequency and shorten duration of outages, reduce public and employee safety risks, and use advanced technology
to improve system operability, efficiency and security.
In Conclusion
Thank you again for the opportunity to share PJM’s perspectives on these important issues that face our nation.
In closing, I want to reiterate that the reliability and security of the bulk power system continues to be PJM’s top priority.
As a large, interconnected grid, we ensure reliability through our markets, operations and regional transmission
planning and through the significant efforts of our member companies. PJM is committed to accommodating state
policy choices, and as we progress toward the Grid of the Future together, we must do so with reliability at the core of
our common purpose and with careful consideration of the costs customers will be asked to pay.
And we look forward to working further with Congress, FERC, NERC and our partners across the energy industry, as
well as our states and stakeholders, on additional actions to ensure reliability, affordability and resilience in a
changing world.