panel presentation on measuring progress towards
TRANSCRIPT

Panel Presentation on
Measuring Progress towards Sustainability: The State of the Science on Indicators and Metrics of Sustainability: Climate Change and Infrastructure Vulnerability
Satyajit Bose, Columbia University
June 4, 2015
Panel Questions
2
I. Provide an overview of the evolution of efforts to develop sustainability indicators/metrics, including cross-sectoral initiatives, since 2000.
II. What indicators and metrics have been found to be the most useful for promoting sustainability?
III. What knowledge gaps exist related to the development of effective and innovative sustainability indicators?
The Earth Institute at Columbia University
• The Earth Institute is a new form of academic institution designed to institutionalize interaction among many academic fields and professional disciplines to address the problems of global sustainability.
• We bring together the people and tools needed across ecology, engineering, environmental science, physics, law, public health, economics, political science, public policy, ethics and management to help address the problems of climate change, renewable energy, ecosystem maintenance, water quality, food production, air quality, waste management and the manufacture of goods and services with the least possible environmental impact.
• The Earth Institute is the largest research institute at Columbia University, comprised of nearly 800 full-time employees with an annual budget of roughly US$139 million.
• It includes over two dozen research centers and programs examining every aspect of sustainability. Our activities are deeply embedded within Columbia University, spanning three campuses and over 16 departments/schools.
• Our mission is to develop programs of research, education, outreach and practical application of knowledge to address the critical issues of sustainability.
3

Research Program on Sustainability Policy & Management
Launched in July 2013 to provide a rigorous analytic base to help inform sustainability decisions faced by investors, companies, organizations, and governments, and to help address implementation challenges.
• Objectives:
• To hasten the integration of sustainability principles in the management of private, non-profit, and governmental organizations by providing the data necessary for decision-making.
• To develop models to overcome barriers to institutionalizing sustainability in organizational operations.
• How:
• Research the mechanisms behind sustainability management to develop and promote more effective policies and organizational practices.
• We analyze sustainability strategies and initiatives, examine methods of measuring and valuing sustainability practices, and study the impact of policies that stimulate sustainability innovations and trends.
4

Potential Range of Indicators
• Many indicators of apparent unsustainability:• Poor air quality, contaminated water sources• Diminished soil health• Over- consumption and waste• Climate change impacts • Infrastructure vulnerability• Large imbalances in trade and investment flows• Unsustainable debt/anemic growth• Rising social inequality
• BUT also:• Higher incomes• Significant technological capacity• Scientific knowledge• Unprecedented access to energy
5

Metrics Database
• Sustainability Metrics: A study which we hope will ultimately serve as a foundation towards developing a set of generally accepted sustainability metrics.
• We created a database of nearly 600 environmental, social and governance metrics, conducted a review of frameworks and indices to measure performance, and examined financial benefits of sustainability.
• Results of this initial study is described in two white papers; two more papers will be completed this summer.
• The next stage of our study involves analyzing the frameworks and indices that aggregate these indicators, and paring down indicators to begin a process of settling on a common core that replicates the applicability and universality of financial indicators and generally accepted accounting principles.
6

Utility is in the Eye of the UserThe variety of metrics users:
• Corporate Management:
• Employees:
• Consumers:
• Investors:
• Regulators:
• Local Governments:
• National Governments:
• Ratepayers and Taxpayers:
The dynamics between these stakeholders vary widely across industries and regions.
7
Role of the Investor in Sustainability
Functions of Financial Markets:
1. Facilitate resource allocation of financial, physical, natural and human capital, spatially and across time, in an uncertain environment.
2. Risk-pooling and risk-sharing for households, firms, government.
3. Provide signals for decentralized decision-making.
8

Growth of the Investor in Sustainability
– Global sustainable investing assets under management rose from $13.3 trillion in 2012 to $21.4 trillion in 2014 (21% to 30% of professionally managed assets)
– Growth primarily in US, Canada & Europe
– Integrates environmental, social and governance factors into stock due diligence, portfolio selection and risk management.
9
Long Term Investors
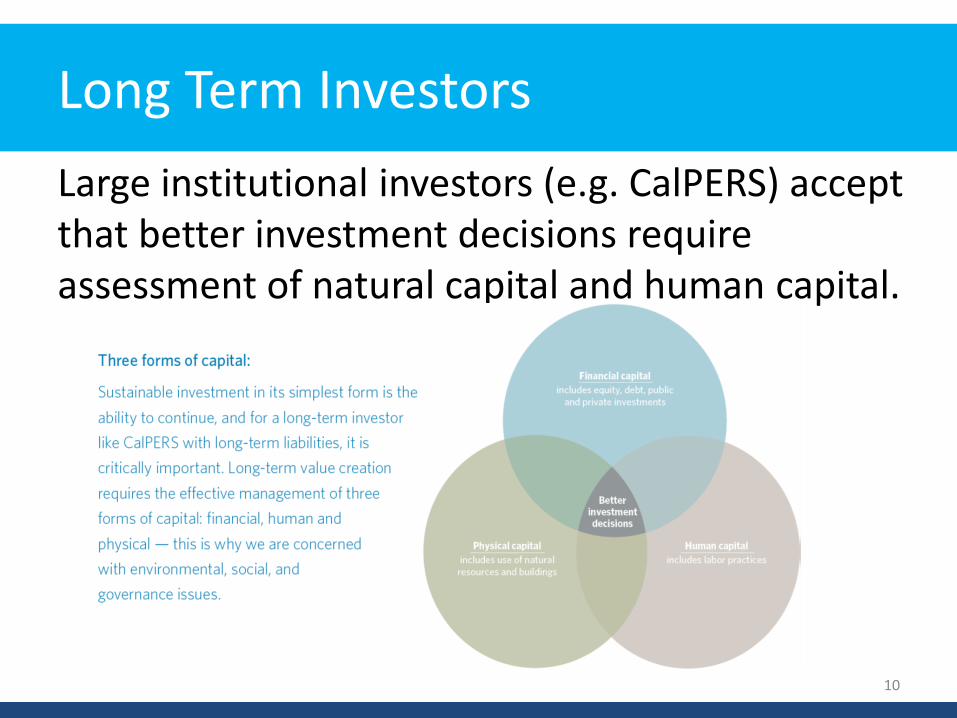
Large institutional investors (e.g. CalPERS) accept that better investment decisions require assessment of natural capital and human capital.
10

Green Accounting
• A prerequisite to reducing or eliminating environmental damage costs is to precisely measure those costs in monetary terms– Identify and allocate shared costs correctly to
‘clean’ and ‘dirty’ products
– Identify new revenue sources created by eco-efficient products and processes
– Evaluate the benefits of environmental action and the potential risks of inaction
– Design transverse payments for ecosystem services across jurisdictions
11
Green Accounting
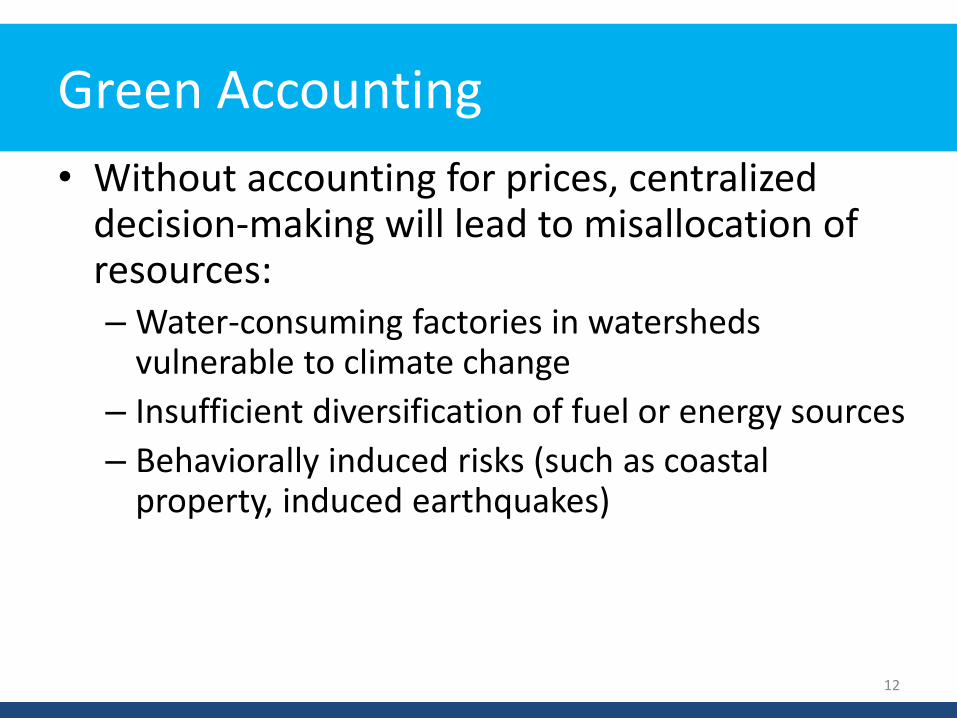
• Without accounting for prices, centralized decision-making will lead to misallocation of resources:– Water-consuming factories in watersheds
vulnerable to climate change
– Insufficient diversification of fuel or energy sources
– Behaviorally induced risks (such as coastal property, induced earthquakes)
12

Eccles, Serafeim & Krzus (2011)
13

Sustainability Metrics for Investors
Perception and data that ESG excellence signals competitive advantage:
• Signal of management quality
• Greater institutional ownership
• Lower cost of capital
• Leverage capacity
• High customer loyalty
• Efficient operations and supply chain
14

Wide Embrace of Sustainability Metrics
• GRI guideline sustainability reports rose from 50 in 2000 to 1,860 in 2010.
• CorporateRegister has 5,400 reports with sustainability information out of 8,220 reporting companies in 2010.
15

Value of Natural Capital is inversely related to extraction cost
16
Investor Due Diligence Process
17
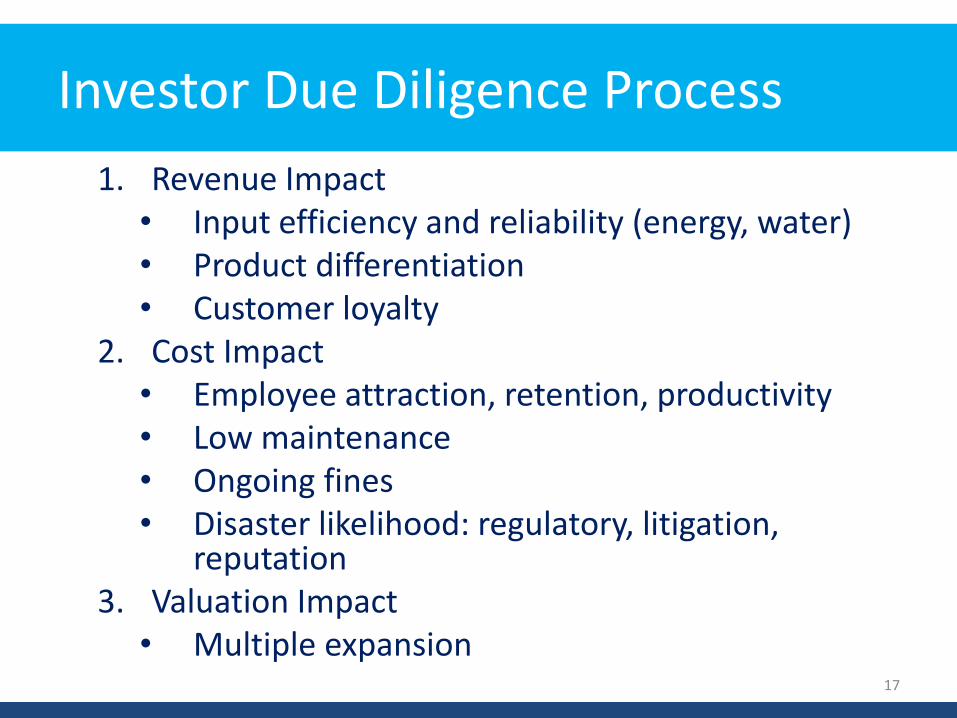
1. Revenue Impact• Input efficiency and reliability (energy, water)• Product differentiation• Customer loyalty
2. Cost Impact• Employee attraction, retention, productivity• Low maintenance• Ongoing fines• Disaster likelihood: regulatory, litigation,
reputation3. Valuation Impact
• Multiple expansion

Sustainability Metrics for Investors
• Standard ESG Metrics
• Multiple standards
• 20+ frameworks
• Hundreds of Key Performance Indicators (KPIs)
• Inconsistency in computation
• Composite Index Shortcomings:
• Arbitrary Weights
• Varying Weights
• Reward for Transparency rather than Performance
18
Eccles, Serafeim & Krzus (2011)
19
Eccles, Serafeim & Krzus (2011)
20
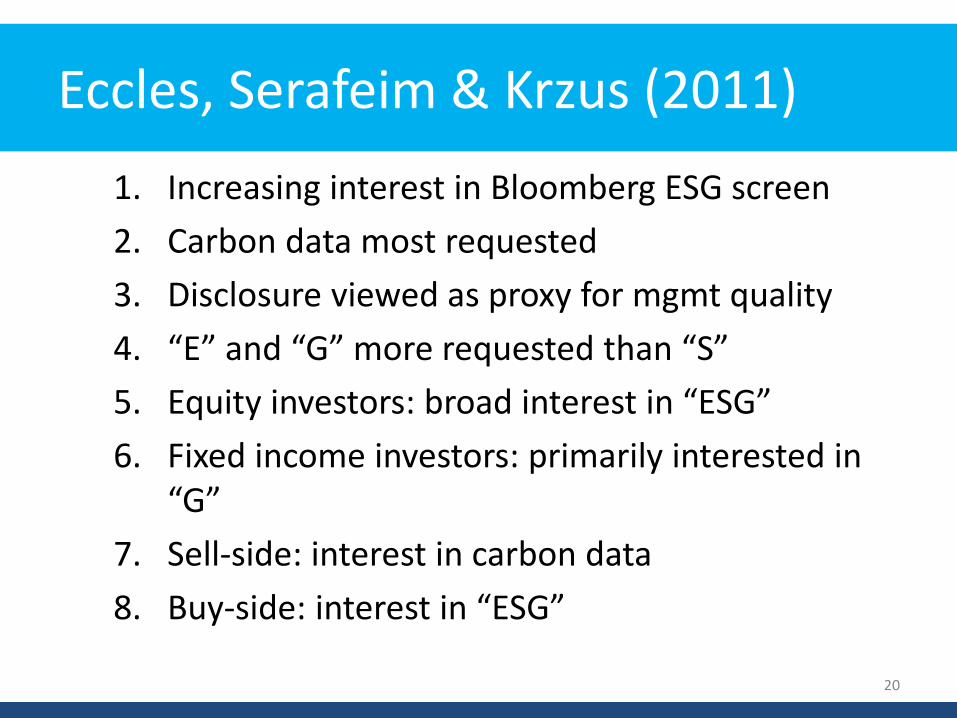
1. Increasing interest in Bloomberg ESG screen
2. Carbon data most requested
3. Disclosure viewed as proxy for mgmt quality
4. “E” and “G” more requested than “S”
5. Equity investors: broad interest in “ESG”
6. Fixed income investors: primarily interested in “G”
7. Sell-side: interest in carbon data
8. Buy-side: interest in “ESG”

Investor Metrics Ecosystem
21
• Frameworks: GRI, IIRC, CDP, UNPRI Stock Exchange Initiative
• Analysts: GMI Ratings, KLD/MSCI (bought GMI), Sustainalytics, ESG Analytics
• Raters: OEKOM, EIRIS, Inrate, Ethifinance, Vigeo
• Index Providers: FTSE4Good, DJSI, Corporate Knights
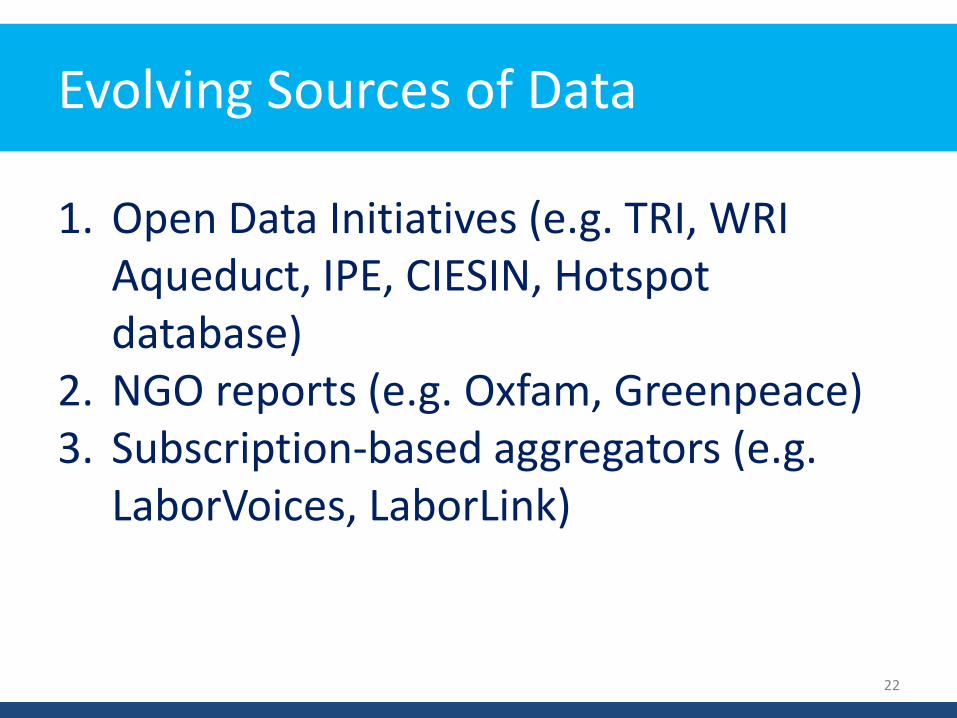
Evolving Sources of Data
22
1. Open Data Initiatives (e.g. TRI, WRI Aqueduct, IPE, CIESIN, Hotspot database)
2. NGO reports (e.g. Oxfam, Greenpeace)3. Subscription-based aggregators (e.g.
LaborVoices, LaborLink)
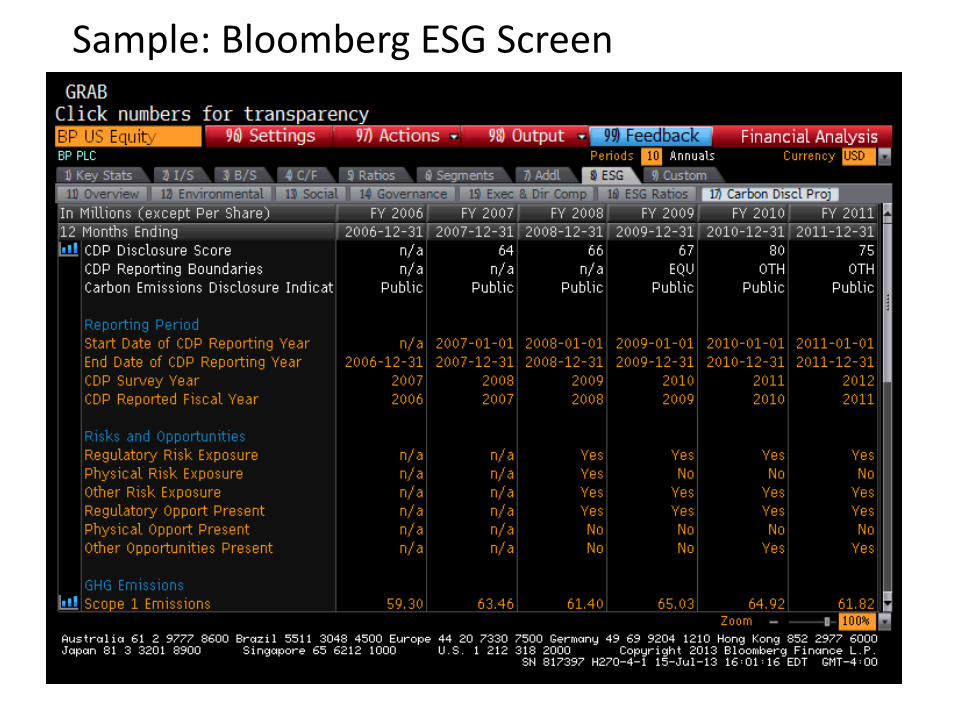
Sample: Bloomberg ESG Screen

Sample: GMI ESG Ratings
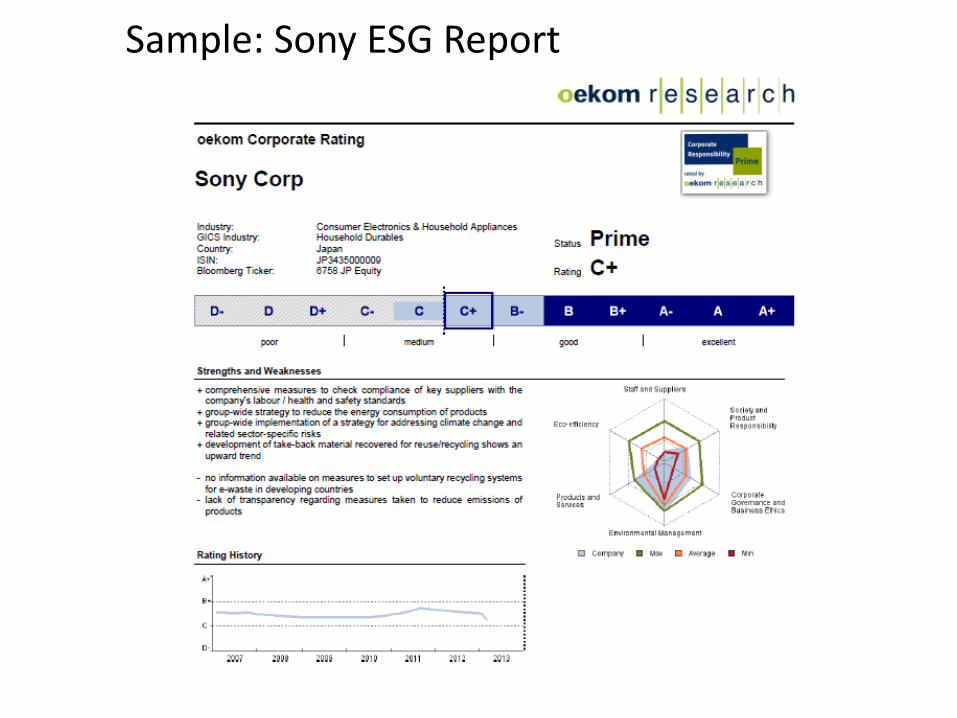
Sample: Sony ESG Report
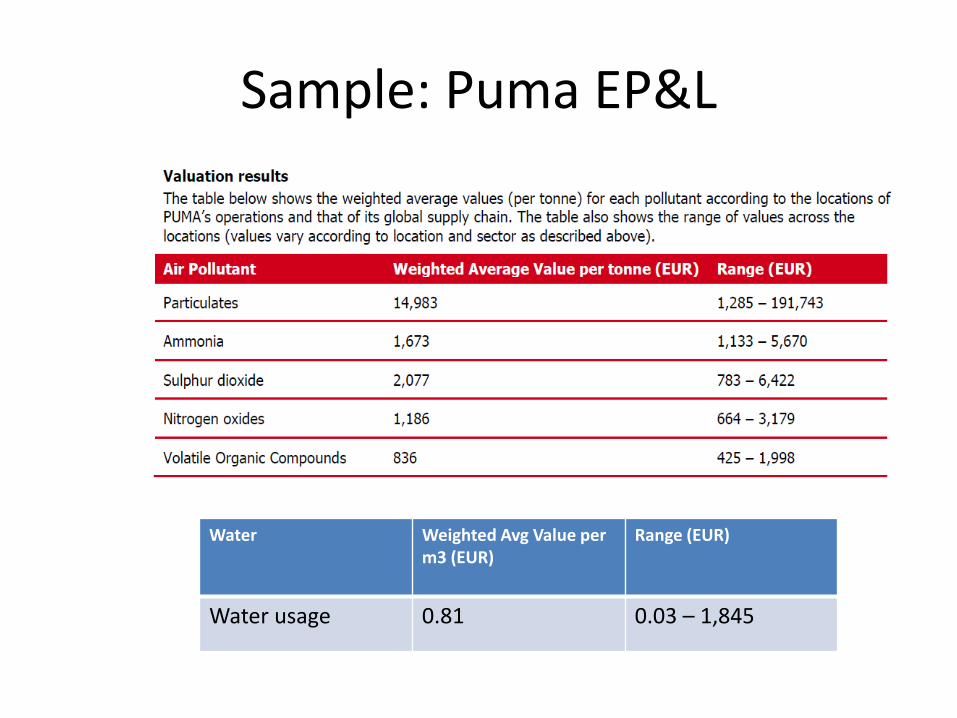
Water Weighted Avg Value per m3 (EUR)
Range (EUR)
Water usage 0.81 0.03 – 1,845
Sample: Puma EP&L
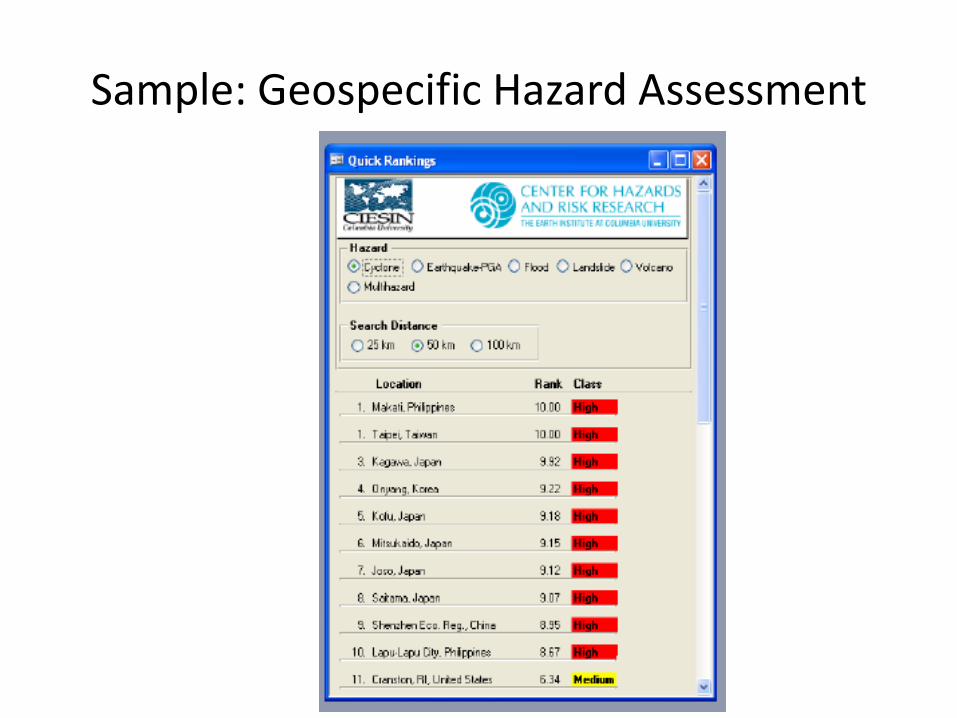
Sample: Geospecific Hazard Assessment
Knowledge Gaps / Challenges
28
1. Consensus
2. Regulation
3. Linking of Metrics to Value

Annual conflict risk and ENSO
29SM Hsiang et al. Nature 476, 438-441 (2011) doi:10.1038/nature10311

Natural Capital Affects Market Value
30
• Konar & Cohen (2001):
• (Legal) toxic releases and environmental lawsuits are negatively correlated with the market value of firm intangibles (after controlling for key financial variables)

Human Capital Affects Long Term Returns
31
• Undervalued Human Capital (Edmans, 2011):
• Contributes to persistent profits
• Not directly incorporated in stock prices
• Value-weighted portfolio of the “100 Best Companies to Work For in America” earned an annual four-factor alpha of 3.5% from 1984-2009, 2.1% above industry.

Stakeholder Relations increases Intangible Value
32
• Stakeholder relations are an investment in intangible value for providers of financial capital (Jiao, 2011):
• Ratio of market value of assets to replacement value increases with increases in stakeholder relations score
• Economically significant determinants of Firm Value (in order): Return on Assets, R&D/Sales, Sales Growth, Stakeholder Value

Panel Questions
33
I. Provide an overview of the evolution of efforts to develop sustainability indicators/metrics, including cross-sectoral initiatives, since 2000.
II. What indicators and metrics have been found to be the most useful for promoting sustainability?
III. What knowledge gaps exist related to the development of effective and innovative sustainability indicators?