panel sponsored by - milken instituteassets1c.milkeninstitute.org/assets/events/conferences/...asia/...
TRANSCRIPT


2
Panel Sponsored by

3
Blazing New Trails, Battling Old Obstacles
• Biotech Industry Overview• Recent Financial Performance of the Biotech Industry • New FDA Initiatives• R&D Initiatives / Product Pipelines• IP & Patent Protection• Pharmacoeconomics / Reimbursement• Biotech and the Capital Markets• M&A / Consolidation Opportunities• Prognosis for the Biotech Industry

4
Global Biotechnology at a Glance
5324161,8791,4574,284Public and private companies
4413311,7751,1153,662Private companies9185104342622Public companies
Number of companies6,5187,00534,180141,000188,703Number of employees
(19)(507)(608)(4,799)(5,933)Net income ($m)1754744,24411,53216,427R&D expense ($m)
$1,001$1,021$7,533$25,319$34,874Revenues ($m)Public company data
Asia/Pacific
CanadaEuropeU.S.GlobalOctober 1, 2000 – Sept. 30, 2001

5
Share of Global Biotechnology Revenues (2002)
Asia / Pacific
3%
Canada3%
Europe22%
U.S.72%

6
1600
1400
1200
1000
800
600
400
200
0
Number of Biotech Companies
Top Biotech Countries (2002)
U.S.C
anad
a
Ger
man
y
U.K
.
Fra
nce
Au
stra
lia
Sw
eden
Isra
el
Sw
itze
rlan
d
Fin
lan
d
Th
e N
eth
erla
nd
s
Den
mar
k

7
500
400
300
200
100
0
Number of Biotech Companies
Top U.S. Biotech States (2001)
CaliforniaM
assa
chu
sett
s
Mar
ylan
d
No
rth
Car
olin
a
Pen
nsy
lvan
ia
New
Jer
sey
New
Yor
k
Was
hin
gto
n
Geo
rgia
Texa
s
Flo
rid
a
Co
lora
do

8
Market CapitalizationCompression upAggregate market cap for the number of companies shown in eachsegment ($B)
Compression downNumber of companies occupying each market cap segment
$0
$50
$100
$150
$200
$250
$300
<$200M $200-$400M
$400-$600M
$600-$800M
$800M-$1B
$1-$5B $5-$10B >$10B
Mar-00
Dec-02
0
50
100
150
200
250
<$50M $200-$400M
$600M-$800M
$1-$5B >$10B
Mar-00
Dec-02
141346 60 57 35 2329
11 12 7
67
22
11
7
11
2

9
Index Performance
40%
60%
80%
100%
120%
140%
160%
3/28/2001 9/28/2001 3/28/2002 9/28/2002 3/28/2003
NBI
Nasdaq
60%
70%
80%
90%
100%
110%
120%
3/28/2001 9/28/2001 3/28/2002 9/28/2002 3/28/2003
S&P 500
S&P 500 PharmIndex
I. Nasdaq Biotech Index vs. NasdaqComposite
II. S&P 500 vs. S&P PharmaIndex

10
2003200220012000
40
30
20
10
0
Aggregate Amount (US$ Billions)
$37.3
$16.2
$11.6
$1.7
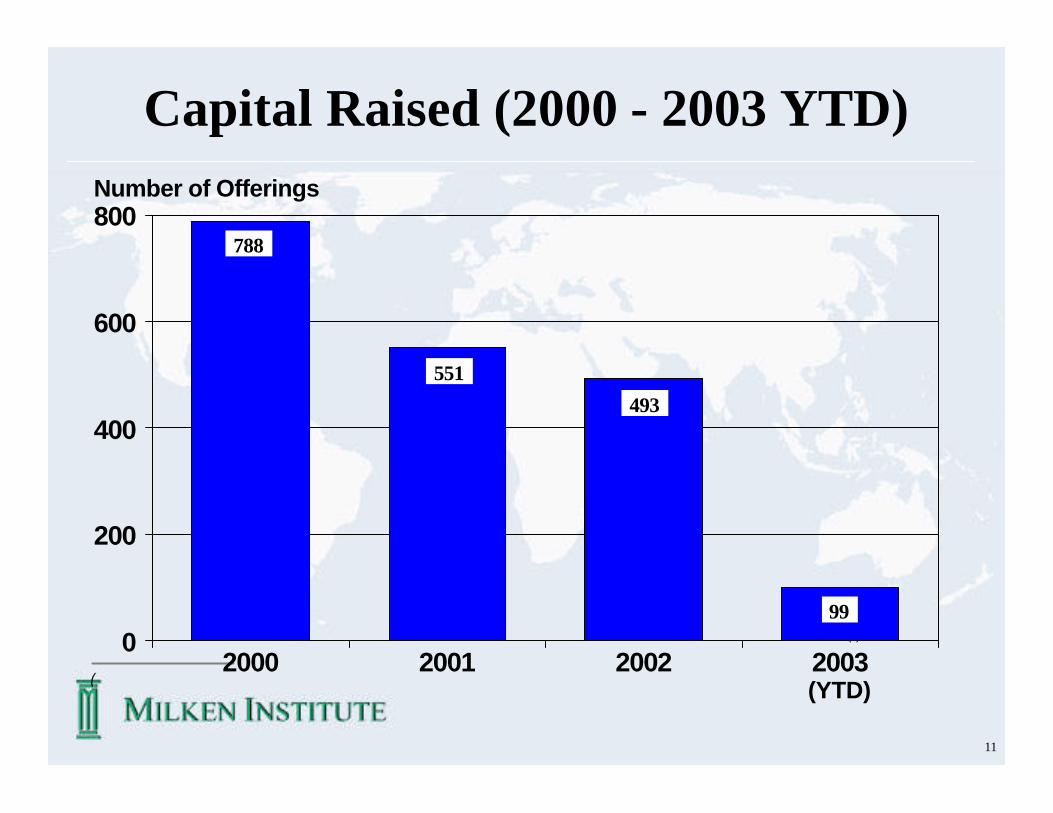
Capital Raised (2000 - 2003 YTD)
(YTD)
11
Capital Raised (2000 - 2003 YTD)
(
(1)
2003200220012000
800
600
400
200
0
Number of Offerings
788
551
493
99
(YTD)

12
2003200220012000
700
600
500
400
300
200
100
0
Number of Issuers
616
458421
99
Capital Raised (2000 - 2003 YTD)
(YTD)

13
Industry Overview• The industry has over 1,800 drugs in
development, including:– 98 new medicines for AIDS– 400 new medicines in development for cancer– 200 medicines in development for children– 120 new medicines of heart disease and stroke– 176 new medicines in development for neurological
diseases– 780 new medicines in development for older
individuals
Life Sciences Overview

14
• The industry has numerous tools and techniques to fight disease, including:– Monoclonal Antibodies– Vaccines– Interferon– Antisense drugs– Gene Therapies– Interleukins– Recombinant Soluble Receptors
Life Sciences Overview
15
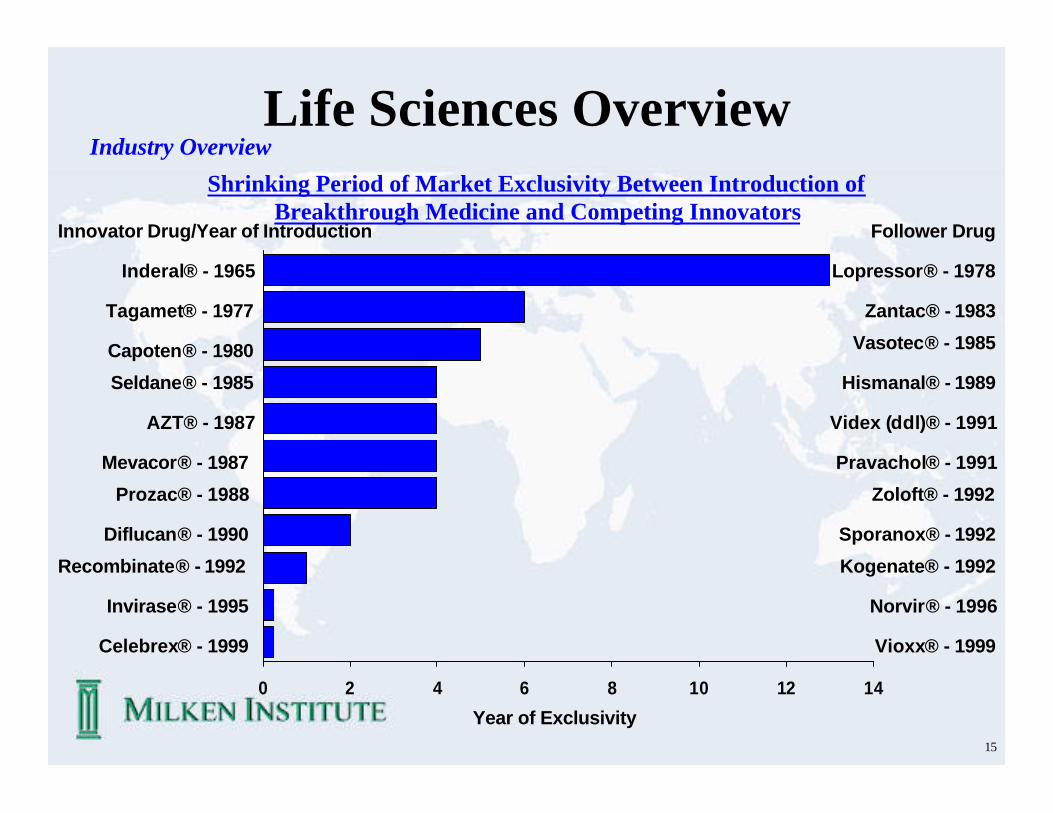
Life Sciences Overview
0 2 4 6 8 10 12 14
Inderal® - 1965
Tagamet® - 1977
Capoten® - 1980
Seldane® - 1985
AZT® - 1987
Mevacor® - 1987
Prozac® - 1988
Diflucan® - 1990
Recombinate® - 1992
Invirase® - 1995
Celebrex® - 1999
Lopressor® - 1978
Zantac® - 1983
Vasotec® - 1985
Hismanal® - 1989
Videx (ddl)® - 1991
Pravachol® - 1991
Zoloft® - 1992
Sporanox® - 1992
Kogenate® - 1992
Norvir® - 1996
Vioxx® - 1999
Follower DrugInnovator Drug/Year of Introduction
Year of Exclusivity
Industry Overview
Shrinking Period of Market Exclusivity Between Introduction of Breakthrough Medicine and Competing Innovators

16
Life Sciences OverviewIndustry Overview
• Access to approved drugs and pipelines is a critical success factor• Life science companies have increasingly used strategic alliances to
increase revenues
– Increasing Frequency of Strategic Alliances % of 2001 Revenues from Licensed Products
121
235 248 269319 324
428 415
480439
495
637 657 637
724
0
100
200
300
400
500
600
700
800
1986
1987
1988
1989
1990
1991
1992
1993
1994
1995
1996
1997
1998
1999
2000
45
35 34
24
2018
16 16 15
10
0
5
10
15
20
25
30
35
40
45
50
ABT JNJ BMS PHA AVE AZN PFZ MRK GSK NOV
17
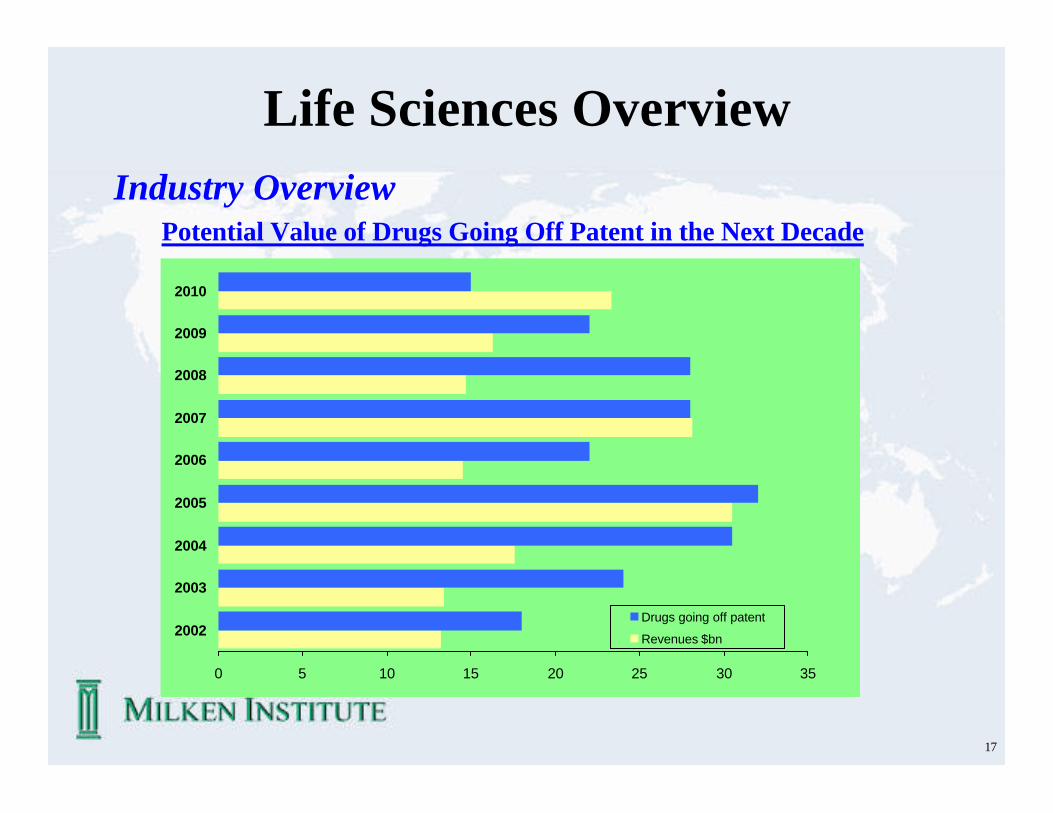
Life Sciences OverviewIndustry Overview
Potential Value of Drugs Going Off Patent in the Next Decade
0 5 10 15 20 25 30 35
2002
2003
2004
2005
2006
2007
2008
2009
2010
Drugs going off patent
Revenues $bn
18
2000199819961994199219901988
35
30
25
20
15
10
5
0
Mean Approval Time (Months)
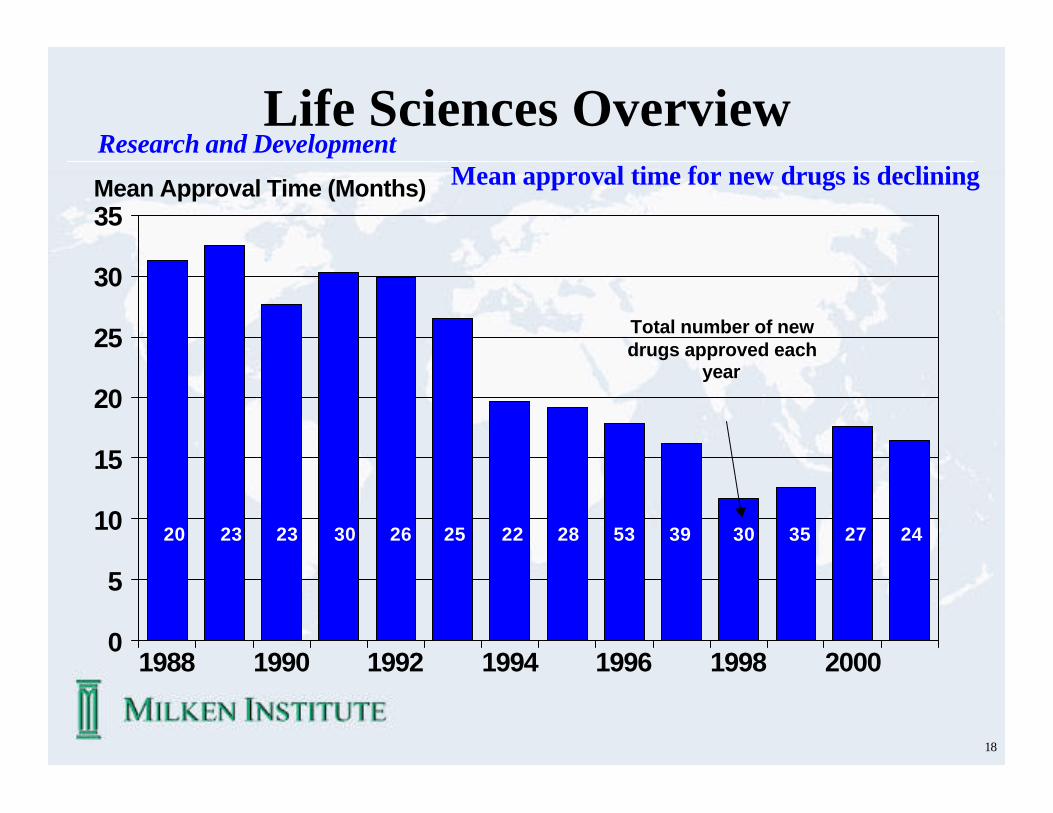
Life Sciences OverviewResearch and Development
Mean approval time for new drugs is declining
Total number of new drugs approved each
year
20 23 23 30 26 25 22 28 53 39 30 35 27 24

19
Life Sciences Overview
•The pharmaceutical industry is the most research-intensive major industry in the United States•The industry spends over $30 billion in R&D – more than the $20 billion approximate operating budget of the NIH•R&D represents approximately 18% of sales•Average cost of developing a new drug is now more than $800 million•Four drivers of increased costs
–More complex diseases–High attrition rates–More demanding development requirements–Increasing scale and globalization
$54
$231
$802
$0
$100
$200
$300
$400
$500
$600
$700
$800
$900
1976 1987 2000
($ in Millions)
5.1 5.9 6.1
2.5
4.4
5.56.3
2.4
2.1
2.81.8
3.2
0
2
4
6
8
10
12
14
16
1960s 1970s 1980s 1990sApproval Phase Clinical Phase Preclinical Phase
Development Time (Years)
8.1
11.6
14.2 14.2
).
Research and Development

20
Rising R&D Yields Fewer Drugs
020098969492908886848280
60
50
40
30
20
10
0
24
20
16
12
8
4
0
Number Percent Change, Year Ago
New Drugs Approved - LR&D - R

21
Biotech Patents Granted in U.S.
U.S. Origin
Foreign Origin
0201009998979695949392919089
6
5
4
3
2
1
0
Number (000s)

22
New FDA Initiative
• Reducing review cycles– Deadlines for informing sponsors on deficiencies in NDAs and
BLAs• Improving quality, efficiency of reviews
– Enhanced reviewer training – Peer review process within FDA– Develop new standards for the review process
• New guidance documents– Cancer, diabetes, obesity– Emerging technologies focused on
• Cell and gene therapy• Pharmacogenomics• Novel drug delivery

23
New FDA Initiative
• Biodefense– “Operation Bioshield” – $6-8 billion earmarked for new products
• Biogenerics– Estrogens– Insulin– Human growth hormone– Liposomes

24
Approval WatchSelected Therapeutics Under Regulatory Review
Company Product Indication Status Partner
Alkermes Risperdal Consta Schizophrenia U.S. J&J
Atrix Leuprogel Advanced prostate cancer U.S./EU MediGene; Sanofi
Biogen Amevive Psoriasis U.S./EUBioMarin Aldurazyme Mucopolysaccharidosis I U.S./EU Genzyme
Corixa Bexxar Non-Hodgkin's lymphoma U.S. GIaxoSmithKline
Cubist Cidecin Complicated skin and skin structure infections
U.S.
CV Therapeutics Ranexa Chronic angina U.S.
Genelabs AnastarSystemic lupus erythematosus EU
Genentech Xolair Asthma U.S. Tanox, NovartisGenentech Raptiva Psoriasis U.S. XomaGenzyme Fabrazyme Fabry's disease U.S.Gilead Coviracil HIV/AIDS U.S.
Guilford Gliadel WaferNewly diagnosed malignant glioma
U.S.
Icos Cialis Erectile dysfunction U.S. Eli LillyMedimmune FIuMist Influenza Wyeth
Prevent chemotherapy-inducednausea and vomiting
Neurobiological Memantine Alzheimer's disease U.S.Forest; Lundbeck; Merz Oxford
Oxford GlycoSciences
Zavesca Gaucher’s disease U.S. Actelion
Pozen MT 100 Migraine EUPozen MT 300 Migraine U.S.
SuperGen OrathecinRefractory pancreatic cancer
U.S.
Transkaryotic Replagal Fabry's disease U.S.Trimeris Fuzeon HIV/AIDS U.S/EU Roche
Vertex GW433908 (VX-175) HIV/AIDS U.S. GIaxoSmithKline
MGI Pharma Palonosetron U.S. Helsinn

25
Upcoming MilestonesSelected Compounds with Data or Regulatory Submissions Expected in 2003
Indication Status Milestone Partner(s)Graft-versus-host disease Ph II/III Data I Q03 SangStatSpasticity in spinal cord injury
Ph III Data mid-03 Elan
Postoperative ileus Ph III Data I Q03 GIaxoSmithKline Brain metastases Ph III Data I H03; submit
NDA 2H03Type II diabetes Ph III Data I H03 AlkermesType I & 11 diabetes Approvable NDA amendment I
Q03 Kidney cancer, melanoma Ph III Interim data end of
03Non-Hodgkin's lymphoma Ph II/III Data I H03 InexVascular imaging with MRI Ph 111 Data spring 03; file
NDA 3Q03Pfizer
Wet age-related macular degeneration
Ph III Data 3Q03
Bristol-Myers;Merck KGaA
Dry eye PhIII Data IQ03Upper respiratory infection Ph III Data 2Q03Complicated skin and skin Ph III Data I H03 structure
infectionsNon-small cell lung cancer Ph III Data March 03 Eli LillyLupus nephritis Ph III Data early 03
Osteoporosis Ph III Data 03 Pfizer Multiple myeloma Ph III Submit NDA and
MAA early 03 Non-small cell lung cancer Ph III Results summer 03 Genentech; Roche Myelodysplastic syndrome Ph III Submit NDA 03Obesity Ph III Data early 03Insomnia Ph III File NDA Feb 03 AventisPulmonary arterial hypertension
Ph II/III Meet w/ FDA end Jan 03
Icos
Esophageal candidiasis Ph III Data I Q03; file NDA April 03
Merck data March 03
Colorectal cancer Refusal-to-file letter

26
Shareholder Value Creation
2 Products11 Clinical Molecules4 Franchises(NOL $300M 2003)
Founding1993
Breakeven Through
Product Sales2003-2005
5 Years Post Breakeven
20%+ Growth2006-2010
10 Years Post Breakeven
20%+ Growth2011
Crossing the Chasms

27
Class I: Truly Precedented(Drug Efficacious in Humans w/ Disease)
Class II: Cellular Pathway is “Validated”(in Humans w/ Disease by a Drug (IIA) or a Mutation (IIB)
Class III: Truly Unprecedented(Validation only in Animals and Human Cell/Tissue by Expression; Putative Mechanism Defined (IIIA) or Undefined (IIIB)
Levels of Precedence For Targets

28
New Biotech Drug and Vaccine Approvals
0200989694929088868482
35
30
25
20
15
10
5
0
Number

29
Number of U.S. Biotech Firms
2001200019991998199719961995199419931992
1600
1400
1200
1000
800
600
400
200
0
Number

30
U.S. Biotech IPOs
0200989694929088868482
70
60
50
40
30
20
10
0
Number

31
Cost and Benefit of Cancer Drugs
* Growth Colony Stimulating Factor
Without G-CSFWith G-CSF
85
80
75
70
65
60
55
50
US$ Thousands
G-CSF* reduces hospital costs for cancer patients

32
Cost and Benefit of Breast Cancer Anticancer Drug
Cost of SurgeryCost of Oral Anticancer Drug
14
12
10
8
6
4
2
0
US$ Thousands

33
Reduction in Labor Costs and Cost of Drug Treatment
500
400
300
200
100
0
Cost per Employee per Month
Decrease in Lost Productivity
Cost and Benefit of Migraine Medication
Migraine medication reduces employers’ labor costs and decreases lost productivity

34
Cost and Benefit of Chicken Pox Vaccination
Without VaccinationWith Vaccination
600
500
400
300
200
100
0
US$ Millions
Loss-of-Work Costs
Medical Costs
Vaccination reduces loss-of-work

35
Savings in ReducedTreatment Cost of
7
6
5
4
3
2
1
US$ Millions per 1,000 Treated Patients
Cost and Benefit of Clot-Busting Drug
Use of Clot-Busting Drug Reduces Patients’ Disability and Results in Net Savings to Health System
Clot-Busting Drug Patient Rehabilitationand Nursing-Home Costs

36
New Medicines in Development for AIDS
AntifungalsAnti-Infectives
ImmunomodulatorsVaccines
AIDS-Rel. CancerAntivirals
40
30
20
10
0
Number

37
New Medicines in Development for Cancer
ProstateSkinColonBreastLung
70
65
60
55
50
Number

38
New Medicines in Development for Children
0 5 10 15 20 25
Vaccines
Cardiovascular Disease
Infectious Bacterial Disease
Psychiatric Disorders
Cystic Fibrosis
Asthma
Skin Disorders
Neurologic Disorders
Genetic Disorders
AIDs and AIDS-Related Disorders
Number

39
New Medicines in Development for Heart Disease and Stroke
0 5 10 15 20
Stroke
Congestive Failure
Peripheral Vascular Disease
Hypertension
Adjunctive Therapies
Hyperlipidemia
Heart Attack
Number

40
New Medicines in Development for Neurologic Diseases
Migraine Stroke
Multiple SclerosisParkinson's
Alzheimer'sBrain Tumors
Pain
45
40
35
30
25
20
15
10
5
Number

41
New Medicines in Development for Older Americans
0 10 20 30 40 50
Parkinson’s Disease
Bladder/Kidney Disorders
Osteoporosis
Skin Conditions
Pain
Gastrointestinal Disorders
Depression
Alzheimer’s Disease/Dementias
Rheumatoid Arthritis
Diabetes
Respiratory/Lung Disorders
Number

42
Rising Cost of Developing a New Drug
200019871976
1000
800
600
400
200
0
US$ Millions

43
Growth in Ethical Pharmaceuticals’ Domestic R&D and R&D Abroad
Domestic
Abroad
00989694929088868482807876747270
25
20
15
10
5
0
US$ Billions

44
R&D Expenditures for Human-Use Pharmaceuticals
2001200019991998
100
80
60
40
20
0
Percent
DomesticAbroad

45
$10.9 Billion
$6.3 Billion
$3.5 Billion
$864 Million
$206 Million
2002*
$27.5 Billion
$0.4 Billion
$3.9 Billion
$15.9 Billion
$7.3 Billion
2000
$3.7 Billion
$11 BillionVenture
$7.0 Billion
$3.6 Billion
Other
$13.8 Billion
$21.4 Billion
Total
$2.8 Billion
$4.4 Billion
Follow Ons
$0.3 Billion
$2.4 Billion
IPOs
20011999
Investment in Biotechnology

46
Investment in Biotechnology
2002200120001999
16
14
12
10
8
6
4
2
0
US$ Billions
IPOS Follow OnsVenture Other

47
1H1032H1021H1022H1011H1012H1001H1002H991H99
25
20
15
10
5
0
30
24
18
12
6
0
US$ Billions Number
Number of Deals
Total Amount
(Adj.)
Merger Trends in the Biotech Industry(Announced Value and Number of Transactions)

48
$1.25 MillionNXY – 059
REN – 1654
Other Assets
$34 Million in Preferred Stock
Small But Important

49
Small But Important
$55.9 MillionAlfimeprase

50
$196 Million
Genomics Leader Branches Out Into Drug Discovery

51
2001 Mega Deals
$1.3 Billion $2 Billion

52
2002 Mega Mega Deal
$16 Billion

53
2003 Mega Deal
$2.4 Billion

54
NMEs/PLAs/BLAs: Trend in Number Approved Reflects Number Filed
2001200019991998199719961995199419931992
70
60
50
40
30
20
10
0
70
60
50
40
30
20
10
0
Approvals Number Filed
Approvals - L
Number Filed - R

55
Prescription Drugs Emerging With a Central Role in US Health Care
200019991998199719961995199419931992
3.0
2.5
2.0
1.5
1.0
0.5
0.0
Number of Dispensed Prescriptions (Billions)

56
1996 -19981991-1995
Prior, Foreign Marketing of New Drugs Approved in the US
US Patients Increasingly First to Have Access/Exposure to New Drugs
<1 yr prior mktg, 31%
U.S. 1st market, 47%
6-10 yrs prior mktg, 5%
>10 yrs prior mktg, 4%1-5 yrs prior
mktg, 14%
<1 yr prior mktg, 12%
U.S. 1st market, 31%
6-10 yrs prior mktg, 10%
>10 yrs prior mktg, 9%1-5 yrs prior
mktg, 37%

57
New Products Revenue Potential: 2003
• Risperdal Consta $500• Symlin $100m• Amevive $400m• Humera $2b• Xolair * $250m• Fabrazyme $150m• Hepsera $200m
• Cialis $500m• Flumist $450m• Iressa $350m • Xanelim * $200m• Palonosetron * $200m• Cidecin $300m• Fuzion (T-20) $300m

58
Genentech – Best Number of “Shots on Goal”
• Rituxan: Rheumatoid Arthritis• Xolair: Asthma• Xanelim (Raptiva): Psoriasis• Tarceva: NSCLC• Avastin: Colorectal Cancer• 2C4: Breast & Solid Tumors

59
Can You Generate a Return in Biotech???
• $5.8 Billion in Revenue Potential being Introduced to the Market during 2003!
• If You Believe the Street Research!!!

60
A Science-Driven Growth Industry
• Developing new drugs for human healthcare using novel technologies
• High-margin products protected by patents or market exclusivity
• Long R&D development phase (7-10 years)• High R&D expenses ($300MM+ per drug)• Regulatory hurdles

61
The Biotech Sector at a Glance
• Emerging Industry - solid fundamentals– Approximately 330 publicly-traded stocks– 70 biologics on the market
• 35 of these 70 approved in past three years
– 369 products in development; 175 in cancer– Vast majority of companies are unprofitable

62
Characteristics of Biotech Stocks
• Aggressive growth• High-risk, volatile stocks• Event-driven:
– Clinical results; regulatory events– Product launches– Product sales and earnings– Corporate collaborations

63
Investment Thesis
“Products and Pipeline” • Sector performance will be driven by
select stocks• Focus on companies with products on the
market or in late stages of development• Identify near-term events to drive price
appreciation
64
Investment Criteria
• Broadly-applicable proprietary technology
• Products address major markets• Experienced management team• Strong financial position• Corporate collaborations• Attractive valuation on a comparative
basis

65
Valuation Approach
• Forward P/E ratios– Hx.Average for the sector: 50-55x
• Forward P/E to growth rates (PEG)– Hx.Average for the sector: 2.0x
• Near-term events– New product approvals; significant clinical
data

66
New Drugs for Prostate Cancer
• Models to study• Learn biology• Targeted gene expression studies• Clinical trial endpoints

67
** As of 5/31/02
Capital Raised by Public Biotech Firms
020098969492908886848280
30
25
20
15
10
5
0
US$ Billions

68
Revenues for Selected Biotech FirmsGenentech, Amgen, Biogen, Chiron and Genzyme
0098969492908886848280
10
8
6
4
2
0
US$ Billions

69
U.S. Biotech IPOs
0200989694929088868482
70
60
50
40
30
20
10
0
Number
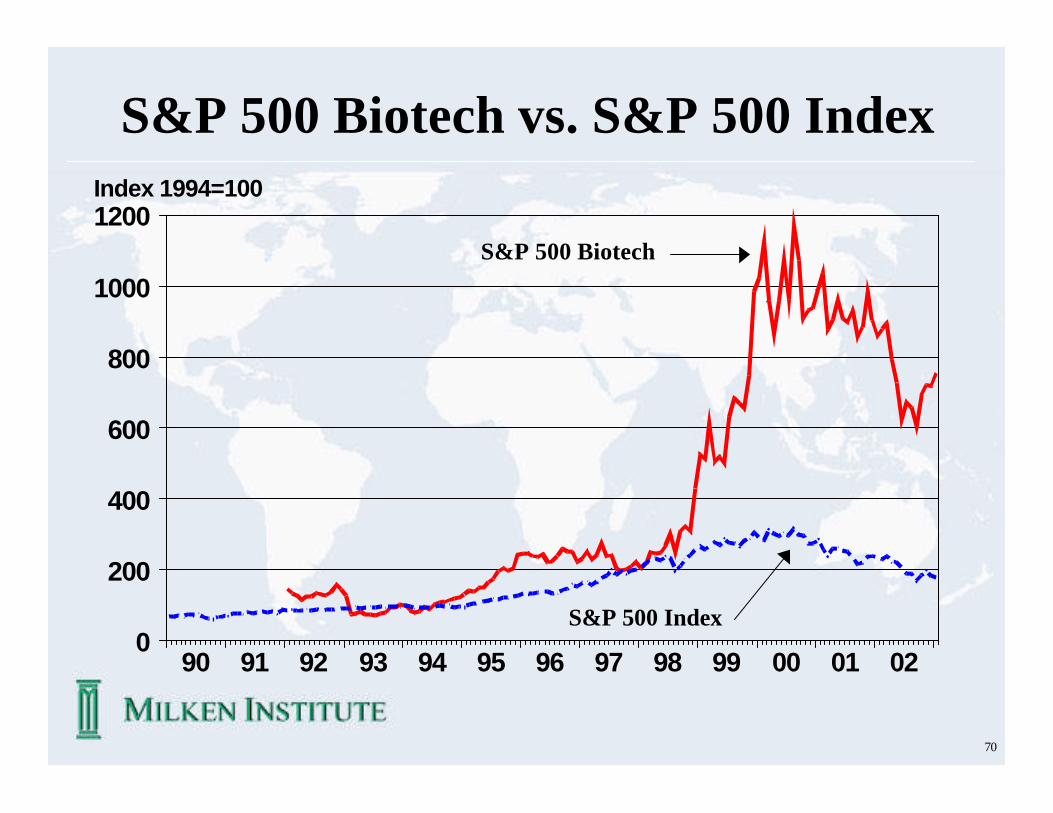
70
02010099989796959493929190
1200
1000
800
600
400
200
0
Index 1994=100
S&P 500 Biotech vs. S&P 500 Index
S&P 500 Index
S&P 500 Biotech

71
Biotech Deals and Dollars Raised
2001200019991998199719961995199419931992
160
140
120
100
80
60
40
20
0
24
21
18
15
12
9
6
3
0
Number US$ Billions
Number of Deals - LAverage Amount Raised - R
72
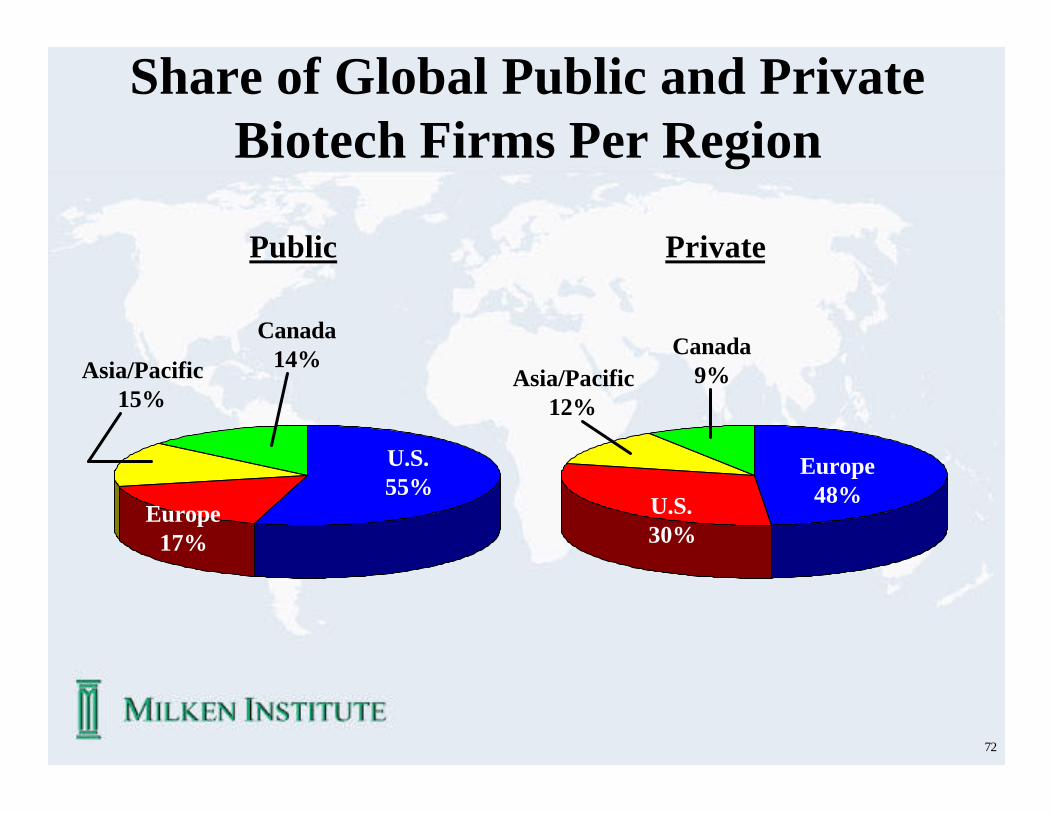
Share of Global Public and Private Biotech Firms Per Region
Asia/Pacific15%
U.S.55%
Europe17%
Canada14%
Asia/Pacific12%
U.S.30%
Europe48%
Canada9%
Public Private