panera bread company 2005 annual report to stockholders
TRANSCRIPT

Panera Bread Company
2005 Annual Report to Stockholders


Dear Shareholders, What an exhilarating year we just completed. Over the full year 2005, system-wide comparable bakery-cafe sales grew 7.8% (7.4% for Company-owned locations and 8.0% for franchise-operated locations). These strong comps helped drive average weekly sales to $38,318, or just shy of $2 million per bakery-cafe annually. In addition, we opened a bakery-cafe every third day or so—139 to be exact—in 2005 (66 Company-owned locations and 73 franchise-operated locations). Strong growth in new cafe openings and strong comparable bakery-cafe sales growth fueled Company revenue growth of 34%, to $640.3 million. In 2005, system-wide bakery-cafe sales reached almost $1.6 billion ($0.5 billion for Company-owned locations and $1.1 billion for franchise-operated locations), driving Company earnings per share (EPS) to $1.65, up 32% over 2004 EPS. By year-end 2005, Panera Bread bakery-cafes numbered 877 system-wide, 311 of which were Company-owned, and 566 of which were franchise-operated. Panera ended the year with nearly $71 million in cash and investments, and no debt. The byproduct of strong Company performance was a 69% rise in the value of Panera stock during 2005. What is even more exciting is that Panera’s stock performance has been the best in the industry for the last decade. As the Wall Street Journal recently reported in its “Shareholder Scorecard,” Panera was the top-performing large restaurant stock not only last year, but also in the past five- and ten-year time frames as well. We believe this speaks to the strength of our concept and the potential that still lies ahead. 2005 SUCCESS FACTORS What enabled Panera to succeed in 2005 and over the last decade? Simply put, it is our concept and our execution. We think our continued commitment to providing crave-able food that people trust, served in a warm, community gathering place by associates who make our guests feel comfortable, really matters. When this is rooted in our commitment to the traditions of handcrafted, artisan bread, something special is created. As we say here at Panera, it’s our Product, Environment, and Great Service (PEGS) that we count on to deliver our success —year in and year out. More than ever before, customers today care deeply about the origin and quality of ingredients that comprise the foods they eat. In 2005, several winning products reaffirmed our commitment to food that people can trust. A prime example was our all-natural, antibiotic-free (ABF) chicken. While there are significantly higher costs associated with sourcing ABF chicken, we realized that Panera customers expected chicken of that quality at Panera. Accordingly, customer response to products like our Chicken Bacon Dijon sandwich and our Asian Sesame Chicken Salad has been extremely positive. In April 2005, the USDA began to recommend in its food guide pyramid that half of all daily intake of grains in a balanced diet be whole grains. At Panera, we’re proud to say that we were ahead of the curve in developing a line of whole grain bread. We recognized in late 2004 that customers cared very much about eating ‘good’ carbohydrates. So our bakers developed what became our popular line of whole grain bread, using the finest ingredients we could find. In 2005, we introduced a new line of artisan sweet goods. Made with gourmet European butter, fresh fruit toppings and delicious new fillings, these bakery items represent a significantly higher level of taste and quality. They reaffirm our commitment to the “Magic of the Bakery,” and are what our guests expect from Panera. We also began selling our egg soufflés in 2005, which offered our guests the option of a hot, egg-based item to start off their mornings. Baked in a flaky pastry shell with a hearty egg filling, this new item became a crave-able addition to our breakfast menu. Our soufflés were well-received by our customers, and ultimately fueled morning sales growth.

This past year also marked the first full year of our Via Panera Fresh Catering program. Via Panera allows our customers to enjoy our quality sandwiches, salads, soups, and breakfast items in the workplace, at school, and at home. It gives us the opportunity to grow our lunch sales without expensive investments in large physical plants. Our catering division is now almost an $80 million business in its own right, delivering over 5% of our system-wide sales today. Via Panera has considerable momentum, and we see opportunity for significant growth in the future. At Panera, we believe that crave-able products you can trust ought to be enjoyed in environments that engage you, such as our new G2 bakery-cafe design. Central to the G2 format is our bread heritage, which is expressed through a brighter, more open bakery display case, and original, bread-focused artwork. The G2 design also enhances our traditional environment with higher quality furniture in a bakery-cafe full of defined, intimate spaces that meet the various needs of our customers. If you haven’t already, we invite you to experience this exciting new format in a bakery-cafe near you. When you visit us, please try our free Wi-Fi. By year-end 2005, almost all of our 877 bakery-cafes (311 Company-owned and 566 franchise-operated) were Wi-Fi hot spots, making Panera Bread one of the nation’s leading providers of managed, free Wi-Fi Internet access. We are proud that these efforts have made us the only major restaurant business distinguished as a “2005 Technology Innovator” by Fast Company magazine. We’ve always considered free Wi-Fi part of our commitment to making our bakery-cafes the open community gathering places that we envision them to be. So we were very pleased when the New York Times identified Panera Bread bakery-cafes as the work environment of choice for traveling businesspeople and students nationwide. We believe great service is the third key to our track record of success. We are particularly proud of our high performance in the prestigious Sandelman & Associates survey of more than 62,000 consumers, which ranks 120 restaurant concepts on overall customer satisfaction. For four years running, Panera has been in either first or second place in customer satisfaction. Last year, 56% of Panera’s guests rated their last visit to Panera “Excellent” on the Sandelman survey. 2006 OUTLOOK For 2006, we are targeting earnings per share of $1.91 to $1.95 including the impact of expensing options, which we adopted effective December 28, 2005. If we attain these targets, we would generate EPS growth of 26% to 28% including the expensing of options in both 2005 and 2006. Our EPS target is based on our individual targets for key metrics. In 2006 we are targeting 150 to 160 new bakery-cafe openings (70-75 Company-owned and 80-85 franchise-operated), average weekly sales of $39,200 to $40,200, and comparable bakery-cafe sales of 4% to 6%. I am pleased to say we are off to a great start in the first quarter of 2006, with system-wide same store sales growth of 9% (8.9% for Company-owned locations and 9.1% for franchise-operated locations). At Panera, we believe that strong earnings are simply a product of our focus on delighting our guests. In 2006, we hope to delight our customers across the country with a new selection of winning products, innovative environments, and industry-leading great service. Our goal is to continually provide our guests with crave-able foods they trust. As such, we pay close attention to their—and their children’s—dietary needs. This year, we are excited to announce a new Panera Kids Menu full of products that cater to children’s palates. Crafted from all-natural, organic ingredients, and featuring a new artisan white whole grain bread, these menu items will be food that kids really enjoy, and parents can trust. In 2005, we became aware of our customers’ growing concern for the potentially harmful health effects of consuming trans-fatty acids. So we made a commitment to offer a menu free of trans-fatty acids, and achieved this goal in early 2006. With the exception of trace elements and those that occur naturally in certain foods like roast beef, we have eliminated trans-fatty acids from the foods we serve. Achieving this

was neither easy nor inexpensive. But it was necessary to maintain the trust that underlies the Panera difference. We look forward to continuous improvement in our service throughout 2006. While we are among the leaders of our industry in accuracy and speed of service, we hope to substantially increase our performance on both metrics this year. Finally, 2006 marks the first year of our focus on “Share the Warmth” marketing. Rather than relying solely on advertising, or other impersonal ways of connecting with customers, our Share the Warmth marketing initiative will rely on “gentle collisions” to introduce Panera even more deeply into communities throughout the United States. We are excited at the opportunity to bring Panera Warmth to new guests, in new ways. As we enter 2006, our research and experience show that significant opportunity lies ahead for deeper penetration into existing and new markets. We are well prepared to fulfill the considerable demand for our bakery-cafe experience. To that end, we have bulked up our Development organization, which is now over 100 people strong. We are excited to inform you that we are on track to celebrate the opening of our 1,000th bakery-cafe in Fall 2006. Upwards of 20 other initiatives are in test at various bakery-cafes. Among the most interesting is our effort to take the Panera experience more aggressively into the evening. You will learn more about this as the year progresses. In conclusion, I would like to extend a special thank you to our Board of Directors, to our support center team members, and especially our Company operators, joint venture operators, and franchisees. You have been the people behind Panera’s success for the last ten years, and you will be the drivers of our success—not only in 2006, but for the next decade of the Panera story. I would like our guests to know we will do everything in our power to continue to offer them an extraordinary experience. And to our investors who have believed in our vision for Panera, I can assure you that the entire team takes seriously its responsibility to steward this extraordinary brand for continued success well into the future. Sincerely,
Ronald M. Shaich Chairman and Chief Executive Officer

Matters discussed in this annual report to stockholders, including any discussion or impact, express or implied, on the Company's anticipated growth, operating results, and future earnings per share, contain forward-looking statements within the meaning of Section 27A of the Securities Act of 1933 and Section 21E of the Securities Exchange Act of 1934. These statements are often identified by the words “believe”, “positioned”, "estimate", "project", “target”, “continue”, "intend", "expect", "future", "anticipates", and similar expressions. All forward-looking statements included in this release are made only as of the date of this release, and we do not undertake any obligation to publicly update or correct any forward-looking statements to reflect events or circumstances that occur or which we hereafter become aware, after that date. Forward-looking information expresses management's present belief, expectations, or intentions regarding the Company's future performance. The Company's actual results could differ materially from those set forth in the forward-looking statements due to known and unknown risks and uncertainties and could be negatively impacted by a number of factors. These factors include but are not limited to the following: inability to execute our growth strategy, including variations in the number, timing, and successful nature of Company and franchise bakery-cafe openings and continued successful operation of bakery-cafes; failure to comply with government regulations; loss of a member of senior management; failure or inability to protect our brand, trademarks, or other proprietary rights; competition; rising insurance costs; disruption in our supply chain or increases in ingredient, product, or other supply costs; disruptions or supply issues in our fresh dough facilities; health concerns about the consumption of certain products; complaints and litigation; risks associated with the acquisition of franchise-operated bakery-cafes; other factors, some of which may be beyond our control, effecting our operating results; and other factors that may affect restaurant owners or retailers in general. These and other risks are discussed from time to time in the Company's SEC reports, including its Form 10-K for the year ended December 27, 2005 and its quarterly reports on Form 10-Q.

UNITED STATES SECURITIES AND EXCHANGE COMMISSION WASHINGTON D.C. 20549
________________
Form 10-K
(Mark One) Annual report pursuant to Section 13 or 15(d) of the Securities Exchange Act of 1934
For the fiscal year ended December 27, 2005
or
Transition report pursuant to Section 13 or 15(d) of the Securities Exchange Act of 1934
For the transition period from to
Commission file number 0-19253 ________________
Panera Bread Company (Exact name of registrant as specified in its charter)
Delaware 04-2723701 (State or other jurisdiction of (I.R.S. Employer
incorporation or organization) Identification No.)
6710 Clayton Rd., 63117 Richmond Heights, MO (Zip code)
(Address of principal executive offices)
(314) 633-7100 (Registrant’s telephone number, including area code)
Securities registered pursuant to Section 12(b) of the Act: None.
Securities registered pursuant to Section 12(g) of the Act: Class A Common Stock, $.0001 par value
(Title of class)
Indicate by check mark if the registrant is a well-known seasoned issuer, as defined in Rule 405 of the Securities Act. Yes No
Indicate by check mark if the registrant is not required to file reports pursuant to Section 13 or Section 15(d) of the Act. Yes No
Indicate by check mark whether the registrant: (1) has filed all reports required to be filed by Section 13 and 15(d) of the Securities Exchange Act of 1934 during the preceding 12 months (or for such shorter period that the registrant was required to file such reports), and (2) has been subject to such filing requirements for the past 90 days. Yes No
Indicate by check mark if disclosure of delinquent filers pursuant to Item 405 of Regulation S-K is not contained herein, and will not be contained, to the best of the registrant’s knowledge, in definitive proxy or information statements incorporated by reference in Part III of this Form 10-K or any amendment to this Form 10-K.
Indicate by check mark whether the registrant is a large accelerated filer, an accelerated filer, or a non-accelerated filer. See definition of “accelerated filer and large accelerated filer” in Rule 12b-2 of the Exchange Act.
Large accelerated filer Accelerated filer Non-accelerated filer
Indicate by check mark whether the registrant is a shell company (as defined in Rule 12b-2 of the Act). Yes No
The aggregate market value of the registrant’s voting Class A and Class B Common Stock held by non-affiliates as of July 12, 2005 was $1,840,175,890. There is no public trading market for the registrant’s Class B Common Stock.
Number of shares outstanding of each of the registrant’s classes of common stock as of March 1, 2006: 29,909,101 shares of Class A Common Stock ($.0001 par value) and 1,400,031 shares of Class B Common Stock ($.0001 par value).
Portions of the proxy statement for the annual stockholders’ meeting to be held May 25, 2006 are incorporated by reference into Part III.

2
Forward-Looking Statements
Matters discussed in this report and in our public disclosures, whether written or oral, relating to future events or our future performance, including any discussion, express or implied, of our anticipated growth, operating results, future earnings per share, plans and objectives, contain forward-looking statements within the meaning of Section 27A of the Securities Act of 1933 and Section 21E of the Securities Exchange Act of 1934. These statements are often identified by the words “believe”, “positioned”, “estimate”, “project”, “target”, “continue”, “intend”, “expect”, “future”, “anticipates”, and similar expressions that are not statements of historical fact. These statements are not guarantees of future performance and involve certain risks, uncertainties and assumptions that are difficult to predict. Our actual results and timing of certain events could differ materially from those anticipated in these forward-looking statements as a result of certain factors, including, but not limited to, those set forth under “Risk Factors” and elsewhere in this report and in our other public filings with the Securities and Exchange Commission. It is routine for internal projections and expectations to change as the year or each quarter in the year progresses, and therefore it should be clearly understood that all forward-looking statements and the internal projections and beliefs upon which we base our expectations included in this report are made only as of the date of this report and may change. While we may elect to update forward-looking statements at some point in the future, we do not undertake any obligation to update any forward-looking statements whether as a result of new information, future events or otherwise.
PART I ITEM 1. BUSINESS GENERAL
Panera Bread Company (including its wholly owned subsidiaries) may be referred to as the “Company,” “Panera Bread” or in the first person notation of “we,” “us,” and “ours” in the following discussion.
As of December 27, 2005, we operated, directly and through area development agreements with 41 franchisee groups, bakery-cafes under the names Panera Bread® and Saint Louis Bread Co.® Bakery-cafes are principally located in suburban, strip mall, and regional mall locations and currently operate in 36 states. We specialize in meeting consumer dining needs by providing high quality food, including fresh baked goods, made-to-order sandwiches on freshly baked breads, soups, salads, custom roasted coffees, and other cafe beverages, and targets suburban dwellers and workers by offering a premium specialty bakery and cafe experience with a neighborhood emphasis. We operate as three business segments, the Company-owned bakery-cafe operations segment, the franchise operations segment, and the fresh dough operations segment. See Note 15 of our Consolidated Financial Statements for segment information. As of December 27, 2005, our retail operations consisted of 311 Company-owned bakery-cafes, all in the United States. As of December 27, 2005, our fresh dough operations, which supply fresh dough items daily to both Company-owned and franchise-operated bakery-cafes, consisted of 16 Company-owned fresh dough facilities. Our revenues were $640.3 million for the fiscal year ended December 27, 2005, consisting of $499.4 million of bakery-cafe sales, $54.3 million of franchise royalties and fees, and $86.5 million of fresh dough sales to franchisees. Franchise-operated bakery-cafe sales were $1,097.2 million for the fiscal year ended December 27, 2005.

3
The following table sets forth certain bakery-cafe data relating to Company-owned and franchise-operated bakery-cafes: For the Fiscal Year Ended
December 27, 2005
December 25, 2004
December 27, 2003
Number of bakery-cafes: Company-owned:
Beginning of period ........................................................................................................ 226 173 132 Bakery-cafes opened....................................................................................................... 66 54 29 Bakery-cafes closed ........................................................................................................ (2) — (3) Acquired from franchisee(1) ........................................................................................... 21 1 15 Transfer to franchisee(2)................................................................................................. — (2) —
End of period ................................................................................................................ 311 226 173 Franchise operated:
Beginning of period ........................................................................................................ 515 429 346 Bakery-cafes opened....................................................................................................... 73 89 102 Bakery-cafes closed ........................................................................................................ (1) (4) (4) Sold to Company(1) ........................................................................................................ (21) (1) (15) Transfer from Company(2) ............................................................................................. — 2 —
End of period ................................................................................................................ 566 515 429 System-wide:
Beginning of period ........................................................................................................ 741 602 478 Bakery-cafes opened....................................................................................................... 139 143 131 Bakery-cafes closed ........................................................................................................ (3) (4) (7) End of period ................................................................................................................ 877 741 602
____________
(1) In November 2005, we acquired 21 operating bakery-cafes and the area development rights from a franchisee in certain markets in Indiana. In October 2004, we acquired one operating bakery-cafe in the Dallas, Texas market from a franchisee. During fiscal 2003, we acquired 15 operating bakery-cafes and the area development rights from franchisees in the Louisville/Lexington, Kentucky; Dallas, Texas; Toledo, Ohio; and Ann Arbor, Michigan markets.
(2) In October 2004, we transferred two operating bakery-cafes to a new franchisee in connection with the acquisition of the
remaining minority membership interest. See Note 3 of our Consolidated Financial Statements for further information. CONCEPT AND STRATEGY
Our restaurant concept focuses on the “Specialty Bread/Bakery-Cafe” category. Our artisan breads, which are breads made with all natural ingredients and a craftsman’s attention to quality and detail, and overall award-winning bakery expertise are at the heart of our menu. The concept is designed to deliver against consumer desire for a more responsive and more special dining experience than that offered by traditional fast food. Our goal is to make Panera Bread a leading national brand. Our menu, prototype, operating systems, design, and real estate strategy allow us to compete successfully in several segments of the restaurant business: breakfast, lunch, PM “chill out,” lunch in the evening, and take home bread. In addition, we began our Via Panera® catering business in 2004.
The distinctive nature of our menu offerings (centered around the fresh artisan bread products), the quality of our bakery-cafe operations, our signature cafe design, and the locations of our cafes are integral to our success. We believe our concept has significant growth potential, which we hope to realize through a combination of Company and franchisee efforts. Franchising is a key component of our success. Utilization of franchising has enabled us to grow more rapidly because of the added resources and capabilities franchisees provide to implement the concepts and strategy developed by Panera. As of December 27, 2005, there were 566 franchised bakery-cafes operating and signed commitments to open an additional 416 franchised bakery-cafes.
We believe that providing bakery-cafe operators the opportunity to participate in the success of the bakery-cafe enables us to attract and retain experienced and highly motivated personnel, which results in a better customer experience. As a result, our compensation, subject to annual minimums, provides general managers and multi-unit managers compensation based upon a percentage of the cash flows of the units they operate and participation in a multi-year bonus structure also based on unit cash flow. This compensation structure is referred to as the JV program.

4
MENU
The menu is designed to provide our target customers with products which build on the strength of our bakery expertise. The key menu groups are fresh baked goods, made-to-order sandwiches and salads, soups, and cafe beverages. Included within these menu groups are a variety of freshly baked bagels, breads, muffins, scones, rolls, and sweet goods; made-to-order sandwiches; hearty, unique soups; custom roasted coffees and cafe beverages such as hot or cold espresso and cappuccino drinks. Our concept emphasizes the sophisticated specialty and artisan breads that support a take-home bread business.
We regularly review and revise our menu offerings to satisfy changing customer preferences. Product development is focused on providing food that customers crave and trust. New menu items are developed in test kitchens and then introduced in a limited number of the bakery-cafes to determine customer response and verify that preparation and operating procedures maintain product consistency and high quality standards. If successful, they are then rolled out system-wide. New product rollouts are integrated into periodic or seasonal menu rotations which we refer to as “Celebrations.” Examples of products introduced in 2005 include soufflés and artisan sweet goods at breakfast and numerous sandwiches and salads utilizing antibiotic free chicken.
MARKETING
We believe we compete on the basis of providing an entire experience rather than by price only. Pricing is structured so customers perceive good value with high quality food at reasonable prices to encourage frequent visits. We perform extensive market research, including utilizing focus groups, to determine customer food and drink preferences and price points. We attempt to increase our per location sales through menu development, product merchandising, and promotions at every day prices and by sponsorship of local community charitable events.
Franchise-operated bakery-cafes contribute to us 0.4% of their sales to a national advertising fund and 0.4% of their sales as a marketing administration fee and are required to spend 2.0% of their sales in their local markets on advertising. We contribute similar amounts from Company-owned bakery-cafes towards the national advertising fund and marketing administration. National advertising fund contributions can be increased from current levels up to a total of 2.6% of sales by us. Beginning in fiscal 2006, national advertising fund contributions were raised to 0.7% of sales. The national advertising fund and marketing administration contributions received from franchise-operated bakery-cafes are consolidated with our amounts in the our financial statements. Liabilities for unexpended funds are included in accrued expenses in the consolidated balance sheets. Our contributions to the national advertising fund and marketing administration, as well as our own media costs are recorded as part of other operating expenses in the consolidated statements of operations. We may utilize external media when deemed appropriate and cost effective in specific markets.
We have established and may continue to establish local and/or regional advertising associations covering specific geographic regions for the purpose of promoting and advertising the bakery-cafes located in that geographic market. If we establish an advertising association in a specific market, the franchise group in that market must participate in the association including making contributions in accordance with the advertising association bylaws. Contributions to the advertising association are credited towards required local advertising spending.
SITE SELECTION AND BAKERY-CAFE ENVIRONMENT
The bakery-cafe concept relies on a substantial volume of repeat business. In evaluating a potential location, we study the surrounding trade area, demographic information within that area and information on competitors. Based on analysis of this information including utilization of predictive modeling using proprietary software, we determine projected sales and return on investment. The Panera concept has proven successful in a number of different types of locations (i.e., in-line or end-cap locations in strip or power centers, regional malls, and free-standing).
We design each bakery-cafe to provide a distinctive environment, in many cases using fixtures and materials complementary to the neighborhood location of the bakery-cafe to engage customers. Many locations incorporate the warmth of a fireplace and cozy seating areas and groupings which facilitate utilization as a gathering spot. The design visually reinforces the distinctive difference between our bakery-cafes and other bakery-cafes. Many of our cafes also feature outdoor cafe seating and free wireless high speed, or Wi-Fi, Internet access. The average construction, equipment, furniture and fixture, and signage cost for the 66 Company-owned bakery-cafes opened in 2005 was $.92 million per bakery-cafe after landlord allowances.
The average Company-owned bakery-cafe size is approximately 4,600 square feet. We lease substantially all of our bakery-cafe locations and all of our fresh dough facilities. Lease terms are typically for ten years with one, two, or three five-year renewal option periods thereafter. Leases typically have charges for minimum base occupancy, a proportionate share of building and common area operating expenses and real estate taxes, and a contingent percentage rent based on sales above a stipulated sales level. Certain of our lease agreements provide for scheduled rent increases during the lease terms or for rental payments commencing at a date other than the date of initial occupancy. See Note 2 to the Consolidated Financial Statements for further information on our accounting for leases.

5
FRANCHISE OPERATIONS
We began a broad-based franchising program in 1996. We are continuing to extend our franchise relationships beyond our current franchisees and annually file a Uniform Franchise Offering Circular to facilitate sale of additional franchise area development agreements (ADAs). The franchise agreement typically requires the payment of a franchise fee of $35,000 per bakery-cafe (broken down into $5,000 at the signing of the area development agreement and $30,000 at or before the bakery-cafe opens) and continuing royalties of 4-5% on sales from each bakery-cafe. Franchise-operated bakery-cafes follow the same standards for in store operating standards, product quality, menu, site selection, and bakery-cafe construction as do Company-owned bakery-cafes. The franchisees are required to purchase all of their dough products from sources approved by us. Our fresh dough facility system supplies fresh dough products to substantially all franchise-operated bakery-cafes. We do not finance franchisee construction or ADA payments. In addition, we do not hold an equity interest in any of the franchise-operated bakery-cafes.
We have entered into franchise ADAs with 41 franchisee groups (area developers) as of December 27, 2005. Also, as of December 27, 2005, there were 566 franchise-operated bakery-cafes open and commitments to open 416 additional franchise-operated bakery-cafes. We expect these bakery-cafes to open according to the timetables established in the various ADAs with franchisee groups, with the majority opening in the next four to five years. We expect our area developers to open 80 to 85 new franchise-operated bakery-cafes in 2006. The ADAs require an area developer to develop a specified number of bakery-cafes on or before specific dates. If a franchisee fails to develop bakery-cafes on schedule, we have the right to terminate the ADA and develop Company-owned locations or develop locations through new area developers in that market. We may exercise one or more alternative remedies to address defaults by area developers, including not only development defaults, but also defaults in complying with our operating and brand standards and other covenants under the ADAs and franchise agreements. At the present time, we do not have any international franchise development agreements.
BAKERY-CAFE SUPPLY CHAIN
Bakery-cafes use fresh dough for their artisan and sourdough breads and bagels. Fresh dough is supplied daily by the fresh dough facilities to both Company-owned and franchise-operated bakery-cafes. There were 17 regional fresh dough facilities, of which 16 were Company-owned and one was franchise-operated, as of December 27, 2005, December 25, 2004 and December 27, 2003.
We believe our fresh dough facility system provides a competitive advantage. The fresh dough facilities ensure consistent quality and supply of fresh dough products to both Company-owned and franchise-operated bakery-cafes. We focus our growth in areas that allow us to continue to gain efficiencies through leveraging the fixed cost of the fresh dough facility structure and to selectively enter new markets which require the construction of additional facilities when sufficient numbers of bakery-cafes may be opened that permit efficient distribution of the fresh dough. The fresh dough distribution system delivers product daily to the bakery-cafes. Distribution is accomplished through a leased fleet of temperature controlled trucks operated by our personnel. At December 27, 2005, we leased 138 trucks. The optimal distribution is approximately 300 miles, however, when necessary, distribution range may be 500 miles. An average distribution route delivers dough to 6 bakery-cafes. Although we may contract for the supply of ingredients with only one supplier, we believe there are numerous suppliers of needed product ingredients and we could obtain ingredients from another supplier should we need to.
We have contracted externally for the supply of the remaining baked goods in the bakery-cafes, referred to as sweet goods. In November 2002, we entered into an agreement with Dawn Food Products, Inc. to provide sweet goods for the period 2003-2007. The agreement with Dawn is structured as a cost plus agreement. Sweet good products are completed at each bakery-cafe by professionally trained bakers. Completion includes finishing with fresh toppings and other ingredients and baking to established artisan standards.
We use independent distributors to distribute sweet goods products and other materials to bakery-cafes. With the exception of fresh dough products supplied by the fresh dough facilities, virtually all other food products and supplies for retail operations, including paper goods, coffee, and smallwares, are contracted for by us and delivered by the vendors to the distributor for delivery to the bakery-cafes. The individual bakery-cafes order directly from a distributor two to three times per week.
Franchise-operated bakery-cafes operate under individual contracts with one of our distributors or other regional distributors. As of December 27, 2005, there were three primary distributors serving the Panera Bread system.
COMPETITION
We experience competition from numerous sources in our trade areas. We compete with specialty food, casual dining and quick service restaurant retailers including national, regional and locally owned restaurants. Our bakery-cafes compete based on customers’ needs for breakfast, lunch, PM “chill-out,” lunch in the evening, and take home bread sales. The competitive factors include location, environment, customer service, price, and quality of products. We compete for leased space in desirable locations. Certain of our competitors may have capital resources exceeding those available to us. For further information on competition, see “Item 1A. Risk Factors” in this Form 10-K.

6
MANAGEMENT INFORMATION SYSTEMS
Each Company-owned bakery-cafe has computerized point-of-sale registers which collect transaction data used to generate pertinent information, including, among other things, product mix and average check. All product prices are programmed into the point-of-sale register from our corporate office. We allow franchisees, that elect to do so, access to certain of our proprietary bakery-cafe systems and systems support. Franchisees set their own menu prices.
Our in-store information system is designed to assist in labor scheduling and food cost management, to provide corporate and retail operations management quick access to retail data, to allow for on-line ordering with distributors, and to reduce managers’ administrative time. The system supplies sales, bank deposit, and variance data to our accounting department on a daily basis. We use this retail data to generate daily and weekly consolidated reports regarding sales and other key elements, as well as detailed profit and loss statements for each Company-owned bakery-cafe. Additionally, we monitor the average check, customer count, product mix, and other sales trends. We also use this retail data in our “exception-based reporting” tools to safeguard our cash, protects our assets, and train our employees. The fresh dough facilities have computerized systems which allow the fresh dough facilities to accept electronic orders from the bakery-cafes and deliver the ordered product back to the bakery-cafes.
We have network/integration systems which are corporate office electronic systems and tools which link various information subsystems and databases, encompassing e-mail and all major financial systems, such as general ledger database systems, and all major operational systems, such as store operating performance database systems. Most bakery-cafes also provide customers free Wi-Fi Internet access. As a result, we host one of the largest free public Wi-Fi networks in the country. EMPLOYEES
As of December 27, 2005, we had approximately 5,100 full-time associates (defined as associates who average 25 hours or more per week), of whom approximately 300 were employed in general or administrative functions principally at or from our support centers or executive offices, approximately 800 were employed in our fresh dough facility operations, and approximately 4,000 were employed in our bakery-cafe operations as bakers, managers, and associates. We also had approximately 8,800 part-time hourly associates at the bakery-cafes at December 27, 2005. We do not have any collective bargaining agreements with our employees and consider our employee relations to be good. We place a priority on staffing our bakery-cafes, fresh dough facilities, and support center operations with skilled associates and invest in training programs to ensure the quality of our operations. PROPRIETARY RIGHTS
Our brand, intellectual property and our confidential and proprietary information are very important to our business and competitive position. We protect these assets through a combination of trademark, copyright, trade secret and unfair competition and contract law.
The Panera®, Panera Bread®, Saint Louis Bread Co.®, Via Panera®, and Mother Bread design trademarks are of material importance to us and are registered with the United States Patent and Trademark Office. In addition, other marks of lesser importance have been filed with the United States Patent and Trademark Office. CORPORATE HISTORY AND ADDITIONAL INFORMATION
We are a Delaware corporation. Our principal executive offices are located at 6710 Clayton Road, Richmond Heights, Missouri 63117 and our telephone number is (314) 633-7100.
We were originally organized in March 1981 as a Massachusetts corporation under the name Au Bon Pain Co., Inc. and reincorporated in Delaware in June 1988. In December 1993, we purchased Saint Louis Bread Company. In August 1998, we sold our Au Bon Pain Division and changed our name to Panera Bread Company.
We are subject to the informational requirements of the Exchange Act, and, accordingly, file reports, proxy statements and other information with the Securities and Exchange Commission. Such reports, proxy statements and other information can be read and copied at the public reference facilities maintained by the Securities and Exchange Commission at the Public Reference Room, 100 F Street, NE, Room 1580, Washington, D.C. 20549. Information regarding the operation of the Public Reference Room may be obtained by calling the Securities and Exchange Commission at 1-800-SEC-0330. The Securities and Exchange Commission maintains a web site (http://www.sec.gov) that contains reports, proxy and information statements and other information regarding issuers that file electronically with the Securities and Exchange Commission.

7
Our Internet address is www.panerabread.com. We make available at this address, free of charge, nutritional information, press releases, annual reports on Form 10-K, quarterly reports on Form 10-Q, current reports on Form 8-K, and amendments to those reports filed or furnished pursuant to Section 13(a) or 15(d) of the Securities Exchange Act as soon as reasonably practicable after electronically filing such material with, or furnishing it to, the Securities and Exchange Commission. In addition, we provide periodic investor relations updates at our Internet address. GOVERNMENT REGULATION
Each fresh dough facility and Company-owned and franchise-operated bakery-cafe is subject to regulation and licensing by federal agencies as well as to licensing and regulation by state and local health, sanitation, safety, fire, and other departments. Difficulties or failures in obtaining and retaining the required licensing or approval could result in delays or cancellations in the opening of fresh dough facilities and bakery-cafes as well as fines and possible closure relating to existing fresh dough facilities and bakery-cafes. In addition, we are subject to the Fair Labor Standards Act and various state laws governing such matters as minimum wages, overtime, and other working conditions.
We are also subject to federal and state laws regulating the offer and sale of franchises. Such laws impose registration and disclosure requirements on franchisors in the offer and sale of the franchises and may also apply substantive standards to the relationship between franchisor and franchisee.
We are subject to various federal, state, and local environmental regulations. Compliance with applicable environmental regulations is not believed to have a material effect on capital expenditures, financial condition, results of operations, or our competitive position.
The Americans with Disabilities Act prohibits discrimination in employment and public accommodations on the basis of disability. Under the Americans with Disabilities Act, we could be required to expend funds to modify our Company-owned bakery-cafes to provide service to, or make reasonable accommodations for the employment of, disabled persons. Compliance with the requirements of the Americans with Disabilities Act is not believed to have a material effect on our financial condition or results of operations. ITEM 1A. RISK FACTORS
The following important factors, among others, could cause our actual operating results to differ materially from those indicated or suggested by forward-looking statements made in this Form 10-K or presented elsewhere by management from time to time. Our growth strategy, our business and our ability to increase our revenue and operating profits could be adversely affected if we are unable to execute our growth strategy.
Our growth strategy consists of new market development and further penetration of existing markets, both by us and our franchisees. The success of our growth strategy depends on numerous factors that are not completely controlled by us or involve risks that may impact the development, or timing of development, of our bakery-cafes. Our ability to grow successfully will depend on a number of factors, including:
• identification and availability of suitable locations for new bakery-cafes on acceptable terms including obtaining waivers of exclusive use restrictions from landlords and tenants, as needed, and within appropriate delivery distances from our fresh dough facilities;
• competition for restaurant sites;
• variations in the number and timing of bakery-cafe openings as compared to our construction schedule;
• management of the costs of construction of bakery-cafes, particularly factors outside our control, such as the timing of delivery
of a leased location by the landlord;
• securing required governmental approvals and permits and complying with applicable zoning, land use and environmental regulations; and
• general economic conditions.

8
Although we have been able to successfully manage and plan our growth to date, we may experience difficulties doing so in the
future.
Our growth strategy includes opening bakery-cafes in new markets where we may have little or no operating experience. Accordingly, there can be no assurance that a bakery-cafe opened in a new market will have similar operating results, including average store sales, as our existing bakery-cafes. Bakery-cafes opened in new markets may not perform as expected or may take longer to reach planned operating levels, if at all. Operating results or overall bakery-cafe performance could vary as a result of higher construction, occupancy or general operating costs, a lack of familiarity with our brand which may require us to build brand awareness, differing demographics, consumer tastes and spending patterns, and variable competitive environments. Additional expenses attributable to costs of delivery from our fresh dough facilities may exceed our expectations in areas not currently served by those facilities.
Our growth strategy also includes opening bakery-cafes in existing markets to increase the penetration rate of our bakery-cafes in those markets. However, this strategy could result in a sales decline in some of our existing bakery-cafes if customers choose to patronize a new location over an existing location. There can be no assurance that we will be successful in operating bakery-cafes profitably in new markets or further penetrating existing markets. Our growth strategy depends on continued development by our franchisees. If our franchisees do not continue to successfully open new bakery-cafes, our business could be adversely affected.
Our growth strategy also includes continued development of bakery-cafes through franchising. At December 27, 2005, approximately 65% of our bakery-cafes were operated by franchisees (566 franchise-operated units out of a total of 877 units system wide). The opening and success of bakery-cafes by franchisees depends on a number of factors, including those identified above as well as the availability of suitable franchise candidates and the financial and other resources of our franchisees.
Additionally, our results of operations include revenues derived from royalties on sales from, and revenues from sales by our fresh dough facilities to, each franchise-operated bakery-cafe. As a result, our growth expectations and revenue could be negatively impacted by a material downturn in sales at and to franchise-operated bakery-cafes or if one or more key franchisees became insolvent or otherwise refused to pay us our royalties. If we fail to comply with governmental regulations or if these regulations change, our business could suffer.
We must comply with extensive federal, state and local laws in connection with the operation of our business, including those related to:
• franchise relationships;
• building construction and zoning requirements;
• environmental matters;
• the preparation and sale of food; and
• employment.
Our bakery-cafes and fresh dough facilities are licensed and subject to regulation under state and local laws, including business, health, fire and safety codes.
Various federal and state labor laws govern our operations and our relationship with our employees, including minimum wage, overtime, accommodation and working conditions, benefits, citizenship requirements, insurance matters, workers’ compensation, disability laws such as the federal Americans with Disabilities Act, child labor laws and anti-discrimination laws.
While we believe we operate in substantial compliance with these laws, they are complex and vary from location to location, which complicates monitoring and compliance. As a result, regulatory risks are inherent in our operation. Although we believe that compliance with these laws has not had a material effect on our operations to date, there can be no assurance that we will not experience material difficulties or failures with respect to compliance in the future. Our failure to comply with these laws could result in required renovations to our facilities, litigation, fines, penalties, judgments or other sanctions including the temporary suspension of bakery-cafe or fresh dough facility operations or a delay in construction or opening of a bakery-cafe, any of which could adversely affect our business, operations and our reputation.

9
We depend on senior management and on the retention and recruiting of other personnel for our future success.
Our success depends on the services of our senior management and other personnel, all of whom are “at will” employees. The loss of a member of senior management could have an adverse impact on our business or the financial market’s perception of our ability to continue our growth.
Our success also depends on our continuing ability to hire, train, motivate and retain qualified personnel in our bakery-cafes, fresh dough facilities and support centers. Our failure to do so could result in higher employee turnover and increased labor costs, and could compromise the quality of our service, all of which could adversely affect our business. Our failure or inability to protect our brand, trademarks or other proprietary rights could adversely affect our business and competitive position.
We believe that our brand, intellectual property and our confidential and proprietary information is very important to our business and our competitive position. Our primary trademarks, Panera®, Panera Bread®, Saint Louis Bread Co.®, Via Panera®, and Mother Bread design, along with other trademarks, copyrights, service marks, trade secrets, confidential and proprietary information and other intellectual property rights are key components of our operating and marketing strategies. Although we have taken steps to protect our brand, intellectual property and confidential and proprietary information, the steps that we have taken may not be adequate. Unauthorized usage or imitation by others could harm our image, brand or competitive position and, if we commence litigation to enforce our rights, cause us to incur significant legal fees.
We are not aware of any assertions that our trademarks or menu offerings infringe upon the proprietary rights of third parties, but we cannot assure you that third parties will not claim infringement by us in the future. Any such claim, whether or not it has merit, could be time-consuming, result in costly litigation, cause delays in introducing new menu items in the future or require us to enter into royalty or licensing agreements. As a result, any such claim could have a material adverse effect on our business, results of operations and financial condition.
We try to ensure that our franchisees maintain and protect our brand and our confidential and proprietary information. However, since our franchisees are independent third parties that we do not control, if they do not operate their bakery-cafes in a manner consistent with their agreements with us, the Panera Bread brand and reputation or the value of our confidential and proprietary information could be harmed. If this occurs, our business and operating results could be adversely affected. Competition may adversely affect our operations and results of operation.
The restaurant industry is highly competitive with respect to location, environment, customer service, price, quality of products and overall customer experience. We compete with specialty food, casual dining and quick service restaurant retailers including national, regional and locally owned restaurants. Many of our competitors or potential competitors have substantially greater financial and other resources than we do, which may allow them to react to changes in pricing, marketing and the casual dining restaurant industry better than we can. Additionally, other companies may develop restaurants that operate with concepts similar to ours. We also compete with other restaurant chains and other retail businesses for quality site locations and hourly employees. If we are unable to successfully compete in our markets, we may be unable to sustain or increase our revenues and profitability.
Additionally, competition could cause us to modify or evolve our products, designs or strategies. If we do so, we cannot assure you that we will be successful in implementing the changes or that our profitability will not be negatively impacted by them. Rising insurance costs could negatively impact our profitability.
We self-insure a significant portion of our expected losses under our workers’ compensation, and health, general, auto and property liability programs. The liabilities associated with the risks that are retained by us are estimated, in part, by considering our historical claims experience and data from industry and other actuarial sources. The estimated accruals for these liabilities could be affected if claims differ from these assumptions and historical trends. Unanticipated changes in the actuarial assumptions and management estimates underlying our reserves of these losses could result in materially different amounts of expense under these programs, which could have a material adverse effect on our financial condition and results of operation.

10
Additionally, the costs of insurance and medical care have risen significantly over the past few years and are expected to continue to increase in 2006. These increases, as well as existing or potential legislation changes, such as proposals to require employers to provide health insurance to employees, could negatively impact our operating results. Disruptions in our supply chain or increases in ingredient, product and other supply costs could adversely affect our profitability and operating results.
Our Company-owned and franchise-operated bakery-cafes are dependent on frequent deliveries of ingredients and other products. Three companies deliver the majority of our ingredients and other products to the Panera Bread bakery-cafes on a regular basis (two or three times weekly). Our agreements with these distributors are up for renewal in February 2007. In addition, we and our franchisees rely on a network of local and national suppliers for the delivery of fresh produce (three to six times per week) which is particularly susceptible to supply volatility as a result of weather conditions. Our dependence on frequent deliveries to our bakery-cafes could cause shortages or supply interruptions that could adversely impact our operations.
Although many of our ingredients and products are prepared to our specifications, we believe that a majority of the ingredients are based on generally available products that could be obtained from alternative sources if needed. In addition, we frequently enter into annual and multi-year contracts for ingredients in order to decrease the risks associated with supply and cost. The antibiotic free chicken, which is sold in Company-owned and franchise-operated bakery-cafes, is currently supplied by three different companies. However, there are few producers of antibiotic free chicken, which may make it difficult, or more costly, for us to find alternative suppliers if necessary.
Generally, we believe that we have adequate sources of supply for our ingredients and products to support our bakery operations or, if necessary, we could make menu adjustments to address material supply issues. However, there are many factors which could cause shortages or interruptions in the supply of our ingredients and products — including produce, antibiotic free chicken, sweet goods and soup — including weather, unanticipated demand, labor, production or distribution problems, quality issues and cost, some of which are beyond our control, and which could have an adverse affect on our business and results of operations.
In the past, we have been able to adjust menu prices to partially or fully offset ingredient and other supply cost increases. However, a delay in menu price increases or competitive pressures may limit our ability to recover ingredient cost increases in the future. Disruptions or supply issues in our fresh dough facilities, could adversely affect our business and results of operations.
We operate 16 fresh dough facilities which service all of our Company-owned and approximately 96% of our franchise-operated bakery-cafes. The fresh dough distribution system delivers fresh dough products daily to the bakery-cafes through a leased fleet of temperature controlled vehicles. The optimal distribution range is approximately 300 miles. However, when necessary, the distribution range may reach up to 500 miles. As a result, any prolonged disruption in the operations of or distribution from any of the fresh dough facilities, whether due to weather conditions, technical or labor difficulties, destruction or damage to the vehicle fleet or facility or other reasons, could cause a shortage of fresh dough products at the bakery-cafes. Such a shortage of fresh dough products could, depending on the extent and duration, have a material adverse affect on our business and results of operations.
Additionally, increased costs and distribution issues related to fuel and utilities could also materially impact our business and results of operations, including with respect to our efficiencies in distribution from our fresh dough facilities to the bakery-cafes.
Our Franklin, Massachusetts’ fresh dough facility manufactures and supplies through our distributors all of the cream cheese and tuna used in the Company-owned bakery-cafes and approximately 82% of the cream cheese and tuna used in the bakery-cafes operated by our franchisees. Although we believe we have adopted adequate quality assurance and other procedures to ensure the production and distribution of quality products and ingredients, the possibility exists that we will be subject to allegations regarding quality, health or other similar concerns that could have a negative impact on our operations whether or not the allegations are valid or we are liable. Additionally, defending against such claims or litigation can be very costly and the results uncertain.

11
Customer preferences and traffic could be negatively impacted by health concerns about the consumption of certain products.
Customer preferences and traffic could be impacted by health concerns about the consumption of particular food products and could cause a decline in our sales. Negative publicity about ingredients, poor food quality, food-borne illness, injury, health concerns or nutritional content could cause customers to shift their preferences. For example, since 2004, Asian and European countries have experienced outbreaks of avian flu. Negative publicity concerning avian flu may adversely affect demand for our products because chicken and turkey are key ingredients in many of our menu items and could cause an increase in our food costs and a decrease in customer traffic to our bakery-cafes. We are subject to complaints and litigation that could have a material adverse affect on our business.
In the ordinary course of our business we may become subject to complaints and litigation alleging that we are responsible for a customer illness or injury suffered at or after a visit to one of our bakery-cafes including claims alleging poor food quality, food-borne illness, adverse health effects, nutritional content, personal injury or other concerns. In addition, we are subject to litigation by employees, franchisees and others through private actions, class actions or other forums. The outcome of litigation is difficult to assess and quantify and the defense against such claims or actions can be costly. In addition to decreasing sales and profitability and diverting financial and management resources, we may suffer from adverse publicity that could harm our brand, regardless of whether the allegations are valid or whether we are liable. In fact, we are subject to the same risks of adverse publicity resulting from allegations even if the claim involves one of our franchisees. A judgment significantly in excess of our insurance coverage for any claims could materially and adversely affect our financial condition or results of operations. Additionally, publicity about these claims may harm our reputation or prospects and adversely affect our results. We periodically acquire existing bakery-cafes from our franchisees, which could adversely affect our results of operation.
We have historically acquired existing bakery-cafes and development rights from our franchisees either by negotiated agreement or exercise of our rights of first refusal under the franchise and area development agreements. For example, in fiscal year 2005, we acquired 23 bakery-cafes from a franchisee (including 2 under construction). Any bakery-cafe acquisition that we undertake involves risk, including:
• our ability to successfully complete the acquisition, achieve anticipated synergies, accurately assess contingent and other liabilities as well as potential profitability;
• un-anticipated changes in business and economic conditions;
• limited or no operational experience in the acquired bakery-cafe market;
• future impairment charges related to good will and other acquired intangible assets; and
• risks of dispute and litigation with the seller franchisee, the seller’s landlords and vendors and other parties.
Any of these factors could strain our financial and management resources as well as negatively impact our results of operation.
Our operating results fluctuate due to a number of factors, some of which may be beyond our control, and any of which may adversely affect our financial condition.
Our quarterly operating results may fluctuate significantly because of a number of factors, including the following, some of which are not within our control:
• changes in our operating costs;
• labor availability and wages of management and associates;
• increases and decreases in average weekly sales and comparable bakery-cafe sales, including as a result of the introduction of new menu items;
• profitability of new bakery-cafes, especially in new markets;

12
• changes in demographics, consumer preferences and discretionary spending;
• changes in business strategy including concept evolution and new designs;
• fluctuations in supply costs, shortages or interruptions;
• negative publicity about the ingredients we use or the occurrence of food-borne illnesses or other problems at our bakery-cafes;
• natural disasters and other calamities; and
• general economic conditions, both nationally and locally.
Additionally, our sales have fluctuated by season due to the number and timing of bakery-cafe openings and related expense,
consumer spending patterns and weather. Historically, sales have been higher during the winter holiday season as a result of increased traffic, higher baked goods sales and family and community gatherings. In fiscal year 2005, Company-owned bakery-cafes had an aggregate of approximately $109 million in sales in the second quarter which was our recorded lowest relative quarterly sales in that year and included 13 Company-owned bakery-cafe openings. Comparatively, in our fourth quarter we had an aggregate of approximately $137 million in sales with 26 Company-owned bakery-cafe openings in that quarter recording the highest relative quarterly sales for fiscal year 2005.
Accordingly, results for any one quarter are not necessarily indicative of results to be expected for any other quarter. ITEM 1B. UNRESOLVED STAFF COMMENTS
None. ITEM 2. PROPERTIES
The average Company-owned bakery-cafe size is approximately 4,600 square feet. We lease substantially all of our bakery-cafe locations and all of our fresh dough facilities. Lease terms are typically for ten years with one, two, or three five-year renewal option periods thereafter. Leases typically have charges for minimum base occupancy, a proportionate share of building and common area operating expenses and real estate taxes, and a contingent percentage rent based on sales above a stipulated sales level. Certain of our lease agreements provide for scheduled rent increases during the lease terms or for rental payments commencing at a date other than the date of initial occupancy. See Note 2 to the Consolidated Financial Statements for further information on our accounting for leases.

13
Information with respect to the number of bakery-cafes operated by state at December 27, 2005 is set forth below:
Panera Bread/St. Louis Bread Co. Bakery-Cafes State
Company- Owned Bakery-Cafes
Franchise- Operated Bakery-Cafes
Total Bakery-Cafes
Alabama................................................................................................................................. 10 — 10 Arkansas ................................................................................................................................ — 3 3 California ............................................................................................................................... 7 19 26 Colorado ................................................................................................................................ — 17 17 Connecticut ............................................................................................................................ 4 7 11 Delaware ................................................................................................................................ — 2 2 Florida.................................................................................................................................... 15 55 70 Georgia .................................................................................................................................. 11 11 22 Iowa ....................................................................................................................................... — 15 15 Illinois .................................................................................................................................... 45 38 83 Indiana ................................................................................................................................... 27 — 27 Kansas.................................................................................................................................... — 16 16 Kentucky................................................................................................................................ 7 2 9 Massachusetts ........................................................................................................................ 2 28 30 Maryland................................................................................................................................ — 30 30 Maine ..................................................................................................................................... — 3 3 Michigan ................................................................................................................................ 36 11 47 Minnesota .............................................................................................................................. — 24 24 Missouri ................................................................................................................................. 41 17 58 North Carolina ....................................................................................................................... 7 24 31 Nebraska ................................................................................................................................ — 9 9 Nevada ................................................................................................................................... — 4 4 New Hampshire ..................................................................................................................... — 8 8 New Jersey............................................................................................................................. — 39 39 New York .............................................................................................................................. 18 12 30 Ohio ....................................................................................................................................... 8 67 75 Oklahoma............................................................................................................................... — 16 16 Pennsylvania .......................................................................................................................... 15 36 51 Rhode Island .......................................................................................................................... — 4 4 South Carolina ....................................................................................................................... 8 2 10 Tennessee............................................................................................................................... 7 9 16 Texas...................................................................................................................................... 9 12 21 Virginia .................................................................................................................................. 32 4 36 Washington ............................................................................................................................ 2 — 2 West Virginia......................................................................................................................... — 3 3 Wisconsin .............................................................................................................................. — 19 19
Totals................................................................................................................................... 311 566 877

14
Information with respect to Company-owned leased fresh dough facilities as of December 27, 2005 is set forth below: Facility Square Footage Franklin, MA(1)................................................................................................................................................................. 40,300 Chicago, IL ........................................................................................................................................................................ 30,900 St. Louis, MO .................................................................................................................................................................... 30,000 Fairfield, NJ ....................................................................................................................................................................... 20,200 Detroit, MI ......................................................................................................................................................................... 19,600 Atlanta, GA........................................................................................................................................................................ 18,000 Beltsville, MD.................................................................................................................................................................... 17,900 Kansas City, KS................................................................................................................................................................. 17,200 Cincinnati, OH................................................................................................................................................................... 16,800 Orlando, FL........................................................................................................................................................................ 16,500 Warren, OH ....................................................................................................................................................................... 16,300 Ontario, CA........................................................................................................................................................................ 13,900 Minneapolis, MN............................................................................................................................................................... 10,300 Denver, CO........................................................................................................................................................................ 10,000 Greensboro, NC ................................................................................................................................................................. 9,600 Dallas, TX.......................................................................................................................................................................... 7,800 ____________
(1) Total square footage includes approximately 20,000 square feet utilized in tuna and cream cheese production. ITEM 3. LEGAL PROCEEDINGS
We are not subject to any material litigation, but are subject to legal proceedings, claims and litigation in the ordinary course of our business. We believe all such claims and proceedings currently pending against us will not have a material adverse effect on our financial position, results of operations, or cash flows. ITEM 4. SUBMISSION OF MATTERS TO A VOTE OF SECURITY HOLDERS
No matter was submitted to a vote of security holders during the fourth quarter of the fiscal year ended December 27, 2005.

15
PART II ITEM 5. MARKET FOR REGISTRANT’S COMMON EQUITY, RELATED STOCKHOLDER MATTERS, AND ISSUER
PURCHASES OF EQUITY SECURITIES
Our Class A Common Stock is quoted on The Nasdaq National Market under the symbol “PNRA.” There is no established public trading market for our Class B Common Stock. The following table sets forth the high and low sale prices for our Class A Common Stock as reported by Nasdaq for the fiscal periods indicated. 2005 High Low First Quarter.............................................................................................................................................................. $ 58.98 $ 39.16 Second Quarter ......................................................................................................................................................... $ 66.26 $ 50.02 Third Quarter ............................................................................................................................................................ $ 62.26 $ 49.21 Fourth Quarter .......................................................................................................................................................... $ 72.36 $ 52.90 2004 High Low First Quarter.............................................................................................................................................................. $ 44.05 $ 34.93 Second Quarter ......................................................................................................................................................... $ 42.83 $ 33.18 Third Quarter ............................................................................................................................................................ $ 39.90 $ 32.95 Fourth Quarter .......................................................................................................................................................... $ 40.62 $ 34.93
On March 1, 2006, the last sale price for the Class A Common Stock, as reported on the Nasdaq National Market, was $71.26. As of March 1, 2006, we had approximately 2,448 holders of record of our Class A Common Stock and approximately 41 holders of record of our Class B Common Stock. Dividend Policy
We have never paid cash dividends on our capital stock and do not intend to pay cash dividends in 2006 as we intend to re-invest earnings in continued growth of our operations.

16
ITEM 6. SELECTED CONSOLIDATED FINANCIAL DATA
The following selected financial data has been derived from our consolidated financial statements. The data set forth below should be read in conjunction with “Management’s Discussion and Analysis of Financial Condition and Results of Operations” and our Consolidated Financial Statements and Notes thereto. For The Fiscal Years Ended
December 27, 2005(1)
December 25, 2004
December 27, 2003
December 28, 2002
(as restated) (2) December 29, 2001
(in thousands, except per share data) Revenues:
Bakery-cafe sales .................................................... $ 499,422 $ 362,121 $ 265,933 $ 212,645 $ 157,684 Franchise royalties and fees .................................... 54,309 44,449 36,245 27,892 19,577 Fresh dough sales to franchisees............................. 86,544 72,569 61,524 41,688 23,856
Total Revenue .................................................... 640,275 479,139 363,702 282,225 201,117 Costs and expenses:
Bakery-cafe expenses: Cost of food and paper products.......................... 142,675 101,832 73,885 63,370 48,341 Labor.................................................................... 151,524 110,790 81,152 63,172 45,768 Occupancy............................................................ 37,389 26,730 18,981 15,408 11,893 Other operating expenses ..................................... 70,003 51,044 36,804 27,971 20,729 Total bakery-cafe expenses ................................ 401,591 290,396 210,822 169,921 126,731
Fresh dough cost of sales to franchisees ................... 75,036 65,627 54,967 38,432 21,965 Depreciation and amortization.................................. 33,011 25,298 18,304 13,794 10,979 General and administrative expenses........................ 46,301 33,338 28,140 24,986 19,589 Pre-opening expenses ............................................... 3,241 2,642 1,531 1,051 912
Total costs and expenses .................................... 559,180 417,301 313,764 248,184 180,176 Operating profit ........................................................ 81,095 61,838 49,938 34,041 20,941 Interest expense ........................................................ 50 18 48 32 72 Other (income) expense, net ..................................... (1,133) 1,065 1,592 467 221 Income before income taxes and cumulative effect
of accounting change .............................................. 82,178 60,755 48,298 33,542 20,648 Provision for income taxes ....................................... 29,995 22,175 17,629 12,242 7,989 Income before cumulative effect of accounting
change ..................................................................... 52,183 38,580 30,669 21,300 12,659 Cumulative effect to December 28, 2002 of
accounting change, net of tax benefit(3)................. — — (239) — — Net income................................................................ $ 52,183 $ 38,580 $ 30,430 $ 21,300 $ 12,659 Per common share:
Basic: Income before cumulative effect of accounting
change ................................................................... $ 1.69 $ 1.28 $ 1.03 $ 0.74 $ 0.46 Cumulative effect of accounting changes(3) .......... — — (0.01) — — Net income .............................................................. $ 1.69 $ 1.28 $ 1.02 $ 0.74 $ 0.46 Diluted: Income before cumulative effect of accounting
change ................................................................... $ 1.65 $ 1.25 $ 1.01 $ 0.71 $ 0.44 Cumulative effect of accounting changes(3) .......... — — (0.01) — — Net income .............................................................. $ 1.65 $ 1.25 $ 1.00 $ 0.71 $ 0.44
Weighted average shares of common stock outstanding: Basic........................................................................ 30,871 30,154 29,733 28,923 27,783 Diluted..................................................................... 31,651 30,768 30,423 29,891 28,886
Consolidated balance sheet data: Cash and cash equivalents ........................................ $ 24,451 $ 29,639 $ 42,402 $ 29,924 $ 18,052 Investments in government securities ....................... $ 46,308 $ 28,415 $ 9,019 $ 9,149 $ — Total assets................................................................ $ 437,667 $ 324,672 $ 256,835 $ 195,431 $ 148,720 Other long-term liabilities......................................... $ 4,867 $ 1,776 $ 1,115 $ 262 $ — Stockholders’ equity ................................................. $ 316,978 $ 241,363 $ 193,805 $ 151,503 $ 118,185

17
For The Fiscal Years Ended
December 27, 2005(1)
December 25, 2004
December 27, 2003
December 28, 2002
(as restated) (2) December 29, 2001
(in thousands, except per share data) Franchisee revenue(4)............................................... $ 1,097,191 $ 879,070 $ 710,980 $ 542,624 $ 371,650 Comparable bakery-cafe sales percentage
increases for: Company-owned bakery-cafes(4) ........................... 7.4% 2.9% 1.7% 4.1% 5.8% Franchise-operated bakery-cafes(4) ........................ 8.0% 2.6% (0.4)% 6.1% 5.8% System-wide(4) ....................................................... 7.8% 2.7% 0.2% 5.5% 5.8%
Bakery-cafe data: Company-owned bakery-cafes open......................... 311 226 173 132 110 Franchise-operated bakery-cafes open...................... 566 515 429 346 259 Total bakery-cafes open .......................................... 877 741 602 478 369
____________
(1) In fiscal year 2005, we changed our fiscal week to end on Tuesday rather than Saturday. As a result, our 2005 fiscal year ended on December 27, 2005 instead of December 31, 2005 and, therefore, consisted of fifty-two and a half weeks rather than the fifty-three week year that would have resulted without the calendar change. These additional three days in fiscal 2005 did not have a material impact on our financial statements.
(2) As described in Note 3 to our 2004 Form 10-K Consolidated Financial Statements, we restated our previously issued consolidated
financial statements to recognize changes in our lease accounting practices. (3) Effective December 29, 2002, we adopted the provisions of Statement of Financial Accounting Standards (SFAS) No. 143,
“Accounting for Asset Retirement Obligations.” This Statement requires us to record an estimate for costs of retirement obligations that may be incurred at the end of lease terms of existing bakery-cafes or other facilities. Upon adoption of SFAS 143, we recognized a one-time cumulative effect charge of approximately $0.2 million (net of deferred tax benefit of approximately $0.1 million), or $.01 per diluted share. For further information, see Note 2, “Summary of Significant Accounting Policies,” to the Consolidated Financial Statements.
(4) We included franchisee revenue and Company-owned, franchise-operated, and system-wide comparable bakery-cafe sales
increases. Franchisee revenue is a non-GAAP financial measure that includes sales at all franchise-operated bakery-cafes, as reported by franchisees. System-wide sales is a non-GAAP financial measure that includes sales at all Company-owned and franchise-operated bakery-cafes. Management uses system-wide sales and franchisee revenue information internally in connection with store development decisions, planning, and budgeting analyses. Management believes it is useful in assessing consumer acceptance of our brand and facilitating an understanding of financial performance as our franchisees pay royalties and contribute to advertising pools based on a percentage of their sales.
ITEM 7. MANAGEMENT’S DISCUSSION AND ANALYSIS OF FINANCIAL CONDITION AND RESULTS OF
OPERATIONS General
In fiscal year 2005, we changed our fiscal week to end on Tuesday rather than Saturday, with our fiscal year ending on the last Tuesday in December. This change allowed us to better serve customers by shifting the weekly closing activities to a less busy day of the week. As a result, our 2005 fiscal year ended on December 27, 2005 instead of December 31, 2005 and, therefore, consisted of fifty-two and a half weeks rather than the fifty-three week year that would have resulted without the calendar change. The additional days in fiscal year 2005 compared to fiscal year 2004 occurred in the first quarter, resulting in the first quarter being sixteen and a half weeks instead of sixteen weeks. As a result of this calendar change, the next fifty-three week year will occur in fiscal year 2008. Our fiscal year ended on the last Saturday in December for 2004 and prior fiscal years and consisted of 13 four-week periods, with the first, second, and third quarters ending 16 weeks, 28 weeks, and 40 weeks, respectively, into the fiscal year. In fiscal year 2006, we adopted a new quarterly calendar whereby each of our quarters will include 13 weeks with 4 week, 5 week, and 4 week period progressions in each quarter. Our fiscal week will continue to end on Tuesday, with fiscal year 2006 ending on December 26, 2006. See “Quarterly Calendar Change” in Item 7 of this Form 10-K for the Consolidated Statement of Operations for each of the quarters of fiscal year 2005 conformed to the 2006 quarterly presentation.

18
We include in this report information on Company, franchisee, and/or system-wide comparable bakery-cafe sales increases and average weekly sales. System-wide sales are a non-GAAP financial measure that includes sales at all Company-owned and franchise-operated bakery-cafes, as reported by franchisees. Management uses system-wide sales information internally in connection with store development decisions, planning, and budgeting analyses. Management believes it is useful in assessing consumer acceptance of our brand and facilitating an understanding of financial performance as our franchisees pay royalties and contribute to advertising pools based on a percentage of their sales.
Our revenues are derived from Company-owned bakery-cafe sales, fresh dough sales to franchisees, and franchise royalties and fees. Fresh dough sales to franchisees are primarily the sales of dough products to our franchisees and the sales of tuna and cream cheese to certain franchisees. Franchise royalties and fees include royalty income and franchise fees. The cost of food and paper products, labor, occupancy, and other operating expenses relate primarily to Company-owned bakery-cafe sales. The cost of fresh dough sales relates primarily to the sale of fresh dough products and tuna and cream cheese to franchisees. General and administrative, depreciation, and pre-opening expenses relate to all areas of revenue generation.
In fiscal year 2005, we earned $1.65 per diluted share with the following system-wide performance on key metrics: 139 new bakery-cafes opened in fiscal 2005, including 66 new Company-owned bakery-cafes and 73 new franchise-operated bakery-cafes, comparable bakery-cafe sales growth of 7.8%, average weekly sales of $38,318, and operating weeks of 41,370.
The following table sets forth the percentage relationship to total revenues, except where otherwise indicated, of certain items
included in our consolidated statements of operations for the periods indicated. Percentages may not add due to rounding: For the Fiscal Years Ended
December 27, 2005
December 25, 2004
December 27, 2003
Revenues: Bakery-cafe sales ............................................................................................................... 78.0% 75.6% 73.1% Franchise royalties and fees ............................................................................................... 8.5 9.3 10.0 Fresh dough sales to franchisees........................................................................................ 13.5 15.1 16.9
Total revenue................................................................................................................. 100.0% 100.0% 100.0% Costs and expenses:
Bakery-cafe expenses(1): Cost of food and paper products..................................................................................... 28.6% 28.1% 27.8% Labor............................................................................................................................... 30.3 30.6 30.5 Occupancy....................................................................................................................... 7.5 7.4 7.1 Other operating expenses ................................................................................................ 14.0 14.1 13.8 Total bakery-cafe expenses ........................................................................................... 80.4 80.2 79.2
Fresh dough cost of sales to franchisees(2) ....................................................................... 86.7 90.4 89.3 Depreciation and amortization ........................................................................................... 5.2 5.3 5.0 General and administrative expenses................................................................................. 7.2 7.0 7.7 Pre-opening expenses......................................................................................................... 0.5 0.6 0.4
Total costs and expenses ............................................................................................... 87.3 87.1 86.3 Operating profit ................................................................................................................... 12.7 12.9 13.7 Interest expense ................................................................................................................... — — — Other (income) expense, net ................................................................................................ (0.2) 0.3 0.4 Income before income taxes and cumulative effect of accounting change.......................... 12.8 12.7 13.3 Income taxes ........................................................................................................................ 4.7 4.6 4.8 Income before cumulative effect of accounting change ...................................................... 8.2 8.1 8.4 Cumulative effect to December 28, 2002 of accounting change, net of tax ........................ — — (0.1)
Net income.................................................................................................................... 8.2% 8.1% 8.4% ____________
(1) As a percentage of bakery-cafe sales.
(2) As a percentage of fresh dough facility sales to franchisees.

19
The following table sets forth certain bakery-cafe data relating to Company-owned and franchise-operated bakery-cafes: For the Fiscal Year Ended
December 27, 2005
December 25, 2004
December 27, 2003
Number of bakery-cafes: Company-owned:
Beginning of period ........................................................................................................ 226 173 132 Bakery-cafes opened....................................................................................................... 66 54 29 Bakery-cafes closed ........................................................................................................ (2) — (3) Acquired from franchisee(1) ........................................................................................... 21 1 15 Transfer to franchisee(2)................................................................................................. — (2) —
End of period ................................................................................................................ 311 226 173 Franchise-operated:
Beginning of period ........................................................................................................ 515 429 346 Bakery-cafes opened....................................................................................................... 73 89 102 Bakery-cafes closed ........................................................................................................ (1) (4) (4) Sold to Company(1) ........................................................................................................ (21) (1) (15) Transfer from Company(2) ............................................................................................. — 2 —
End of period ................................................................................................................ 566 515 429 System-wide:
Beginning of period ........................................................................................................ 741 602 478 Bakery-cafes opened....................................................................................................... 139 143 131 Bakery-cafes closed ........................................................................................................ (3) (4) (7) End of period ................................................................................................................ 877 741 602
____________
(1) In November 2005, we acquired 21 operating bakery-cafes and the area development rights from a franchisee in certain markets in the Indiana area. In October 2004, we acquired one operating bakery-cafe in the Dallas, Texas market from a franchisee. During fiscal 2003, we acquired 15 operating bakery-cafes and the area development rights from franchisees in the Louisville/Lexington, Kentucky; Dallas, Texas; Toledo, Ohio; and Ann Arbor, Michigan markets.
(2) In October 2004, we transferred two operating bakery-cafes to a new franchisee in the acquisition of the minority interest. See
Note 3 of our Consolidated Financial Statements for further information.
Increases in comparable bakery-cafe sales for the fiscal year ended December 27, 2005, December 25, 2004, and December 27, 2003 were as follows: For the Fiscal Year Ended
December 27, 2005
December 25, 2004
December 27, 2003
Company-owned.................................................................................................................. 7.4% 2.9% 1.7% Franchised............................................................................................................................ 8.0% 2.6% -0.4% System-wide......................................................................................................................... 7.8% 2.7% 0.2%
Company-owned comparable bakery-cafe sales increases are based on sales for bakery-cafes that have been in operation and company-owned for at least 18 months. Franchise-operated comparable bakery-cafe sales increases are based on sales for bakery-cafes that have been in operation for at least 18 months. Both Company-owned and franchise-operated comparable bakery-cafe sales exclude closed locations.
Comparable sales during the fiscal year ended December 27, 2005 increased at a higher rate than comparable sales during the fiscal year ended December 25, 2004 primarily as a result of increased sales of products from our new antibiotic free chicken, sales from our Via Panera® catering business which began in 2004, sales from strengthened new product development in 2005, in store execution, and price increases.
Comparable sales during the fiscal year ended December 25, 2004 increased at a higher rate than comparable sales during the fiscal year ended December 27, 2003 primarily as a result of sales from the roll-out of the Via Panera® catering business which began in 2004, sales from strengthened new product development in 2004, the implementation of several Company initiatives by the franchise-operated bakery-cafes in 2004 related to increased staffing, quality, and speed of customer service, and price increases.

20
Fiscal Year 2005 Compared to Fiscal Year 2004 Results of Operations Revenues
Our total revenues for the fiscal year ended December 27, 2005 increased 33.6% to $640.3 million compared to $479.1 million for the fiscal year ended December 25, 2004. The growth in total revenues for the fiscal year ended December 27, 2005, as compared to the prior year, was primarily due to the opening of 139 new bakery-cafes in 2005 as well as increases in system-wide comparable bakery-cafe sales of 7.8% for the fiscal year ended December 27, 2005. The system-wide average weekly sales per bakery-cafe and the related number of operating weeks for the fiscal year ended December 27, 2005 and December 25, 2004 were as follows: For the Fiscal Year Ended
December 27, 2005
December 25, 2004
Percentage Increase
System-wide average weekly sales .......................................................................................... $ 38,318 $ 36,008 6.4% System-wide number of operating weeks ................................................................................ 41,370 34,470 20.0%
Average weekly sales is calculated by dividing total net sales by operating weeks. Accordingly, year over year growth reflects sales for all locations, whereas comparable store sales exclude closed locations and are based on sales for bakery-cafes that have been in operation and owned for at least 18 months.
New stores typically experience an opening “honey-moon” whereby they generate higher average weekly sales during the first 12 to 16 weeks they are open as customers “settle-in” to normal usage patterns from initial trial of the location. On average the “settle-in” experienced is 5% to 10% from the average weekly sales during the “honey-moon” period. As a result, year over year growth in average weekly sales is generally lower than the growth in comparable bakery-cafe sales. This results from the relationship of the number of bakery- cafes in the “honey-moon” phase, the number of bakery-cafes in the “settle-in” phase, and the number of stores in the comparable store base.
As described above, we had an additional three days in the first quarter of 2005 as compared to the first quarter of 2004 as a result of changing our fiscal week in 2005 to end on Tuesday rather than Saturday. Average weekly sales and comparable bakery-cafe sales exclude these three additional days in the first quarter of 2005 for comparative purposes.
Bakery-cafe sales for the fiscal year ended December 27, 2005 for the Company-owned bakery-cafes increased 37.9% to $499.4 million from $362.1 million for the fiscal year ended December 25, 2004. Company-owned bakery-cafe sales as a percentage of total revenue increased by 2.4 percentage points for the fiscal year ended December 27, 2005 compared to the fiscal year ended December 25, 2004, and fresh dough sales to franchisees as a percentage of total revenue decreased by 1.6 percentage points for the fiscal year ended December 27, 2005 compared to the fiscal year ended December 25, 2004, primarily as a result of the increase in the number of Company-owned bakery-cafe openings. The increase in bakery-cafe sales was primarily due to the impact of a full year’s operations of the 54 Company-owned bakery-cafes opened in 2004, the opening of 66 Company-owned bakery-cafes in 2005, and the 7.4% increase in comparable bakery-cafe sales for the fiscal year ended December 27, 2005. Bakery-cafes included in comparable sales increases and not included in comparable sales increases contributed 17% and 83%, respectively, of the $137.3 million increase in sales from 2004. The average weekly sales per Company-owned bakery-cafe and the related number of operating weeks for the fiscal years ended December 27, 2005 and December 25, 2004 were as follows: For the Fiscal Year Ended
December 27, 2005
December 25, 2004
Percentage Increase
Company-owned average weekly sales ................................................................................... $ 37,348 $ 35,620 4.9% Company-owned number of operating weeks ......................................................................... 13,280 10,166 30.6%
Franchise royalties and fees rose 22.3% to $54.3 million for the fiscal year ended December 27, 2005 from $44.4 million for the fiscal year ended December 25, 2004. The components of franchise royalties and fees were as follows (in thousands): For the Fiscal Year Ended
December 27, 2005
December 25, 2004
Franchise royalties ....................................................................................................................................... $ 51,539 $ 41,199 Franchise fees .............................................................................................................................................. 2,770 3,250 Total ........................................................................................................................................................... $ 54,309 $ 44,449

21
The increase in royalty revenue can be attributed to the impact of a full year’s operations of the 89 franchise-operated bakery-cafes
opened in 2004, the opening of 73 franchise-operated bakery-cafes in 2005, and the 8.0% increase in comparable franchise-operated bakery-cafe sales for the fiscal year ended December 27, 2005. Franchise-operated bakery-cafes included in comparable sales increases and not included in comparable sales increases contributed 30% and 70%, respectively, of the $210.2 million increase in sales from 2004. The average weekly sales per franchise-operated bakery-cafe and the related number of operating weeks for the fiscal year ended December 27, 2005 and December 25, 2004 were as follows: For the Fiscal Year Ended
December 27, 2005
December 25, 2004
Percentage Increase
Franchisee average weekly sales ............................................................................................. $ 38,777 $ 36,171 7.2% Franchisee number of operating weeks.................................................................................... 28,090 24,303 15.6%
As of December 27, 2005, there were 566 franchise-operated bakery-cafes open and commitments to open 416 additional franchise-operated bakery-cafes. We expect these bakery-cafes to open according to the timetables established in the various ADAs with franchisees, with the majority opening in the next four to five years. In 2006, we expect our area developers to open 80 to 85 new franchise-operated bakery-cafes. The ADA requires a franchisee to develop a specified number of bakery-cafes on or before specific dates. If a franchisee fails to develop bakery-cafes on schedule, we have the right to terminate the ADA and develop Company-owned locations or develop locations through new area developers in that market. We may exercise one or more alternative remedies to address defaults by area developers, including not only development defaults, but also defaults in complying with our operating and brand standards and other covenants under the ADAs and franchise agreements.
Fresh dough facility sales to franchisees increased 19.1% to $86.5 million for the fiscal year ended December 27, 2005 from $72.6 million for the fiscal year ended December 25, 2004. The increase was primarily driven by the increased number of franchise-operated bakery-cafes opened described previously. Costs and Expenses
The cost of food and paper products includes the costs associated with the fresh dough operations that sell fresh dough products to Company-owned bakery-cafes, as well as the cost of food and paper products supplied by third party vendors and distributors. The costs associated with the fresh dough operations that sell fresh dough products to the franchise-operated bakery-cafes are excluded and are shown separately as fresh dough cost of sales to franchisees in the Consolidated Statements of Operations. The cost of food and paper products increased to 28.6% of bakery-cafe sales for the fiscal year ended December 27, 2005 compared to 28.1% of bakery-cafe sales for the fiscal year ended December 25, 2004. This increase in the cost of food and paper products as a percentage of bakery-cafe sales was primarily due to higher cost and mix impact of antibiotic free chicken and higher fuel costs, which averaged $2.84 per gallon in 2005 compared to $2.06 in 2004, partially offset by improved leveraging of fresh dough manufacturing costs we achieved as more bakery-cafes were opened. For the fiscal year ended December 27, 2005, there was an average of 48.0 bakery-cafes per fresh dough facility compared to an average of 39.2 for the fiscal year ended December 25, 2004.
Labor expense was $151.5 million, or 30.3% of bakery-cafe sales, for the fiscal year ended December 27, 2005 compared to $110.8 million, or 30.6% of bakery-cafe sales, for the fiscal year ended December 25, 2004. The labor expense as a percentage of bakery-cafe sales decreased between the fiscal year ended December 27, 2005 and the fiscal year ended December 25, 2004 primarily as a result of leveraging these costs over higher sales volumes, partially offset by higher costs in the bakery-cafe bonus program.
For the fiscal year ended December 27, 2005, fresh dough facility cost of sales to franchisees was $75.0 million, or 86.7% of fresh dough facility sales to franchisees, compared to $65.6 million, or 90.4% of fresh dough facility sales to franchisees, for the fiscal year ended December 25, 2004. The decrease in the fresh dough facility cost of sales rate in fiscal year 2005 was primarily due to lower ingredient costs. Butter costs in 2005 averaged $1.64 per pound compared to $1.94 per pound in 2004.
General and administrative expenses were $46.3 million, or 7.2% of total revenue, and $33.3 million, or 7.0% of total revenue, for the fiscal years ended December 27, 2005 and December 25, 2004, respectively. The increase in the general and administrative expense rate between 2005 and 2004 was primarily the result of increased incentive compensation and marketing costs partially offset by the improved leveraging of these costs over higher revenue.

22
Operating Profit
Operating profit for the fiscal year ended December 27, 2005 increased to $81.1 million, or 12.7% of total revenue, from $61.8 million, or 12.9% of total revenue, for the fiscal year ended December 25, 2004. Operating profit as a percentage of total revenues for the fiscal year ended December 27, 2005 deceased as a result of the factors described above. Other Income and Expense
Other income and expense for the fiscal year ended December 27, 2005 increased to $1.1 million of income, or 0.2% of total revenue, from $1.1 million of expense, or 0.3% of total revenue, for the fiscal year ended December 25, 2004. The increase in other income and expense results primarily from increased interest income in 2005 resulting from both higher investment balances and higher interest rates. Income Taxes
The provision for income taxes increased to $30.0 million for the fiscal year ended December 27, 2005 compared to $22.2 million for the fiscal year ended December 25, 2004. The tax provisions for the fiscal year ended December 27, 2005 and December 25, 2004 reflected a consistent combined federal, state, and local effective tax rate of 36.5%. Net Income
Net income for the fiscal year ended December 27, 2005 increased $13.6 million, or 35%, to $52.2 million, or $1.65 per diluted share, compared to net income of $38.6 million, or $1.25 per diluted share, for the fiscal year ended December 25, 2004. The increase in net income in 2005 resulted from the factors described above. Fiscal Year 2004 Compared to Fiscal Year 2003 Results of Operations Revenues
Our total revenues for the fiscal year ended December 25, 2004 increased 31.7% to $479.1 million compared to $363.7 million for the fiscal year ended December 27, 2003. The growth in total revenues for the fiscal year ended December 25, 2004, as compared to the prior year, is primarily due to the opening of 143 new bakery-cafes in 2004 as well as increases in system-wide comparable bakery-cafe sales of 2.7% for the fiscal year ended December 25, 2004. The system-wide average weekly sales per bakery-cafe and the related number of operating weeks for the fiscal year ended December 25, 2004 and December 27, 2003 were as follows: For the Fiscal Year Ended
December 25, 2004
December 27, 2003
Percentage Increase
System-wide average weekly sales .......................................................................................... $ 36,008 $ 35,617 1.1% System-wide number of operating weeks ................................................................................ 34,470 27,427 25.7%
Average weekly sales is calculated by dividing total net sales by operating weeks. Accordingly, year over year growth reflects all sales, whereas comparable store sales reflects only sales for those bakery-cafes that have been open for more than 18 months.
New stores typically experience an opening “honey-moon” whereby they generate higher average weekly sales during the first 12 to 16 weeks they are open as customers “settle-in” to normal usage patterns from initial trial of the location. On average the “settle-in” experienced is 5% to 10% from the average weekly sales during the “honey-moon” period. As a result, year over year growth in average weekly sales is generally lower than the growth in comparable bakery-cafe sales. This results from the relationship of the number of bakery- cafes in the “honey-moon” phase, the number of bakery-cafes in the “settle-in” phase, and the number of stores in the comparable store base.
Bakery-cafe sales for the fiscal year ended December 25, 2004 for the Company-owned bakery-cafes increased 36.2% to $362.1 million from $265.9 million for the fiscal year ended December 27, 2003. Company-owned bakery-cafe sales as a percentage of total revenue increased by 2.5 percentage points for the fiscal year ended December 25, 2004 compared to the fiscal year ended December 27, 2003, and fresh dough sales to franchisees as a percentage of total revenue decreased by 1.8 percentage points for the fiscal year

23
ended December 25, 2004 compared to the fiscal year ended December 27, 2003, primarily as a result of the increase in the number of Company-owned bakery-cafe openings. The increase in bakery-cafe sales was primarily due to the impact of a full year’s operations of the 29 Company-owned bakery-cafes opened and 15 bakery-cafes acquired in 2003, the opening of 54 Company-owned bakery-cafes in 2004, and the 2.9% increase in comparable bakery-cafe sales for the fiscal year ended December 25, 2004. Bakery-cafes included in comparable sales increases and not included in comparable sales increases contributed 8% and 92%, respectively, of the $96.2 million increase in sales from 2003. The average weekly sales per Company-owned bakery-cafe and the related number of operating weeks for the fiscal year ended December 25, 2004 and December 27, 2003 were as follows:
For the Fiscal Year Ended
December 25, 2004
December 27, 2003
Percentage Increase
Company-owned average weekly sales ................................................................................... $ 35,620 $ 35,198 1.2% Company-owned number of operating weeks ......................................................................... 10,166 7,555 34.6%
Franchise royalties and fees rose 22.7% to $44.4 million for the fiscal year ended December 25, 2004 from $36.2 million for the
fiscal year ended December 27, 2003. The components of franchise royalties and fees were as follows (in thousands): For the Fiscal Year Ended
December 25, 2004
December 27, 2003
Franchise royalties ....................................................................................................................................... $ 41,199 $ 32,903 Franchise fees .............................................................................................................................................. 3,250 3,342 Total ........................................................................................................................................................... $ 44,449 $ 36,245
The increase in royalty revenue can be attributed to the impact of a full year’s operations of the 102 franchise-operated bakery-
cafes opened in 2003, the opening of 89 franchise-operated bakery-cafes in 2004, and the 2.6% increase in comparable franchise-operated bakery-cafe sales for the fiscal year ended December 25, 2004. Franchise-operated bakery-cafes included in comparable sales increases and not included in comparable sales increases contributed 9% and 91%, respectively, of the $168.1 million increase in sales from 2003. The average weekly sales per franchise-operated bakery-cafe and the related number of operating weeks for the fiscal year ended December 25, 2004 and December 27, 2003 were as follows: For the Fiscal Year Ended
December 25, 2004
December 27, 2003
Percentage Increase
Franchisee average weekly sales ............................................................................................. $ 36,171 $ 35,777 1.1% Franchisee number of operating weeks.................................................................................... 24,303 19,872 22.3%
As of December 25, 2004, there were 515 franchise-operated bakery-cafes open and commitments to open 406 additional franchise-operated bakery-cafes. We expect these bakery-cafes to open according to the timetables established in the various ADAs with franchisees, with the majority opening in the next four to five years. In 2005, we expect to open 80 to 90 new franchise-operated bakery-cafes. The ADA requires a franchisee to develop a specified number of bakery-cafes on or before specific dates. If a franchisee fails to develop bakery-cafes on schedule, we have the right to terminate the ADA and develop Company-owned locations or develop locations through new area developers in that market. We may exercise one or more alternative remedies to address defaults by area developers, including not only development defaults, but also defaults in complying with our operating and brand standards and other covenants under the ADAs and franchise agreements.
Fresh dough facility sales to franchisees increased 18.0% to $72.6 million for the fiscal year ended December 25, 2004 from $61.5 million for the fiscal year ended December 27, 2003. The increase was primarily driven by the increased number of franchise-operated bakery-cafes opened described previously partially offset by a decrease in average fresh dough sales per bakery-cafe to franchisees due to a change in the mix of product sold by franchisees.

24
Costs and Expenses
The cost of food and paper products includes the costs associated with the fresh dough operations that sell fresh dough products to Company-owned bakery-cafes as well as the cost of food and paper products supplied by third party vendors and distributors. The costs associated with the fresh dough operations that sell fresh dough products to the franchise-operated bakery-cafes are excluded and are shown separately as fresh dough cost of sales to franchisees in the Consolidated Statements of Operations. The cost of food and paper products increased to 28.1% of bakery-cafe sales for the fiscal year ended December 25, 2004 compared to 27.8% of bakery-cafe sales for the fiscal year ended December 27, 2003. This increase in the cost of food and paper products as a percentage of bakery-cafe sales was primarily due to higher commodity costs, including higher fuel costs, which averaged $2.06 per gallon in 2004 compared to $1.71 in 2003, and higher fresh dough facility operational costs related to lease and related leasehold improvement accounting as described in Note 2 to the Consolidated Financial Statements, partially offset by improved leveraging of fresh dough manufacturing costs we achieved as more bakery-cafes were opened. For the fiscal year ended December 25, 2004, there was an average of 39.2 bakery-cafes per fresh dough facility compared to an average of 32.7 for the fiscal year ended December 27, 2003.
Labor expense was $110.8 million, or 30.6% of bakery-cafe sales, for the fiscal year ended December 25, 2004 compared to $81.2 million, or 30.5% of bakery-cafe sales, for the fiscal year ended December 27, 2003. The labor expense as a percentage of bakery-cafe sales increased between the fiscal year ended December 25, 2004 and the fiscal year ended December 27, 2003 primarily as a result of start-up inefficiencies related to the increase in Company-owned bakery-cafe openings in 2004 compared to 2003 and higher benefit costs partially offset by leveraging these costs over higher sales volumes.
Occupancy costs were $26.7 million, or 7.4% of bakery-cafe sales, for the fiscal year ended December 25, 2004 compared to $19.0 million, or 7.1% of bakery-cafe sales, for the fiscal year ended December 27, 2003. The occupancy cost as a percentage of bakery-cafe sales increased for the fiscal year ended December 25, 2004 primarily due to higher rent cost related to lease accounting as described in Note 2 to the Consolidated Financial Statements.
Other bakery-cafe operating expenses, which include advertising, retail field overhead, utilities, and other bakery-cafe expenses, were $51.0 million, or 14.1% of bakery-cafe sales, for the fiscal year ended December 25, 2004 compared to $36.8 million, or 13.8% of bakery-cafe sales, for the fiscal year ended December 27, 2003. The increase in other bakery-cafe operating expenses as a percentage of bakery-cafe sales for the fiscal year ended December 25, 2004 was primarily due to increased organizational costs for field management, including recruiting, training, and advertising, associated with new markets that do not yet have multi-unit leverage.
For the fiscal year ended December 25, 2004, fresh dough facility cost of sales to franchisees was $65.6 million, or 90.4% of fresh dough facility sales to franchisees, compared to $55.0 million, or 89.3% of fresh dough facility sales to franchisees, for the fiscal year ended December 27, 2003. The increase in the fresh dough cost of sales rate in fiscal 2004 was primarily due to increased commodity costs, including butter, tuna, and cream cheese.
Depreciation and amortization was $25.3 million, or 5.3% of total revenue, for the fiscal year ended December 25, 2004 compared to $18.3 million, or 5.0% of total revenue, for the fiscal year ended December 27, 2003. The increase in depreciation and amortization as a percentage of total revenue for the fiscal year ended December 25, 2004 compared to the fiscal year ended December 27, 2003 was primarily due to the impact of a full year’s depreciation of prior year’s capital expenditures and increased capital expenditures in the current year.
General and administrative expenses were $33.3 million, or 7.0% of total revenue for fiscal year 2004, compared to $28.1 million, or 7.7% of total revenue, for the fiscal year ended December 25, 2004 and December 27, 2003, respectively. The decrease in the general and administrative expense rate between 2004 and 2003 was primarily the result of the improved leveraging of these costs over higher revenue.
Pre-opening expenses, which consist primarily of labor and food costs incurred during in-store training and preparation for opening, exclusive of manager training costs which are included in general and administrative expenses, were $2.6 million, or 0.6% of total revenue, for the fiscal year ended December 25, 2004 compared to $1.5 million, or 0.4% of total revenue, for the fiscal year ended December 27, 2003. The increase in pre-opening expenses as a percentage of total revenue for the fiscal year ended December 25, 2004 compared to the fiscal year ended December 27, 2003 was primarily due to increased number of Company-owned bakery-cafe openings in 2004 compared to 2003 as described above.

25
Operating Profit
Operating profit for the fiscal year ended December 25, 2004 increased to $61.8 million, or 12.9% of total revenue, from $49.9 million, or 13.7% of total revenue, for the fiscal year ended December 27, 2003. Operating profit as a percentage of total revenues for the fiscal year ended December 25, 2004 declined as a result of the factors described above. Other Income and Expense
Other expense for the fiscal year ended December 25, 2004 decreased to $1.1 million, or 0.3% of total revenue, from $1.6 million, or 0.4% of total revenue, for the fiscal year ended December 27, 2003. The decrease in other expense results primarily from increased interest income in 2004. Income Taxes
The provision for income taxes increased to $22.2 million for the fiscal year ended December 25, 2004 compared to $17.6 million for the fiscal year ended December 27, 2003. The tax provisions for the fiscal year ended December 25, 2004 and December 27, 2003 reflected a consistent combined federal, state, and local effective tax rate of 36.5%. Income Before Cumulative Effect of Accounting Change
Income before cumulative effect of accounting change for the fiscal year ended December 25, 2004 increased $7.9 million, or 25.7%, to $38.6 million, or $1.25 per diluted share, compared to income before cumulative effect of accounting change of $30.7 million, or $1.01 per diluted share, for the fiscal year ended December 27, 2003. The 2004 increase in income before cumulative effect of accounting change was primarily due to an increase in bakery-cafe sales, franchise royalties and fees, and fresh dough sales to franchisees partially offset by higher costs as described above. Net Income
Net income for the fiscal year ended December 25, 2004 increased $8.2 million, or 27.0%, to $38.6 million, or $1.25 per diluted share, compared to net income of $30.4 million, or $1.00 per diluted share, for the fiscal year ended December 27, 2003. The increase in net income in 2004 resulted from the factors described above. Critical Accounting Policies & Estimates
The Company’s discussion and analysis of its financial condition and results of operations is based upon the Consolidated Financial Statements and Notes to the Consolidated Financial Statements, which have been prepared in accordance with generally accepted accounting principles in the United States. The preparation of these consolidated financial statements requires management to make estimates, judgments and assumptions, which management believes to be reasonable, based on the information available. These estimates and assumptions affect the reported amounts of assets, liabilities, revenues and expenses and related disclosures of contingent assets and liabilities. Variances in the estimates or assumptions used could yield materially different accounting results. The Company believes the following critical accounting policies involve additional management judgment due to the sensitivity of the methods, assumptions, and estimates necessary in determining the related asset and liability amounts.
Revenue Recognition
We recognize revenue upon delivery of product or performance of services as follows. Bakery-cafe sales are recorded upon delivery of food and other products to a customer. In addition, fresh dough sales to franchisees are recorded upon delivery of fresh dough to franchisees. Also, a liability is recorded in the period in which a gift card is issued and proceeds are received. As gift cards are redeemed, this liability is reduced and revenue is recognized as a sale. Further, franchise fees are the result of sales of area development rights and the sale of individual franchise locations to third parties. The initial franchise fee is $35,000 per bakery-cafe to be developed under the Area Development Agreement (ADA). Of this fee, $5,000 is paid at the time of signing of the ADA and is recognized as revenue when it is received as it is non-refundable and we have to perform no other service to earn this fee. The remaining $30,000 is paid at the time an individual franchise agreement is signed and is recognized as revenue upon the commencement of franchise operations of the bakery-cafes. Royalties are paid weekly based on a percentage of sales, ranging from 4% to 5%, as defined in the agreement. Royalties are recognized as revenue when they are earned.
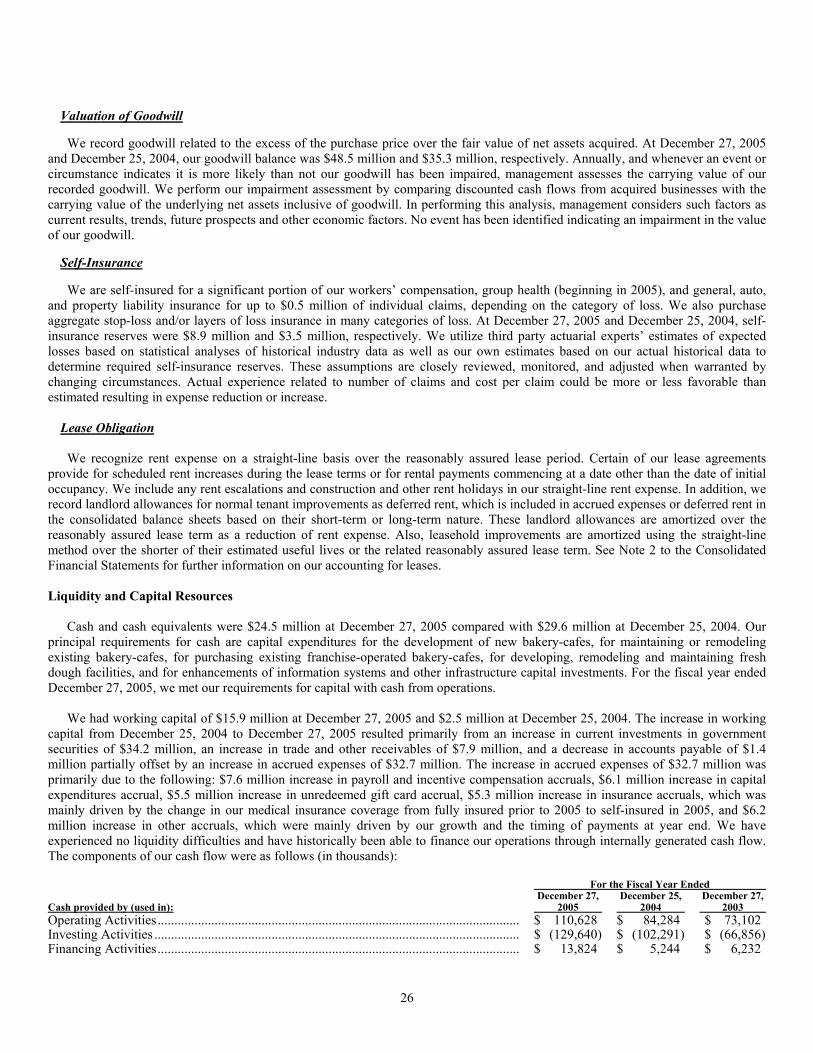
26
Valuation of Goodwill
We record goodwill related to the excess of the purchase price over the fair value of net assets acquired. At December 27, 2005
and December 25, 2004, our goodwill balance was $48.5 million and $35.3 million, respectively. Annually, and whenever an event or circumstance indicates it is more likely than not our goodwill has been impaired, management assesses the carrying value of our recorded goodwill. We perform our impairment assessment by comparing discounted cash flows from acquired businesses with the carrying value of the underlying net assets inclusive of goodwill. In performing this analysis, management considers such factors as current results, trends, future prospects and other economic factors. No event has been identified indicating an impairment in the value of our goodwill.
Self-Insurance
We are self-insured for a significant portion of our workers’ compensation, group health (beginning in 2005), and general, auto, and property liability insurance for up to $0.5 million of individual claims, depending on the category of loss. We also purchase aggregate stop-loss and/or layers of loss insurance in many categories of loss. At December 27, 2005 and December 25, 2004, self-insurance reserves were $8.9 million and $3.5 million, respectively. We utilize third party actuarial experts’ estimates of expected losses based on statistical analyses of historical industry data as well as our own estimates based on our actual historical data to determine required self-insurance reserves. These assumptions are closely reviewed, monitored, and adjusted when warranted by changing circumstances. Actual experience related to number of claims and cost per claim could be more or less favorable than estimated resulting in expense reduction or increase.
Lease Obligation
We recognize rent expense on a straight-line basis over the reasonably assured lease period. Certain of our lease agreements provide for scheduled rent increases during the lease terms or for rental payments commencing at a date other than the date of initial occupancy. We include any rent escalations and construction and other rent holidays in our straight-line rent expense. In addition, we record landlord allowances for normal tenant improvements as deferred rent, which is included in accrued expenses or deferred rent in the consolidated balance sheets based on their short-term or long-term nature. These landlord allowances are amortized over the reasonably assured lease term as a reduction of rent expense. Also, leasehold improvements are amortized using the straight-line method over the shorter of their estimated useful lives or the related reasonably assured lease term. See Note 2 to the Consolidated Financial Statements for further information on our accounting for leases. Liquidity and Capital Resources
Cash and cash equivalents were $24.5 million at December 27, 2005 compared with $29.6 million at December 25, 2004. Our principal requirements for cash are capital expenditures for the development of new bakery-cafes, for maintaining or remodeling existing bakery-cafes, for purchasing existing franchise-operated bakery-cafes, for developing, remodeling and maintaining fresh dough facilities, and for enhancements of information systems and other infrastructure capital investments. For the fiscal year ended December 27, 2005, we met our requirements for capital with cash from operations.
We had working capital of $15.9 million at December 27, 2005 and $2.5 million at December 25, 2004. The increase in working capital from December 25, 2004 to December 27, 2005 resulted primarily from an increase in current investments in government securities of $34.2 million, an increase in trade and other receivables of $7.9 million, and a decrease in accounts payable of $1.4 million partially offset by an increase in accrued expenses of $32.7 million. The increase in accrued expenses of $32.7 million was primarily due to the following: $7.6 million increase in payroll and incentive compensation accruals, $6.1 million increase in capital expenditures accrual, $5.5 million increase in unredeemed gift card accrual, $5.3 million increase in insurance accruals, which was mainly driven by the change in our medical insurance coverage from fully insured prior to 2005 to self-insured in 2005, and $6.2 million increase in other accruals, which were mainly driven by our growth and the timing of payments at year end. We have experienced no liquidity difficulties and have historically been able to finance our operations through internally generated cash flow. The components of our cash flow were as follows (in thousands): For the Fiscal Year Ended Cash provided by (used in):
December 27, 2005
December 25, 2004
December 27, 2003
Operating Activities............................................................................................................ $ 110,628 $ 84,284 $ 73,102 Investing Activities ............................................................................................................. $ (129,640) $ (102,291) $ (66,856) Financing Activities............................................................................................................ $ 13,824 $ 5,244 $ 6,232

27
Operating Activities
Funds provided by operating activities for the fiscal year ended December 27, 2005, December 25, 2004, and December 27, 2003
were $110.6 million, $84.3 million, and $73.1 million, respectively. Funds provided by operating activities for all three fiscal years primarily resulted from net income, depreciation and amortization, tax benefit from exercise of stock options, deferred rent, and accrued expenses, partially offset by increased trade and other accounts receivable.
Investing Activities
Total capital expenditures for the fiscal year ended December 27, 2005 were $82.1 million and were primarily related to the opening of 66 Company-owned bakery-cafes in 2005, costs incurred on Company-owned bakery-cafes to be opened in the first and second quarter of 2006, and the maintaining or remodeling of existing bakery-cafes and fresh dough facilities. Additionally, we acquired 21 operating cafes and two cafes under construction from a franchisee for $28.0 million. See Note 3 to the Consolidated Financial Statements for further information on this transaction. Total capital expenditures were $80.4 million for the fiscal year ended December 25, 2004 and were primarily related to the opening of 54 Company-owned bakery-cafes in 2004, costs incurred on Company-owned bakery-cafes to be opened in the first and second quarter of 2005, and the maintaining or remodeling of existing bakery-cafes and fresh dough facilities. Additionally, in 2004, we acquired one operating bakery-cafe from a franchisee for $0.2 million and acquired the membership interest of the former minority interest owner for $4.9 million plus the transfer of two operating bakery-cafes and one bakery-cafe under construction. Total capital expenditures were $45.8 million for the fiscal year ended December 27, 2003 and were primarily related to the opening of 29 Company-owned bakery-cafes in 2003, costs incurred on Company-owned bakery-cafes to be opened in the first and second quarter of 2004, the opening of three fresh dough facilities, and the maintaining or remodeling of existing bakery-cafes and fresh dough facilities. Additionally, in 2003, we acquired 15 operating bakery-cafes, two closed bakery-cafes, and two bakery-cafes under construction from franchisees for $21.0 million.
As of December 27, 2005 and December 25, 2004, we had investments of $46.3 million and $28.4 million, respectively, in United States treasury notes and government agency securities. Investments are classified as short or long-term in the accompanying consolidated balance sheet based upon their stated maturity dates. As of December 27, 2005, all investments were classified as held-to-maturity as we have the intent and ability to hold the securities to maturity. Held-to-maturity securities are stated at amortized cost, adjusted for amortization of premiums to maturity, which approximates fair value at December 27, 2005.
Financing Activities
On December 19, 2003, we entered into a $10.0 million unsecured revolving line of credit (revolver). The revolver matures December 19, 2006 and has an interest rate of LIBOR plus 0.75% to 1.5% depending on our leverage ratio and type of loan (resulting in interest rates of approximately 5.0% to 5.8% at December 27, 2005). The revolver contains restrictions relating to future indebtedness, liens, investments, distributions, mergers, acquisition, or sale of assets and certain leasing transactions. The revolver also requires the maintenance of certain financial ratios and covenants. As of December 27, 2005, we were in compliance with all debt covenants. At December 27, 2005, we had $9.8 million available under the revolver with $0.2 million utilized by an outstanding letter of credit. We have not borrowed under our revolver in any of the last three fiscal years.
Financing activities provided $13.8 million, $5.2 million, and $6.2 million for the fiscal years ended December 27, 2005, December 25, 2004, and December 27, 2003, respectively. The financing activities in the fiscal year ended December 27, 2005 included $12.6 million from the exercise of stock options and $1.2 million from the issuance of common stock under employee benefit plans. The financing activities for the fiscal year ended December 25, 2004 primarily included $3.6 million from the exercise of stock options and $1.1 million from the issuance of common stock under employee benefit plans. The financing activities for the fiscal year ended December 27, 2003 primarily included $4.2 million from the exercise of stock options and $1.2 million from capital investments by our former minority interest owner.

28
Quarterly Calendar Change
As previously reported, we adopted a new quarterly calendar beginning fiscal 2006 whereby each of our quarters will include 13 weeks (4 week, 5 week, and 4 week period progressions in each quarter), rather than our previous quarterly calendar which had 16 weeks in the first quarter and 12 weeks in the second, third and fourth quarters (4 week period progressions in each quarter). Our fiscal week will continue to end on Tuesday, with fiscal 2006 ending on December 26, 2006. Our pro forma consolidated statements of operations for each of the quarters of fiscal 2005 conformed to the 2006 quarterly presentation is as follows:
Panera Bread Company Pro Forma Consolidated Statements of Operations
For the Thirteen Weeks Ended
March 29, 2005
June 28, 2005
September 27, 2005
December 27, 2005
(in thousands, except per share amounts) Revenues:
Bakery-cafe sales ......................................................................................... $ 110,559 $ 117,836 $ 123,965 $ 147,062 Franchise royalties and fees ......................................................................... 12,448 13,214 13,426 15,221 Fresh dough sales to franchisees.................................................................. 21,130 20,858 20,681 23,875
Total revenue........................................................................................... 144,137 151,908 158,072 186,158 Costs and expenses:
Bakery-cafe expenses: Cost of food and paper products............................................................... 29,478 34,925 36,914 41,358 Labor......................................................................................................... 34,038 36,250 37,945 43,291 Occupancy................................................................................................. 8,626 8,751 9,390 10,622 Other operating expenses .......................................................................... 15,509 17,209 17,588 19,697 Total bakery-cafe expenses ..................................................................... 87,651 97,135 101,837 114,968
Fresh dough cost of sales to franchisees ...................................................... 19,004 17,817 17,585 20,630 Depreciation and amortization ..................................................................... 7,313 7,868 8,662 9,168 General and administrative expenses........................................................... 10,304 11,795 11,083 13,119 Pre-opening expenses................................................................................... 577 552 799 1,313
Total costs and expenses ......................................................................... 124,849 135,167 139,966 159,198 Operating profit ............................................................................................. 19,288 16,741 18,106 26,960 Interest expense ............................................................................................. 10 17 9 14 Other expense (income), net .......................................................................... 31 (131) (451) (582) Income before income taxes .......................................................................... 19,247 16,855 18,548 27,528 Income taxes .................................................................................................. 7,025 6,152 6,770 10,048
Net income.............................................................................................. $ 12,222 $ 10,703 $ 11,778 $ 17,480 Per share data:
Basic earnings per common share: Net income.............................................................................................. $ 0.40 $ 0.35 $ 0.38 $ 0.56
Diluted earnings per common share: Net income.............................................................................................. $ 0.39 $ 0.34 $ 0.37 $ 0.55
Weighted average shares of common and common equivalent shares outstanding Basic ............................................................................................................ 30,583 30,836 30,990 31,098 Diluted.......................................................................................................... 31,366 31,653 31,697 31,873

29
The following table sets forth the percentage relationship to total revenues, except where otherwise indicated, of certain items included in our pro forma consolidated statements of operations for the period indicated. Percentages may not add due to rounding:
Panera Bread Company Pro Forma Consolidated Statements of Operations
Margin Analysis For the Thirteen Weeks Ended
March 29, 2005
June 28, 2005
September 27, 2005
December 27, 2005
Revenues: Bakery-cafe sales .................................................................................................. 76.7% 77.6% 78.4% 79.0% Franchise royalties and fees .................................................................................. 8.6 8.7 8.5 8.2 Fresh dough sales to franchisees........................................................................... 14.7 13.7 13.1 12.8
Total revenue.................................................................................................... 100.0% 100.0% 100.0% 100.0% Costs and expenses:
Bakery-cafe expenses(1): Cost of food and paper products........................................................................ 26.7% 29.6% 29.8% 28.1% Labor.................................................................................................................. 30.8 30.8 30.6 29.4 Occupancy.......................................................................................................... 7.8 7.4 7.6 7.2 Other operating expenses ................................................................................... 14.0 14.6 14.2 13.4 Total bakery-cafe expenses .............................................................................. 79.3 82.4 82.1 78.2
Fresh dough cost of sales to franchisees(2) .......................................................... 89.9 85.4 85.0 86.4 Depreciation and amortization .............................................................................. 5.1 5.2 5.5 4.9 General and administrative expenses.................................................................... 7.1 7.8 7.0 7.0 Pre-opening expenses............................................................................................ 0.4 0.4 0.5 0.7
Total costs and expenses .................................................................................. 86.6 89.0 88.5 85.5 Operating profit ...................................................................................................... 13.4 11.0 11.5 14.5 Interest expense ...................................................................................................... — — — — Other (income) expense, net ................................................................................... — (0.1) (0.3) (0.3) Income before income taxes ................................................................................... 13.4 11.1 11.7 14.8 Income taxes ........................................................................................................... 4.9 4.0 4.3 5.4 Net income.............................................................................................................. 8.5% 7.0% 7.5% 9.4% ____________
(1) As a percentage of Company-owned bakery-cafe sales. (2) As a percentage of fresh dough sales to franchisees.

30
Contractual Obligations and Other Commitments
We currently anticipate total capital expenditures for fiscal year 2006 of approximately $120 million to $130 million principally for the opening of 70 to 75 new Company-owned bakery-cafes, the costs incurred related to early 2007 openings, the remodeling of existing bakery-cafes, the opening of 3 new fresh dough facilities, and the remodeling and expansion of existing fresh dough facilities. We expect future bakery-cafes will require, on average, an investment per bakery-cafe (excluding pre-opening expenses which are expensed as incurred) of approximately $0.9 million, which is net of landlord allowances. We expect to fund these expenditures principally through internally generated cash flow and cash from the exercise of employee stock options supplemented, where necessary, by borrowings on our revolver.
In addition to our capital expenditure requirements, we have certain other contractual and committed cash obligations. Our contractual cash obligations consist of noncancelable operating leases for our bakery-cafes, fresh dough facilities and trucks, and administrative offices. Lease terms for our trucks are generally for five to seven years. Lease terms for our bakery-cafes, fresh dough facilities, and administrative offices are generally for ten years with renewal options at most locations and generally require us to pay a proportionate share of real estate taxes, insurance, common area, and other operating costs. Many bakery-cafe leases provide for contingent rental (i.e., percentage rent) payments based on sales in excess of specified amounts. Certain of our lease agreements provide for scheduled rent increases during the lease terms or for rental payments commencing at a date other than the date of initial occupancy. See Note 2 to the Consolidated Financial Statements for further information on our accounting for leases. We expect cash expenditures under these lease obligations to be as follows: Payments Due by Period as of December 27, 2005 (in thousands) Total In 2006 2007-2008 2009-2010 After 2010 Operating Leases(1)................................................................. $ 507,251 $ 40,953 $ 81,349 $ 79,635 $ 305,314 ____________
(1) See Note 9 to the Consolidated Financial Statements for further information.
Off-Balance Sheet Arrangement — We are the prime tenant for operating leases of 14 franchisee locations and a guarantor for operating leases of 32 locations of the former Au Bon Pain Division, or our franchisees. These leases have terms expiring on various dates from January 2006 to December 2018 and have a potential amount of future rental payments of approximately $32.2 million. The obligation from these leases will continue to decrease over time as these operating leases expire. As the guarantees were initiated prior to December 31, 2002, we have not recorded a liability for these guarantees pursuant to the provisions of FASB Interpretation Number (FIN) 45, “Guarantor’s Accounting and Disclosure Requirements For Guarantees, Including Indirect Guarantees of Indebtedness of Others, an Interpretation of FASB Statements No. 5, 57, and 107 and Rescission of FASB Interpretation No. 34.” Also, we have not had to make any payments related to the leases. Au Bon Pain or the respective franchisees continue to have primary liability for these operating leases. Potential future commitments consist of: Potential Commitments as of December 27, 2005 (in thousands) Total In 2006 2007-2008 2009-2010 After 2010 Subleases and Lease Guarantees(1) ........................................... $ 32,199 $ 6,946 $ 10,140 $ 5,939 $ 9,174 ____________
(1) Represents aggregate minimum requirement — see Note 9 to the Consolidated Financial Statements for further information.
At December 27, 2005, we had two swap agreements, which fixed the price of our projected butter purchases in 2006. These agreements require us to purchase 6.8 million pounds of butter at $1.488 per pound. See Note 2 to the Consolidated Financial Statements for further information on our derivatives.
In November 2002, we signed an agreement with Dawn Food Products, Inc. (“Dawn”) to provide sweet goods for the period 2003-2007. The agreement with Dawn is structured as a cost plus agreement.
Beginning in fiscal 2003, we executed Confidential and Proprietary Information and Non-Competition Agreements (Agreements) with certain employees. These Agreements contain a provision whereby employees would be due a certain number of weeks of their salary if their employment was terminated by us as specified in the Agreement. In accordance with SFAS 5, we have not recorded a liability for these amounts potentially due employees. Rather, we will record a liability for these amounts when an amount becomes due to an employee. As of December 27, 2005, the total amount potentially owed employees under these Agreements was approximately $7.6 million.

31
Our capital requirements, including development costs related to the opening or acquisition of additional bakery-cafes and fresh dough facilities and maintenance and remodel expenditures, have and will continue to be significant. Our future capital requirements and the adequacy of available funds will depend on many factors, including the pace of expansion, real estate markets, site locations, and the nature of the arrangements negotiated with landlords. We believe that our cash flow from operations and the exercise of employee stock options, supplemented, where necessary, by borrowings on our revolver, will be sufficient to fund our capital requirements for the foreseeable future. Impact of Inflation
In the past, we have been able to recover inflationary cost and commodity price increases, including, among other things, fuel, butter, tuna, and cream cheese costs, through increased menu prices. There have been, and there may be in the future, delays in implementing such menu price increases, and competitive pressures may limit our ability to recover such cost increases in their entirety. Historically, the effects of inflation on our net income have not been materially adverse.
A majority of our employees are paid hourly rates related to federal and state minimum wage laws. Although we have and will continue to attempt to pass along any increased labor costs through food price increases, there can be no assurance that all such increased labor costs can be reflected in our prices or that increased prices will be absorbed by consumers without diminishing to some degree consumer spending at the bakery-cafes. However, we have not experienced to date a significant reduction in bakery-cafe profit margins as a result of changes in such laws, and management does not anticipate any related future significant reductions in gross profit margins. Recent Accounting Pronouncements
In December 2004, the Financial Accounting Standards Board (FASB) issued Statement of Financial Accounting Standards (SFAS) No. 123R, “Share-Based Payment” (“SFAS 123R”), a revision of SFAS No. 123, “Accounting for Stock-Based Compensation.” SFAS 123R will require us to, among other things, measure employee stock-based compensation awards where applicable using a fair value method and record related expense in our consolidated financial statements. The provisions of SFAS 123R are effective for public companies for annual periods beginning after June 15, 2005. We anticipate we will adopt SFAS 123R effective December 28, 2005 using the modified prospective transition approach and estimate adoption of the expensing requirements will reduce our diluted earnings per share by $0.13 in 2006.
In December 2004, the FASB issued FASB Staff Position No. FAS 109-1, “Application of SFAS No. 109, Accounting for Income Taxes, to the Tax Deduction on Qualified Production Activities provided by the American Jobs Creation Act of 2004” (“FSP 109-1”). FSP 109-1 states that qualified domestic production activities should be accounted for as a special deduction under SFAS No. 109, “Accounting for Income Taxes.” The provisions of FSP 109-1 are effective immediately. Adoption of this pronouncement did not have a significant impact on our financial statements.
On October 6, 2005, the FASB issued FASB Staff Position No. FAS 13-1, “Accounting for Rental Costs Incurred During a Construction Period” (“FSP 13-1”). FSP 13-1 is effective for the first reporting period beginning after December 15, 2005. FSP 13-1 states that rental costs associated with operating leases must be recognized as rental expense allocated on a straight-line basis over the lease term, which includes the construction period. This accounting is consistent with our current practice. ITEM 7A. QUANTITATIVE AND QUALITATIVE DISCLOSURES ABOUT MARKET RISK
We manage our commodity market risk in several ways. As of December 27, 2005, we had two swap agreements which fixed the price of our projected butter purchases in 2006. All derivative instruments are entered into for other than trading purposes. See Note 2 to the Consolidated Financial Statements for further information on these derivatives. In addition, we purchase certain commodities, such as flour and coffee, for use in our business. These commodities are sometimes purchased under agreements of one to three year time frames usually at a fixed price. As a result, we are subject to market risk that current market prices may be above or below our contractual price.
Our unsecured revolver bears an interest rate using LIBOR as the basis, and therefore is subject to additional interest expense should there be an increase in LIBOR interest rates. We have not borrowed under the revolver in the last three years. As of December 27, 2005, we had no foreign operations, and accordingly, no foreign exchange rate fluctuation risk at that time.

32
ITEM 8. FINANCIAL STATEMENTS AND SUPPLEMENTARY DATA
The following consolidated financial statements are included in response to this item:
Report of Independent Registered Public Accounting Firm
Consolidated Balance Sheets
Consolidated Statements of Operations
Consolidated Statements of Cash Flows
Consolidated Statements of Stockholders’ Equity
Notes to the Consolidated Financial Statements
Schedule II — Valuation and Qualifying Accounts
All other schedules are omitted because they are not applicable or the required information is shown in the financial statements or notes thereto.

33
REPORT OF INDEPENDENT REGISTERED PUBLIC ACCOUNTING FIRM
To the Board of Directors and Stockholders of Panera Bread Company:
We have completed integrated audits of Panera Bread Company’s 2005 and 2004 consolidated financial statements and of its internal control over financial reporting as of December 27, 2005, and an audit of its December 27, 2003 consolidated financial statements in accordance with the standards of the Public Company Accounting Oversight Board (United States). Our opinions, based on our audits, are presented below.
Consolidated financial statements and financial statement schedule
In our opinion, the consolidated financial statements listed in the accompanying index present fairly, in all material respects, the financial position of Panera Bread Company and its subsidiaries at December 27, 2005 and December 25, 2004, and the results of their operations and their cash flows for each of the three years in the period ended December 27, 2005 in conformity with accounting principles generally accepted in the United States of America. In addition, in our opinion, the financial statement schedule listed in the accompanying index presents fairly, in all material respects, the information set forth therein when read in conjunction with the related consolidated financial statements. These financial statements and financial statement schedule are the responsibility of the Company’s management. Our responsibility is to express an opinion on these financial statements and financial statement schedule based on our audits. We conducted our audits of these statements in accordance with the standards of the Public Company Accounting Oversight Board (United States). Those standards require that we plan and perform the audit to obtain reasonable assurance about whether the financial statements are free of material misstatement. An audit of financial statements includes examining, on a test basis, evidence supporting the amounts and disclosures in the financial statements, assessing the accounting principles used and significant estimates made by management, and evaluating the overall financial statement presentation. We believe that our audits provide a reasonable basis for our opinion.
Internal control over financial reporting
Also, in our opinion, management’s assessment, included in “Management’s Report on Internal Control Over Financial Reporting” appearing under Item 9A, that the Company maintained effective internal control over financial reporting as of December 27, 2005 based on criteria established in Internal Control — Integrated Framework issued by the Committee of Sponsoring Organizations of the Treadway Commission (COSO), is fairly stated, in all material respects, based on those criteria. Furthermore, in our opinion, the Company maintained, in all material respects, effective internal control over financial reporting as of December 27, 2005 based on criteria established in Internal Control — Integrated Framework issued by the COSO. The Company’s management is responsible for maintaining effective internal control over financial reporting and for its assessment of the effectiveness of internal control over financial reporting. Our responsibility is to express opinions on management’s assessment and on the effectiveness of the Company’s internal control over financial reporting based on our audit. We conducted our audit of internal control over financial reporting in accordance with the standards of the Public Company Accounting Oversight Board (United States). Those standards require that we plan and perform the audit to obtain reasonable assurance about whether effective internal control over financial reporting was maintained in all material respects. An audit of internal control over financial reporting includes obtaining an understanding of internal control over financial reporting, evaluating management’s assessment, testing and evaluating the design and operating effectiveness of internal control, and performing such other procedures as we consider necessary in the circumstances. We believe that our audit provides a reasonable basis for our opinions.
A company’s internal control over financial reporting is a process designed to provide reasonable assurance regarding the reliability of financial reporting and the preparation of financial statements for external purposes in accordance with generally accepted accounting principles. A company’s internal control over financial reporting includes those policies and procedures that (i) pertain to the maintenance of records that, in reasonable detail, accurately and fairly reflect the transactions and dispositions of the assets of the company; (ii) provide reasonable assurance that transactions are recorded as necessary to permit preparation of financial statements in accordance with generally accepted accounting principles, and that receipts and expenditures of the company are being made only in accordance with authorizations of management and directors of the company; and (iii) provide reasonable assurance regarding prevention or timely detection of unauthorized acquisition, use, or disposition of the company’s assets that could have a material effect on the financial statements.
Because of its inherent limitations, internal control over financial reporting may not prevent or detect misstatements. Also, projections of any evaluation of effectiveness to future periods are subject to the risk that controls may become inadequate because of changes in conditions, or that the degree of compliance with the policies or procedures may deteriorate.
/s/ PRICEWATERHOUSECOOPERS LLP PricewaterhouseCoopers LLP
St. Louis, Missouri March 9, 2006

34
PANERA BREAD COMPANY
CONSOLIDATED BALANCE SHEETS (in thousands, except share and per share information)
December 27, 2005
December 25, 2004
ASSETS : Current assets:
Cash and cash equivalents ......................................................................................................................... $ 24,451 $ 29,639 Investments in government securities ........................................................................................................ 36,200 2,022 Trade accounts receivable.......................................................................................................................... 18,229 11,714 Other accounts receivable .......................................................................................................................... 6,929 5,542 Inventories.................................................................................................................................................. 7,358 5,398 Prepaid expenses........................................................................................................................................ 5,736 1,658 Deferred income taxes ............................................................................................................................... 3,871 2,247
Total current assets................................................................................................................................ 102,774 58,220 Property and equipment, net ........................................................................................................................ 268,809 201,725 Other assets: Investments in government securities ........................................................................................................ 10,108 26,393 Goodwill .................................................................................................................................................... 48,540 35,327 Other intangible assets ............................................................................................................................... 3,219 159 Deposits and other...................................................................................................................................... 4,217 2,848
Total other assets................................................................................................................................... 66,084 64,727 Total assets ............................................................................................................................................ $ 437,667 $ 324,672
LIABILITIES AND STOCKHOLDERS’ EQUITY Current liabilities: Accounts payable ....................................................................................................................................... $ 4,422 $ 5,840 Accrued expenses....................................................................................................................................... 81,559 48,905 Deferred revenue........................................................................................................................................ 884 960
Total current liabilities .......................................................................................................................... 86,865 55,705 Deferred income taxes ................................................................................................................................. 5,022 5,647 Deferred rent................................................................................................................................................ 23,935 20,181 Other long-term liabilities............................................................................................................................ 4,867 1,776
Total liabilities....................................................................................................................................... 120,689 83,309 Commitments and contingencies (Note 9)
Stockholders’ equity: Common stock, $.0001 par value:
Class A, 75,000,000 shares authorized; 29,957,297 issued and 29,848,297 outstanding in 2005; and 29,130,097 issued and 29,021,097 outstanding in 2004....................................................................... 3 3
Class B, 10,000,000 shares authorized; 1,400,621 issued and outstanding in 2005 and 1,451,647 in 2004 ...................................................................................................................................................... — —
Treasury stock, carried at cost.................................................................................................................... (900) (900) Additional paid-in capital........................................................................................................................... 158,984 130,970 Retained earnings....................................................................................................................................... 163,473 111,290 Unearned deferred compensation............................................................................................................... (4,582) —
Total stockholders’ equity..................................................................................................................... 316,978 241,363 Total liabilities and stockholders’ equity .............................................................................................. $ 437,667 $ 324,672
The accompanying notes are an integral part of the consolidated financial statements.

35
PANERA BREAD COMPANY
CONSOLIDATED STATEMENTS OF OPERATIONS
(in thousands, except per share information) For the Fiscal Years Ended
December 27, 2005
December 25, 2004
December 27, 2003
Revenues: Bakery-cafe sales ............................................................................................................... $ 499,422 $ 362,121 $ 265,933 Franchise royalties and fees ............................................................................................... 54,309 44,449 36,245 Fresh dough sales to franchisees........................................................................................ 86,544 72,569 61,524
Total revenue................................................................................................................. 640,275 479,139 363,702 Costs and expenses:
Bakery-cafe expenses: Cost of food and paper products..................................................................................... 142,675 101,832 73,885 Labor............................................................................................................................... 151,524 110,790 81,152 Occupancy....................................................................................................................... 37,389 26,730 18,981 Other operating expenses ................................................................................................ 70,003 51,044 36,804 Total bakery-cafe expenses ........................................................................................... 401,591 290,396 210,822
Fresh dough cost of sales to franchisees ............................................................................ 75,036 65,627 54,967 Depreciation and amortization ........................................................................................... 33,011 25,298 18,304 General and administrative expenses................................................................................. 46,301 33,338 28,140 Pre-opening expenses......................................................................................................... 3,241 2,642 1,531
Total costs and expenses ............................................................................................... 559,180 417,301 313,764 Operating profit ................................................................................................................... 81,095 61,838 49,938 Interest expense ................................................................................................................... 50 18 48 Other (income) expense, net ................................................................................................ (1,133) 1,065 1,592 Income before income taxes and cumulative effect of accounting change.......................... 82,178 60,755 48,298 Income taxes ........................................................................................................................ 29,995 22,175 17,629 Income before cumulative effect of accounting change ...................................................... 52,183 38,580 30,669 Cumulative effect to December 28, 2002 of accounting change, net of tax benefit ............ — — (239)
Net income.................................................................................................................... $ 52,183 $ 38,580 $ 30,430 Per share data:
Basic earnings per common share: Before cumulative effect of accounting change.............................................................. $ 1.69 $ 1.28 $ 1.03 Cumulative effect of accounting change......................................................................... — — (0.01) Net income.................................................................................................................... $ 1.69 $ 1.28 $ 1.02
Diluted earnings per common share: Before cumulative effect of accounting change.............................................................. $ 1.65 $ 1.25 $ 1.01 Cumulative effect of accounting change......................................................................... — — (0.01) Net income.................................................................................................................... $ 1.65 $ 1.25 $ 1.00
Weighted average shares of common and common equivalent shares outstanding Basic .................................................................................................................................. 30,871 30,154 29,733 Diluted................................................................................................................................ 31,651 30,768 30,423
The accompanying notes are an integral part of the consolidated financial statements.

36
PANERA BREAD COMPANY
CONSOLIDATED STATEMENTS OF CASH FLOWS (in thousands)
For the Fiscal Years Ended
December 27, 2005
December 25, 2004
December 27, 2003
Cash flows from operations: Net income ........................................................................................................................ $ 52,183 $ 38,580 $ 30,430 Adjustments to reconcile net income to net cash provided by operating activities:
Cumulative effect of accounting change, net of tax ...................................................... — — 239 Depreciation and amortization ....................................................................................... 33,011 25,298 18,304 Tax benefit from exercise of stock options .................................................................... 9,307 4,336 6,847 Deferred income taxes ................................................................................................... (2,249) 5,993 8,810 Other .............................................................................................................................. 803 472 513
Changes in operating assets and liabilities, excluding the effect of acquisitions: Trade and other accounts receivable .............................................................................. (7,902) (4,850) (2,808) Inventories...................................................................................................................... (1,686) (1,055) (900) Prepaid expenses ............................................................................................................ (4,078) (358) 538 Accounts payable ........................................................................................................... (1,418) (2,232) 2,085 Accrued expenses........................................................................................................... 26,511 10,628 5,618 Deferred revenue............................................................................................................ (76) (208) (497) Deferred rent .................................................................................................................. 3,754 7,680 3,751 Other long-term liabilities .............................................................................................. 2,468 — — Other .............................................................................................................................. — — 172
Net cash provided by operating activities .................................................................... 110,628 84,284 73,102 Cash flows from investing activities: Additions to property and equipment................................................................................ (82,056) (80,429) (45,761) Acquisitions, net of cash acquired .................................................................................... (28,261) (5,224) (20,969) Purchase of investments.................................................................................................... (20,025) (28,792) (4,000) Investment maturities proceeds......................................................................................... 2,000 9,300 4,000 (Increase) decrease in deposits and other......................................................................... (1,298) 2,854 (126)
Net cash used in investing activities ............................................................................ (129,640) (102,291) (66,856) Cash flows from financing activities:
Exercise of employee stock options.................................................................................. 12,632 3,569 4,211 Proceeds from issuance of common stock ........................................................................ 1,192 1,073 814 Other ................................................................................................................................. — 602 1,207
Net cash provided by financing activities .................................................................... 13,824 5,244 6,232 Net (decrease) increase in cash and cash equivalents ......................................................... (5,188) (12,763) 12,478 Cash and cash equivalents at beginning of period .............................................................. 29,639 42,402 29,924 Cash and cash equivalents at end of period ........................................................................ $ 24,451 $ 29,639 $ 42,402 Supplemental cash flow information: Cash paid during the year for:
Interest ......................................................................................................................... $ — $ — $ 22 Income taxes ................................................................................................................ $ 23,161 $ 10,367 $ 783
Noncash investing activities: Accrued property and equipment purchases ................................................................ $ 15,208 $ 9,066 $ 7,196 Assets transferred to minority interest owner............................................................... $ — $ 2,673 $ —
The accompanying notes are an integral part of the consolidated financial statements.

37
PANERA BREAD COMPANY
CONSOLIDATED STATEMENTS OF STOCKHOLDERS’ EQUITY (in thousands, except per share information)
For the Fiscal Years Ended December 27, 2005 December 25, 2004 December 27, 2003 Shares Amount Shares Amount Shares Amount Class A Common Stock, $.0001 Par Value:
Balance, beginning of year ........................................ 29,130 $ 3 28,297 $ 3 27,446 $ 3 Exercise of employee stock options........................... 657 405 694 Issuance of common stock ......................................... 27 33 27 Conversion of Class B to Class A.............................. 51 395 130 Issuance of restricted stock (net of forfeitures).......... 92 — — Balance, end of year .................................................. 29,957 $ 3 29,130 $ 3 28,297 $ 3
Class B Common Stock, $.0001 Par Value: Balance, beginning of year ........................................ 1,452 $ — 1,847 $ — 1,977 $ — Conversion of Class B to Class A.............................. (51) (395) (130) Balance, end of year .................................................. 1,401 $ — 1,452 $ — 1,847 $ —
Treasury Stock, at cost: Balance, beginning of year ........................................ 109 $ (900) 109 $ (900) 109 $ (900) Balance, end of year .................................................. 109 $ (900) 109 $ (900) 109 $ (900)
Additional Paid In Capital: Balance, beginning of year ........................................ $ 130,970 $ 121,992 $ 110,120 Exercise of employee stock options........................... 12,632 3,569 4,211 Issuance of common stock ......................................... 1,192 1,073 814 Income tax benefit related to stock option plan ......... 9,307 4,336 6,847 Issuance of restricted stock (net of forfeitures).......... 4,883 — — Balance, end of year .................................................. $ 158,984 $ 130,970 $ 121,992
Retained Earnings: Balance, beginning of year ........................................ $ 111,290 $ 72,710 $ 42,280 Net income ................................................................. 52,183 38,580 30,430 Balance, end of year .................................................. $ 163,473 $ 111,290 $ 72,710
Unearned Deferred Compensation: Balance, beginning of year ........................................ $ — $ — $ — Issuance of restricted stock (net of forfeitures).......... (4,883) Amortization of restricted stock................................. 301 Balance, end of year .................................................. $ (4,582) $ — $ —
Total Stockholders’ Equity .......................................... $ 316,978 $ 241,363 $ 193,805
The accompanying notes are an integral part of the consolidated financial statements.

38
PANERA BREAD COMPANY
NOTES TO THE CONSOLIDATED FINANCIAL STATEMENTS 1. Nature of Business
Panera Bread Company operates a retail bakery-cafe business and franchising business under the concept names Panera Bread® and Saint Louis Bread Co.® As of December 27, 2005, the Company’s retail operations consist of 311 Company-owned bakery-cafes. The Company specializes in meeting consumer dining needs by providing high quality food, including fresh baked goods, made-to-order sandwiches on freshly baked breads, soups, salads, custom roasted coffees, and other cafe beverages, and targets suburban dwellers and workers by offering a premium specialty bakery and cafe experience with a neighborhood emphasis. Bakery-cafes are principally located in suburban, strip mall, and regional mall locations and currently operate in 36 states. Bakery-cafes use fresh dough for their artisan and sourdough breads and bagels. As of December 27, 2005, our fresh dough operations, which supply fresh dough items daily to both Company-owned and franchise-operated bakery-cafes, consisted of 16 Company-owned fresh dough facilities. 2. Summary of Significant Accounting Policies Basis of Presentation and Principles of Consolidation
For the years ended December 27, 2005 and December 25, 2004, the consolidated financial statements consist of the accounts of Panera Bread Company, its wholly owned subsidiaries Panera, LLC and Pumpernickel, Inc., and its indirect consolidated subsidiaries Pumpernickel Associates, LLC, Panera Enterprises, Inc., Asiago Bread, LLC, Atlanta JV, LLC, and Artisan Bread, LLC. On October 30, 2004, Cap City Bread, LLC became a wholly owned subsidiary of Artisan Bread, LLC. Prior to October 30, 2004, Artisan Bread, LLC held a majority interest in Cap City Bread, LLC, which then operated 36 bakery-cafes. All intercompany balances and transactions have been eliminated in consolidation.
Certain reclassifications have been made to conform previously reported data to the current presentation. Preparation of Financial Statements
The preparation of financial statements in conformity with accounting principles generally accepted in the United States of America requires management to make estimates and assumptions that affect the reported amounts of assets and liabilities and disclosure of contingent assets and liabilities at the date of the financial statements and the reported amounts of revenues and expenses during the reporting period. Actual results could differ from those estimates. Cash and Cash Equivalents
The Company considers all highly liquid investments with a maturity at the time of purchase of three months or less to be cash equivalents. Investments in Government Securities
Investments of $46.3 million and $28.4 million at December 27, 2005 and December 25, 2004, respectively, consist of United States treasury notes and government agency securities. During 2005, $2.0 million of investments matured or were called by the issuer and $20.0 million of investments were purchased by the Company. During 2004, $9.3 million of investments matured or were called by the issuer and $28.8 million of investments were purchased by the Company. During fiscal years 2005, 2004, and 2003, the Company recognized interest income on these investments of $1.3 million, $0.8 million and $0.2 million, respectively, each of which is net of premium amortization of $0.1 million, and is classified in “Other (Income) Expense” in the Consolidated Statements of Operations. The Company’s investments are classified as short-term or long-term in the accompanying consolidated balance sheets based upon their stated maturity dates which range from January 2006 to April 2007.
Management designates the appropriate classification of its investments at the time of purchase based upon its intended holding period. At December 27, 2005, all investments are classified as held-to-maturity as the Company has the intent and ability to hold the securities to maturity. Held-to-maturity securities are stated at amortized cost, adjusted for amortization of premiums to maturity using the effective interest method, which approximates fair value at December 27, 2005.

39
Trade and Other Accounts Receivable
Trade accounts receivable consists primarily of amounts due to the Company from its 41 franchise groups for purchases of fresh dough from the Company’s fresh dough facilities and royalties due to the Company from franchisee sales. The Company does not require collateral and maintains reserves for potential uncollectible accounts based on historical losses and existing economic conditions, when relevant. The allowance for doubtful accounts at December 27, 2005 and December 25, 2004 was $0.03 million. Other accounts receivable consists primarily of tenant allowances due from landlords. Inventories
Inventories, which consist of food products, paper goods and supplies, and promotional items, are valued at the lower of cost or market, determined under the first-in, first-out method. Property and Equipment
Property, equipment, and leaseholds are stated at cost. Depreciation is provided using the straight-line method over the estimated useful lives of the assets. Leasehold improvements are amortized using the straight-line method over the shorter of their estimated useful lives or the related reasonably assured lease term. The estimated useful lives used for financial statement purposes are: Leasehold improvements ...................................................................................................................................................... 15-20 years Machinery and equipment .................................................................................................................................................... 5-10 years Furniture and fixtures ........................................................................................................................................................... 3-7 years External signage.................................................................................................................................................................... 6 years
Interest, to the extent it is incurred, is capitalized when incurred in connection with the construction of new locations or facilities. The capitalized interest is recorded as part of the asset to which it relates and is amortized over the asset’s estimated useful life. No interest was incurred for such purposes in 2005, 2004, or 2003.
Upon retirement or sale, the cost of assets disposed of and their related accumulated depreciation are removed from the accounts. Any resulting gain or loss is credited or charged to operations. Maintenance and repairs are charged to expense when incurred, while betterments are capitalized. Goodwill
Goodwill consists of the excess of the purchase price over the fair value of net assets acquired from the acquisitions of the Saint Louis Bread Company, franchise-operated bakery-cafes, a franchise-operated fresh dough facility, and the membership interest of a former minority interest owner. In accordance with Statement of Financial Accounting Standards (SFAS) No. 141 (“SFAS 141”), “Business Combinations,” and SFAS No. 142, “Goodwill and Other Intangible Assets,” the Company did not amortize any of the goodwill related to acquisitions subsequent to June 30, 2001 and stopped amortizing all goodwill effective December 30, 2001. SFAS 142 requires goodwill and indefinite-lived intangible assets recorded in the financial statements to be evaluated for impairment annually or when events or circumstances occur indicating that goodwill might be impaired. When appropriate, the Company performs its impairment assessment by comparing discounted cash flows from acquired businesses with the carrying value of the underlying net assets inclusive of goodwill. The Company completed annual impairment tests as of the first day of the fourth quarter of fiscal years 2005, 2004, and 2003, none of which identified any impairment. Other Intangible Assets
On October 30, 2004, the Company’s wholly-owned subsidiary, Artisan Bread, LLC, became the owner of 100% of the membership interest in Cap City Bread, LLC. The Company recorded the fair value of favorable lease agreements of $0.2 million related to this acquisition as an intangible asset in its purchase price accounting. The Company is amortizing this intangible asset over the remaining related lease terms which range from approximately 5 years to 10 years. See Note 3 to the Company’s Consolidated Financial Statements for further information related to this acquisition.

40
On November 1, 2005, the Company acquired 21 operating bakery-cafes, two bakery-cafes under construction, and the area development rights for certain markets in the Indiana area from a franchisee. The Company recorded the fair value of favorable lease agreements of $0.1 million and the fair value of re-acquired territory rights of $3 million related to this acquisition as intangible assets in its purchase price accounting. The fair value of re-acquired territory rights was based on the present value of bakery-cafe cash flow streams and was recorded in accordance with Emerging Issues Task Force 04-1, “Accounting for Preexisting Relationships between the Parties to a Business Combination,” (EITF 04-1) which was effective for acquisitions in reporting periods beginning after October 13, 2004. The Company is amortizing the fair value of favorable lease agreements over the remaining related lease terms which range from approximately 9 years to 17 years. The Company is amortizing the fair value of re-acquired territory rights over the average remaining useful life of 20 years. See Note 3 to the Company’s Consolidated Financial Statements for further information related to this acquisition.
The Company reviews intangible assets with finite lives for impairment when events or circumstances indicate these assets might be impaired, but at least annually. The Company tests impairment using historical cash flows and other relevant facts and circumstances as the primary basis for an estimate of future cash flows. As of December 27, 2005, no impairment of intangible assets has been recognized. There can be no assurance that future intangible assets impairment tests will not result in a charge to earnings.
Amortization expense on these intangible assets as of December 27, 2005 and December 25, 2004 was (in thousands) $46 and $3, respectively. There was no amortization expense related to intangible assets for the year ended December 27, 2003. Accumulated amortization on these intangible assets at December 27, 2005 and December 25, 2004 was (in thousands) $49 and $3, respectively. Future amortization expense on these intangible assets as of December 27, 2005 was as follows (in thousands): $177 in 2006, $178 in 2007, $181 in 2008, $176 in 2009, $172 in 2010, and $2,335 thereafter. Impairment of Long-Lived Assets
The Company evaluates whether events and circumstances have occurred that indicate the remaining estimated useful life of long-lived assets may warrant revision or that the remaining balance of an asset may not be recoverable. When appropriate, the Company determines if there is an impairment by comparing anticipated undiscounted cash flows from the related long-lived assets of a bakery-cafe or fresh dough facility with their respective carrying values. If impairment exists, the amount of an impairment is determined by comparing anticipated discounted cash flows from the related long-lived assets of a bakery-cafe or a fresh dough facility with their respective carrying values. In performing this analysis, management considers such factors as current results, trends, future prospects, and other economic factors. No impairment of long-lived assets was determined for the years ended December 27, 2005, December 25, 2004, and December 27, 2003. Self-Insurance Reserves
The Company is self-insured for a significant portion of its workers’ compensation, group health (beginning in 2005), and general, auto, and property liability insurance with a deductible of as much as $500,000 of individual claims, depending on the type of claim. Liabilities associated with the risks that are retained by the Company are estimated, in part, by considering historical claims experience and trends of the Company and the industry and other actuarial assumptions. The estimated accruals for these liabilities could be affected if development of costs on claims differ from these assumptions and historical trends. Based on information known at December 27, 2005, the Company believes it has provided adequate reserves for its self-insurance exposure. As of December 27, 2005 and December 25, 2004, self-insurance reserves were $8.9 million and $3.5 million, respectively, and were included in accrued expenses in the consolidated balance sheets. Income Taxes
The provision for income taxes is determined in accordance with the provisions of SFAS No. 109, “Accounting for Income Taxes.” Under this method, deferred tax assets and liabilities are recognized for the future tax consequences attributable to differences between the financial statement carrying amounts of existing assets and liabilities and their respective tax basis. Deferred tax assets and liabilities are measured using enacted income tax rates expected to apply to taxable income in the years in which those temporary differences are expected to be recovered or settled. Any effect on deferred tax assets and liabilities of a change in tax rates is recognized in income in the period that includes the enactment date.

41
Capitalization of Certain Development Costs
The Company capitalizes certain internal costs associated with the development, design, and construction of new bakery-cafe locations and fresh dough facilities. Capitalized costs of $7.0 million, $5.4 million, and $3.2 million for the fiscal years ended December 27, 2005, December 25, 2004, and December 27, 2003, respectively, are recorded as part of the asset to which they relate and are amortized over the asset’s useful life. Revenue Recognition
The Company records revenue from bakery-cafe sales upon delivery of the related food and other products to the customer. Revenue from fresh dough sales to franchisees is also recorded upon delivery.
The Company records a liability in the period in which a gift card is issued and proceeds are received. As gift cards are redeemed, this liability is reduced and revenue is recognized as a sale.
Franchise fees are the result of the sale of area development rights and the sale of individual franchise locations to third parties. The initial franchise fee is $35,000 per bakery-cafe to be developed under the Area Development Agreement (ADA). Of this fee, $5,000 is paid at the time of the signing of the ADA and is recognized as revenue when it is received, as it is non-refundable and the Company has to perform no other service to earn this fee. The remaining $30,000 is paid at the time an individual franchise agreement is signed and is recognized as revenue upon the opening of the bakery-cafe. Franchise fees were $2.8 million, $3.2 million and $3.3 million for the years ended December 27, 2005, December 25, 2004, and December 27, 2003, respectively. Royalties are paid weekly based on the percentage of sales specified in each ADA (from 4% to 5% of sales). Royalties are recognized as revenue when they are earned. Royalties were $51.5 million, $41.2 million, and $32.9 million for the fiscal years ended December 27, 2005, December 25, 2004, and December 27, 2003, respectively. Advertising Costs
Franchise-operated bakery-cafes contribute to the Company 0.4% of their sales to a national advertising fund and 0.4% of their sales as a marketing administration fee and are required to spend 2.0% of their sales in their local markets on advertising. The Company contributes similar amounts from Company-owned bakery-cafes towards the national advertising fund and marketing administration. National advertising fund contributions can be increased up to a total of 2.6% of sales by the Company. The national advertising fund and marketing administration contributions received from franchise-operated bakery-cafes are consolidated with Company amounts in the Company’s financial statements. Liabilities for unexpended funds are included in accrued expenses in the consolidated balance sheets. The Company’s contributions to the national advertising fund and marketing administration, as well as its own media costs are recorded as part of other operating expenses in the Company’s consolidated statements of operations.
The Company’s policy is to record advertising costs as expense in the period in which the cost is incurred. The total amounts recorded as advertising expense were $10.3 million, $7.7 million, and $5.8 million for the years ended December 27, 2005, December 25, 2004, and December 27, 2003, respectively. Pre-Opening Costs
All pre-opening costs directly associated with the opening of new bakery-cafe locations, which consists primarily of labor and food costs incurred during in-store training and preparation for opening, but exclude manager training costs which are included in other operating expenses, are expensed when incurred. Direct costs to open bakery-cafes amounted to $3.2 million, $2.6 million and $1.5 million in 2005, 2004, and 2003, respectively. Rent Expense
The Company recognizes rent expense on a straight-line basis over the reasonably assured lease term as defined in FAS 98, “Accounting for Leases.” The lease term on most bakery-cafe leases is the initial non-cancelable lease term plus one renewal option period, which generally equates to 15 years. The lease term on most fresh dough facility leases is the initial non-cancelable lease term plus two to three renewal option periods, which generally ranges from 15 years to 20 years. In addition, certain of the Company’s lease agreements provide for scheduled rent increases during the lease terms or for rental payments commencing at a date other than the date of initial occupancy. The Company includes any rent escalations and construction period and other rent holidays in its determination of straight-line rent expense. Therefore, rent expense for new locations is charged to expense beginning with the start of the construction period.

42
The Company records landlord allowances related to non-structural building improvements as deferred rent, which is included in accrued expenses or deferred rent in the consolidated balance sheets based on their short-term or long-term nature. This deferred rent is amortized over the reasonably assured lease term as a reduction of rent expense. Fiscal Year
In 2005, the Company changed its fiscal week to end on Tuesday rather than Saturday, with our fiscal year ending on the last Tuesday in December. As a result, the Company’s 2005 fiscal year ended on December 27, 2005 and consisted of fifty-two and a half weeks rather than the fifty-three week year that would have resulted without the calendar change. The additional days in fiscal 2005 occurred in the first quarter, resulting in the first quarter being sixteen and a half weeks. The additional three days in the first quarter of 2005 did not have a material impact on the Company’s financial statements. In fiscal 2006, the Company adopted a new quarterly calendar whereby each of its quarters will include 13 weeks (4 week, 5 week, and 4 week period progressions in each quarter). The Company’s fiscal week will continue to end on Tuesday, with fiscal 2006 ending on December 26, 2006. The Company’s fiscal year ended on the last Saturday in December for 2004 and prior fiscal years and consisted of 13 four-week periods, with the first, second, and third quarters ending 16 weeks, 28 weeks, and 40 weeks, respectively, into the fiscal year. Earnings Per Share Data
Earnings per share is based on the weighted average number of shares outstanding during the period after consideration of the dilutive effect, if any, for common stock equivalents, including stock options, restricted stock, and other stock-based compensation. Earnings per common share are computed in accordance with SFAS No. 128 “Earnings Per Share,” which requires companies to present basic earnings per share and diluted earnings per share. Basic earnings per share are computed by dividing net income by the weighted average number of shares of common stock outstanding during the year. Diluted earnings per common share are computed by dividing net income by the weighted average number of shares of common stock outstanding and dilutive securities outstanding during the year. Fair Value of Financial Instruments
The carrying amount of the Company’s accounts receivable and accounts payable approximate their fair values due to the short-term maturity of these instruments. In addition, held-to-maturity securities are stated at amortized cost, adjusted for amortization of premiums to maturity using the effective interest method, which approximates fair value at December 27, 2005. Derivative Financial Instruments
The Company enters into swap agreements to manage fluctuating butter prices. Swap agreements designated at inception as a hedge are accounted for under the deferral method, with gains and losses from hedging activity included in the cost of sales as those inventories are sold or as the anticipated hedge transaction occurs. Swap agreements not designated as effective hedges of firm commitments or anticipated underlying transactions are marked to market at the end of the reporting period, with the resulting gains or losses recognized in cost of sales. The Company does not invest in derivative financial instruments for trading purposes.
At December 27, 2005, the Company had two swap agreements, which fixed the price of its projected butter purchases in 2006. These agreements require the Company to purchase 6.8 million pounds of butter at $1.488 per pound. However, these agreements are not effective hedges. Therefore, the Company marked these agreements to market. At December 27, 2005, the fair value of these agreements was a loss of $380,000, which was recorded in cost of sales. Stock-Based Compensation
As of December 27, 2005, the Company had three stock-based compensation plans, which are described in Note 13 of the Company’s Consolidated Financial Statements. Through fiscal 2005, the Company has accounted for those plans under the recognition and measurement principles of Accounting Principles Board Opinion No. 25 (APB 25), “Accounting for Stock Issued to Employees,” and related interpretations. See “Recently Issued Pronouncements” below for description of changes in stock-based compensation for fiscal 2006. Compensation expense is recognized in net income for restricted stock grants and a portion of the performance awards payable in the Company’s common stock. No compensation expense has been recognized in net income for stock options as all option grants had an exercise price equal to the market value of the underlying common stock on the date of grant. The following table illustrates the effect on net income and earnings per share as if the Company had applied the fair value recognition provisions of SFAS 123, “Accounting for Stock-Based Compensation,” to all stock-based compensation plans, including stock options outstanding (in thousands, except per share amounts):

43
Fiscal Year Ended
December 27, 2005
December 25, 2004
December 27, 2003
Net income, as reported ....................................................................................................... $ 52,183 $ 38,580 $ 30,430 Add: Total stock-based compensation expense included in reported net income, net of tax...... 513 — —
Deduct: Total stock-based compensation expense determined under the fair value-based
method for all awards, net of tax...................................................................................... 5,861 3,958 2,626 Pro forma net income........................................................................................................... $ 46,835 $ 34,622 $ 27,804 Net income per share:
Basic, as reported............................................................................................................... $ 1.69 $ 1.28 $ 1.02 Basic, pro forma................................................................................................................. $ 1.52 $ 1.15 $ 0.94 Diluted, as reported............................................................................................................ $ 1.65 $ 1.25 $ 1.00 Diluted, pro forma.............................................................................................................. $ 1.52 $ 1.15 $ 0.94
The weighted average fair value of the options granted during 2005, 2004, and 2003 was $21.19 per share, $13.49 per share, and
$15.81 per share, respectively, on the date of grant using the Black-Scholes option-pricing model with the following assumptions: expected dividend yield of 0%, expected volatility of 36% in 2005 and 2004 and 41% in 2003, risk-free interest rate of 4.04% in 2005, 3.42% in 2004, and 3.53% in 2003, and an expected life of 5 years in 2005 and 2004 and 6 years in 2003. Adoption of SFAS 143
Effective December 29, 2002, the Company adopted the provisions of SFAS No. 143, “Accounting for Asset Retirement Obligations.” SFAS 143 addresses financial accounting and reporting for obligations associated with the retirement of tangible long-lived assets and the associated asset retirement costs. This Statement requires the Company to record an estimate for costs of retirement obligations that may be incurred at the end of lease terms of existing bakery-cafes or other facilities.
Beginning December 29, 2002, the Company recognizes the future cost to comply with lease obligations at the end of a lease as it relates to tangible long-lived assets in accordance with the provisions of SFAS 143. A liability for the fair value of an asset retirement obligation along with a corresponding increase to the carrying value of the related long-lived asset is recorded at the time a lease agreement is executed. The Company amortizes the amount added to property and equipment and recognizes accretion expense in connection with the discounted liability over the life of the respective lease. The estimated liability is based on experience in closing bakery-cafes and the related external cost associated with these activities. Revisions to the liability could occur due to changes in estimated retirement costs or changes in lease term.
Upon adoption of SFAS 143, the Company recorded a discounted liability of approximately $0.8 million, increased net property and equipment by approximately $0.4 million, and recognized a one-time cumulative effect charge of approximately $0.2 million (net of deferred tax benefit of approximately $0.1 million). The liability as of December 27, 2005 and December 25, 2004 was $2.0 million and $1.4 million, respectively, and is included in other long-term liabilities in the Consolidated Balance Sheets. Recently Issued Pronouncements
In December 2004, the FASB issued SFAS No. 123R, “Share-Based Payment” (“SFAS 123R”), a revision of SFAS No. 123, “Accounting for Stock-Based Compensation.” SFAS 123R will require the Company to, among other things, measure employee stock-based compensation awards where applicable using a fair value method and record related expense in the Company’s consolidated financial statements. The provisions of SFAS 123R are effective for public companies for annual periods beginning after June 15, 2005. The Company anticipates it will adopt SFAS 123R effective December 28, 2005 using the modified prospective transition approach and estimates adoption of the expensing requirements will reduce the Company’s diluted earnings per share by $0.13 in 2006.
In December 2004, the FASB issued FASB Staff Position No. FAS 109-1, “Application of SFAS No. 109, Accounting for Income Taxes, to the Tax Deduction on Qualified Production Activities provided by the American Jobs Creation Act of 2004” (“FSP 109-1”). FSP 109-1 states that qualified domestic production activities should be accounted for as a special deduction under SFAS No. 109, “Accounting for Income Taxes.” The provisions of FSP 109-1 are effective immediately. Adoption of this pronouncement did not have a significant impact on the Company’s financial statements.

44
On October 6, 2005, the FASB issued FASB Staff Position No. FAS 13-1, “Accounting for Rental Costs Incurred During a Construction Period” (“FSP 13-1”). FSP 13-1 is effective for the first reporting period beginning after December 15, 2005. FSP 13-1 states that rental costs associated with operating leases must be recognized as rental expense allocated on a straight-line basis over the lease term, which includes the construction period. This accounting is consistent with the Company’s current practice. 3. Acquisitions
On November 1, 2005, the Company purchased from a franchisee substantially all of the assets of twenty-one bakery-cafes, two bakery-cafes under construction, and the area development rights for certain markets in Indiana for a purchase price of approximately $28.0 million in cash plus the assumption of certain liabilities including those associated with bakery-cafe construction. The acquisition price was paid with cash on hand. The Consolidated Statements of Operations include the results of operations from the operating bakery-cafes from the date of the acquisition. The pro forma impact of the acquisition on prior periods is not presented as the impact is not material to reported results. The Company allocated the purchase price to the assets acquired and liabilities assumed in the acquisition at their estimated fair values with the remainder allocated to tax deductible goodwill as follows: $0.3 million to inventories, $11.6 million to fixed assets, $3.1 million to intangible assets, which represents the fair value of re-acquired territory rights, which was in accordance with EITF 04-1 effective for acquisitions in reporting periods beginning after October 13, 2004, and favorable lease agreements, and $13.0 million to goodwill.
On October 30, 2004, the Company’s wholly-owned subsidiary, Artisan Bread, LLC (“Artisan”), became the owner of 100% of the membership interests in Cap City Bread, LLC (“LLC”). Prior to the completion of this transaction, Artisan had owned approximately 78.5% of the membership interests in LLC and the remaining membership interests had been owned by Capitol Dough, Inc. (“Capitol Dough”), a Missouri corporation owned by Richard Postle, the Company’s former president (“Postle”), as a minority interest owner. As part of the transaction, LLC redeemed certain of the membership interests held by Capitol Dough in exchange for the transfer to Capitol Dough of LLC’s interest in 3 bakery-cafes at cost, one of which was under construction at the acquisition date (“redemption transaction”). In addition to the redemption transaction, Artisan acquired the remaining membership interests held by Capitol Dough in exchange for a cash purchase price of approximately $5.2 million (including acquisition costs), which approximates fair value. Of this purchase price, approximately $4.3 million was paid in cash at the acquisition date and the remaining purchase price was paid, with interest, in 2005. At the time of the acquisition, LLC operated 36 bakery-cafes in the northern Virginia and central Pennsylvania markets. The results of operations of these bakery-cafes have been included in the Company’s Consolidated Financial Statements since the date of formation of LLC. Following the completion of the transaction, Artisan became the sole owner of LLC, which then owned 34 operating bakery-cafes in the northern Virginia and central Pennsylvania markets. The 3 remaining bakery-cafes transferred to Postle, one of which was under construction at the acquisition date, are owned and operated by Postle and/or his affiliates as a franchisee. The pro forma impact of the acquisition on prior periods is not presented as the impact is not material to reported results. The Company allocated the purchase price to the membership interest and related intangibles acquired in the acquisition at their estimated fair values with any remainder allocated to tax deductible goodwill as follows: $2.0 million to eliminate the minority interest balance, $0.3 million to fixed assets, $0.2 million to intangible assets, which represents the fair value of favorable lease agreements, and $2.7 million to goodwill.
On November 2, 2003, the Company purchased from a franchisee substantially all of the assets of twelve bakery-cafes, two of which were under construction, as well as the area development rights for the Toledo, Ohio and Ann Arbor, Michigan markets for a net purchase price of approximately $14.2 million (includes $0.1 million paid in fiscal 2004). The acquisition price was paid with cash on hand. The Consolidated Statements of Operations include the results of operations from the operating bakery-cafes from the date of the acquisition. The pro forma impact of the acquisition on prior periods is not presented as the impact is not material to reported results. The Company allocated the purchase price to the assets acquired and liabilities assumed in the acquisition at their estimated fair values with the remainder allocated to tax deductible goodwill as follows: $0.3 million to inventories, $5.6 million to fixed assets, $1.4 million to liabilities, and $9.7 million to goodwill.
On February 1, 2003, the Company purchased from a franchisee substantially all of the assets of one operating bakery-cafe, the furniture, fixtures, and equipment of two closed locations, and the area development rights for the Dallas market for a cash purchase price of $1.3 million with a commitment to purchase the furniture, fixtures, and equipment of an additional bakery-cafe for approximately $0.2 million. The acquisition price was paid with cash on hand. The Consolidated Statements of Operations include the results of operations of the one operating bakery-cafe from the date of acquisition. The pro forma impact of the acquisition on prior periods is not presented as the impact is not material to reported results. The Company allocated the purchase price to the assets acquired in the acquisition at their estimated fair values with the remainder allocated to tax deductible goodwill as follows: $0.9 million to fixed assets and $0.4 million to goodwill. In October 2004, the Company completed the purchase of the remaining bakery-cafe for a cash purchase price of approximately $0.2 million.

45
On January 9, 2003, the Company purchased from a franchisee substantially all of the assets of four operating bakery-cafes as well as the area development rights for the Louisville and Lexington, Kentucky markets for a purchase price of $5.5 million. Of the purchase price, $5.0 million was paid in cash at the acquisition date and $0.5 million was paid, with interest, in cash six months from the acquisition date. The acquisition price was paid with cash on hand. The Consolidated Statements of Operations include the results of operations of the four operating bakery-cafes from the date of acquisition. The pro forma impact of the acquisition on prior periods is not presented as the impact is not material to reported results. The Company allocated the purchase price to the assets acquired in the acquisition at their estimated fair values with the remainder allocated to tax deductible goodwill as follows: $1.7 million to fixed assets, $0.1 million to inventories, and $3.7 million to goodwill. 4. Inventories
Inventories consist of the following (in thousands):
December 27, 2005
December 25, 2004
Food: Fresh dough facilities:
Raw materials ......................................................................................................................................... $ 1,941 $ 1,733 Finished goods ........................................................................................................................................ 331 362
Bakery-cafes: Raw materials ......................................................................................................................................... 3,989 2,520
Paper goods.................................................................................................................................................. 881 595 Retail merchandise....................................................................................................................................... 216 188 $ 7,358 $ 5,398 5. Property and Equipment
Major classes of property and equipment consist of the following (in thousands):
December 27, 2005
December 25, 2004
Leasehold improvements ............................................................................................................................. $ 174,043 $ 131,059 Land and land improvements....................................................................................................................... 712 712 Machinery and equipment ........................................................................................................................... 120,099 90,034 Furniture and fixtures .................................................................................................................................. 28,897 21,514 Signage ........................................................................................................................................................ 7,708 5,282 Smallwares................................................................................................................................................... 6,657 4,536 Construction in progress .............................................................................................................................. 48,988 36,464 387,104 289,601 Less: accumulated depreciation ................................................................................................................... 118,295 87,876 Property and equipment, net ........................................................................................................................ $ 268,809 $ 201,725
The Company recorded depreciation expense related to these assets of $33.0 million, $25.3 million, and $18.3 million in 2005, 2004, and 2003, respectively. 6. Goodwill
The changes in the carrying amount of goodwill at December 27, 2005 and December 25, 2004 are as follows (in thousands):
Company Bakery- Cafe Operations
Fresh Dough Operations
Total
Balance December 27, 2003 ............................................................................................... $ 32,015 $ 728 $ 32,743 Dallas acquisition................................................................................................................ 23 23 Toledo/Michigan acquisition .............................................................................................. 116 116 Minority interest owner acquisition .................................................................................... 2,445 2,445 Balance December 25, 2004 ............................................................................................... 34,599 728 35,327 Minority interest owner acquisition .................................................................................... 224 226 Indiana acquisition.............................................................................................................. 12,989 12,987 Balance December 27, 2005 ............................................................................................... $ 47,812 $ 728 $ 48,540
Goodwill accumulated amortization was $7.9 million at December 27, 2005 and December 25, 2004.

46
7. Accrued Expenses
Accrued expenses consist of the following (in thousands):
December 27, 2005
December 25, 2004
Compensation and related employment taxes.............................................................................................. $ 20,104 $ 12,540 Capital expenditures .................................................................................................................................... 15,208 9,066 Unredeemed gift cards ................................................................................................................................. 13,576 8,044 Insurance...................................................................................................................................................... 8,948 3,642 Income taxes ................................................................................................................................................ 3,338 3,606 Accrued advertising ..................................................................................................................................... 3,102 270 Rent.............................................................................................................................................................. 2,351 3,443 Accrued utilities........................................................................................................................................... 1,832 1,011 Taxes, other than income tax ....................................................................................................................... 1,338 1,680 Other ............................................................................................................................................................ 11,762 5,603 $ 81,559 $ 48,905 8. Line of Credit
On December 19, 2003, the Company entered into a $10.0 million unsecured revolving line of credit (revolver). The revolver matures December 19, 2006 and has an interest rate of LIBOR plus 0.75% to 1.5% depending on the Company’s leverage ratio and type of loan (resulting in interest rates of approximately 5.0% to 5.8% at December 27, 2005). The revolver contains restrictions relating to future indebtedness, liens, investments, distributions, mergers, acquisitions, or sales of assets and certain leasing transactions. The revolver also requires the maintenance of certain financial ratios and covenants. As of December 27, 2005, the Company was in compliance with all financial ratios and covenants. At December 27, 2005, the Company had $9.8 million available under the revolver with $0.2 million utilized by an outstanding letter of credit. The Company has not borrowed under its revolver in any of the last three fiscal years. 9. Commitments and Contingent Liabilities
The Company is obligated under non-cancelable operating leases for its bakery-cafes, fresh dough facilities and trucks, and administrative offices. Lease terms for its trucks are generally for five to seven years. Lease terms for its bakery-cafes, fresh dough facilities, and administrative offices are generally for ten years with renewal options at certain locations and generally require the Company to pay a proportionate share of real estate taxes, insurance, common area, and other operating costs. Many bakery-cafe leases provide for contingent rental (i.e., percentage rent) payments based on sales in excess of specified amounts. Certain of the Company’s lease agreements provide for scheduled rent increases during the lease terms or for rental payments commencing at a date other than the date of initial occupancy.
Aggregate minimum requirements under non-cancelable operating leases, excluding contingent liabilities, as of December 27, 2005, were as follows (in thousands): 2006 ........................................................................................................................................................................................ $ 40,953 2007 ........................................................................................................................................................................................ 40,992 2008 ........................................................................................................................................................................................ 40,357 2009 ........................................................................................................................................................................................ 40,032 2010 ........................................................................................................................................................................................ 39,603 Thereafter................................................................................................................................................................................ 305,314 $ 507,251
Rental expense under operating leases was approximately $33.0 million, $24.7 million, and $21.0 million in 2005, 2004, and 2003, respectively, which included contingent (i.e. percentage rent) payments of $0.8 million, $0.6 million, and $0.6 million, respectively.

47
The Company is the prime tenant for operating leases of 14 franchisee locations and a guarantor for operating leases of 32 locations of the former Au Bon Pain Division, or its franchisees. These leases have terms expiring on various dates from January 2006 to December 2018 and have a potential amount of future rental payments of approximately $32.2 million. The obligation from these leases will continue to decrease over time as these operating leases expire. As the guarantees were initiated prior to December 31, 2002, the Company has not recorded a liability for these guarantees pursuant to the provisions of FASB Interpretation Number (FIN) 45, “Guarantor’s Accounting and Disclosure Requirements For Guarantees, Including Indirect Guarantees of Indebtedness of Others, an Interpretation of FASB Statements No. 5, 57, and 107 and Rescission of FASB Interpretation No. 34.” Also, the Company has not had to make any payments related to the leases. Au Bon Pain or the respective franchisees continue to have primary liability for these operating leases. Future commitments as of December 27, 2005 under these leases were as follows (in thousands): 2006 .......................................................................................................................................................................................... $ 6,946 2007 .......................................................................................................................................................................................... 5,492 2008 .......................................................................................................................................................................................... 4,648 2009 .......................................................................................................................................................................................... 3,560 2010 .......................................................................................................................................................................................... 2,379 Thereafter.................................................................................................................................................................................. 9,174 $ 32,199
In November 2002, the Company signed an agreement with Dawn Food Products, Inc. (“Dawn”) to provide sweet goods for the period 2003-2007. The agreement with Dawn is structured as a cost plus agreement. For the years ended December 27, 2005, December 25, 2004, and December 27, 2003, the Company paid $15.8 million, $17.2 million, and $9.7 million, respectively, under this agreement.
Beginning in fiscal 2003, the Company executed Confidential and Proprietary Information and Non-Competition Agreements (Agreements) with certain employees. These Agreements contain a provision whereby employees would be due a certain number of weeks of their salary if their employment was terminated by the Company as specified in the Agreement. In accordance with SFAS 5, the Company has not recorded a liability for these amounts potentially due employees. Rather, the Company will record a liability for these amounts when an amount becomes due to an employee. As of December 27, 2005, the total amount potentially owed employees under these Agreements was approximately $7.6 million.
The Company is subject to legal proceedings and claims which arise in the normal course of business. In the opinion of management, the ultimate liabilities with respect to these actions will not have a material adverse effect on the Company’s financial position, results of operations, or cash flow. 10. Income Taxes
The provision for income taxes attributable to income before income taxes and cumulative effect of accounting change in the consolidated statements of operations is comprised of the following (in thousands):
December 27, 2005
December 25, 2004
December 27, 2003
Current: Federal................................................................................................................................ $ 30,638 $ 15,634 $ 1,421 State.................................................................................................................................... 1,616 647 550
32,254 16,281 1,971 Deferred: Federal................................................................................................................................ (2,166) 5,802 15,383 State.................................................................................................................................... (93) 92 412
(2,259) 5,894 15,795 Tax Provision....................................................................................................................... 29,995 22,175 17,766 Tax benefit on cumulative effect ......................................................................................... — — (137) $ 29,995 $ 22,175 $ 17,629
A reconciliation of the statutory federal income tax rate to the effective tax rate as a percentage of income before income taxes and cumulative effect of accounting change attributable to income before cumulative effect of accounting change follows: 2005 2004 2003 Statutory rate provision.................................................................................................................................... 35.0% 35.0% 35.0% State income taxes, net of federal tax benefit and other .................................................................................. 1.5 1.5 1.5 36.5% 36.5% 36.5%

48
The tax effects of the significant temporary differences which comprise the deferred tax assets and liabilities are as follows (in thousands): 2005 2004 Deferred tax assets: Accrued expenses............................................................................................................................................ $ 13,681 $ 5,094 Share-based compensation.............................................................................................................................. 368 — Charitable contribution carryforward ............................................................................................................. — 1,316 Other ............................................................................................................................................................... 9 11 Total deferred tax assets.................................................................................................................................. 14,058 6,421 Valuation allowance ....................................................................................................................................... — (550)
Total deferred tax assets, net of valuation allowance................................................................................... $ 14,058 $ 5,871 Deferred tax liabilities: Property, plant, and equipment ....................................................................................................................... $ (9,658) $ (4,908) Goodwill ......................................................................................................................................................... (5,551) (4,363)
Total deferred tax liabilities ......................................................................................................................... $ (15,209) $ (9,271) Net deferred tax liability ................................................................................................................................... $ (1,151) $ (3,400) Net current deferred tax asset ........................................................................................................................... $ 3,871 $ 2,247 Net non-current deferred tax liability ............................................................................................................... $ 5,022 $ 5,647
A valuation allowance was provided in prior years to reduce the deferred tax assets to a level which, more likely than not, would be realized. The valuation allowance at December 25, 2004 was attributable to $3.6 million of charitable contribution carryforwards which the Company might not be able to utilize prior to their expiration in years 2005 to 2008. However, these charitable contribution carryforwards were fully utilized during 2005. 11. Deposits and Other
The Company established a company-owned life insurance (“COLI”) program covering a substantial portion of its employees to help manage long-term employee benefit cost and to obtain tax deductions on interest payments on insurance policy loans. However, due to tax law changes, the Company froze this program in 1998. It appears based on actuarial estimates that the program will end in 2013.
At December 27, 2005 and December 25, 2004, the cash surrender values of $5.3 million and $7.4 million, respectively, the mortality income receivables of $2.3 million and $1.0 million, respectively, and the insurance policy loans of $5.3 million and $7.4 million, respectively, related to the COLI program were netted and included in other assets in the Company’s consolidated balance sheets. Mortality income receivable represents the dividend or death benefits the Company is due from its insurance carrier at the respective dates. The insurance policy loans are collateralized by the cash values of the underlying life insurance policies and require interest payments at a rate of 8.3% for the year ended December 27, 2005. Interest accrued on insurance policy loans is netted with other COLI related income statement transactions in other income (expense) in the consolidated statements of operations, which netted ($0.2) million, ($0.1) million, and $0.1 million in 2005, 2004, and 2003, respectively, the components of which are as follows (in thousands): 2005 2004 2003 Cash value loss ............................................................................................................................... $ (2,049) $ (2,103) $ (1,635) Mortality income............................................................................................................................. 2,332 2,561 2,318 Interest expense .............................................................................................................................. (479) (584) (626) (Expense)/income ........................................................................................................................... $ (196) $ (126) $ 57
The cash value loss is the cumulative change in cash surrender value for the year and is adjusted quarterly. Mortality income is recorded periodically as charges are deducted from cash value. These amounts are recovered by the Company through payment of death benefits and mortality dividends received. Interest expense is recorded on the accrual basis.

49
12. Stockholders’ Equity Common Stock
The holders of Class A Common Stock are entitled to one vote for each share owned. The holders of Class B Common Stock are entitled to three votes for each share owned. Each share of Class B Common Stock has the same dividend and liquidation rights as each share of Class A Common Stock. Each share of Class B Common Stock is convertible, at the stockholder’s option, into Class A Common Stock on a one-for-one basis. At December 27, 2005, the Company had reserved 4,908,102 shares of its Class A Common Stock for issuance upon exercise of awards granted under the Company’s 1992 Equity Incentive Plan, Formula Stock Option Plan for Independent Directors, and 2001 Employee, Director, and Consultant Stock Option Plan, and upon conversion of Class B Common Stock. Registration Rights
At December 27, 2005, over 90% of Class B Common Stock is owned by the Company’s Chairman and Chief Executive Officer (“CEO”). Certain holders of Class B Common Stock, including the Company’s CEO, pursuant to stock subscription agreements, can require the Company under certain circumstances to register their shares under the Securities Exchange Act of 1933, or have included in certain registrations all or part of such shares at the Company’s expense. Preferred Stock
The Company is authorized to issue 2,000,000 shares of Class B Preferred Stock with a par value of $.0001. The voting, redemption, dividend, liquidation rights, and other terms and conditions are determined by the Board of Directors upon approval of issuance. There were no shares issued or outstanding in 2005 and 2004. Treasury Stock
In the third quarter of 2000, the Company repurchased 109,000 shares of Class A Common Stock at an average cost of $8.25 per share. 13. Stock-Based Compensation
The Company’s equity compensation plans consist of the 1992 Equity Incentive Plan, the Formula Stock Option Plan for Independent Directors, and the 2001 Employee, Director, and Consultant Stock Option Plan. Long-Term Incentive Program
In the third quarter of 2005, the Company adopted a Long-Term Incentive Program (LTIP) as a sub-plan under the Company’s 2001 Employee, Director, and Consultant Stock Option Plan (“2001 Plan”) and the Company’s 1992 Equity Incentive Plan (“1992 Plan”) under which certain directors, officers, employees, and consultants, subject to approval by the Company’s Compensation and Stock Option Committee, may be selected as participants eligible to receive a percentage of their annual salary in future years, subject to the terms of the 2001 Plan and the 1992 Plan. This percentage is based on the participant’s level in the Company. In addition, the payment of this incentive can be made in several forms based on the participant’s level including performance awards (payable in cash or common stock), restricted stock, choice awards of restricted stock or stock options, or deferred annual bonus match awards. For the year ended December 27, 2005, compensation expense related to the LTIP was $1.6 million, which includes $0.3 million of restricted stock amortization.
Performance awards under this LTIP are earned by participants based on achievement of performance goals established by the Compensation and Stock Option Committee of the Company’s Board of Directors (Committee). The performance period relating to the performance awards is a three fiscal year period. The performance goals, including each performance metric, weighting of each metric, and award levels for each metric, for such awards are communicated to each participant and are based on various predetermined earnings and operating metrics. The performance awards will be earned based on achievement of predetermined earnings and operating performance metrics at the end of the three-fiscal-year performance period, assuming continued employment. The performance awards range from 0% to 300% of the targeted percentage of the participants’ salary. The performance awards will be payable 50% in cash and 50% in common stock unless the Committee otherwise determines. For the year ended December 27, 2005, compensation expense related to the performance awards was $1.0 million.

50
Stock options under this LTIP are granted with an exercise price equal to the quoted market value of the Company’s common
stock on the date of grant. In addition, stock options vest over five years and must be exercised within six years from date of grant.
Restricted stock of the Company under this LTIP are granted at no cost to participants. Plan participants are generally entitled to cash dividends on restricted stock, although the Company does not currently pay a dividend, and has no current plans to do so, and voting rights for their respective shares. For awards of restricted stock to date under the LTIP, restrictions limit the sale or transfer of these shares during a five year period whereby the restrictions lapse on 25% of these shares after two years and thereafter 25% each year for the next three years. Upon issuance of restricted stock under the LTIP, unearned compensation equivalent to the market value at the date of grant is charged to stockholders’ equity and subsequently amortized to expense over the five year restriction period. For the year ended December 27, 2005, the Company granted approximately 94,000 restricted shares, approximately 1,300 shares of which have been forfeited, with a weighted average grant date fair value of $52.88 per share. As of December 27, 2005 the Company had recorded $4.6 million in unearned deferred compensation related to restricted stock.
Under the deferred annual bonus match award portion of the LTIP, eligible participants receive an additional 50% of their annual bonus which is paid three years after the date of the original bonus. For the year ended December 27, 2005, compensation expense related to the deferred annual bonus match award was $0.3 million. 1992 Equity Incentive Plan
In May 1992, the Company adopted its Equity Incentive Plan (“Equity Plan”) to replace its Non-Qualified Incentive Stock Option Plan. Under the Equity Plan, a total of 1,900,000 shares of Class A Common Stock were initially reserved for awards under the Equity Plan. The Equity Plan was subsequently amended by the Board of Directors and the stockholders to increase the number of shares available thereunder from 1,900,000 to 8,600,000. Awards under the Equity Plan can be in the form of stock options (both qualified and non-qualified), stock appreciation rights, performance shares, restricted stock, or stock units. Formula Stock Option Plan for Independent Directors
On January 27, 1994, the Company’s Board of Directors authorized the Formula Stock Option Plan for Independent Directors, as defined in the related agreement. This plan authorized a total of 300,000 shares and was adopted by stockholders on May 25, 1994. The plan authorized a one-time grant of an option to purchase 20,000 shares of the Company’s Class A Common Stock at its closing price on January 26, 1994 for each independent director. Each independent director who is first elected as such after the effective date of the Directors’ Plan shall receive, as of the date he or she is so elected, a one-time grant of an option to purchase 10,000 shares of Class A Common Stock at a price per share equal to the closing price of the Class A Common Stock as reported by the NASDAQ/National Market System for the trading day immediately preceding the date of the person’s election to the board.
Annually and prior to fiscal year 2005, all independent directors serving in such capacity as of the last day of each fiscal year receive an option to purchase up to 10,000 shares of Class A Common Stock at the closing price for the day prior to the close of the fiscal year. Each option granted to the independent directors is fully vested at the grant date, and is exercisable, either in whole or in part, for 6 years following the grant date. There have been no grants under this plan since fiscal 2002, however, as of December 27, 2005 there were approximately 69,000 options outstanding under this plan. In fiscal 2006, the Board of Directors authorized a new compensation plan for independent directors which, consistent with the Company’s LTIP, compensates directors at a fixed dollar amount, with payment made through a combination of cash, stock options, and restricted stock. 2001 Employee, Director, and Consultant Stock Option Plan
At the annual meeting of stockholders on June 12, 2001, the Company’s 2001 Employee, Director, and Consultant Stock Option Plan was approved. Under the Company’s 2001 Employee, Director, and Consultant Stock Option Plan, a total of 3,000,000 shares of Class A Common Stock were authorized for issuance.
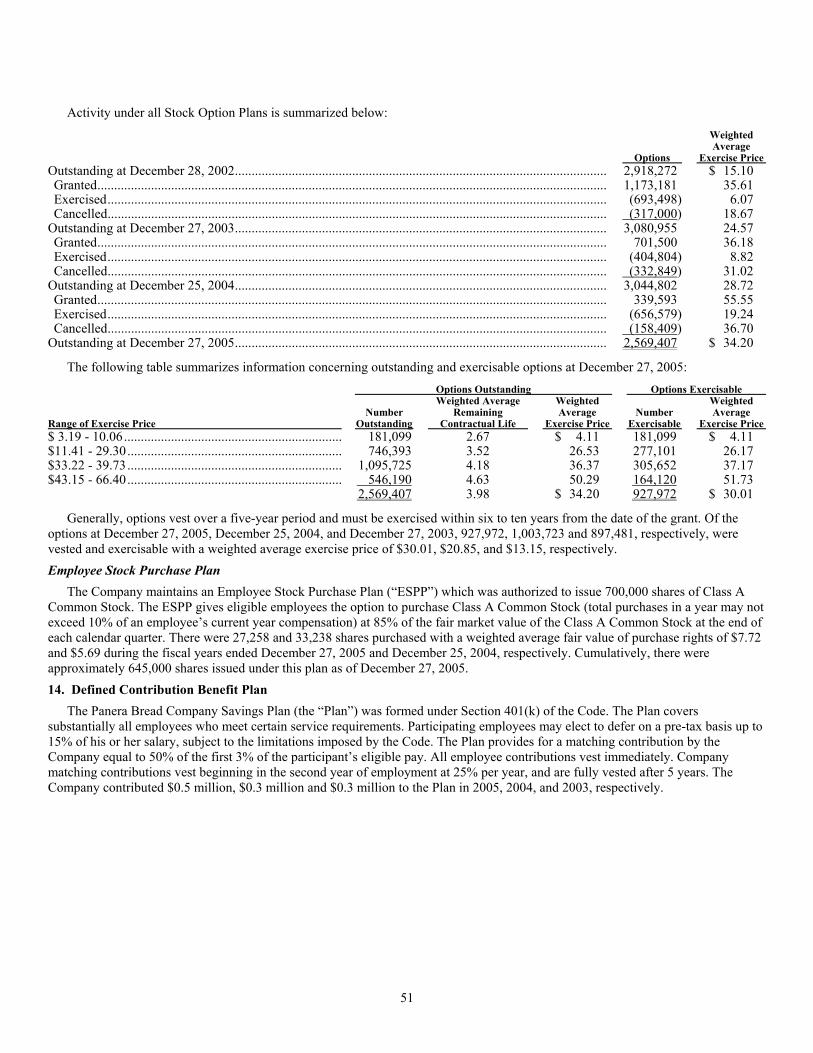
51
Activity under all Stock Option Plans is summarized below:
Options
Weighted Average Exercise Price
Outstanding at December 28, 2002............................................................................................................... 2,918,272 $ 15.10 Granted........................................................................................................................................................ 1,173,181 35.61 Exercised..................................................................................................................................................... (693,498) 6.07 Cancelled..................................................................................................................................................... (317,000) 18.67
Outstanding at December 27, 2003............................................................................................................... 3,080,955 24.57 Granted........................................................................................................................................................ 701,500 36.18 Exercised..................................................................................................................................................... (404,804) 8.82 Cancelled..................................................................................................................................................... (332,849) 31.02
Outstanding at December 25, 2004............................................................................................................... 3,044,802 28.72 Granted........................................................................................................................................................ 339,593 55.55 Exercised..................................................................................................................................................... (656,579) 19.24 Cancelled..................................................................................................................................................... (158,409) 36.70
Outstanding at December 27, 2005............................................................................................................... 2,569,407 $ 34.20
The following table summarizes information concerning outstanding and exercisable options at December 27, 2005: Options Outstanding Options Exercisable Range of Exercise Price
Number Outstanding
Weighted Average Remaining Contractual Life
Weighted Average Exercise Price
Number Exercisable
Weighted Average Exercise Price
$ 3.19 - 10.06................................................................. 181,099 2.67 $ 4.11 181,099 $ 4.11 $11.41 - 29.30................................................................ 746,393 3.52 26.53 277,101 26.17 $33.22 - 39.73................................................................ 1,095,725 4.18 36.37 305,652 37.17 $43.15 - 66.40................................................................ 546,190 4.63 50.29 164,120 51.73 2,569,407 3.98 $ 34.20 927,972 $ 30.01
Generally, options vest over a five-year period and must be exercised within six to ten years from the date of the grant. Of the options at December 27, 2005, December 25, 2004, and December 27, 2003, 927,972, 1,003,723 and 897,481, respectively, were vested and exercisable with a weighted average exercise price of $30.01, $20.85, and $13.15, respectively.
Employee Stock Purchase Plan
The Company maintains an Employee Stock Purchase Plan (“ESPP”) which was authorized to issue 700,000 shares of Class A Common Stock. The ESPP gives eligible employees the option to purchase Class A Common Stock (total purchases in a year may not exceed 10% of an employee’s current year compensation) at 85% of the fair market value of the Class A Common Stock at the end of each calendar quarter. There were 27,258 and 33,238 shares purchased with a weighted average fair value of purchase rights of $7.72 and $5.69 during the fiscal years ended December 27, 2005 and December 25, 2004, respectively. Cumulatively, there were approximately 645,000 shares issued under this plan as of December 27, 2005.
14. Defined Contribution Benefit Plan
The Panera Bread Company Savings Plan (the “Plan”) was formed under Section 401(k) of the Code. The Plan covers substantially all employees who meet certain service requirements. Participating employees may elect to defer on a pre-tax basis up to 15% of his or her salary, subject to the limitations imposed by the Code. The Plan provides for a matching contribution by the Company equal to 50% of the first 3% of the participant’s eligible pay. All employee contributions vest immediately. Company matching contributions vest beginning in the second year of employment at 25% per year, and are fully vested after 5 years. The Company contributed $0.5 million, $0.3 million and $0.3 million to the Plan in 2005, 2004, and 2003, respectively.

52
15. Business Segment Information
The Company operates three business segments. The Company Bakery-Cafe Operations segment is comprised of the operating activities of the bakery-cafes owned by the Company. The Company-owned bakery-cafes conduct business under the Panera Bread® or Saint Louis Bread Co.® names. These bakery-cafes sell fresh baked goods, made-to-order sandwiches on freshly baked breads, soups, salads, custom roasted coffees, and other complementary products through on-premise sales, as well as Via Panera® catering.
The Franchise Operations segment is comprised of the operating activities of the franchise business unit which licenses qualified operators to conduct business under the Panera Bread® name and also of the costs to monitor the operations of these bakery-cafes. Under the terms of the agreements, the licensed operators pay royalties and fees to the Company in return for the use of the Panera Bread® name.
The Fresh Dough Operations segment supplies fresh dough items and indirectly supplies proprietary sweet good items through a contract manufacturing arrangement to both Company-owned and franchise-operated bakery-cafes. The fresh dough is sold to both Company-owned and franchise-operated bakery-cafes at a delivered cost not to exceed 27% of the retail value of the product. The sales and related costs to the franchise-operated bakery-cafes are separately stated line items in the Consolidated Statements of Operations. The operating profit related to the sales to Company-owned bakery-cafes is classified as a reduction of the costs in the food and paper products line item on the Consolidated Statements of Operations.
The following table sets forth certain bakery-cafe data relating to Company-owned and franchise-operated bakery-cafes: For the Fiscal Year Ended
December 27, 2005
December 25, 2004
December 27, 2003
Number of bakery-cafes: Company-owned:
Beginning of period......................................................................................................... 226 173 132 Bakery-cafes opened ....................................................................................................... 66 54 29 Bakery-cafes closed......................................................................................................... (2) — (3) Acquired from franchisee(1) ........................................................................................... 21 1 15 Transfer to franchisee(2) ................................................................................................. — (2) — End of period ................................................................................................................. 311 226 173
Franchise operated: Beginning of period......................................................................................................... 515 429 346 Bakery-cafes opened ....................................................................................................... 73 89 102 Bakery-cafes closed......................................................................................................... (1) (4) (4) Sold to Company(1) ........................................................................................................ (21) (1) (15) Transfer from Company(2) ............................................................................................. — 2 — End of period ................................................................................................................. 566 515 429
System-wide: Beginning of period......................................................................................................... 741 602 478 Bakery-cafes opened ....................................................................................................... 139 143 131 Bakery-cafes closed......................................................................................................... (3) (4) (7) End of period ................................................................................................................. 877 741 602
__________
(1) In November 2005, the Company acquired 21 operating bakery-cafes and the area development rights from a franchisee in certain markets in the Indiana area. In October 2004, the Company acquired one operating bakery-cafe in the Dallas, Texas market from a franchisee. During fiscal 2003, the Company acquired 15 operating bakery-cafes and the area development rights from franchisees in the Louisville/ Lexington, Kentucky; Dallas, Texas; Toledo, Ohio; and Ann Arbor, Michigan markets.
(2) In October 2004, the Company transferred two operating bakery-cafes to a new franchisee in the acquisition of the minority interest. See Note 3 of the Company’s Consolidated Financial Statements for further information.

53
The accounting policies applicable to each segment are consistent with those described in Note 2, “Summary of Significant Accounting Policies.” Segment information related to the Company’s three business segments follows (in thousands): For the Fiscal Years Ended
December 27, 2005
December 25, 2004
December 27, 2003
Revenues: Company bakery-cafe operations....................................................................................... $ 499,422 $ 362,121 $ 265,933 Franchise operations .......................................................................................................... 54,309 44,449 36,245 Fresh dough operations ...................................................................................................... 128,422 103,786 93,874 Intercompany sales eliminations ........................................................................................ (41,878) (31,217) (32,350)
Total Revenues................................................................................................................ $ 640,275 $ 479,139 $ 363,702 Segment profit: Company bakery-cafe operations....................................................................................... $ 97,831 $ 71,725 $ 55,111 Franchise operations .......................................................................................................... 47,652 39,149 32,132 Fresh dough operations ...................................................................................................... 11,508 6,942 6,557
Total segment profit ........................................................................................................ $ 156,991 $ 117,816 $ 93,800 Total segment profit ........................................................................................................... $ 156,991 $ 117,816 $ 93,800 Depreciation and amortization ........................................................................................... 33,011 25,298 18,304 Unallocated general and administrative expenses.............................................................. 39,644 28,038 24,027 Pre-opening expenses......................................................................................................... 3,241 2,642 1,531 Interest expense.................................................................................................................. 50 18 48 Other (income) expense, net .............................................................................................. (1,133) 1,065 1,592
Income before income taxes and cumulative effect of accounting change ..................... $ 82,178 $ 60,755 $ 48,298 Depreciation and amortization: Company bakery-cafe operations....................................................................................... $ 23,345 $ 17,786 $ 12,256 Fresh dough operations ...................................................................................................... 6,016 4,356 3,298 Corporate administration.................................................................................................... 3,650 3,156 2,750
Total depreciation and amortization................................................................................ $ 33,011 $ 25,298 $ 18,304 Capital expenditures: Company bakery-cafe operations....................................................................................... $ 67,554 $ 67,374 $ 33,670 Fresh dough operations ...................................................................................................... 9,082 9,445 8,370 Corporate administration.................................................................................................... 5,420 3,610 3,721
Total capital expenditures ............................................................................................... $ 82,056 $ 80,429 $ 45,761
December 27, 2005
December 25, 2004
Segment assets: Company bakery-cafe operations............................................................................................................... $ 301,517 $ 204,295 Franchise operations .................................................................................................................................. 2,969 1,778 Fresh dough operations .............................................................................................................................. 37,567 39,968
Total segment assets ................................................................................................................................ $ 342,053 $ 246,041 Total segment assets................................................................................................................................... $ 342,053 $ 246,041 Unallocated trade and other accounts receivable ....................................................................................... 3,485 1,768 Unallocated property and equipment ......................................................................................................... 13,181 12,291 Unallocated deposits and other .................................................................................................................. 2,263 2,613 Other unallocated assets............................................................................................................................. 76,685 61,959
Total assets .............................................................................................................................................. $ 437,667 $ 324,672
“Unallocated trade and other accounts receivable” relates primarily to rebates and interest receivable, “unallocated property and equipment” relates primarily to corporate fixed assets, “unallocated deposits and other” relates primarily to company-owned life insurance program, and “other unallocated assets” relates primarily to cash and cash equivalents and investments.

54
16. Earnings Per Share
The following table sets forth the computation of basic and diluted earnings per share (in thousands, except for per share data): For the Fiscal Years Ended
December 27, 2005
December 25, 2004
December 27, 2003
Amounts used for basic and diluted per share calculations: Income before cumulative effect of accounting change ...................................................... $ 52,183 $ 38,580 $ 30,669 Cumulative effect of accounting change, net of tax............................................................. — — (239) Net income........................................................................................................................... $ 52,183 $ 38,580 $ 30,430 Weighted average number of shares outstanding — basic .................................................. 30,871 30,154 29,733 Effect of dilutive securities: Employee stock options ..................................................................................................... 772 614 690 LTIP ................................................................................................................................... 8 — —
Weighted average number of shares outstanding — diluted ............................................... 31,651 30,768 30,423 Basic earnings per common share: Before cumulative effect of accounting change................................................................... $ 1.69 $ 1.28 $ 1.03 Cumulative effect of accounting change.............................................................................. — — (0.01) Net income........................................................................................................................... $ 1.69 $ 1.28 $ 1.02 Diluted earnings per common share: Before cumulative effect of accounting change................................................................... $ 1.65 $ 1.25 $ 1.01 Cumulative effect of accounting change.............................................................................. — — (0.01) Net income........................................................................................................................... $ 1.65 $ 1.25 $ 1.00
For the years ended December 27, 2005, December 25, 2004, and December 27, 2003, outstanding options for 0.03 million, 0.5 million, and 0.4 million shares, respectively, were excluded in calculating diluted earnings per share as the exercise price exceeded fair market value and inclusion would have been anti-dilutive.

55
17. Selected Quarterly Financial Data (unaudited)
The following table presents selected quarterly financial data for the periods indicated (in thousands, including explanations below the table, except per share data): Fiscal 2005 — Quarters Ended(1) April 19 July 12 October 4 December 27 Revenues.............................................................................................................. $ 178,148 $ 140,172 $ 148,626 $ 173,329 Operating profit ................................................................................................... 21,942 16,275 18,124 24,754 Net income........................................................................................................... 13,923 10,429 11,669 16,162 Basic earnings per share: Net income ......................................................................................................... $ 0.45 $ 0.34 $ 0.38 $ 0.52
Diluted earnings per share: Net income ......................................................................................................... $ 0.44 $ 0.33 $ 0.37 $ 0.51
Fiscal 2004 — Quarters Ended
(as restated)(2) April 17
(as restated)(2) July 10
(as restated)(2) October 2
December 25
Revenues.................................................................................................. $ 129,899 $ 105,321 $ 113,772 $ 130,147 Operating profit ....................................................................................... 15,318 10,522 13,906 22,092 Net income............................................................................................... 9,494 6,475 8,568 14,043 Basic earnings per share: Net income ............................................................................................. $ 0.32 $ 0.21 $ 0.28 $ 0.46
Diluted earnings per share: Net income ............................................................................................. $ 0.31 $ 0.21 $ 0.28 $ 0.45
__________
(1) See “Quarterly Calendar Change” in Item 7 of this Form 10-K for the Consolidated Statement of Operations for each of the quarters of fiscal 2005 conformed to the 2006 quarterly presentation.
(2) As described in Note 3 to the 2004 Form 10-K Consolidated Financial Statements, the Company restated its consolidated
statements of operations correcting the computation of straight-line rent expense and related leasehold improvement depreciation expense and the classification of landlord allowances. The effect of the restatement increased operating profit by $43, $46, and $50 for the quarters ended April 17, July 10, and October 2, respectively. The effect of the restatement increased net income by $27, $29, and $32 for the same quarters ended, respectively. The restatement did not change previously reported basic or diluted earnings per share in the Company’s first, second, or third quarters.
56
Item 9. Changes in and Disagreements With Accountants on Accounting and Financial Disclosure
None. Item 9A. Controls and Procedures Disclosure Controls and Procedures and Changes in Internal Control Over Financial Reporting
The Company’s management, with the participation of the Company’s Chief Executive Officer and Chief Financial Officer, evaluated the effectiveness of the Company’s disclosure controls and procedures as of December 27, 2005. The term “disclosure controls and procedures,” as defined in Rules 13a-15(e) and 15d-15(e) under the Exchange Act, means controls and other procedures of a company that are designed to ensure that information required to be disclosed by a company in the reports that it files or submits under the Exchange Act is recorded, processed, summarized and reported, within the time periods specified in the Securities and Exchange Commission’s rules and forms. Disclosure controls and procedures include, without limitation, controls and procedures designed to ensure that information required to be disclosed by a company in the reports that it files or submits under the Exchange Act is accumulated and communicated to the company’s management, including its principal executive and principal financial officers, as appropriate to allow timely decisions regarding required disclosure. Management recognizes that any controls and procedures, no matter how well designed and operated, can provide only reasonable assurance of achieving their objectives and management necessarily applies its judgment in evaluating the cost-benefit relationship of possible controls and procedures. Based on the evaluation of the Company’s disclosure controls and procedures as of December 27, 2005, the Company’s Chief Executive Officer and Chief Financial Officer concluded that, as of such date, the Company’s disclosure controls and procedures were effective at the reasonable assurance level.
No change in the Company’s internal control over financial reporting occurred during the fiscal quarter ended December 27, 2005 that has materially affected, or is reasonably likely to materially affect, the Company’s internal control over financial reporting. Management’s Report on Internal Control Over Financial Reporting
The Company’s management is responsible for establishing and maintaining adequate internal control over financial reporting. Internal control over financial reporting is defined in Rule 13a-15(f) under the Exchange Act as a process designed by, or under the supervision of, the Company’s principal executive and principal financial officers and effected by the Company’s board of directors, management and other personnel, to provide reasonable assurance regarding the reliability of financial reporting and the preparation of financial statements for external purposes in accordance with generally accepted accounting principles and those policies and procedures that:
(1) Pertain to the maintenance of records that in reasonable detail accurately and fairly reflect the transactions and dispositions of the assets of the Company;
(2) Provide reasonable assurance that transactions are recorded as necessary to permit preparation of financial statements in
accordance with generally accepted accounting principles, and that receipts and expenditures of the Company are being made only in accordance with authorizations of management and directors of the Company; and
(3) Provide reasonable assurance regarding prevention or timely detection of unauthorized acquisition, use or disposition of the
Company’s assets that could have a material effect on the financial statements.
Because of its inherent limitations, internal control over financial reporting may not prevent or detect misstatements. Projections of any evaluation of effectiveness to future periods are subject to the risk that controls may become inadequate because of changes in conditions, or that the degree of compliance with the policies or procedures may deteriorate.
The Company’s management assessed the effectiveness of the Company’s internal control over financial reporting as of December 27, 2005. In making this assessment, management used the criteria set forth by the Committee of Sponsoring Organizations of the Treadway Commission, known as COSO, in Internal Control — Integrated Framework. Based on its assessment, management has concluded that, as of December 27, 2005, the Company’s internal control over financial reporting was effective to provide reasonable assurance based on those criteria.

57
The Company’s independent registered public accounting firm, PricewaterhouseCoopers LLP, have issued an audit report on the Company’s assessment of the effectiveness of internal control over financial reporting as of December 27, 2005, which is included in Item 8 of this Annual Report on Form 10-K and incorporated herein by reference. Item 9B. Other Information
None.
PART III Item 10. Directors and Executive Officers of the Registrant
Incorporated by reference from the information in the Company’s proxy statement for the 2006 Annual Meeting of Stockholders, which the Company will file with the Securities and Exchange Commission within 120 days of the end of the fiscal year to which this report relates.
The Company has adopted a code of ethics, called the Standards of Business Conduct, that applies to its officers, including our principal executive, financial and accounting officers, and its directors and employees. The Company has posted the Standards of Business Conduct on its Internet website at www.panerabread.com under the “Financial Reports” section of the “About Us — Investor Relations” webpage. The Company intends to make all required disclosures concerning any amendments to, or waivers from, the Standards of Business Conduct on its Internet website. Item 11. Executive Compensation
Incorporated by reference from the information in the Company’s proxy statement for the 2006 Annual Meeting of Stockholders, which the Company will file with the Securities and Exchange Commission within 120 days of the end of the fiscal year to which this report relates. Item 12. Security Ownership of Certain Beneficial Owners and Management and Related Stockholder Matters
Incorporated by reference from the information in the Company’s proxy statement for the 2006 Annual Meeting of Stockholders, which the Company will file with the Securities and Exchange Commission within 120 days of the end of the fiscal year to which this report relates. Item 13. Certain Relationships and Related Transactions
Incorporated by reference from the information in the Company’s proxy statement for the 2006 Annual Meeting of Stockholders, which the Company will file with the Securities and Exchange Commission within 120 days of the end of the fiscal year to which this report relates. Item 14. Principal Accounting Fees and Services
Incorporated by reference from the information in the Company’s proxy statement for the 2006 Annual Meeting of Stockholders, which the Company will file with the Securities and Exchange Commission within 120 days of the end of the fiscal year to which this report relates.

58
PART IV Item 15. Exhibits and Financial Statement Schedules (a) 1. Financial Statements
The following described consolidated financial statements of the Company are included in this report:
Report of Independent Registered Public Accounting Firm
Consolidated Balance Sheets as of December 27, 2005 and December 25, 2004.
Consolidated Statements of Operations for the fiscal years ended December 27, 2005, December 25, 2004, and December 27, 2003.
Consolidated Statements of Cash Flows for the fiscal years ended December 27, 2005, December 25, 2004, and December 27, 2003.
Consolidated Statements of Stockholders’ Equity for the fiscal years ended December 27, 2005, December 25, 2004, and December 27, 2003.
Notes to the Consolidated Financial Statements. (a) 2. Financial Statement Schedule
The following financial statement schedule for the Company is filed herewith:
Schedule II — Valuation and Qualifying Accounts
PANERA BREAD COMPANY
VALUATION AND QUALIFYING ACCOUNTS (In thousands)
Description
Balance at Beginning of Period
Additions- Charged to Expense
Deductions
Balance at End of Period
Allowance for Doubtful Accounts: Fiscal Year Ended December 27, 2003...................................................................... $ 33 $ 27 $ 7 $ 53 Fiscal Year Ended December 25, 2004...................................................................... $ 53 $ 12 $ 36 $ 29 Fiscal Year Ended December 27, 2005...................................................................... $ 29 $ — $ 3 $ 26
Deferred Tax Valuation Allowance: Fiscal Year Ended December 27, 2003...................................................................... $ 3,768 $ — $ 197 $ 3,571 Fiscal Year Ended December 25, 2004...................................................................... $ 3,571 $ — $ 3,021 $ 550 Fiscal Year Ended December 27, 2005...................................................................... $ 550 $ — $ 550 $ —
Self-Insurance Reserves: Fiscal Year Ended December 27, 2003...................................................................... $ 1,416 $ 4,009 $ 3,336 $ 2,089 Fiscal Year Ended December 25, 2004...................................................................... $ 2,089 $ 5,962 $ 4,554 $ 3,497 Fiscal Year Ended December 27, 2005...................................................................... $ 3,497 $ 15,376 $ 9,925 $ 8,948
(a) 3. Exhibits
See Exhibit Index incorporated into this item by reference.

59
SIGNATURES
Pursuant to the requirements of Section 13 or 15(d) of the Securities Exchange Act of 1934, the registrant has duly caused this report to be signed on its behalf by the undersigned, thereunto duly authorized. PANERA BREAD COMPANY By: /s/ RONALD M. SHAICH Ronald M. Shaich Chairman and Chief Executive Officer Date: March 9, 2006
Pursuant to the requirements of the Securities Exchange Act of 1934, this report has been signed below by the following persons on behalf of the registrant in the capacities and on the dates indicated: Signature Title Date
/s/ RONALD M. SHAICH Chairman and Chief Executive Officer March 9, 2006 Ronald M. Shaich
/s/ DOMENIC COLASACCO Director March 9, 2006
Domenic Colasacco
/s/ FRED K. FOULKES Director March 9, 2006 Fred K. Foulkes
/s/ LARRY J. FRANKLIN Director March 9, 2006
Larry J. Franklin
/s/ THOMAS E. LYNCH Director March 9, 2006 Thomas E. Lynch
/s/ NEAL J. YANOFSKY Executive Vice President, Chief March 9, 2006
Neal J. Yanofsky Administrative Officer
/s/ MARK E. HOOD Senior Vice President, Chief March 9, 2006 Mark E. Hood Financial Officer
/s/ RICHARD R. ISAAK Vice President, Controller, Chief March 9, 2006
Richard R. Isaak Accounting Officer

60
EXHIBIT INDEX
Exhibit Number
Description
3.1 Certificate of Incorporation of Registrant, as amended through June 7, 2002. Incorporated by reference to Exhibit 3.1 to the Company’s Quarterly Report on Form 10-Q for the period ended July 13, 2002
3.2 Bylaws of Registrant, as amended through March 5, 2004. Incorporated by reference to Exhibit 3.2 to the Company’s Annual Report on Form 10-K for the year ended December 27, 2003
4.1.1 Form of Rights Agreement, dated as of October 21, 1996 between the Company and State Street Bank and Trust Company (now EquiServe Trust Company, N.A.), as Rights Agent. Incorporated by reference to the Company’s Registration Statement on Form 8-A (File No. 000-19253), filed on November 1, 1996
4.1.2 Amendment of Rights Agreement between the Company and State Street Bank and Trust Company (now EquiServe Trust Company, N.A.), as Rights Agent, dated as of January 15, 1999. Incorporated by reference to the Company’s Registration Statement on Form 8-A/A (File No. 000-19253), filed on November 2, 1999
4.2.1 Revolving Credit Agreement dated as of December 19, 2003 by and between Panera, LLC, as Borrower, and Bank of America, N.A., as Lender. Incorporated by reference to Exhibit 4.1.1 to the Company’s Annual Report on Form 10-K for the year ended December 27, 2003
4.2.2 First Modification to Revolving Credit Agreement dated January 26, 2004. Incorporated by reference to Exhibit 10.1 to the Company’s Quarterly Report on Form 10-Q for the period ended April 17, 2004
4.2.3 Second Modification to Revolving Credit Agreement dated March 26, 2004. Incorporated by reference to Exhibit 10.2 to the Company’s Quarterly Report on Form 10-Q for the period ended April 17, 2004.
10.1 1992 Employee Stock Purchase Plan. Incorporated by reference to Exhibit 10.1 to the Company’s Annual Report on Form 10-K for the year ended December 29, 2001.†
10.2 Formula Stock Option Plan for Independent Directors, as amended. Incorporated by reference to Exhibit 10.2 to the Company’s Annual Report on Form 10-K for the year ended December 29, 2001.†
10.3 Panera Bread Company 1992 Equity Incentive Plan, as amended. Incorporated by reference to Exhibit 10.3 to the Company’s Registration Statement on Form S-8 (No. 333-128049) filed with the Commission on September 1, 2005.†
10.4 Panera Bread Company 2001 Employee, Director and Consultant Stock Option Plan. Incorporated by reference to Appendix A to the Company’s Proxy Statement dated April 21, 2005 filed on Schedule 14A with the Commission on April 21, 2005.†
10.5 Panera Bread Company 2005 Long-Term Incentive Program. Incorporated by reference to Exhibit 10.1 to the Company’s Registration Statement on Form S-8 (No. 333-128049) filed with the Commission on September 1, 2005.†
10.6.1 Confidential and Propriety Information and Non-Competition Agreement between the Registrant and Neal Yanofsky, dated June 5, 2003. Incorporated by reference to Exhibit 10.1 to the Company’s Quarterly Report on Form 10-Q for the quarter ended July 12, 2003.†
10.6.2 Employee and Consultant Non-Qualified Stock Option Agreement between the Registrant and Neal Yanofsky, dated as of June 5, 2003. Incorporated by reference to Exhibit 10.2 to the Company’s Quarterly Report on Form 10-Q for the quarter ended July 12, 2003.†
10.6.3 Employment Letter between the Registrant and Michael Kupstas. Incorporated by reference to Exhibit 10.6.6 of the Registrant’s Annual Report on Form 10-K for the year ended December 25, 1999.†
10.6.4 Employment Letter between the Registrant and Michael Nolan, dated as of July 26, 2001. Incorporated by reference to Exhibit 10.6.13 to the Company’s Quarterly Report on Form 10-Q for the period ended October 6, 2001.†
10.6.6 Form of Panera, LLC Confidential and Proprietary Information and Non-Competition Agreement executed by Senior Vice Presidents. Incorporated by reference to Exhibit 10.1 to the Company’s Quarterly Report on Form 10-Q for the quarter ended October 4, 2003.†
10.7 Description of Compensation Arrangements with Non-Employee Directors.* 10.8 Lease and Construction Exhibit between Bachelor Foods, Inc., the Lessor, and Panera, Inc., the Lessee, dated
September 7, 2000. Incorporated by reference to Exhibit 10.12 of the Company’s Annual Report on Form 10-K for the year ended December 30, 2000
10.9 Bakery product supply agreement by and between Dawn Food Products, Inc., and Panera, LLC, dated November 1, 2002. Incorporated by reference to Exhibit 10.13 to the Company’s Annual Report on Form 10-K for the year ended December 28, 2002

61
21 Registrant’s Subsidiaries.* 23.1 Consent of Independent Registered Public Accounting Firm.* 31.1 Certification by Chief Executive Officer.* 31.2 Certification by Chief Financial Officer.* 32 Certification Pursuant to 18 U.S.C. Section 1350, as adopted Pursuant to Section 906 of the Sarbanes-Oxley Act of
2002, by Chief Executive Officer and Chief Financial Officer.* __________ * Filed herewith. † Management contract or compensatory plan required to be filed as an exhibit to this Form 10-K pursuant to Item 14(c).

62
Panera Bread Company Corporate and Stockholder Information
Management
Ronald M. Shaich Chairman of the Board and Chief Executive Officer
Neal J. Yanofsky President
John M. Maguire Executive Vice President
Mark A. Borland Senior Vice President, Chief Supply Chain Officer
Scott G. Davis Senior Vice President, Chief Concept Officer
Rebecca A. Fine Senior Vice President, Chief People Officer
Patricia A. Gray Senior Vice President, Chief Legal Officer and Secretary
Mark E. Hood* Senior Vice President, Chief Financial Officer
Jeffrey W. Kip* Senior Vice President, Chief Financial Officer
Thomas C. Kish Senior Vice President, Chief Information Officer
Michael J. Kupstas Senior Vice President, Chief Franchise Officer
Michael Markowitz Senior Vice President, Chief Brand Officer
Michael J. Nolan Senior Vice President, Chief Development Officer
William H. Simpson Senior Vice President, Company and Joint Venture Operations * In April 2006, we announced that Mr. Kip would
become our Senior Vice President, Chief Financial Officer effective May 5, 2006, replacing Mr. Hood in those capacities.
Board of Directors
Domenic Colasacco President and Chief Executive Officer, Boston Trust & Investment Management
Larry J. Franklin President and Chief Executive Officer, Franklin Sports, Inc.
Fred K. Foulkes Professor, Boston University School of Management
Thomas E. Lynch Senior Managing Director, Mill Road Capital
Ronald M. Shaich Chairman of the Board and Chief Executive Officer, Panera Bread Company
Corporate Information
Transfer Agent and Registrar Computershare P.O. Box 219045 Kansas City, MO 64121-9045 www.computershare.com
2006 Annual Meeting of Stockholders Thursday, May 25, 2006, 10:30 a.m. Hilton St. Louis Frontenac Ambassadeur Ballroom 1335 South Lindbergh Boulevard St. Louis, Missouri 63131
Independent Registered Public Accounting Firm PricewaterhouseCoopers LLP
Stock Trading Information The Nasdaq National Market Symbol: PNRA
Form 10-K and Other Reports and Information Our Annual Report on Form 10-K, Quarterly Reports on Form 10-Q, Proxy Statement and other reports that we file with the SEC are available on our website at www.panerabread.com. In addition, copies of these reports may be obtained without charge by contacting:
Investor Relations Coordinator Panera Bread Company 6710 Clayton Road Richmond Heights, Missouri 63117 314-633-7100, ext. 6500 www.panerabread.com

(PAGE INTENTIONALLY LEFT BLANK)

(PAGE INTENTIONALLY LEFT BLANK)

