paper 6.2 determination of hydrocarbon dewpoint from on ... · furthermore, gas chromatography is...
TRANSCRIPT

Paper 6.2 Determination of Hydrocarbon Dewpoint from
On-Line Gas Chromatographic Analysis
Douglas Pettigrew Daniel Europe Ltd

North Sea Flow Measurement Workshop 26–29 October 2004
1
DETERMINATION OF HYDROCARBON DEWPOINT FROM ON-LINE GAS CHROMATOGRAPHIC ANALYSIS.
Dr. D.J. Pettigrew
Daniel Europe Ltd., UK 1 INTRODUCTION Hydrocarbon dewpoint and potential hydrocarbon liquid content are very important gas qualities. Not only do hydrocarbon liquids represent lost energy values from gas, they also present a danger to equipment. This is a major area of work and both ISO and GERG groups have technical committees working on requirements for analytical determination of hydrocarbon dewpoint. Deregulation in the gas market has changed the measurement requirements for hydrocarbon dewpoint from an assumed gas property in a unified gas network system to a measured value that must be demonstrated at points of sale and network entry points. Therefore, there is an increasing demand for robust on-line measurement techniques. There are three commonly used methods for determining hydrocarbon dewpoint.
• Chilled mirror techniques – manually operated or automatic. • Gravimetric method, as per ISO6570 [1]. • Calculation from gas chromatographic analysis.
A detailed discussion of the first two techniques is beyond the scope of this paper, however, a brief description of each is given below. 1.1 Chilled Mirror Techniques Chilled mirror techniques rely on the observation of a thin film of hydrocarbon liquid as a gas sample is chilled. It is generally accepted that useful data from manual systems can only be determined by an experienced operator. Furthermore, there is potential interference from condensation of water and or dehydrating agents such as methanol or glycols. On-line systems eliminate operator dependence, however, for both methods, the requirement for the formation of an observable film can result in an underestimation of the dewpoint between 0.5 oC and 1.5 oC. Furthermore, these systems work at fixed pressure and if a suitable pressure is not chosen there can be a further mis-estimation of the maximum dewpressure, also known as the cricondentherm [2]. 1.2 Gravimetric Methods Gravimetric methods measure the mass of condensate separated from natural gas at a defined temperature and pressure. Typically, a plot of condensate collected as a function of time is made. It should be noted that although the amount of potential hydrocarbon liquid formed at a given set of conditions is useful information, there is not a direct correlation with hydrocarbon dewpoint. Furthermore, the amounts of liquid formed are usually very small and data is averaged over hourly or longer periods, giving a very slow response time for monitoring process changes. 1.3 Gas Chromatography Traditionally, in the natural gas industry, on line gas chromatographs have been used to measure composition for calorific value calculation and analysis has typically been to C6+ components. A meaningful hydrocarbon dewpoint cannot be calculated from such C6+ analyses as vapour-liquid equilibrium properties depend strongly on the small concentrations of heavier hydrocarbons such as C8s, C9s, and above that are present in natural gas. Technological advances now allow the determination of heavy hydrocarbon concentrations to ppm sensitivity using robust on-line gas chromatographs.

North Sea Flow Measurement Workshop 26–29 October 2004
2
This paper will discuss:
• Validation of hydrocarbon dewpoint calculations • The development and performance of an appropriate analytical method • Field results and comparison with other on-line hydrocarbon dewpoint determination
methods • Comparison of results obtained from on-line analysis method and detailed laboratory
analysis • Benefits of on-line analysis method, including potential reductions in CAPEX and
OPEX and calculation of properties that cannot be directly measured, e.g., cricondentherm and circondenbar
2 DETERMINATION OF HYDROCARBON DEWPOINT FROM ANALYSIS Calculations of hydrocarbon dewpoint from compositional data are well established. Furthermore, gas chromatography is the accepted method of performing gas analysis. Transmission natural gases typically contain significant quantities, i.e., ppm level, of hydrocarbons up to C9 or C10 [3], with C11s and above being 1 ppm or less and C14s and above beyond any conventional limit of detection [4]. Other authors have reported up to C12 and C15 hydrocarbons [5]. It has been have noted that hydrocarbon dewpoint is mainly influenced by C7 and above hydrocarbons [6,7] therefore, the traditional “C6-plus” analysis provides insufficient data for a valid hydrocarbon dewpoint calculation. However, use of dual detector methods offers the possibility of extended analysis to C9 and above. If suitable analytical sensitivity can be obtained, then the combination of extended on-line analysis and a suitable calculation gives the possibility of hydrocarbon dewpoint determination. Dewpoints can also be calculated at other process conditions without direct measurement. Furthermore, calculation offers the potential benefit of being able to determine properties that are not directly observable such as the cricondentherm and circondenbar, as well as a relatively rapid method of calculating potential hydrocarbon liquid formed under process conditions (cf. ISO6570). 2.1 Calculations. Hydrocarbon dewpoint calculations based on two empirically derived equations of state, PR [8] and RKS [9], [10], have been implemented in a GC controller. At present, there are no internationally recognised standards defining how hydrocarbon dewpoint should be calculated, therefore, the controller calculations have been checked against an existing desktop package (GasVLE). Results from each calculation compare favourably and generally the difference is small (less than 0.5 oC). Divergence only starts to occur at high pressures in the region of the dew-line, where the rate of change of dew temperature with pressure is very high and never exceeded 2 oC. The generally accepted accuracy of hydrocarbon dew-point calculated from analysis is +/- 2 oC. This is significantly greater than the differences observed and from this it can be concluded that the GC controller calculations are valid. Corresponding dew-lines calculated from the desktop and GC controller packages, which are almost co-incident, are sown in figure 1. 2.2 Carbon Number Group Properties Physical properties such as calorific value or density vary little within a carbon number grouping. Therefore, for these standard properties, values associated with the normal component can be assigned to all isomers of the same carbon number for calculation purposes. Unfortunately, this approach is not valid for hydrocarbon dewpoint calculation; the normal component is the highest boiling point isomer and hydrocarbon dew-point calculation based on normal component properties will lead to an over-estimation of the dew temperature. For a typical North Sea gas this over estimation can be greater than 10 oC [11].

North Sea Flow Measurement Workshop 26–29 October 2004
3
Fig. 1 – Comparison of Dewlines From Desktop and GC Controller Calculations It is not practical to provide an on line measurement of every isomer above C6. Even with laboratory methods as carbon number increases it becomes increasingly difficult to identify individual components of a natural gas mixture. Nevertheless, it is known that isomer ratios within a carbon number grouping are relatively constant. Thus, detailed composition can be determined off line and breakdown values entered into the process unit. Even components that are not measured by the on-line GC, such as C12s, can be factored into the calculation if they are thought to be present. The breakdown data should be updated on a regular basis. Irrespective of the accuracy of the breakdown data an on-line calculation will provide a valuable tracking tool. Recent work has indicated that there may be ways to overcome the requirement for off-line analysis. It has been demonstrated [12] that the Lee-Kessler oil fractionation characterisation method [13] can be used to determine average boiling points and critical properties for hydrocarbon dewpoint determination from laboratory analysis. If implemented in a process GC this method would allow a dynamic update of the carbon number group properties and eliminate the need for off line analysis and is planned for future work. Furthermore, it has been shown that there is a relationship between carbon number concentrations and that a plot of log C7 through C10 hydrocarbons can be used to extrapolate concentrations of C11 and above. Hydrocarbon dewpoints calculated using this technique compare well with those calculated from full laboratory analysis [14]. 3 EXTENDED ANALYSIS TO C9+ Traditionally, single detector systems have been used to analyse up to C6+. That is, all hydrocarbon components above pentanes are measured as a single composite component peak. Physical properties are then calculated from an assigned breakdown of this C6+ fraction into C6, C7, and C8 components, either in the chromatograph controller or in a system flow computer. A dual detector system was developed for rich gas mixtures, performing analysis to C9+. In this system the first detector is configured for measurement of components from methane to pentanes, nitrogen and carbon dioxide. The second detector measures hexanes through nonanes (figures 2 and 3), with C9+ being backflushed and the remaining components eluting from a single boiling point column. Results from both detectors are combined in post analysis calculations.
0
10
20
30
40
50
60
70
80
90
100
-60 -50 -40 -30 -20 -10 0
tem p era tu re / d eg C
pres
sure
/ ba
r
D ew C alc (R K S )G a sV L E (R K S )D ew C alc (P R )G a sV L E (P R )

North Sea Flow Measurement Workshop 26–29 October 2004
4
To simplify operation the second detector is calibrated with normal components as response factors within a carbon number grouping are similar.
Fig. 2 - Calibration Gas Chromatogram of C6 to C8 Components Real natural gases contain many isomers other than the straight chain normal components. Analysis on the second detector is by carbon number grouping and, with the normal isomers providing gating peaks for identification and integration.
Fig. 3 - Natural Gas Chromatogram of C6 to C8 Components
t im e
resp
onse
t im e
resp
onse

North Sea Flow Measurement Workshop 26–29 October 2004
5
3.1 Analytical Performance Small changes in higher hydrocarbon components have a proportionally greater effect on hydrocarbon dewpoint than lower carbon number components in a typical natural gas. As a rough rule of thumb, a change in C9 concentration of 1ppm can be thought of as causing a 0.5 oC change in dewpoint temperature, whereas an 8 ppm change in C7 concatenation would be required to produce the same effect. Therefore, to produce worthwhile calculated values for hydrocarbon dewpoint the analysis must be repeatable and sensitive. Repeatability from a one hour period is reported in table 1 below.
Table 1 - Repeatability Of Higher Hydrocarbons Measurement
Component Concentration (ppm) RSD %*
n-C5 980 0.2 n-C6 520 0.1 n-C7 58 0.8 n-C8 18 1.1 C9+ 2 2.4
*RSD is the relative standard deviation In terms of calculated hydrocarbon dewpoint, analysis of a test gas gave hydrocarbon dewpoint values repeatable to within +/- 0.2 oC and this is consistent w-ith calculated uncertainties reported elsewhere [4]. Use of a certified natural gas standard with a variable pressure injection technique was used to determine the limit of detection. These results are reported in table 2.
Table 2 - Limits of Detection For Higher Hydrocarbons
Component LOD (ppm) n-C6 11.4 n-C7 1.6 n-C8 4.3 C9+ 1.6
With an analytical sensitivity to 1 ppm changes in C9+ concentrations, combined with the observed repeatability, detection of dew point changes of 1 oC should be possible. Furthermore, minimum detectable quantity of approximately 2 ppm indicates that relatively low hydrocarbon dew-points can be determined. 3.2 Hydrocarbon Dewpoint Determination In The Field Several C9+ GC systems have been installed in the field for hydrocarbon dewpoint determination, however, only limited comparative performance data is available. One unit operating in Australia has determined hydrocarbon dewpoints of approximately - 35 oC for a lean process gas, with manual dewscope readings indicating that hydrocarbon dewpoint was below –20 oC, therefore, there is broad agreement between two separate techniques.

North Sea Flow Measurement Workshop 26–29 October 2004
6
Of greater interest are the results from two units being operated by MOL in Hungary. These are multi-stream units operating at a gas storage facility and data from 2001 and 2004 is presented below.
-100.00
-80.00
-60.00
-40.00
-20.00
0.00
20.00
40.00
60.00
80.00
HC
D o
C
Fig 4. – Hydrocarbon dewpoint trends from multi-stream C9+ GCs – March – July 2004 A wide range of dewpoints are observed over the period of measurement. Figure 4 is complex and needs to be looked into in more detail.
-25.00
-20.00
-15.00
-10.00
-5.00
0.00
5.00
10.00
HC
D o
C
Fig. 5 – Calculated GC hydrocarbon dewpoints over a one week period A clear periodicity can be seen during a daily cycle, with maxima being observed in late afternoon and minima in the early morning. Moisture dewpoint measurement for this period also shows this periodicity.

North Sea Flow Measurement Workshop 26–29 October 2004
7
-10.00
-8.00
-6.00
-4.00
-2.00
0.00
2.00
4.00
6.00
8.00
10.00
HC
D o
C
Fig 6. - Comparison of calculated hydrocarbon dewpoint (upper line) and measured moisture
dewpoint Comparison of moisture dewpoint variation and hydrocarbon dewpoint variation shows the same periodicity.

North Sea Flow Measurement Workshop 26–29 October 2004
8
The data from the dewscope from 2001 also shows periodicity (figure 7). The dewpoint mean is around 4 oC but that there is considerable variation during a twenty-four hour period, up to 8 oC. Maximum values are measured in the afternoons and minima measured in then early hours of the morning, which is consistent with the variations observed with the GC and moisture dewpoint results. The observation that three separate measurement techniques show similar behaviour indicates that the observed periodicity must be a function of some physical process and this will be discussed in more detail below.
-10
-5
0
5
10
15
20
25
30
HC
D o
C
Fig. 7 – Variation in on-line dewscope hydrocarbon dewpoint measurement Much less variation in dewpoint was noted for very low dewpoints.
-60.00
-50.00
-40.00
-30.00
-20.00
-10.00
0.00
HC
D o
C
Fig. 8 – Calculated hydrocarbon dewpoint variation at different temperatures

North Sea Flow Measurement Workshop 26–29 October 2004
9
For some streams the observed variation of hydrocarbon dewpoint was much greater, dropping rapidly from around –20 oC to –50 oC, figure 9.
-60.00
-50.00
-40.00
-30.00
-20.00
-10.00
0.00
HC
D o
C
Fig. 9 – Rapid drop off of hydrocarbon dewpoint calculated values
The rapid drop of in calculated dewpoint shown in figure 9 suggests that there was mis-measurement of the C9+ and possibly other heavy hydrocarbon components. It certainly indicates that the analytical set up for measurement of the C9+ component needs to be reviewed for this particular analysis. However, the sudden drop of to dewpoints of –50 oC and the lack of observations of dewpoints much below –20 oC may also suggest a limit for accurate dewpoint measurement of around –20 oC for this particular analyser and the associated gas composition. Looking more closely at the hydrocarbon dewpoint data, results from 2001 showed reasonable consistency between the on-line dewscope and the GC for a three month period, with dewpoints ranging from – 5 oC to 25 oC. However, for the more recent period no data for the on-line dewscope is available.
Fig. 10 – Comparison of calculated and directly measured hydrocarbon dewpoints – long term
-10
-5
0
5
10
15
20
25
30
HC
D o
C
Daniel Dewscope
North Sea Flow Measurement Workshop 26–29 October 2004
10
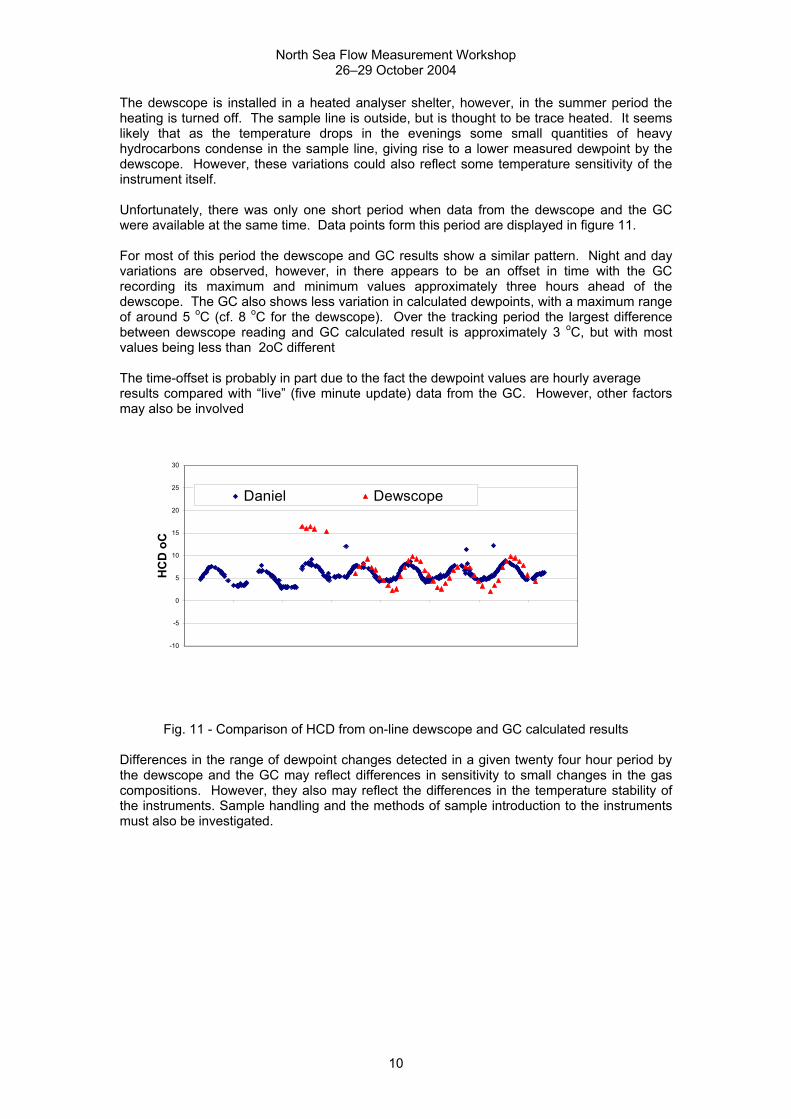
The dewscope is installed in a heated analyser shelter, however, in the summer period the heating is turned off. The sample line is outside, but is thought to be trace heated. It seems likely that as the temperature drops in the evenings some small quantities of heavy hydrocarbons condense in the sample line, giving rise to a lower measured dewpoint by the dewscope. However, these variations could also reflect some temperature sensitivity of the instrument itself. Unfortunately, there was only one short period when data from the dewscope and the GC were available at the same time. Data points form this period are displayed in figure 11. For most of this period the dewscope and GC results show a similar pattern. Night and day variations are observed, however, in there appears to be an offset in time with the GC recording its maximum and minimum values approximately three hours ahead of the dewscope. The GC also shows less variation in calculated dewpoints, with a maximum range of around 5 oC (cf. 8 oC for the dewscope). Over the tracking period the largest difference between dewscope reading and GC calculated result is approximately 3 oC, but with most values being less than 2oC different The time-offset is probably in part due to the fact the dewpoint values are hourly average results compared with “live” (five minute update) data from the GC. However, other factors may also be involved
Fig. 11 - Comparison of HCD from on-line dewscope and GC calculated results Differences in the range of dewpoint changes detected in a given twenty four hour period by the dewscope and the GC may reflect differences in sensitivity to small changes in the gas compositions. However, they also may reflect the differences in the temperature stability of the instruments. Sample handling and the methods of sample introduction to the instruments must also be investigated.
-10
-5
0
5
10
15
20
25
30
HC
D o
C
Daniel Dewscope

North Sea Flow Measurement Workshop 26–29 October 2004
11
Another set of comparative data is available from an instrument on a co-generation power plant, analysing refinery off gas, figure 12, below.
2 . 0 0 0
3 . 0 0 0
4 . 0 0 0
5 . 0 0 0
6 . 0 0 0
7 . 0 0 0
8 . 0 0 0
9 . 0 0 0
10 . 0 0 0
11. 0 0 0
12 . 0 0 0
13 . 0 0 0
14 . 0 0 0
15 . 0 0 0
time period
tem
pera
ture
/ de
gC
chiller temperaturemeasured dew temperature @ 6 bar
Fig. 12 - Comparison of calculated hydrocarbon dewpoint and chiller temperature
A chiller system is in operation on the refinery gas being provided by the refinery operator to a power generation plant for use as a fuel gas for a gas turbine. The chiller acts like a separator and takes out higher hydrocarbon liquids producing a hydrocarbon saturated gas at its dew temperature. Assuming the chiller is operating with 100% efficiency then the dew temperature of the produced gas (at the operating pressure of 6 bar) should be exactly that of the chiller's operating temperature.
The calculated hydrocarbon dewpoint tracks changes in the chiller temperature, mainly within 2 oC, with the largest variation being 3 oC. However, unlike the data from the MOL site, figure 10, where the dewscope and GC give similar results, there is a systematic offset of a lower dew temperature for the GC calculated results
There could be several reasons for this which are summarised below along with other comments:
• The chiller operates at 6 barg. In this region of the isotherm there is a very sharp change in dew temperature for a relatively small change in pressure. Hence, subtle changes in the operating pressure of the chiller could produce marked changes in dew temperature. In addition, as the calculation is very sensitive in this region then an actual process pressure of say 5.5 barg could explain the larger discrepancies.
• The RKS EOS gives better agreement for natural & refinery gases than the PR EOS but the EOS used cannot be confirmed; this could explain some of the differences.
• Calculation of critical properties for the grouped components is based on visual assignment of peaks within the higher carbon number groups and set in the controller's configuration at commissioning. The critical properties of the grouped components may need to be adjusted as the detailed composition may have changed since commissioning.
• The supply pipe from the chiller to power generation site is unlagged. This could cause further dropout during winter months and may give rise to discrepancies. However, the data were collected in July and this could not explain the differences during the day when ambient temperatures were much above the chiller temperature. The trend seems to show a better agreement at night than in the day. However, if there were an absolute systematic over-estimation of the HCD from the GC due to

North Sea Flow Measurement Workshop 26–29 October 2004
12
say a higher than actual gas pressure used for the calculation then the agreement during the day would be better than at night. The calculated HCD line would come down. This would give better agreement in the day than at night. Consequently, at night when the ambient temperature may have approached that of the chiller temperature then small amounts of liquid may have been condensed thereby reducing the HCD further. This may explain the discrepancies.
• Observations by the plant operators suggest that a major cause of dewpoint variation was variation in measurement of the C9+ fraction. This is consistent with the observations from the MOL site (figures 8, 9).
• Agreement seems to be better at the lower chiller temperatures. Hence, the efficiency of the chiller may not be so good at the higher operating temperatures. Thermodynamic equilibrium may not be reached at higher chiller temperatures, perhaps due to residence time effects, allowing some heavier hydrocarbons through into the gas phase [16].
4 EXTENDED ANALYSIS TO C10 Analysis to C9+ only prevents any detailed information from being gained about the nature of any C9 components, plus the presence, or otherwise of any C10 isomers cannot be confirmed. Due to the significance of higher hydrocarbon contribution to hydrocarbon dewpoint laboratory work has been carried out to develop a C10 analysis method. Furthermore, recent work [2] indicates that analysis to C10 is necessary to achieve dewpoint uncertainties of the order of 1 oC. Moreover, use of extrapolation techniques to estimate C11 and above components requires analysis to C10 to minimise dewpoint uncertainty [16]. A simple C10+ application was developed, utilising the same approach as the C9+ method described above, with backflush of C10+ components and isothermal separation of C6 through C9 on a forward flow capillary column. Analysis results indicated that the heavier ends were under-reported when compared to the laboratory GC and it was concluded that a single analytical operation could not be used for C6 to C10+ analysis. A second method was then developed. The first part of the method is similar to the C9+ analysis in that the C6 to C8 components are separated on a single column. C9 and C10 are determined by backflushing a large C9+ sample from a traditional packed column system, then cutting a fraction of this peak onto a capillary column for forward flow analysis. This also allows boiling point data to be inferred from chromatographic behaviour. The first peak is the tail of normal C8 which is used to provide a relative retention time for the other components.
Fig.12 - Chromatogram of natural gas C9+ fraction
- 5
0
5
1 0
1 5
2 0
2 5
0 2 0 4 0 6 0 8 0 1 0 0 1 2 0 1 4 0

North Sea Flow Measurement Workshop 26–29 October 2004
13
4.1 Comparison Of Process And Laboratory GC Results A number of UK transmission natural gases were analysed an on a laboratory FID gas chromatograph and hydrocarbon dewpoint curves calculated, in accordance with ISO TC193 CD 23874. These gases were then analysed on a Dual Danalyzer process gas chromatograph with a thermal conductivity detector system configured to perform C10+ and C10 analyses as described above. Calculated hydrocarbon dewpoint data from all methods, and differences relative to the laboratory GC are listed in table 3. Table 3 - Comparison of calculated hydrocarbon dewpoint form laboratory and process
gas chromatographs
HCD 1 2 3 4 5 6 7 8 9 Lab -3.0 -19.5 -5.6 -6.1 -5.0 -16.4 -15.3 -45.4 -6.1
C10+ -8.5 -21.0 -5.6 -6.1 -6.2 -18.4 -16.8 -41.6 -8.9 ∆ -5.5 -1.5 0 0 -1.2 -2.0 -1.5 3.8 -2.8
C10 -3.1 -19.4 -4.7 -5.2 -3.2 -14.4 -14.5 -43.8 -4.9- ∆ -0.1 0.1 0.9 0.9 1.8 2.0 0.8 1.6 1.2
The mean variation between the calculated dewpoints for the C10+ configuration and the laboratory GC is of the order of -2 oC, with one anomalous result at a dewpoint of –3 oC and another at –45 oC. Similar analytical performance would be expected from the C9+ system and the mean deviation of –2 oC is consistent with the observation that the C9+ system tracks an on-line dew dewscope [2]. For the forward flow C10 analysis system the mean variation is 1 oC and the maximum difference is 2 oC. These results compare favourably with a process gas chromatograph with a more complex flame ionisation detector [2]. Furthermore, a mean variation of 1 oC is within the limits of the UK transmission system.
-6
-4
-2
0
2
4
6
-50 -45 -40 -35 -30 -25 -20 -15 -10 -5 0
Gas HCD
Diff
eren
ce fr
om la
b G
C
C10+C10
Fig. 13 - Comparison of calculated HCDs from laboratory and process gas chromatographs

North Sea Flow Measurement Workshop 26–29 October 2004
14
A process gas chromatograph based on the forward flow C10 analysis is not installed at a gas measurement station in Pakistan. The instrument is working well, but there are no comparative measurement data from site. 5 CAPEX AND OPEX The aim of this paper is to outline the technical possibilities of hydrocarbon dewpoint calculation from gas analysis. Nevertheless, there are also potential financial impacts from adopting this approach. Basic hydrocarbon composition in accordance with ISO 6974 [17] is required to determine hydrocarbon dewpoint. Therefore, any on-line analytical system that determines hydrocarbon dewpoint will also provide information for determination of other physical properties such as calorific value and Wobbe index. This can result in a reduction in the total number of instruments required on a measurement system and a reduction of overall packaging and communications costs. Moreover, process gas chromatographs can be multi-streamed, whereas, dewscopes are traditionally dedicated to a single stream. Thus, a single process GC can provide measurements that would require multiple dewscopes. It can be seen from this that a suitable instrument would offer significant CAPEX savings. Operationally, the use of a single instrument reduces spares holding and training requirements. Furthermore, TCD based process gas chromatographs are normally found to be robust and reliable. Compressed air is not required and only a minimum number of carrier gas cylinders are required. In contrast flame ionisation detector systems have a high utility gas requirement (at least three times that of a TCD system). Therefore, there are also potential OPEX savings to be made. 6 CONCLUSIONS In conclusion, the use of dual detector systems gives the opportunity to use current robust field technology to perform a much wider range of analyses and gain significantly more information on the overall gas quality. • Small quantities of higher hydrocarbons down to ppm levels can be sensitively measured
with good repeatability on a thermal-conductivity detector based system. • Hydrocarbon dewpoint can be calculated repeatably from a C9+ analysis and small
changes in the process gas can be detected. This offers a valuable tool for tracking dewpoint. With correct calibration and use of extended analysis data a means of accurately determining hydrocarbon dewpoint can be obtained.
• Use of an analytical method to determine hydrocarbon dewpoint allows non-measureable
contract values such as cricondentherm to be determined. Other potentially useful measures such as the potential amount of hydrocarbon liquid formed could also be calculated.
• Analysis to C10 is achievable on a process instrument. Excellent agreement with
laboratory analysis results and calculated hydrocarbon dewpoint values has been obtained, with mean hydrocarbon dewpoints calculated to within 1 oC of those obtained from the laboratory analysis.
North Sea Flow Measurement Workshop 26–29 October 2004
15
7 ACKNOWLEDGMENTS I wish to thank the following for their contributions to this paper. Mr. J. Balla of MOL Hungary for providing site data and observations on the practical operation of the C9+ measurement systems. Dr. G. Squire of Effectech for providing site data and comments for the refinery off-gas measurement system. 8 REFERENCES [1] ISO6570 – Natural gas [2] C. J. Cowper; Natural gas hydrocarbon dewpoint; comparison of measurement and
calculation methods. 2nd Gas Analysis Symposium and Exhibition, Maastricht, 2002 [3] C. Cowper & A. De Rose, Analysis of Gases by Chromatography, Pergamon Series
in Analytical Chemistry, volume 7, 1985 [4] C. J. Cowper; Analysis of treated natural gas for dewpoint determination; Advantica
gas quality symposium, Loughbrough, 2002 [5] P.A.H. Derks, L.Kuijk & A.L.C. Smit, Proceedings of the 1992 International Gas
Research Conference, page 807 [6] [7] P.A.H. Derks et al., Proceedings of the 1995 International Gas Research Conference,
page 519 [8] Peng D. Y., & Robinson D. B, Ind Eng Chem Fundam. 1976, 15 (1), 59 [9] Reich O., & Kwong, J.N.S, Chem. Review, 1949, 44, 233 [10] Soave, G, Chem. Eng. Sci., 1972, 27, 1197 [11] C.J. Cowper – Private communication [12] ISO TC193 – CD 23874 – Natural gas – Gas chromatographic requirements for
hydrocarbon dewpoint calculation (2004) [13] G. Kessler & B. Lee, Hydrocarbon Processing, March 1976, p153. [14] C. J. Cowper – Private communication [15] D. J. Pettigrew; Performance of dual detector systems in natural gas analysis. 2nd
Gas Analysis Symposium and Exhibition, Maastricht, 2002 [16] G. Squire – Private communication [17] ISO 6974 (1995) – Natural gas – analysis with defined uncertainty