paper bench marking in automotive industry distribution process
TRANSCRIPT
8/8/2019 Paper Bench Marking in Automotive Industry Distribution Process
http://slidepdf.com/reader/full/paper-bench-marking-in-automotive-industry-distribution-process 1/12
Page 1 of 12
The 2007 BPC World Conference Proceedings© Business Process Council
Madhup M Paturkar, Consultant
Bench Marking in Automotive IndustryDistribution Process: Case Study of LuxuryCar Maker
SynopsisThe industry of industry as Peter Drucker referred to the automotive industry hasbeen frequent subject of studies.
Distribution plays a key role in taking product to the customer and dealer, eventhough the distribution system in Automotive Industry has been less researched.
Average new stock level in US has been over 60 days and $66.7 billion of capital tied up at any point of time.
This paper analyses the different distribution model implemented by Auto major.US Auto Major implemented Load Driven Cross Docking
1) Revamping the Logistics Strategy in 20012) Reduction in finished vehicle inventory of over $1 Billion
German Car Maker saved $20 Million in 1996-97 by changing distribution strategy from Push to Pull. A case Study presented in the paper details the distribution strategy for 3 key marketsin Asia-Africa region for Germany Luxury Car Maker. Distributors in three countriesare analyzed: South Africa, Japan & Australia. This paper also analyses the
parameter for distribution strategy specific to Auto industry as a part of case study.
Key words: Automotive Industry, Distribution Chain, Push vs. Pull, Cross docking.
Literature Survey
The ‘industry of industries’, as Peter Drucker (1946) referred to theautomotive industry more than half acentury ago, has been a frequentsubject of academic studies.
With respect to operationsmanagement concepts, the
proliferation of the Just-in-Time(JIT) or lean production paradigm(Schonberger, 1982; Monden, 1983;Womack et al.,1990) has been a keytenet in the literature.
8/8/2019 Paper Bench Marking in Automotive Industry Distribution Process
http://slidepdf.com/reader/full/paper-bench-marking-in-automotive-industry-distribution-process 2/12
Bench Marking in Automotive Industry Distribution ProcessMadhup M Paturkar
Page 2 of 12
The 2007 BPC World Conference Proceedings, 30 Nov – 01 Dec 2007© Business Process Council
Despite the efficiency gains at themanufacturing level however, overall
vehicle supply systems shows poor performance in responding tocustomer needs, and increasingly relyon incentives and rebates to sell their vehicles (Ramcharran, 2001; Holwegand Pil, 2004). A key reason for thisdichotomy has to be seen in the factthat – while manufacturing practiceswere reengineered – distributionsystems largely remained unchanged.The large majority of cars is still produced to forecast, andsold from dealer inventory. In acapital-intensive industry such asautomotive, this approach renders themanufacturer less vulnerable toswings in demand in the marketplace.
While inventory levels inside themanufacturing operation have beenreduced, the average new vehiclestock level in the US has consistently
been above 60 days for the period of 1996-2004. On average, 3,332,950units were held at any point over thistime frame in the US market, which(assuming an average sales price of $20,000) equates to $66.7 billion of capital tied up at any point in time.
The total distribution systemaccounts for about c.30% of the
recommended retail price this seemssurprising, in particular given thatmanufacturing only accounts for c.12% (Holweg and Pil, 2004).
Few academic studies, such as (Kiff,1997; Blumenfeld et al., 1999;Karabakal et al., 2000), directlyanalyze the drivers behind inventoryin the retail and distribution end of
the supply chain, although the role of and reasons for excess inventory has
conceptually been well describedwithin the wider field of supply chaindynamics (Forrester, 1958; Sterman,1989; Lee and Billington, 1992). Of
particular interest to the underlyingstudy is the paper by Blumenfeld etal. (1999), which shows that,analytically, the inventory level at theretailer is driven by the stock replenishment lead time, and howshorter order lead times could reducethe finished goods inventory.
Inventory in Auto Retail Chain is afunction of some parameters whichare unique to Automotive industry.These are dealt in some depth is
paper New Vehicle Supply Systemsin the USA and Europe: AComparative Analysis by Sander deLeeuw, Matthias Holweg, and Geoff Williams
Above analysis does prove the factthat retail distribution inventoryforms one of the base criteria for efficiency of the Distribution Chain.
Academia has given few basicstrategy of distribution system toachieve optimum inventory level.
Cross Docking
ScheduleDriven Load Driven
Push – Pull System
Theses strategies have been used invarious different industries andscenario. Each industry has unique
parameters which controls inventoryin supply chain.
8/8/2019 Paper Bench Marking in Automotive Industry Distribution Process
http://slidepdf.com/reader/full/paper-bench-marking-in-automotive-industry-distribution-process 3/12
Bench Marking in Automotive Industry Distribution ProcessMadhup M Paturkar
Page 3 of 12
The 2007 BPC World Conference Proceedings, 30 Nov – 01 Dec 2007© Business Process Council
Having given brief background of analysis done so far in Automotive
Distribution Chain, we come to theobjective of this paper. Objective of this paper is two fold
1) To look at the case studieswhich used one of the abovementioned strategies torevamp the distribution chainwith use of Mixed Integer Programming
a. Each case study willgive a view of different scenarioswhich are analyzed
b. Different strategieswhich are followed inorganizations.
2) To take a look at push-pullDistribution Strategy of Luxury car maker and to findout parameters governingPush – Pull system for AutoIndustry.
Basic Concept
Cross Docking
Cross Docking is a distributionsystem in which merchandise
received at a warehouse or distribution center is not stocked butimmediately prepared for onwardshipment. In other words, close synchronization of allinbound and outbound shipments iscrucial.
There are two ways Cross Dockingcan be done:
Schedule-driven cross-docking:systems dispatch transportation units
on a channel according to a fixedschedule
Load-driven cross-docking systems:on the other hand, dispatchtransportation units on a channel onlywhen a sufficient volume of goods isawaiting transportation on thatchannel.
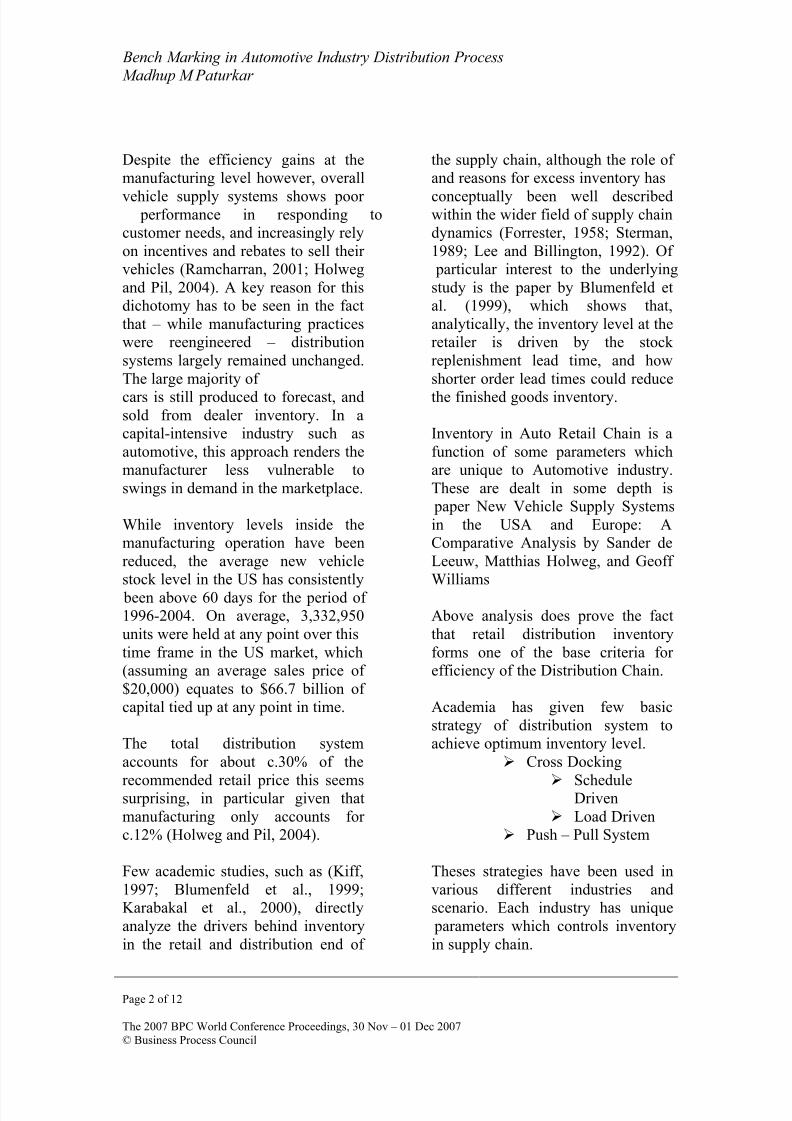
Push – Pull System:
Following are the characteristics of Push – Pull System
These advantages and disadvantagesof Push and Pull supply chains haveled companies to look for a newsupply chain strategy that takesadvantage of the best of bothworld; enter a hybrid of the twosystems, Push-Pull Supply Chainsystems.
Push – Pull Supply Chain
In a Push-Pull strategy, some stagesof the supply chain, typically theinitial stages are operated in a push-
based manner while the remainingstages are operated in a pull-basedstrategy. We typically refer to theinterface between the push-basedstages and
8/8/2019 Paper Bench Marking in Automotive Industry Distribution Process
http://slidepdf.com/reader/full/paper-bench-marking-in-automotive-industry-distribution-process 4/12
Bench Marking in Automotive Industry Distribution ProcessMadhup M Paturkar
Page 4 of 12
The 2007 BPC World Conference Proceedings, 30 Nov – 01 Dec 2007© Business Process Council
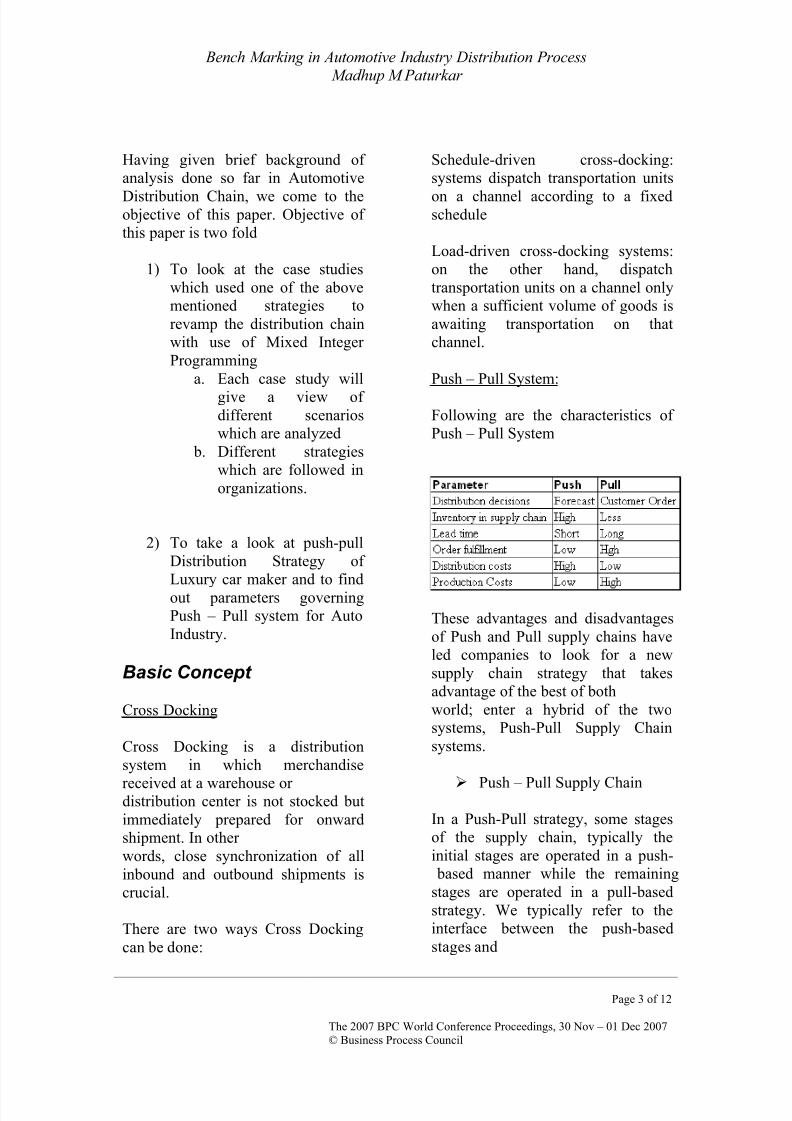
the pull-based stages as the push-pull boundary.
Characteristics the Push part is applied to the
portion of the supply chain wherelong- term forecasts have smalluncertainty and variability. On theother hand, the Pull part is applied tothe portion where uncertainty andvariability are high.
designed on the premise thatinventory is essential
Push-pull boundary needs to be defined as per industryrequirement
Push-Pull Boundary
Case Study 1:
A US Car maker, a wholly ownedsubsidiary of German Car Manufacturer, imports, markets anddistributes vehicles in the UnitedStates. The vehicles are assembled inMexico or Germany and distributed
to a network of approximately 750dealer sites across the United States
The existing system had beendeveloped around two implicitassumptions. The first is that thedealer (retail operator) is the"customer" of the Car Maker distribution process, not the end user.The second assumption was that,significant vehicle inventory (60-90
days of sales) carried by the dealer operator creates an incentive
(financing cost avoidance) toincrease the rate of sales. Thus thedistribution system operated as a"push" system. It had all the dis-advantages as described previously.
New principles the following performance criteria were establishedthat the reengineered process wouldhave to meet;
1. Maximize the percentage of customers who received their firstchoice of vehicles.2. If a customer's first choice was notin a dealer's inventory, a first choicevehicle would be delivered to thedealer from manufacturer inventorywithin 48 hours.3. Significantly reduce the totalsystem (dealers and Car Maker) costsassociated with transportation,financing and storage. Primarilythrough inventory reduction.
new system would be designed tosupport a "pull" type of distributionstrategy.
Problem Description
Vehicles for sale in the U.S. are first
shipped to one of the five U.S. portsthat act like distributioncenters. These five ports have alsofacilities, called processing centers.They are then shipped to the dealersat major market areas by acombination of rail and truck transportation.
8/8/2019 Paper Bench Marking in Automotive Industry Distribution Process
http://slidepdf.com/reader/full/paper-bench-marking-in-automotive-industry-distribution-process 5/12
Bench Marking in Automotive Industry Distribution ProcessMadhup M Paturkar
Page 5 of 12
The 2007 BPC World Conference Proceedings, 30 Nov – 01 Dec 2007© Business Process Council
Team focused on improving the flowof vehicles from plants to dealers in
terms of cost and customer service. The basic idea was theestablishment of more distributioncenters closer to metro markets sothat the following benefits could berealized:• the chance of meeting a customer'sfirst choice vehicle increases• first choice vehicles are deliveredwith shorter lead times,• part of the current expensive truck routes could be replaced by cheaper rail routes, and• the burden of carrying highinventory for multiple dealers isreduced through poolingvarious popular vehicles at a singlenearby distribution center,The main issues that need to beaddressed were the determination of new distribution center locations.
For analysis purposes, the totaldistribution cost into threecomponents:
1. plant to processing center cost2. processing center to distributioncenter cost3. distribution center to market areacost4. inventory holding costs as finance
charges
Clearly, the number and locations of processing centers and distributioncenters are major factors thataffect both customer service anddistribution cost measures. Moreover,there is choice for the type of facility to be installed; Type Ifacilities are smaller in capacity andcheaper. Type II facilities are larger,
Modeling Approach
The objective function consists of two components: 1) totaltransportation cost, which depend onthemileage between locations, modes of transportation, and truck load factors(explained below) and 2) fixedfacility installation and overheadcosts at processing centers anddistribution centers, which depend onthelocation and capacities. Truck loadfactors refer to the average number of vehicles that a truck carries in atypical shipment. A truck carries amaximum of ten vehicles. Inventoryholding costs are ignored in the MIR Constraints are specified to assurethata) market demands are satisfied,
b) capacity limitations for facilitytypes are not violated,c) market orders can be shippedwithin a specified time window, andd) maximum number of distributioncenters and processing centers toinstall are notexceeded.
Scenario Analysis
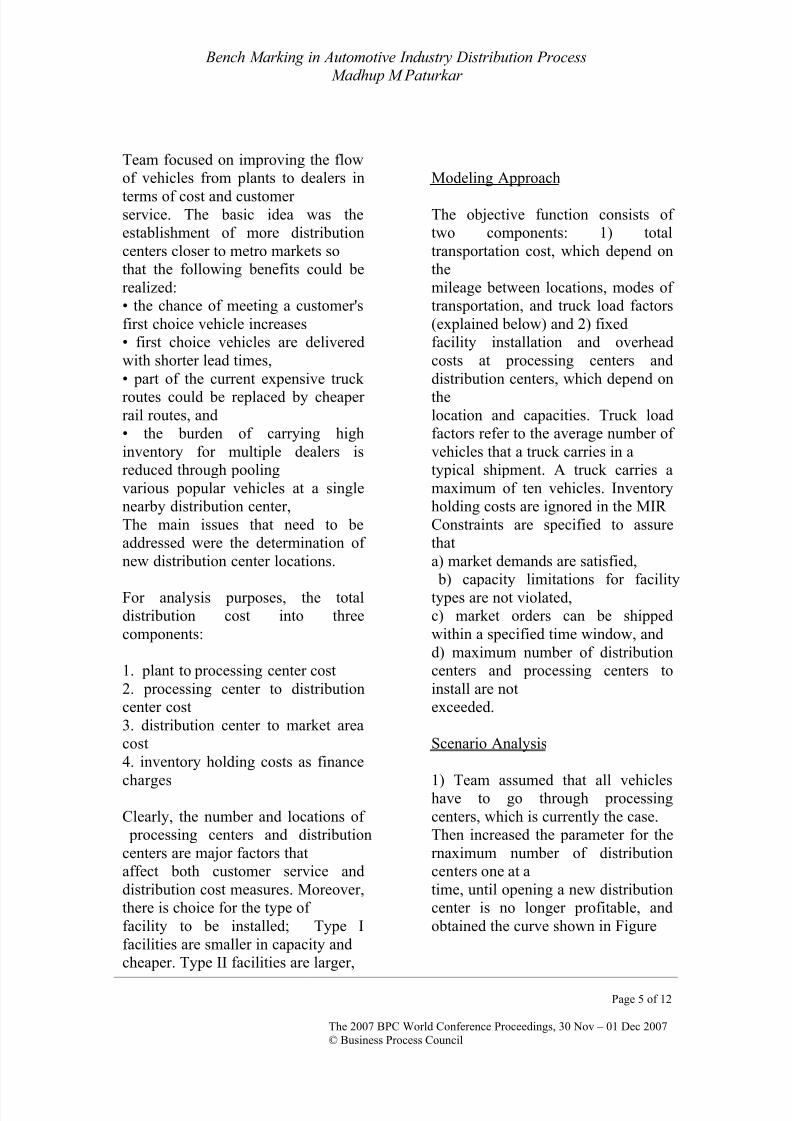
1) Team assumed that all vehicleshave to go through processingcenters, which is currently the case.Then increased the parameter for thernaximum number of distributioncenters one at atime, until opening a new distributioncenter is no longer profitable, andobtained the curve shown in Figure
8/8/2019 Paper Bench Marking in Automotive Industry Distribution Process
http://slidepdf.com/reader/full/paper-bench-marking-in-automotive-industry-distribution-process 6/12
Bench Marking in Automotive Industry Distribution ProcessMadhup M Paturkar
Page 6 of 12
The 2007 BPC World Conference Proceedings, 30 Nov – 01 Dec 2007© Business Process Council
2) Team did analysis under thecondition that vehicles do not have to
go through processingcenters, but can be directly shipped tothe distribution center, and produceda curve similar to that in Figure.3) Team investigated the effects of decreasing the number of processingcenters as well as the effectsof letting other distribution centersact like processing centers by simplyimposing additional constraints inthe MIP
ConclusionsMajor findings of our quantitativeanalysis based on the optimizationand simulation results includedthe following:
1) Since railroad transportation ischeaper than trucks, a cost-optimal
policy includes far moredistribution centers than the current
one. An optimal solution estimatesover $20 millionannual savings in transportationrelated costs.2) Distance to existing processingcenters adds about $6 million per year to an optimalsolution.3) Fixed costs of installing andoperating pool facilities areinsignificant as compared to savings
in transportation costs.The simulation outcomes
demonstrated that a decentralizeddistribution center concept couldachievethe new performance criteria. Thisconcept was complimented withother revised distribution subsystems(forecasting, ordering, invoicing,etc.) .
Case Study 2:
A automobile Major announced analliance with Logistics group with agoal of reducing by 40% the timerequired to get vehicles todealerships. After a year itannounced that its average deliverytime had reduced by 4 days, areduction in finished vehicleinventory of over $1 billion.
The distribution network is based ona disciplined hub-and-spoke systemutilizing both rail and groundtransportation. The newlyreengineered network improvedreliability and speed to dealers byconsidering vehicle demand,assigning production volumes fromeach plant to the appropriate rail andtruck haul-away carriers in line withthis demand and then, determining
the optimum sourcing lanes, loadsand delivery schedule for each of the6,000 dealers.
Most new automobiles manufacturedin the US are transported by rail frommanufacturing plants to specialrailroad centers called ramps andthen by truck to local dealers. This istypically a load-driven system.
Newly assembled automobiles are
8/8/2019 Paper Bench Marking in Automotive Industry Distribution Process
http://slidepdf.com/reader/full/paper-bench-marking-in-automotive-industry-distribution-process 7/12
Bench Marking in Automotive Industry Distribution ProcessMadhup M Paturkar
Page 7 of 12
The 2007 BPC World Conference Proceedings, 30 Nov – 01 Dec 2007© Business Process Council
parked in load lanes at the plantaccording to their destination ramp.
Whenever a sufficient number of vehicles destined for a single rampaccumulate in a load lane, thevehicles are loaded onto a railcar.
At the final destination ramps,vehicles are off-loaded from therailcars. When a sufficient number of vehicles destined for dealerships in agiven area accumulates, the vehiclesare loaded on a rig and delivered.
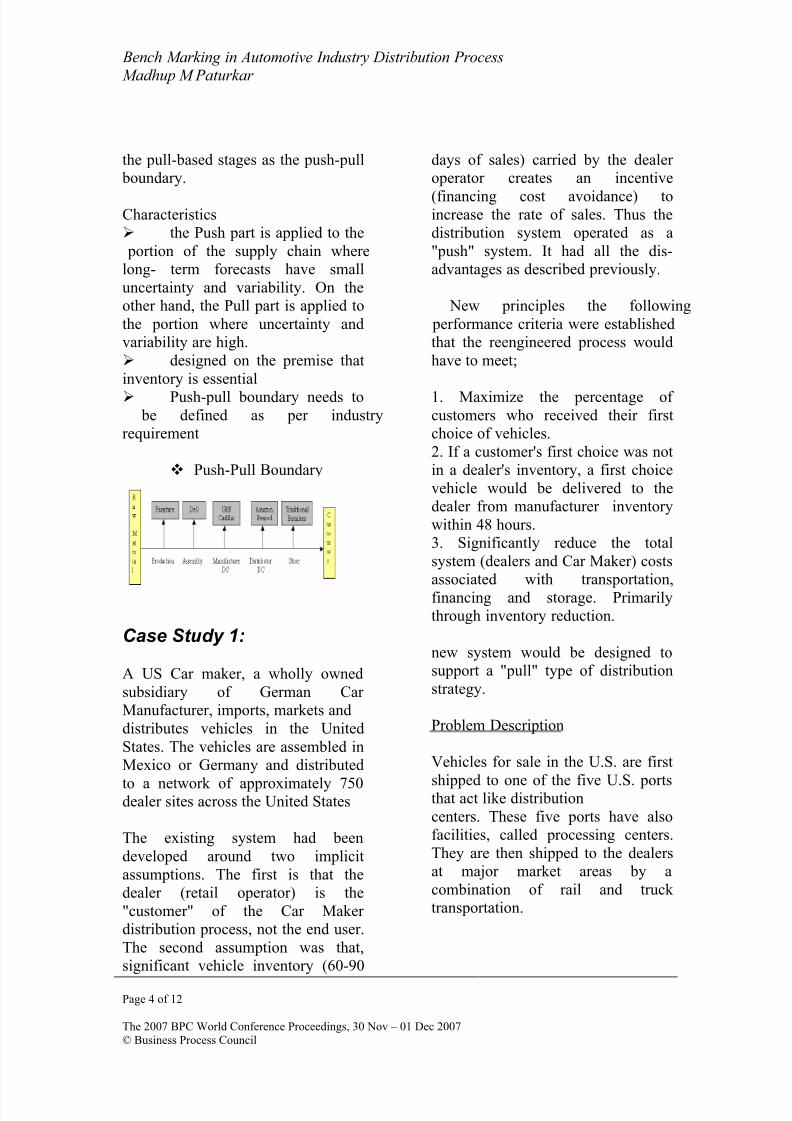
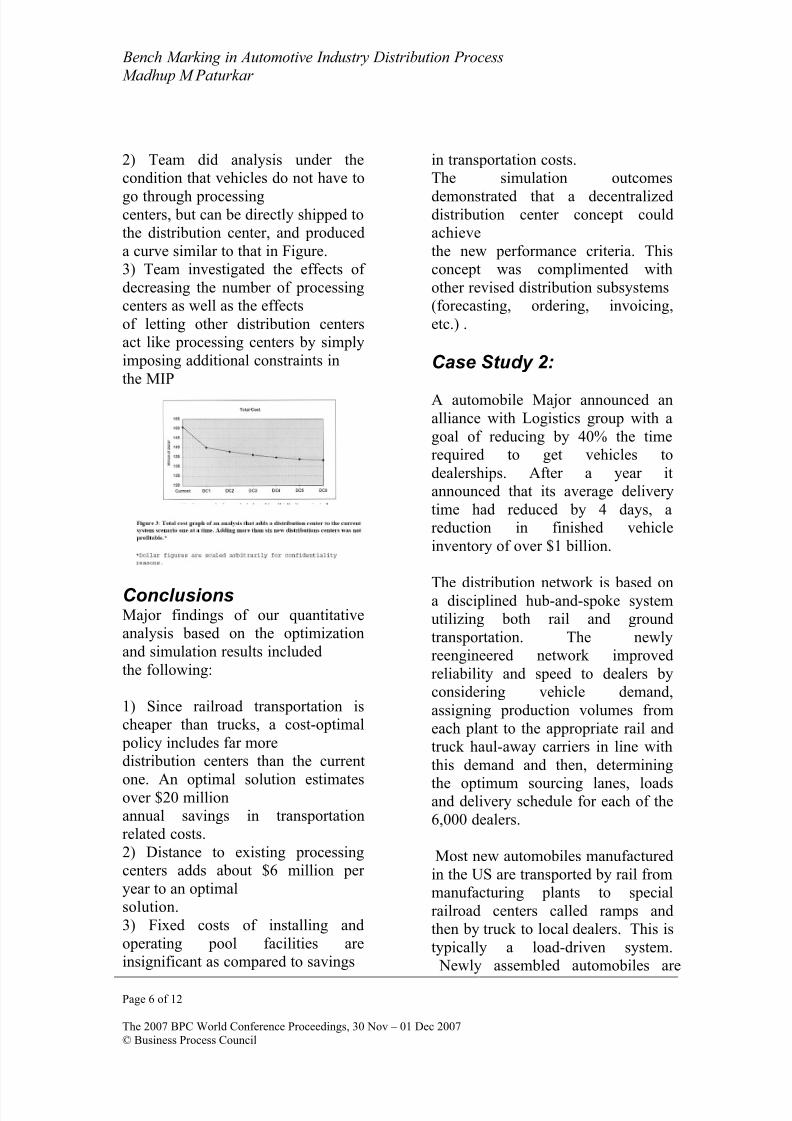
A US Automobile major ran a pilotstudy to examine the potential for special cross-docking centers (calledmixing centers) in the rail network.The pilot included 5 plants in theeastern US and 15 rail ramps in thewest and mid-west (see Figure 1).Prior to the pilot, each plantdispatched railcars to each ramp viathe loose car network. In an effort toreduce the 14 to 15-day averagedelivery time from the plants to thedealerships, Company introduced amixing center in Kansas City,Missouri and routed all vehicles fromthe 5 plants to the 15 ramps throughthis mixing center.
It is shown how the mixing center (aHub and Spoke) promised to reduce
the total inventory of vehicles at the 5 plants destined for the 15 rail rampsfrom over 500 to under 150 (35 at the
plants and about 105 at the mixingcenter). The real motivation for themixing center concept arose from theanticipated reduction in the averagedays required to deliver vehicles.
Team analyzes the potential of themixing center concept in terms of
faster transportation modes andreduced inventories.
Plant Operations
Mixing Center Operations
At the mixing center, automobiles areunloaded from arriving railcars intoload lanes according to their destination ramps. When sufficientvehicles accumulate for a given
destination ramp, they are loadedonto an empty railcar and sent on.Any remaining vehicles wait at themixing center.
Thus, a mixing center serves as aload-driven cross-dock. Like allcross-docks, it introduces additionalhandling of the product in order toreduce overall transportation costsand, more importantly in this case, itintroduces additional transportation
distance. Routing shipments througha mixing center can, nevertheless,reduce transportation time and cost intwo ways:
Faster Mode: Consolidatingshipments out of each plant destinedfor a number of ramps to a singlemixing center can generate sufficientvolume on the channel to warrantusing faster unit trains. Unit trains,
PlantRamp
Atlanta
LouisvilleDenver
Benicia
Portland
Orillia
Laurel
Mira Loma
El Mirage
Salt Lake
Omaha
Kansas CitySt.Louis
NorfolkBelen
Amarillo
Alliance
Oklahoma City
Houston
Reisor
8/8/2019 Paper Bench Marking in Automotive Industry Distribution Process
http://slidepdf.com/reader/full/paper-bench-marking-in-automotive-industry-distribution-process 8/12
Bench Marking in Automotive Industry Distribution ProcessMadhup M Paturkar
Page 8 of 12
The 2007 BPC World Conference Proceedings, 30 Nov – 01 Dec 2007© Business Process Council
consisting of 20 or more railcars witha common destination, move directly
from the plant to the destinationramp, bypassing the switching yards.A mixing center serving several
plants can consolidate shipments todestination ramps facilitating the useof unit trains on outbound shipmentsas well.
Reduced Wait: Because the dailysupply rates to some ramps are muchsmaller than the capacity of a railcar,automobiles destined for these rampsmay wait several days for a full loadto accumulate. Consolidatingshipments through a mixing center can eliminate these delays. Further,the number of vehicles waiting at the
plant influences both the averagedelivery time and the size of the lot atthe plant. Typically, automobilemanufacturing plants are surrounded
by suppliers’ facilities and, as aresult, land is scarce and expensive.Reducing the number of vehicleswaiting at the plant frees up valuableland for more productive uses.
Mixed Integer Program Model.
There are two basic sets of decisionsin designing a “load-driven” cross-docking network: the location
decisions, which deal with thenumber and positioning of cross-docks, and the routing decisions,which deal with how flow should berouted through the selected cross-docks. Our objective is to minimizethe average delay between the time avehicle is produced and the time itreaches its destination ramp.
The variables in our model are:
The number of vehicles movingdirectly from plant to ramp per unit
times the number of vehiclesmoving from plant to ramp viamixing center per unit time
Result
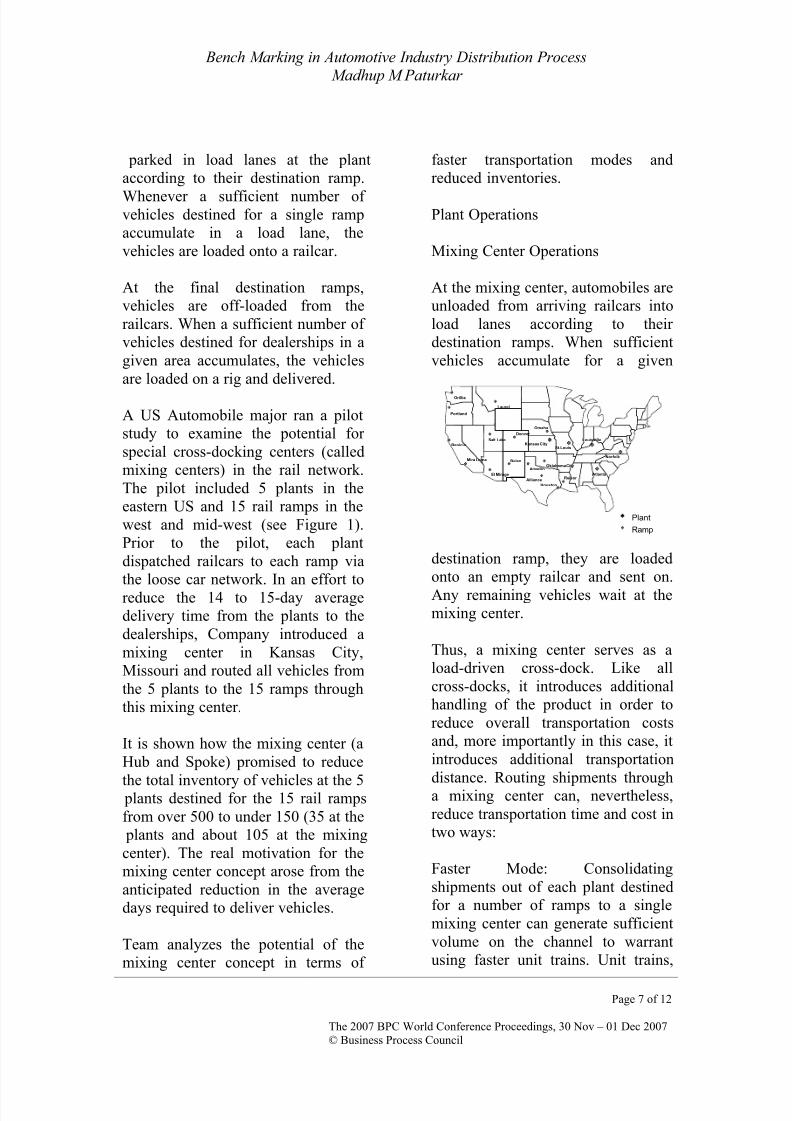
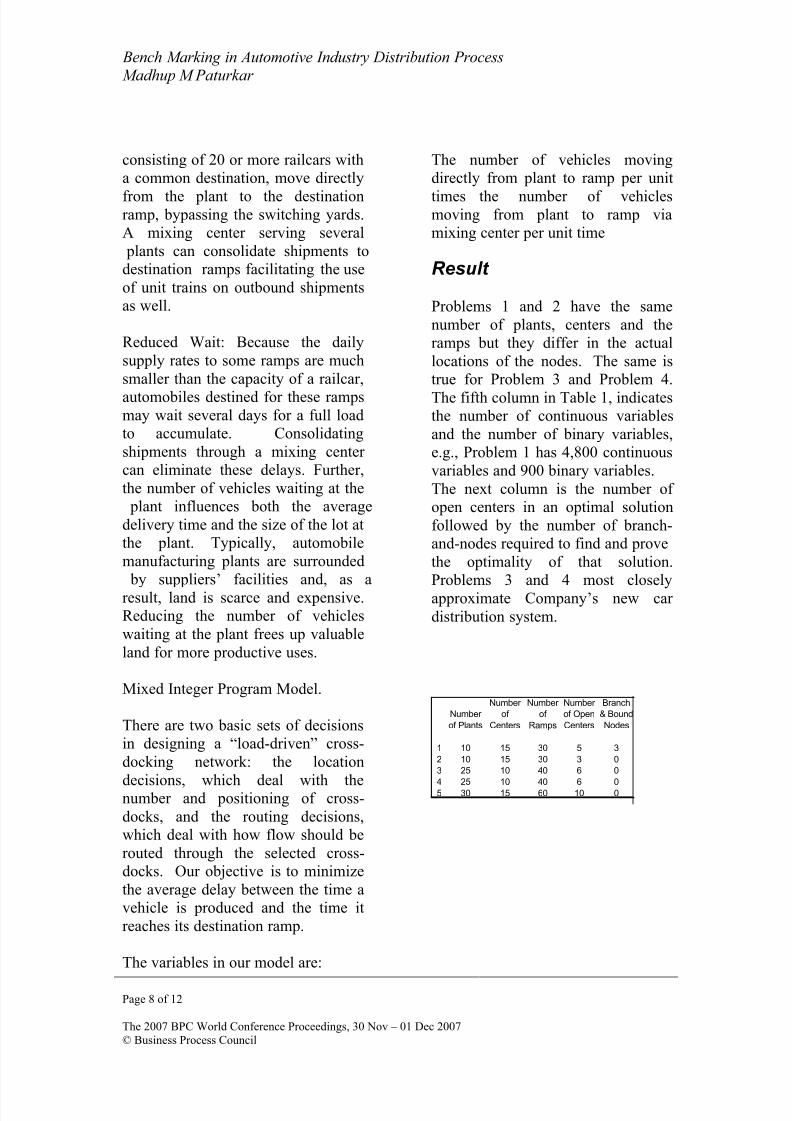
Problems 1 and 2 have the samenumber of plants, centers and theramps but they differ in the actuallocations of the nodes. The same istrue for Problem 3 and Problem 4.The fifth column in Table 1, indicatesthe number of continuous variablesand the number of binary variables,e.g., Problem 1 has 4,800 continuousvariables and 900 binary variables.The next column is the number of open centers in an optimal solutionfollowed by the number of branch-and-nodes required to find and provethe optimality of that solution.Problems 3 and 4 most closelyapproximate Company’s new car distribution system.
Number of Plants
Number of
Centers
Number of
Ramps
Number of OpenCenters
Branch& BoundNodes
1 10 15 30 5 32 10 15 30 3 03 25 10 40 6 0
4 25 10 40 6 05 30 15 60 10 0
8/8/2019 Paper Bench Marking in Automotive Industry Distribution Process
http://slidepdf.com/reader/full/paper-bench-marking-in-automotive-industry-distribution-process 9/12
Bench Marking in Automotive Industry Distribution ProcessMadhup M Paturkar
Page 9 of 12
The 2007 BPC World Conference Proceedings, 30 Nov – 01 Dec 2007© Business Process Council
Push-Pull DistributionStrategy for Luxury Car Maker
System Description:
The luxury car maker imports thevehicle in Asia and Africa region.The modus operandi is companyowned whole sale organization iscreated in each country whichinteracts with all dealer. This is
referred as Market PerformanceCenters (MPC)
Wholesale organization (MPC) isresponsible to procure vehicle fromfactory and sell to the dealer. Thisorganization is also responsible for maintaining inventory, generatingforecasts and quota allocation amongthe dealers.
Dealers may put the request to thisorganization to get exact vehicleconfiguration or may procure fromthe wholesale inventory.
The overall model runs smoothly buteach whole organization has differentdistribution strategy. In next fewsections we will try to:
1) Try to analyze the parametersspecific to Auto Distributionchain
2) Based on the parametersdefined we find out modelsfor each MPC
3) To get the best model amongthree operating models.
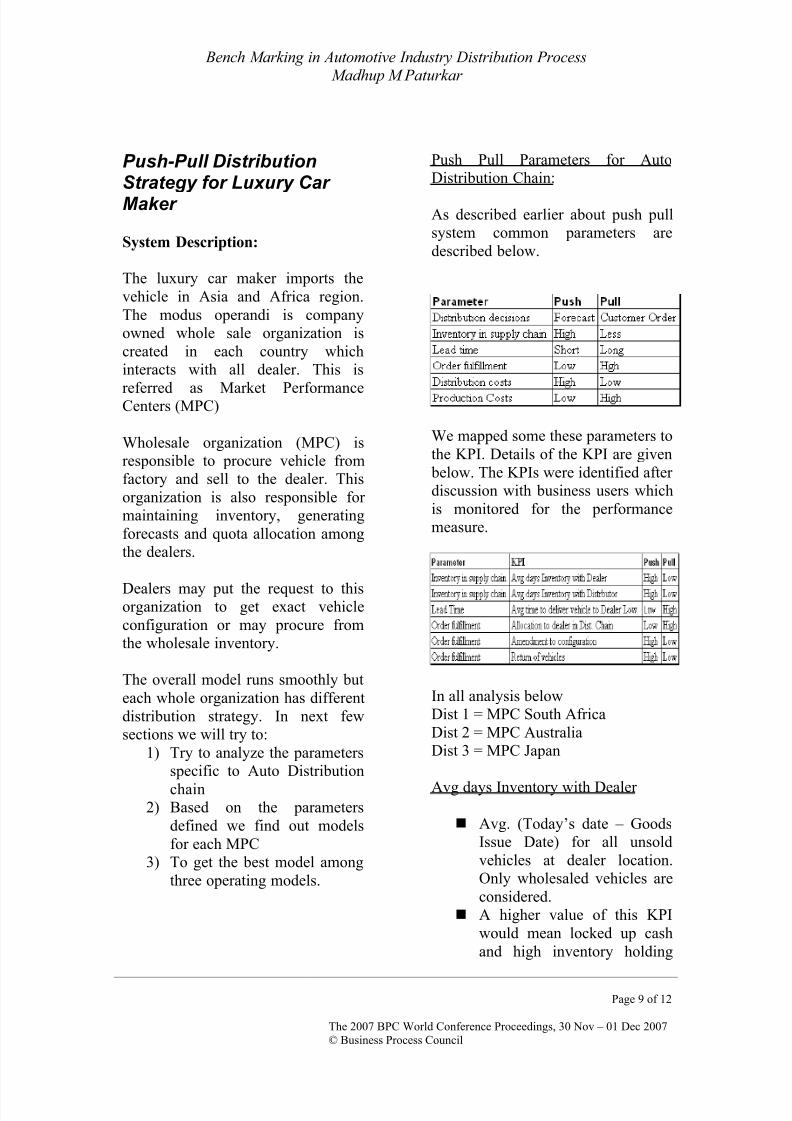
Push Pull Parameters for AutoDistribution Chain:
As described earlier about push pullsystem common parameters aredescribed below.
We mapped some these parameters tothe KPI. Details of the KPI are given
below. The KPIs were identified after discussion with business users whichis monitored for the performancemeasure.
In all analysis belowDist 1 = MPC South AfricaDist 2 = MPC AustraliaDist 3 = MPC Japan
Avg days Inventory with Dealer
Avg. (Today’s date – GoodsIssue Date) for all unsoldvehicles at dealer location.Only wholesaled vehicles areconsidered.
A higher value of this KPIwould mean locked up cashand high inventory holding
8/8/2019 Paper Bench Marking in Automotive Industry Distribution Process
http://slidepdf.com/reader/full/paper-bench-marking-in-automotive-industry-distribution-process 10/12
Bench Marking in Automotive Industry Distribution ProcessMadhup M Paturkar
Page 10 of 12
The 2007 BPC World Conference Proceedings, 30 Nov – 01 Dec 2007© Business Process Council
cost for the dealer affectinghis current cash flows.
KPI Usage: Identification of
inefficiencies in salesforecasting process of dealer leading to accumulation of stock at his end.
Explore possibility of rationalizing the product-mixfor the dealer based on hiscompetency in selling a
particular model For models which are
relatively lower on the product life cycle duration,target only those dealers whohave lower value on this KPI
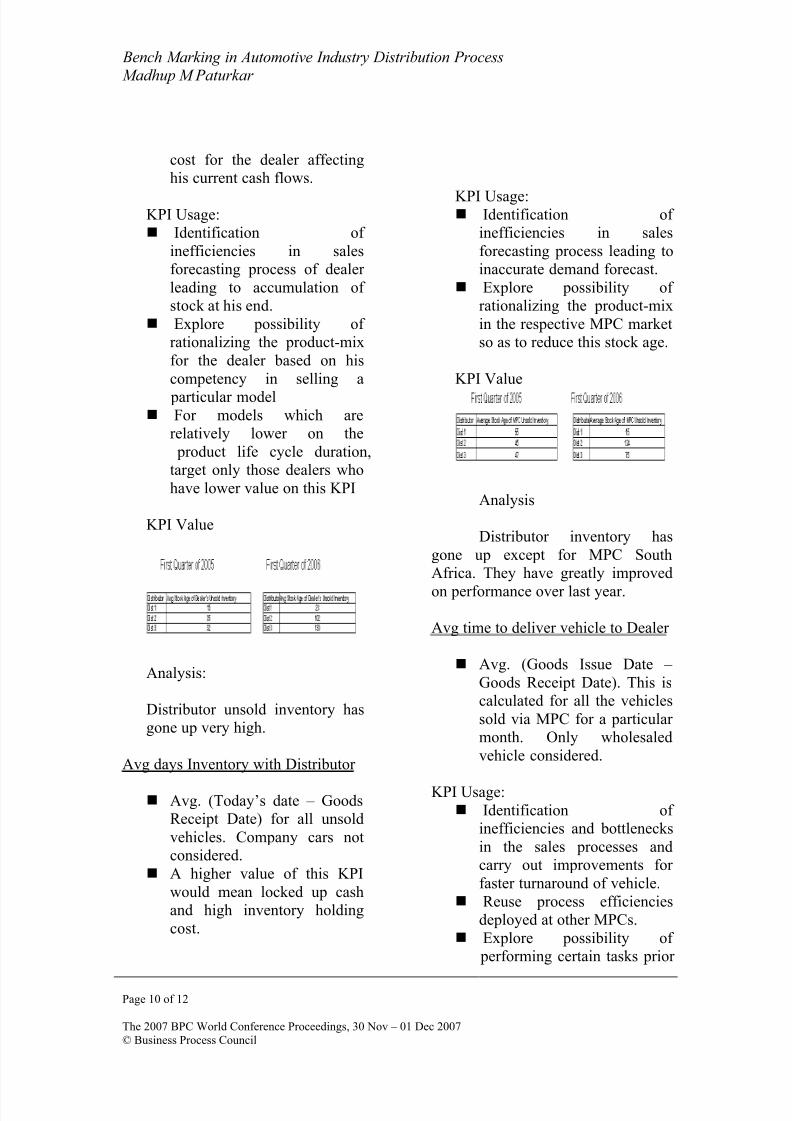
KPI Value
Analysis:
Distributor unsold inventory hasgone up very high.
Avg days Inventory with Distributor
Avg. (Today’s date – GoodsReceipt Date) for all unsoldvehicles. Company cars notconsidered.
A higher value of this KPIwould mean locked up cashand high inventory holdingcost.
KPI Usage: Identification of
inefficiencies in salesforecasting process leading toinaccurate demand forecast.
Explore possibility of rationalizing the product-mixin the respective MPC marketso as to reduce this stock age.
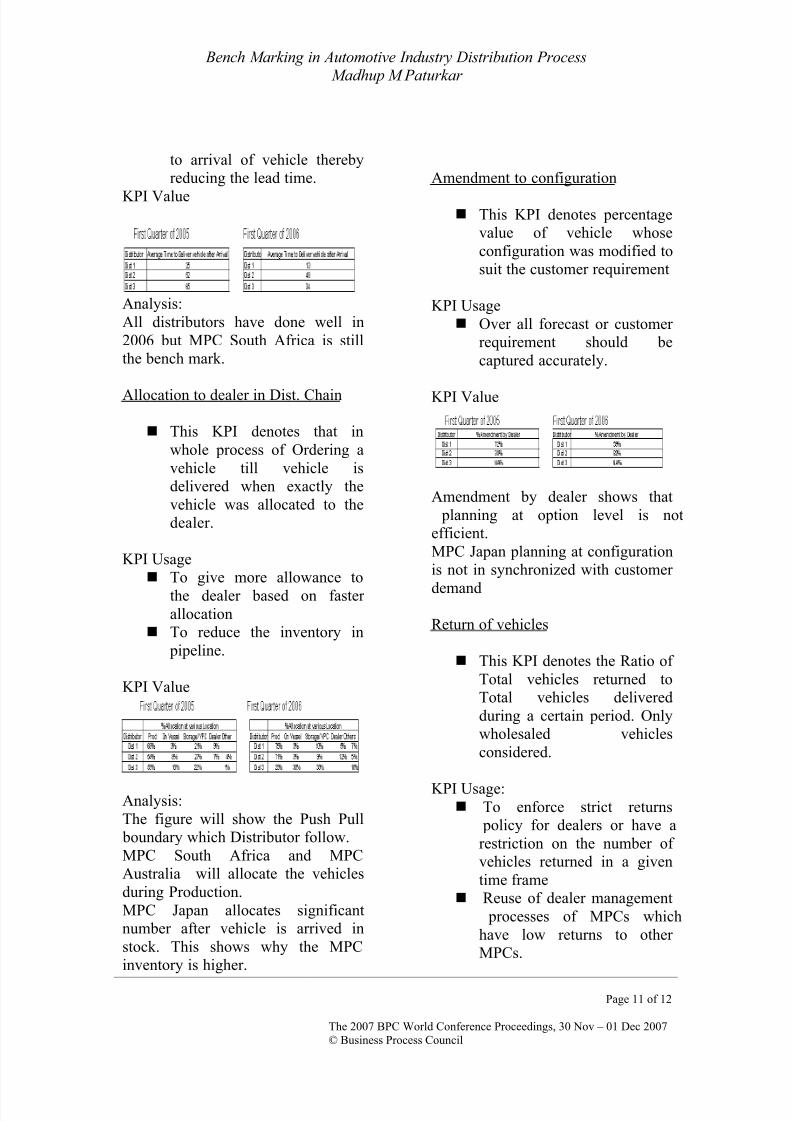
KPI Value
Analysis
Distributor inventory hasgone up except for MPC SouthAfrica. They have greatly improvedon performance over last year.
Avg time to deliver vehicle to Dealer
Avg. (Goods Issue Date – Goods Receipt Date). This iscalculated for all the vehiclessold via MPC for a particular month. Only wholesaledvehicle considered.
KPI Usage: Identification of
inefficiencies and bottlenecksin the sales processes andcarry out improvements for faster turnaround of vehicle.
Reuse process efficienciesdeployed at other MPCs.
Explore possibility of performing certain tasks prior
8/8/2019 Paper Bench Marking in Automotive Industry Distribution Process
http://slidepdf.com/reader/full/paper-bench-marking-in-automotive-industry-distribution-process 11/12

8/8/2019 Paper Bench Marking in Automotive Industry Distribution Process
http://slidepdf.com/reader/full/paper-bench-marking-in-automotive-industry-distribution-process 12/12
Bench Marking in Automotive Industry Distribution ProcessMadhup M Paturkar
Page 12 of 12
The 2007 BPC World Conference Proceedings, 30 Nov – 01 Dec 2007© Business Process Council
KPI Value
Analysis:Returns are less for MPC Australia
because of dealer strategy andamendment has gone up from dealer and hence fulfillment is better
Analysis:
Based on over all figures presentedabove following conclusion can bedrawn:
MPC South Africa is more closeto the Pull based
• Most of the orders are logged by Dealer
• Better on over all parameters• Distribution system is
governed by very high penalty clauses
MPC Japan follows Push-Pullsystem as
• Orders are put to factory byDistributor
•
Lot of local fitment is donein Country.• Pull with respect to vehicle
configuration• Push to dealer later in
distribution chain.
MPC Australia is push basedsystem
• Orders are logged bydistributor
• Percentage Modification bydealer is very high.
• Lead time and inventory indays is very high.
Conclusion:
Each major corporation followsdifferent strategy from distribution
point of view
Distribution chain analysis parameters differ from company tocompany but the goal is to make thedistribution system more responsiveto customer needs
The difference in distribution leadtime (in days) is evident with respectto geography and distributionstrategy adopted.
Common parameter can be identifiedwhich controls the distribution chain:To get the first choice of vehicle tothe customer as fast as possible.
About the author
Madhup M Paturkar has over 4.5 yr of industry and consulting experiencein different industry verticals.Currently he is associated with AutoMajor for last 2 years in ApplicationConsulting.
Author is certified Supply ChainConsultant and has post graduatediploma in Supply ChainManagement