paper chromatography and column ... - · pdf file-thin layer chromatography (tlc). 2....
TRANSCRIPT

1
PAPER CHROMATOGRAPHY
AND
COLUMN CHROMATOGRAPHY
1. Chromatography:
1.1 Introduction:
Chromatography (Greek: Khromatos-colour and graphos-writing), a relatively new separation
technique, was discovered by Dr.MichaelTswett (1906) in Warsaw.
He was successful in doing the separation of chlorophyll, xanthophylls and several other colored
substances by percolating vegetable extracts through a column of calcium carbonate. The calcium
carbonate column acted as an adsorbent and the different substances got adsorbed to different extent
and this gives rise to colored bands at different positions. Tswett termed this system of colored bands
as the chromatogram and the method as chromatography.
In 1855, Friedrich Runges obtained a colored chromatogram by impregnating a filter
paper with ferric sulphate, drying and adding a drop of potassium ferrocyanide
solution.
In 1865,Schoenbein observed that when a strip of filter paper was dipped into an
aqueous solution of salt, water raised up the filter paper by capillary action carrying
the salt with it.
Kuhn’s remarkable work of separating carotene and resolving it into α and β isomers
caused an awakening of the importance of adsorption in analytical field.
In 1941, Martin and Synge who introduced partition column chromatography.
In 1952, Martin and James were awarded Nobel Prize for developing gas
chromatography.
1.2 Definition:
Chromatography may be defined as a method of separating a mixture of components into individual
components through equilibrium distribution between two phases, based on the differences in the
rate at which the components of a mixture move through a porous medium under the influence of
some solvent or gas.
1.3 Classification of Chromatographic methods:
In all the chromatographic techniques, difference in affinity involves the process of either adsorption
or partition. In adsorption, the binding of a compound, to the surface of solid phase takes place where
as in partition the relative solubility of a compound in two phase’s results, in the partition of a
compound between two phases.
Mayri (1st M.Pharm, Pharmaceutical analysis, NRI College of pharmacy, A.P, India)
2
Chromatography
1. Adsorption chromatography competition between solid and
Gas: gas- solid Chromatography (GSC).
Liquid: LiquidChromatography (LLC).
-Adsorption column Chromatography (ACC).
-Thin layer Chromatography (TLC).
2. Partition chromatography competition between liquid and
Gas: gas-liquid Chromatography (GLC).
Liquid: Liquid-liquid Chromatography (LLC).
-PartitioncolumnChromatography
-Paper Chromatography (PC).
-Thin layer Chromatography (TLC).
-Reversed phase partition Chromatography (RPC).
1.4 TECHNIQUES:
1. Paper chromatography: It is a technique in which mixtures of substances are separated by
means of partition between a moving solvent and a stationary liquid which is held on a suitable solid
support.
2. Adsorption chromatography: It is a technique in which small differences in the adsorption
behavior of substances between a moving solvent (liquid or gas) and a stationary solid phase are
utilized to achieve the separation.
3. Ion exchange chromatography: This method is based upon differences in the exchange
potential between various ions exchange resin packed in a column.
In cation exchange, cations with high valency are strongly retained while monovalent ions are easily
removed.In anion exchange methods, anions with a high charge are strongly retained in relation to
ones having a low charge.
4. Exclusion chromatography: The technique is based fundamentally upon exploitation of the
size or molecular geometry of the components.
5. Electro chromatography: In electro chromatographic methods columns or plates are used.
Separation based on the difference in mobility of different ions when an external DC potential is
applied.
3
2. PAPER CHROMATOGRAPHY
2.1 Introduction:
The principle involved is partition chromatography where in the substances are distributed or
partitioned between to liquid phases. One phase is the water which is held in pores of filter paper
used and other phase is that of mobile phase which moves over the paper. The compounds in the
mixture get separated due to differences in their affinity towards water(in stationary phase) and
mobile phase solvents during the movement of mobile phase under the capillary action of pores in
the paper.
Principle of Paper chromatography:
The principle can also be adsorption chromatography between solid and liquid phases, where
in the stationary phase is the solid surface of paper and the liquid phase is of mobile phase. But most
of the applications of paper chromatography work on the principle of partition chromatography i.e.
partitioned between to liquid phases.
Types of principle of Paper chromatography:
1. Paper partition chromatography: In PPC technique, the substances in a mixture move in two
non mixing solvents and create partition between them.
2. Paper adsorption chromatography: In PAC the filter paper is impregnated with adsorbent such
as alumina or silica and a single solvent is allowed to flow over the unknown components.Some of
the components may be adsorbed more strongly than the others facilitating separation of the
components.
2.2 Theory of Paper chromatography:
In paper chromatography two types of forces operate when a drop of solution is applied on the filter
paper and treated with a solvent.
Propelling force: it tries to drag the substance in the direction of the flow of solvent. This
depends upon;
1. The rate of the solvent flow and
2. The solubility of the substances in the solvent.
Retarding force (Rf): retarding force tries to drag the substance behind towards its point of
application. This retardation depends on the adsorption and partition.
Retardation factor, Rf value: it is expressed in terms of retention volume (VR) or retention time
(tR). The relative rate of the movement of solvent and solute is expressed by a term Rf value. It is
defined as the ratio of the distance travelled by the compound at its point of max concentration to the
distance travelled by the solvent. Rf value has no units.
4
Distance traveled by component from application point
Rf = ------------------------------------------------------------------
Distance traveled by solvent from application point
Rx value: is the ratio of the distance travelled by the substance to the distance travelled by a
chemically similar standard substance.
2.3 TYPES OF PAPER CHROMATOGRAPHY:
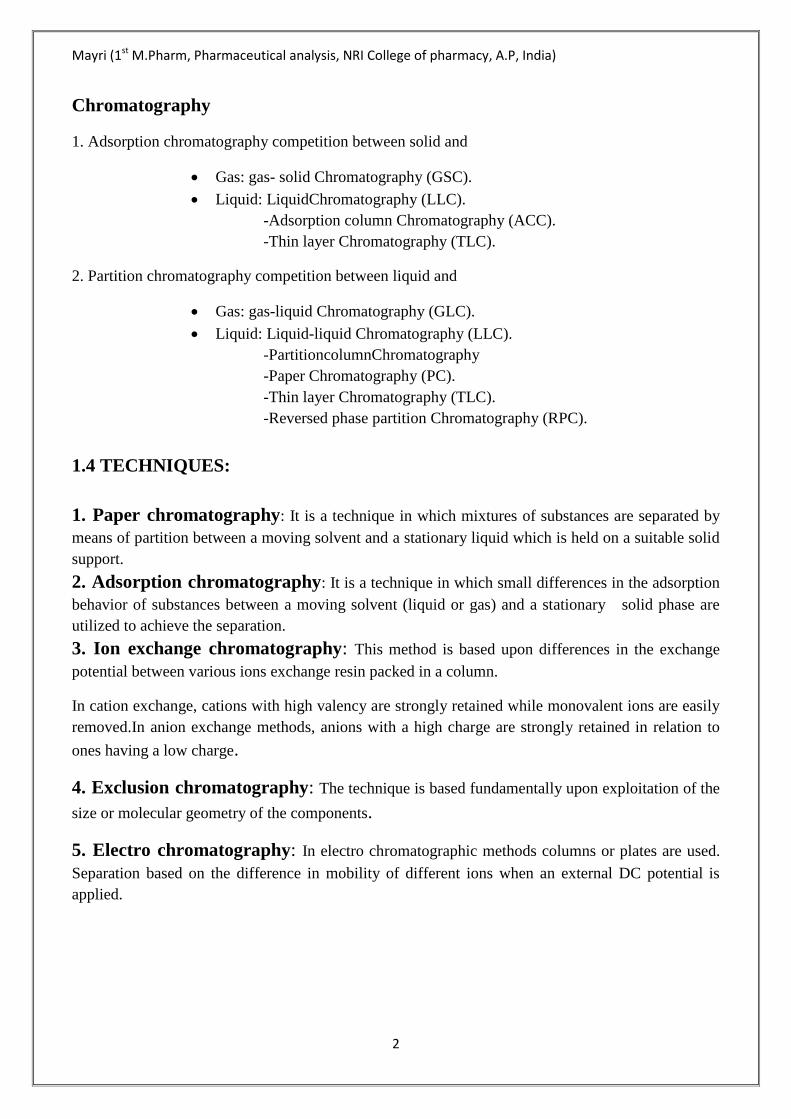
A) Descending paper chromatography:
When the development of the paper is done by allowing the solvent to travel down the paper, it is
known as descending technique. The apparatus consists of well sealed glass tank of suitable size and
shape which is provided with a trough for the mobile phase in the upper portion. The paper with the
same sample spotted is inserted with the upper end in the trough containing the mobile phase, the jar
itself having been equilibrated with the mobile phase prior to elution.
The advantage of descending technique is the development can be continued indefinitely even
though the solvent runs off at the other end of the paper.
Fig1: Descending paper chromatography
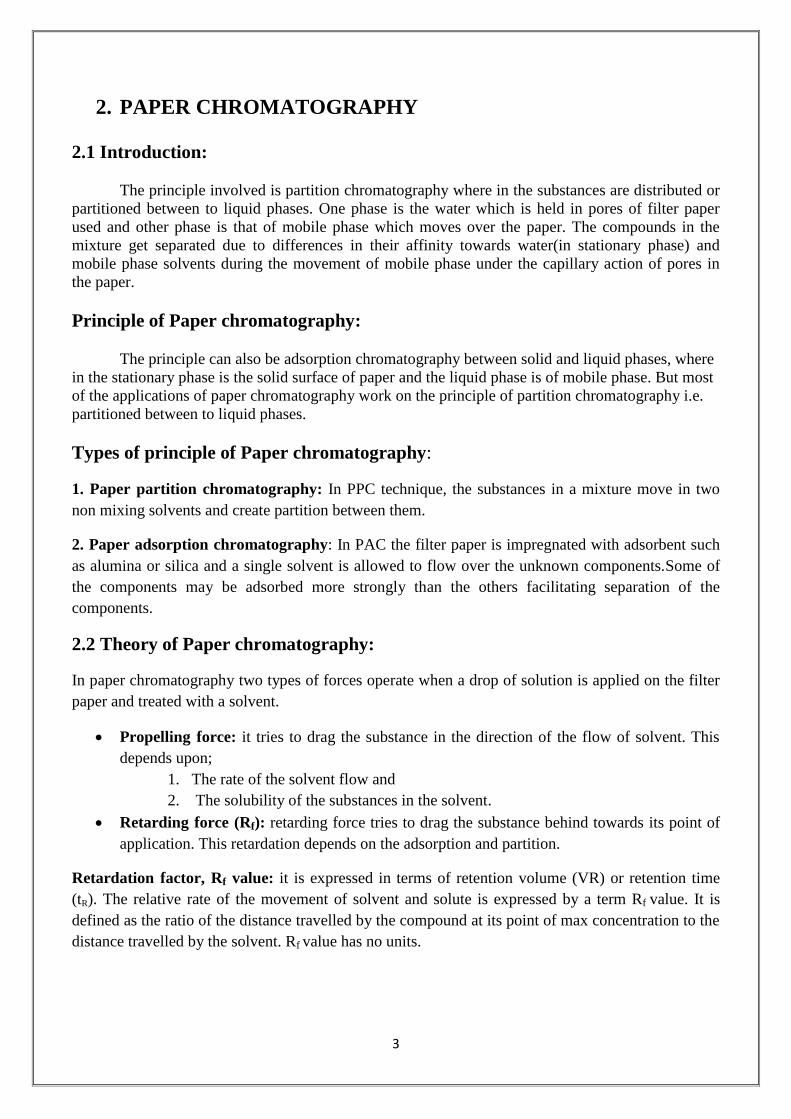
B) Ascending paper chromatography:
When the development of the paper is done by allowing the solvent to travel up the paper it is known
as ascending technique. The mobile phase is placed in a suitable container at the bottom of the
chamber. The sample is applied a few centimeters from the bottom edge of the paper suspended from
a hook.Alternatively the paper may be rolled into a cylinder, held together by staple, string or plastic
clips.
5
Fig2: Ascending paper chromatography
C) Ascending-Descending chromatography:
It is the hybrid of the above two techniques. The upper part of the ascending chromatography can be
folded over a glass rod allowing the ascending development to change over into the descending after
crossing the glass rod.
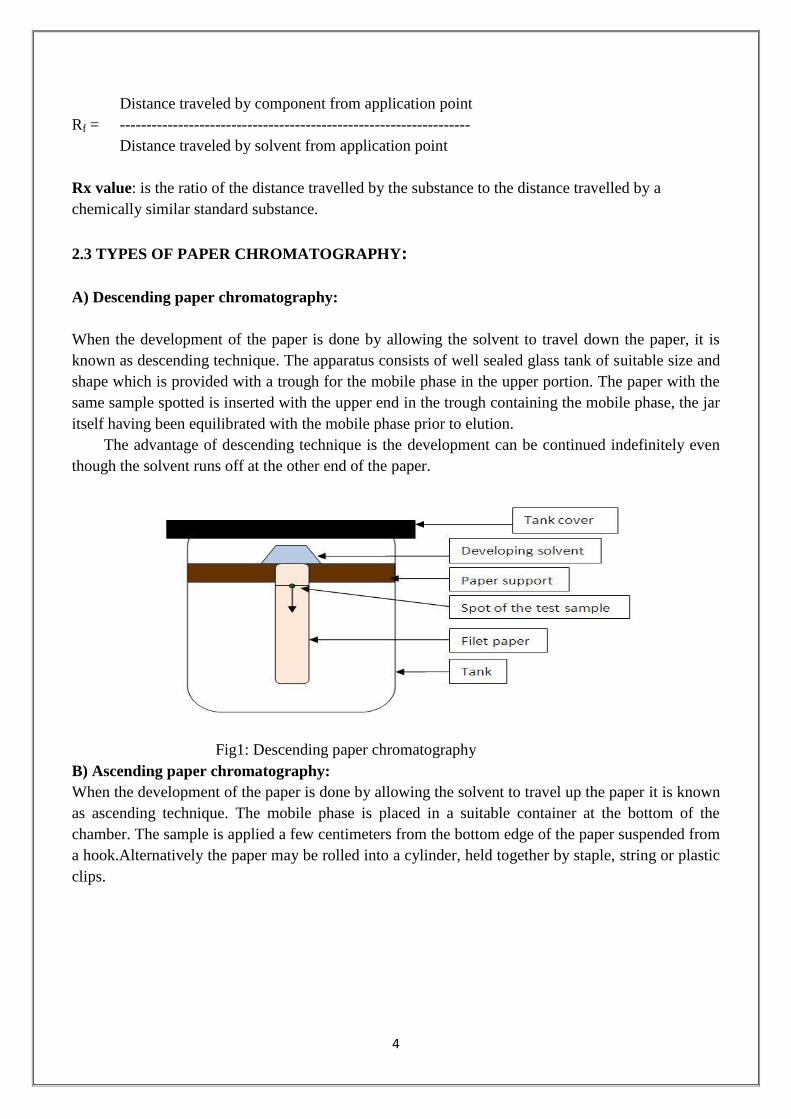
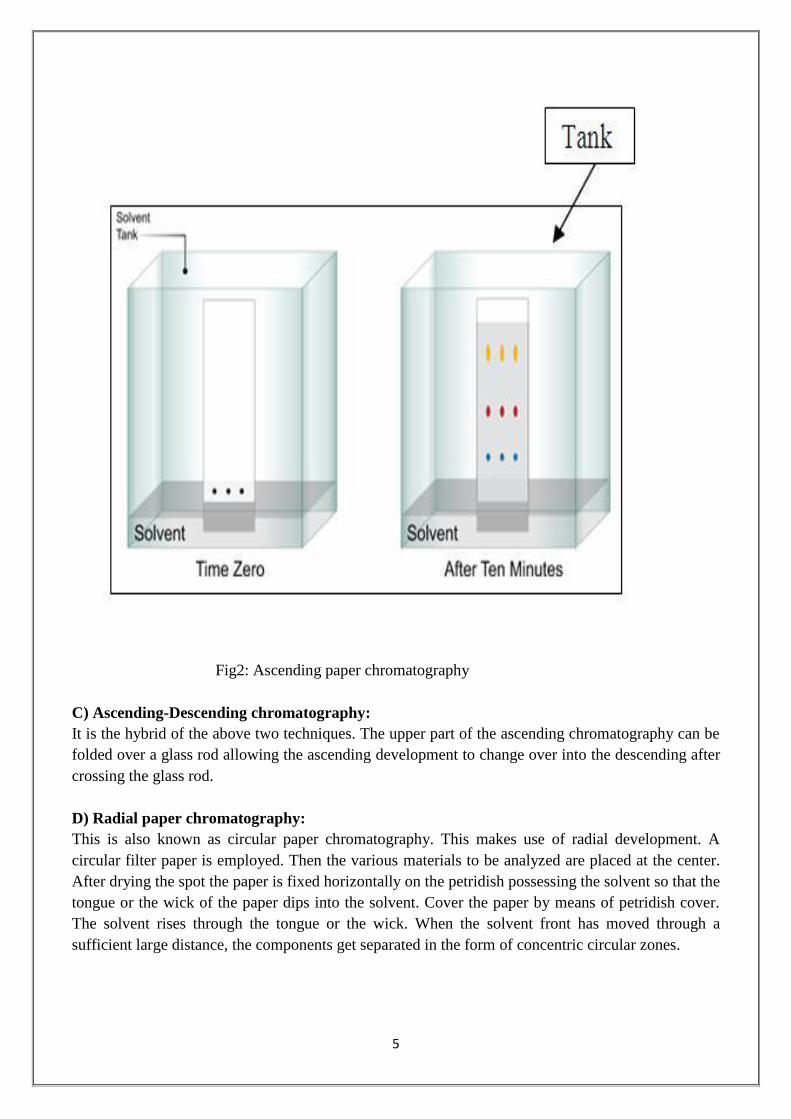
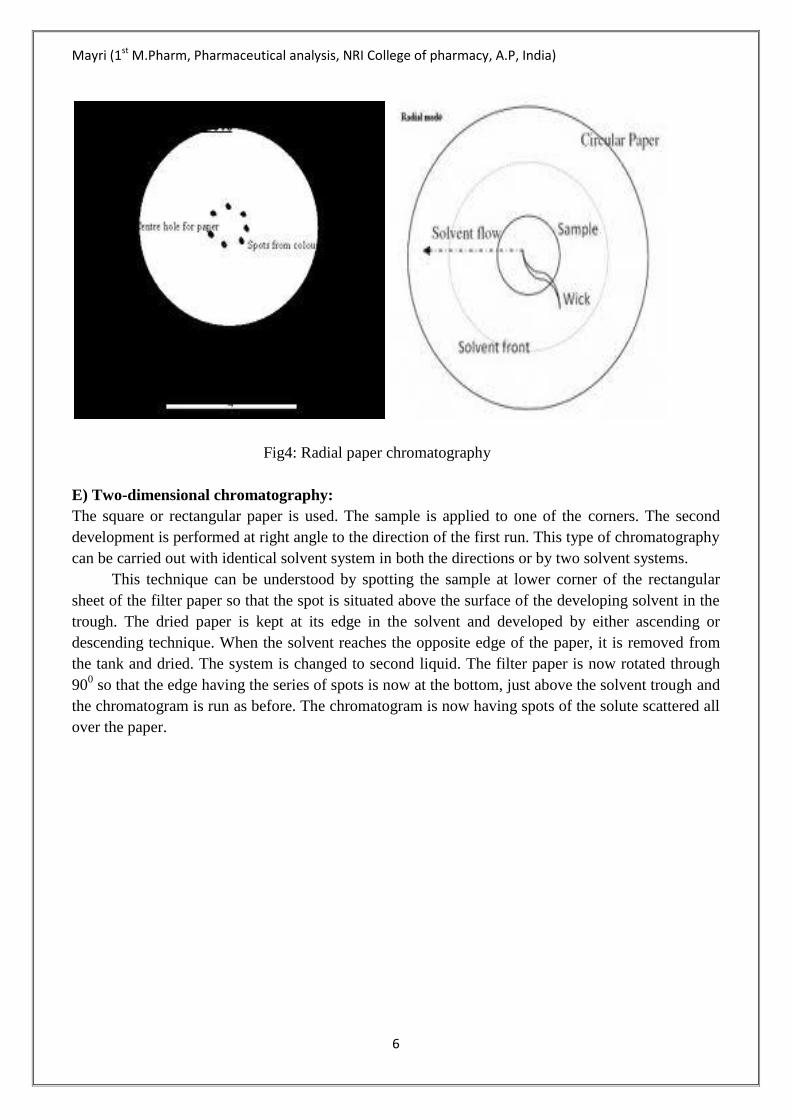
D) Radial paper chromatography:
This is also known as circular paper chromatography. This makes use of radial development. A
circular filter paper is employed. Then the various materials to be analyzed are placed at the center.
After drying the spot the paper is fixed horizontally on the petridish possessing the solvent so that the
tongue or the wick of the paper dips into the solvent. Cover the paper by means of petridish cover.
The solvent rises through the tongue or the wick. When the solvent front has moved through a
sufficient large distance, the components get separated in the form of concentric circular zones.
Mayri (1st M.Pharm, Pharmaceutical analysis, NRI College of pharmacy, A.P, India)
6
Fig4: Radial paper chromatography
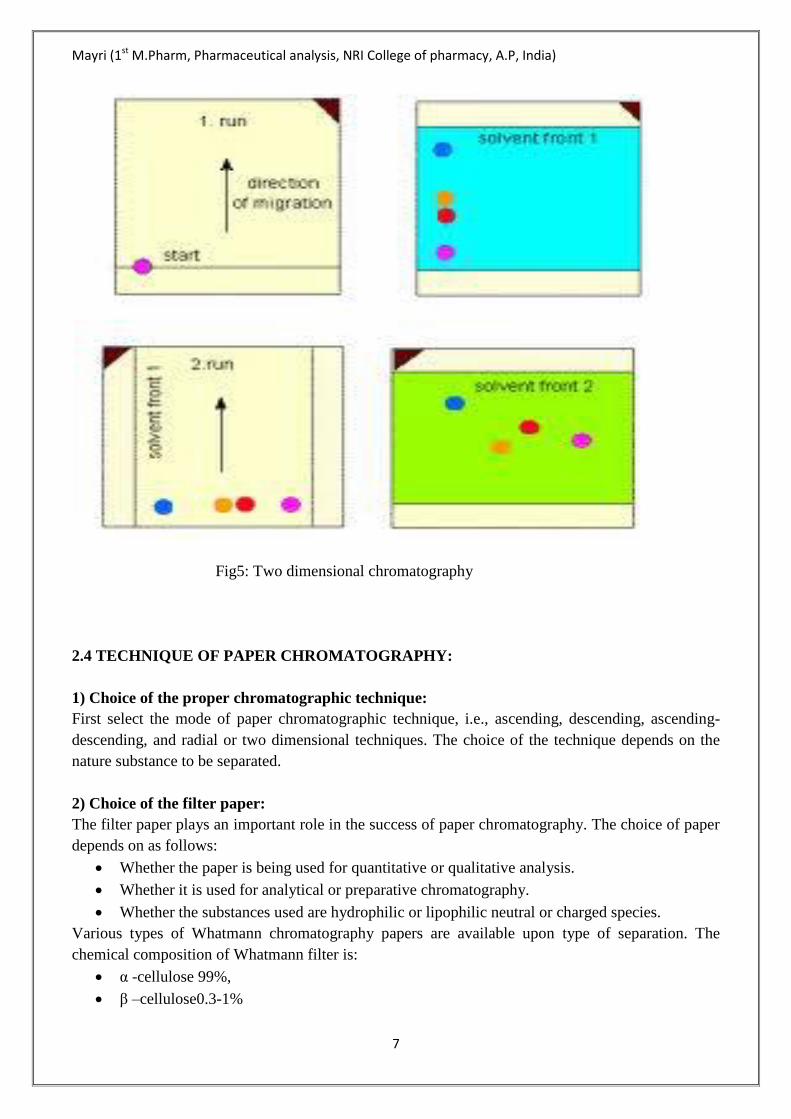
E) Two-dimensional chromatography:
The square or rectangular paper is used. The sample is applied to one of the corners. The second
development is performed at right angle to the direction of the first run. This type of chromatography
can be carried out with identical solvent system in both the directions or by two solvent systems.
This technique can be understood by spotting the sample at lower corner of the rectangular
sheet of the filter paper so that the spot is situated above the surface of the developing solvent in the
trough. The dried paper is kept at its edge in the solvent and developed by either ascending or
descending technique. When the solvent reaches the opposite edge of the paper, it is removed from
the tank and dried. The system is changed to second liquid. The filter paper is now rotated through
900 so that the edge having the series of spots is now at the bottom, just above the solvent trough and
the chromatogram is run as before. The chromatogram is now having spots of the solute scattered all
over the paper.
Mayri (1st M.Pharm, Pharmaceutical analysis, NRI College of pharmacy, A.P, India)
7
Fig5: Two dimensional chromatography
2.4 TECHNIQUE OF PAPER CHROMATOGRAPHY:
1) Choice of the proper chromatographic technique:
First select the mode of paper chromatographic technique, i.e., ascending, descending, ascending-
descending, and radial or two dimensional techniques. The choice of the technique depends on the
nature substance to be separated.
2) Choice of the filter paper:
The filter paper plays an important role in the success of paper chromatography. The choice of paper
depends on as follows:
Whether the paper is being used for quantitative or qualitative analysis.
Whether it is used for analytical or preparative chromatography.
Whether the substances used are hydrophilic or lipophilic neutral or charged species.
Various types of Whatmann chromatography papers are available upon type of separation. The
chemical composition of Whatmann filter is:
α -cellulose 99%,
β –cellulose0.3-1%
Mayri (1st M.Pharm, Pharmaceutical analysis, NRI College of pharmacy, A.P, India)
8
Pentosans 0.5-0.8%
Ash 0.07-0.08%
Ether soluble substances 0.01-0.1%
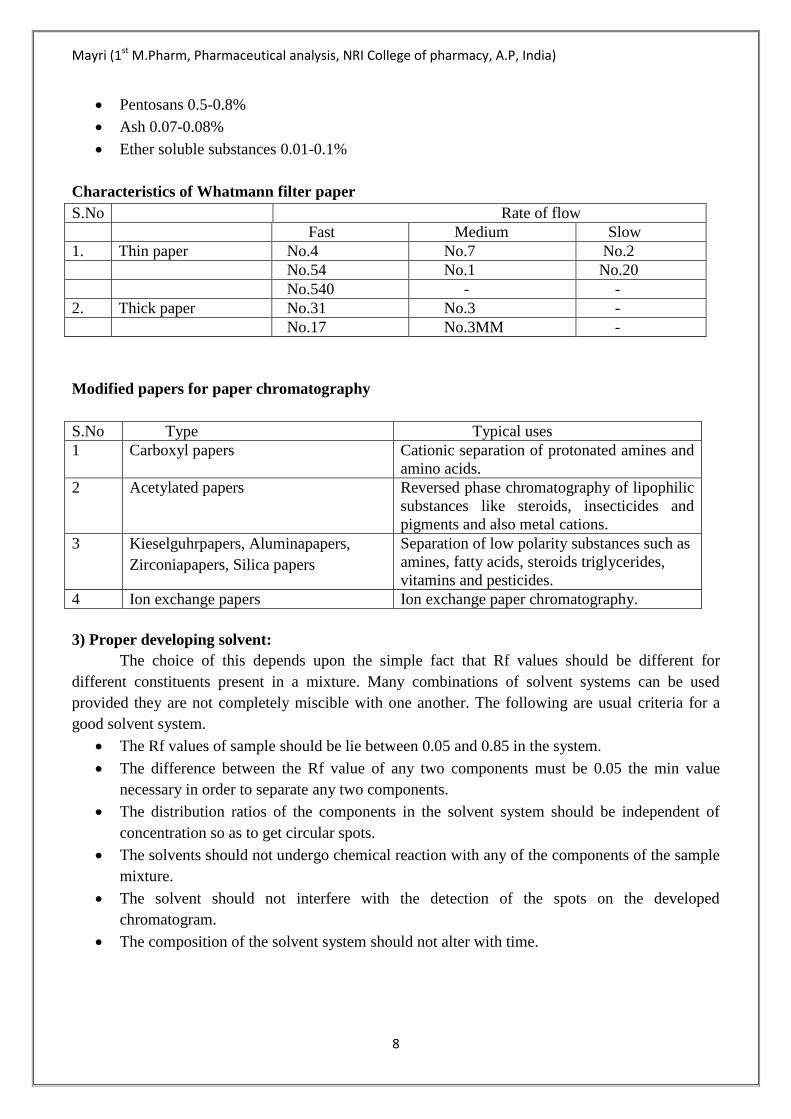
Characteristics of Whatmann filter paper
S.No Rate of flow
Fast Medium Slow
1. Thin paper No.4 No.7 No.2
No.54 No.1 No.20
No.540 - -
2. Thick paper No.31 No.3 -
No.17 No.3MM -
Modified papers for paper chromatography
S.No Type Typical uses
1 Carboxyl papers Cationic separation of protonated amines and
amino acids.
2 Acetylated papers Reversed phase chromatography of lipophilic
substances like steroids, insecticides and
pigments and also metal cations.
3 Kieselguhrpapers, Aluminapapers,
Zirconiapapers, Silica papers
Separation of low polarity substances such as
amines, fatty acids, steroids triglycerides,
vitamins and pesticides.
4 Ion exchange papers Ion exchange paper chromatography.
3) Proper developing solvent:
The choice of this depends upon the simple fact that Rf values should be different for
different constituents present in a mixture. Many combinations of solvent systems can be used
provided they are not completely miscible with one another. The following are usual criteria for a
good solvent system.
The Rf values of sample should be lie between 0.05 and 0.85 in the system.
The difference between the Rf value of any two components must be 0.05 the min value
necessary in order to separate any two components.
The distribution ratios of the components in the solvent system should be independent of
concentration so as to get circular spots.
The solvents should not undergo chemical reaction with any of the components of the sample
mixture.
The solvent should not interfere with the detection of the spots on the developed
chromatogram.
The composition of the solvent system should not alter with time.
Mayri (1st M.Pharm, Pharmaceutical analysis, NRI College of pharmacy, A.P, India)
9
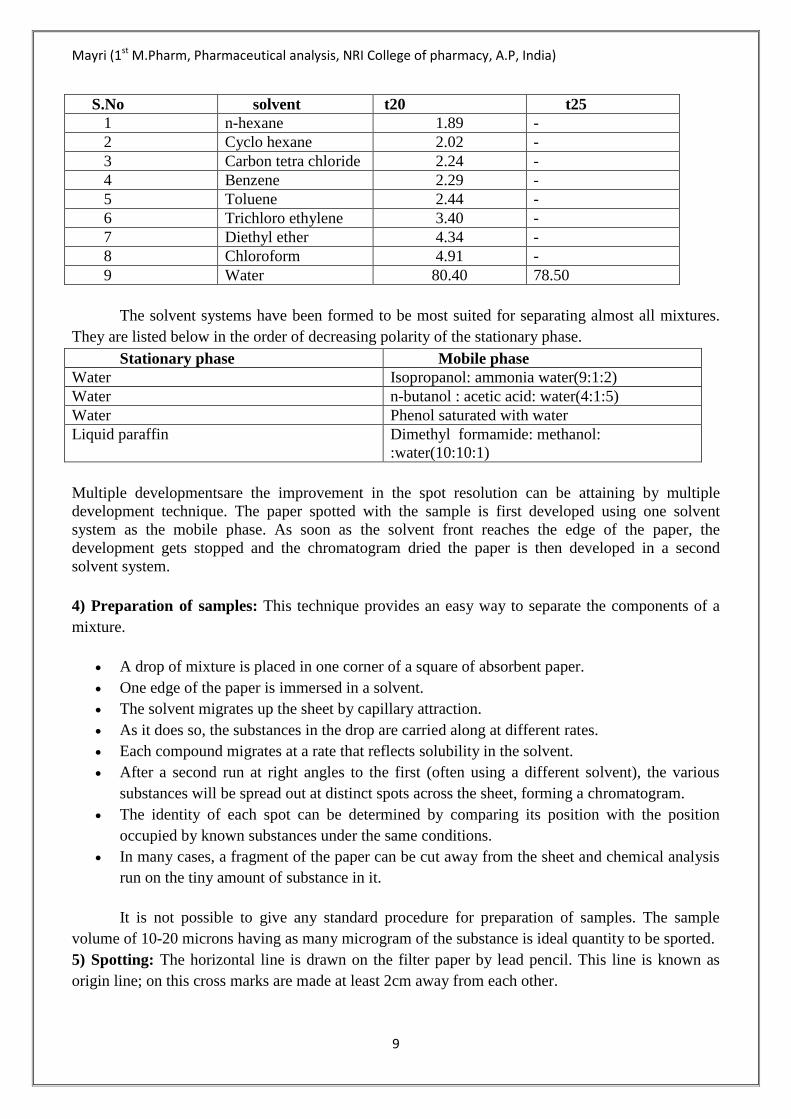
S.No solvent t20 t25
1 n-hexane 1.89 -
2 Cyclo hexane 2.02 -
3 Carbon tetra chloride 2.24 -
4 Benzene 2.29 -
5 Toluene 2.44 -
6 Trichloro ethylene 3.40 -
7 Diethyl ether 4.34 -
8 Chloroform 4.91 -
9 Water 80.40 78.50
The solvent systems have been formed to be most suited for separating almost all mixtures.
They are listed below in the order of decreasing polarity of the stationary phase.
Stationary phase Mobile phase
Water Isopropanol: ammonia water(9:1:2)
Water n-butanol : acetic acid: water(4:1:5)
Water Phenol saturated with water
Liquid paraffin Dimethyl formamide: methanol:
:water(10:10:1)
Multiple developmentsare the improvement in the spot resolution can be attaining by multiple
development technique. The paper spotted with the sample is first developed using one solvent
system as the mobile phase. As soon as the solvent front reaches the edge of the paper, the
development gets stopped and the chromatogram dried the paper is then developed in a second
solvent system.
4) Preparation of samples: This technique provides an easy way to separate the components of a
mixture.
A drop of mixture is placed in one corner of a square of absorbent paper.
One edge of the paper is immersed in a solvent.
The solvent migrates up the sheet by capillary attraction.
As it does so, the substances in the drop are carried along at different rates.
Each compound migrates at a rate that reflects solubility in the solvent.
After a second run at right angles to the first (often using a different solvent), the various
substances will be spread out at distinct spots across the sheet, forming a chromatogram.
The identity of each spot can be determined by comparing its position with the position
occupied by known substances under the same conditions.
In many cases, a fragment of the paper can be cut away from the sheet and chemical analysis
run on the tiny amount of substance in it.
It is not possible to give any standard procedure for preparation of samples. The sample
volume of 10-20 microns having as many microgram of the substance is ideal quantity to be sported.
5) Spotting: The horizontal line is drawn on the filter paper by lead pencil. This line is known as
origin line; on this cross marks are made at least 2cm away from each other.
Mayri (1st M.Pharm, Pharmaceutical analysis, NRI College of pharmacy, A.P, India)
10
6) Drying the chromatogram: The wet chromatograms after development are dried in special
drying cabinets which are being heated electrically with temperature controls.
7) Detection:
In detection two methods are available:
a) Non specific methods.
b) Specific methods.
a) Non specific methods:
Iodine chamber: In a beaker between two cotton beds iodine bolls are taken, the chamber is
filled with iodine vapors then chromatogram is placed in it after some time we can observe brown
spots.
U.V chamber: Fluorescent compounds are observed light if short wavelength and emitted
light is characteristic of the compound and imparts a color to it.
b) Specific methods: Some re agents are specific for some specific compounds.
Ninhydrin reagent for amino acids.
Dragendroff’s reagent for alkaloids.
Ferric chloride for phenols.
3, 5dinitro benzoic acid for cardiac glycosides.
2, 4dinitro phenyl hydrazine for aldehydes and ketones.
The detection methods can also be classified into two types:
a) Destructive methods
Eg:
Ninhydrin reagent for amino acids.
Dragendroff’s reagent for alkaloids.
Ferric chloride for phenols.
3, 5dinitro benzoic acid for cardiac glycosides.
2, 4dinitro phenyl hydrazine for aldehydes and ketones.
b) Non Destructive methods
Eg:
Iodine chamber: In a beaker between two cotton beds iodine bolls are taken, the
chamber is filled with iodine vapours then chromatogram is placed in it after some
time we can observe brown spots.
U.V chamber: Fluorescent compounds are observed light if short wavelength and
emitted light is characteristic of the compound and imparts a color to it.
Mayri (1st M.Pharm, Pharmaceutical analysis, NRI College of pharmacy, A.P, India)
11
2.5 APPLICATIONS:
Uses and applications of paper chromatography
1. Paper chromatography is specially used for separation of mixture having polar and non polar
compounds.
2. for separation of antibiotics, alkaloids, glycosides, amino acids.
3. It is used to determine organic compounds, biochemicals in urine etc.
4. In Pharma sector for determination of hormones, drugs.
5. Sometimes used for evaluation of inorganic compounds like salts and complexes.
6. Useful for the identification of impurities and foreign substances in drugs and plant extracts.
7. Identification of Inks by Paper Chromatography:
A. This lab will be done as collaboration between both lab pairs at a bench. One lab pair
will use 2 parts isopropanol to 1 part water as a solvent (labeled 2:1 IPA).One lab pair
will use 1 part isopropanol to 2 parts water as a solvent (labeled 1:2 IPA).
B. Obtain a strip of chromatography paper about 2.5 cm wide by 10 cm tall.Along one of
the shorter sides, draw a horizontal line in pencil about1.5 cm from the edge of the
strip. This will be your “baseline”, theStarting line where the samples will be spotted.
Graphite will not be carried up the chromatography paper. This baseline will be used
later inthe calculations of Rf values.
C. Using the black felt tip pens, apply generous dots of ink on the baseline
According to the diagram in the technique section.
D. With a pencil, label each dot with the identity of the pen from which the ink came.
E. Obtain a paper strip from your instructor that is marked with one of the threepens.
This is the unknown ink sample that you must identify.
F. Once your two strips are prepared, set up a developing chamber using a 400 ml
beaker.Pour some of the developing solvent in the beaker, using only enough
solventto cover the bottom of the beaker (about 5-10 ml).Remember, one lab pair will
use 1:2 IPA and the other lab pair will use 2:1IPA.
G. Place the paper strips into the developing chamber so that the edge near the inkspots
is submerged in the solvent. The ink spot must be above the solvent level. You should
avoid allowing the paper strips to touch eachother or the sides of the beaker. (Taping
the top of the strips to the outside of thebeaker may be helpful.) Once you have
inserted the paper, cover the chamberwith a watchglass and make sure the solvent is
progressing up the paper.
H. When the solvent has risen almost to the top of the paper strip, remove the stripfrom
the chamber and immediately mark the level to which the solvent has risenand circle
each spot present on the strip with a pencil. (The solvent front and thespots will
continue to move for several minutes after removing the strip from the
Beaker).Measure the distance each spot traveled and calculate Rf values for each
spot.Use the circles you drew around each spot with your pencil and not the actual
spot
J. Turn your chromatogram in as part of your report.
Mayri (1st M.Pharm, Pharmaceutical analysis, NRI College of pharmacy, A.P, India)
12
8. Separation of Food Colorings
A. Remove the piston and insert the long end of the C18 cartridge snugly
Into the syringe tip.
B. Add 5 m of IPA, insert the piston, and slowly flush at a flow rate notexceeding 5-10
ml per minute. It is important to not flush liquid throughthe cartridge more rapidly
than 10 ml per minute. Repeat this step with another 5 ml portion of IPA.
C. Flush with two 5 ml portions of distilled water.
D. Add about 1 ml of the food coloring mixture to the syringe, insert thepiston, and push
the mixture onto the cartridge. As you push the samplethrough the cartridge,
immediately begin collecting the drops in a test tube. The first color comes off
quickly. Once the 1ml of food coloring mixture is pushed onto thecartridge, add water
to the syringe and push it through the cartridgeuntil all the yellow is gone. Collect the
yellow liquid. The processof pushing solvent(s) through a cartridge is called elution.
In thiscase, water elutes the yellow color. The remaining colors in the mixture must be
removed by elutingwith a water/IPA mixture. Prepare a 1% IPA solution by placing
5mL of water into the syringe and adding 1 drop of IPA. Mix well byshaking the
syringe. Push this solution through the cartridge andcollect all the colors that come
off. If coloring still remains on thecartridge, prepare a 2% IPA solution by adding 2
drops of IPA to 5ml of water, mix, and elute this solution through the
cartridge.Continue to increase the percentage of IPA (3% - 3 drops IPA + 5ml water,
4% - 4 drops IPA + 5 ml water, etc.) until all or most ofthe coloring has been removed
from the cartridge. A 5% IPA solution may be the most concentrated solution needed
to removeall of the colors from the cartridge.Any coloring residue remaining on the
cartridge should be removedusing a 1:1 IPA: water mixture. This residue may need to
becollected.Save the separated colored solutions for the next part.
E. See what would happen if several of the separated colored solutions weremixed. Try
to make a green solution from the colors you separated.
F. Make sure the cartridge is clean before returning it.
An Example
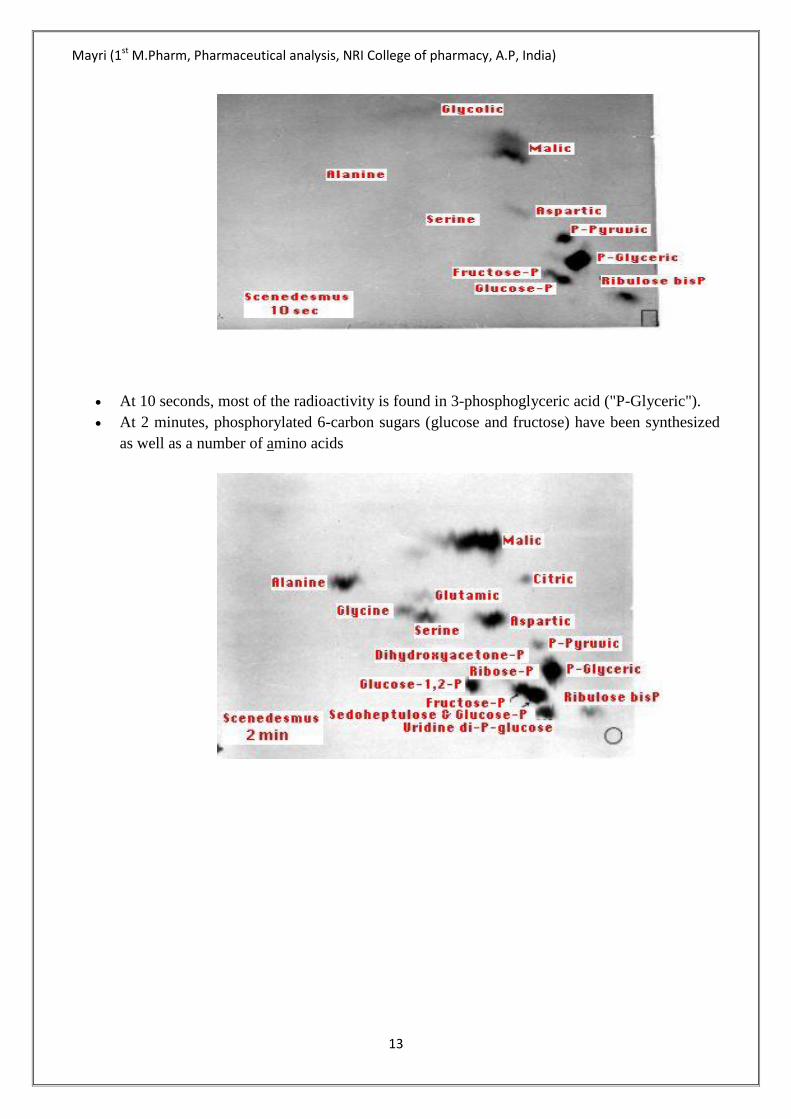
The figure (courtesy of Dr. James A. Bassham) shows autoradiograms of the type that were
essential in working out the dark reactions of photosynthesis. The dark spots show the radioactive
compounds produced
After 10 secs (top) and
2 minutes (bottom) of photosynthesis by the green algae Scenedesmus. The alga was supplied
with carbon dioxide labeled with 14
C, a radioactive isotope of carbon.
Mayri (1st M.Pharm, Pharmaceutical analysis, NRI College of pharmacy, A.P, India)
13
At 10 seconds, most of the radioactivity is found in 3-phosphoglyceric acid ("P-Glyceric").
At 2 minutes, phosphorylated 6-carbon sugars (glucose and fructose) have been synthesized
as well as a number of amino acids
Mayri (1st M.Pharm, Pharmaceutical analysis, NRI College of pharmacy, A.P, India)
14
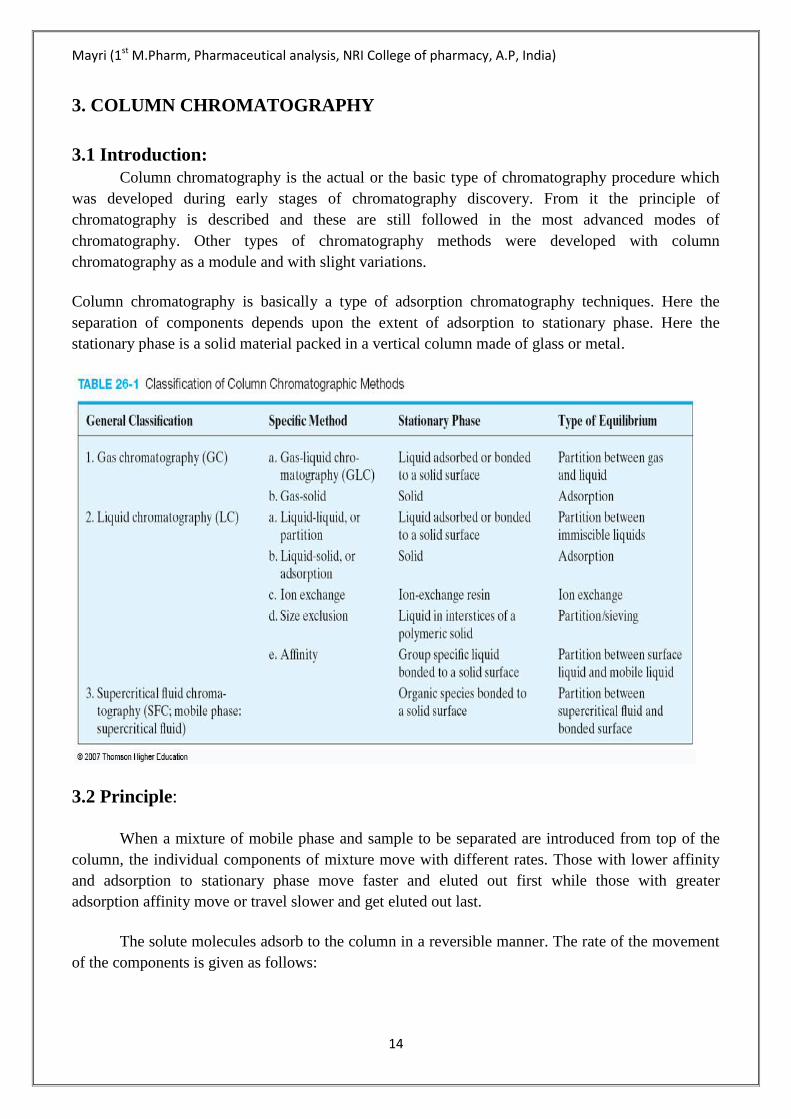
3. COLUMN CHROMATOGRAPHY
3.1 Introduction:
Column chromatography is the actual or the basic type of chromatography procedure which
was developed during early stages of chromatography discovery. From it the principle of
chromatography is described and these are still followed in the most advanced modes of
chromatography. Other types of chromatography methods were developed with column
chromatography as a module and with slight variations.
Column chromatography is basically a type of adsorption chromatography techniques. Here the
separation of components depends upon the extent of adsorption to stationary phase. Here the
stationary phase is a solid material packed in a vertical column made of glass or metal.
3.2 Principle:
When a mixture of mobile phase and sample to be separated are introduced from top of the
column, the individual components of mixture move with different rates. Those with lower affinity
and adsorption to stationary phase move faster and eluted out first while those with greater
adsorption affinity move or travel slower and get eluted out last.
The solute molecules adsorb to the column in a reversible manner. The rate of the movement
of the components is given as follows:
Mayri (1st M.Pharm, Pharmaceutical analysis, NRI College of pharmacy, A.P, India)
15
Rf= Rate of movement of a component / Rate of movement of mobile phase. i.e., it is the
ratio of distance moved by solute to the distance moved by solvent.
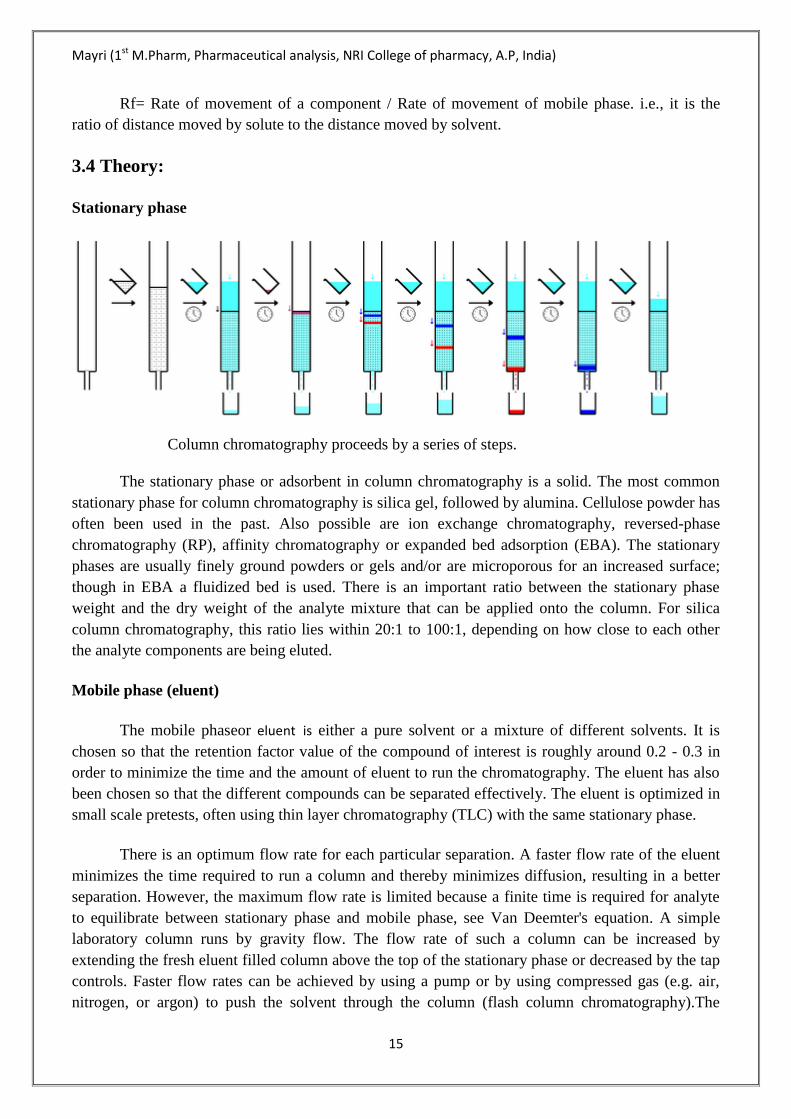
3.4 Theory:
Stationary phase
Column chromatography proceeds by a series of steps.
The stationary phase or adsorbent in column chromatography is a solid. The most common
stationary phase for column chromatography is silica gel, followed by alumina. Cellulose powder has
often been used in the past. Also possible are ion exchange chromatography, reversed-phase
chromatography (RP), affinity chromatography or expanded bed adsorption (EBA). The stationary
phases are usually finely ground powders or gels and/or are microporous for an increased surface;
though in EBA a fluidized bed is used. There is an important ratio between the stationary phase
weight and the dry weight of the analyte mixture that can be applied onto the column. For silica
column chromatography, this ratio lies within 20:1 to 100:1, depending on how close to each other
the analyte components are being eluted.
Mobile phase (eluent)
The mobile phaseor eluent is either a pure solvent or a mixture of different solvents. It is
chosen so that the retention factor value of the compound of interest is roughly around 0.2 - 0.3 in
order to minimize the time and the amount of eluent to run the chromatography. The eluent has also
been chosen so that the different compounds can be separated effectively. The eluent is optimized in
small scale pretests, often using thin layer chromatography (TLC) with the same stationary phase.
There is an optimum flow rate for each particular separation. A faster flow rate of the eluent
minimizes the time required to run a column and thereby minimizes diffusion, resulting in a better
separation. However, the maximum flow rate is limited because a finite time is required for analyte
to equilibrate between stationary phase and mobile phase, see Van Deemter's equation. A simple
laboratory column runs by gravity flow. The flow rate of such a column can be increased by
extending the fresh eluent filled column above the top of the stationary phase or decreased by the tap
controls. Faster flow rates can be achieved by using a pump or by using compressed gas (e.g. air,
nitrogen, or argon) to push the solvent through the column (flash column chromatography).The
Mayri (1st M.Pharm, Pharmaceutical analysis, NRI College of pharmacy, A.P, India)
16
particle size of the stationary phase is generally finer in flash column chromatography than in gravity
column chromatography. For example, one of the most widely used silica gel grades in the former
technique is mesh 230 – 400 (40 – 63 µm), while the latter technique typically requires mesh 70 –
230 (63 – 200 µm) silica gel.
A spreadsheet that assists in the successful development of flash columns has been
developed. The spreadsheet estimates the retention volume and band volume of analytes, the fraction
numbers expected to contain each analyte, and the resolution between adjacent peaks. This
information allows users to select optimal parameters for preparative-scale separations before the
flash column itself is attempted.
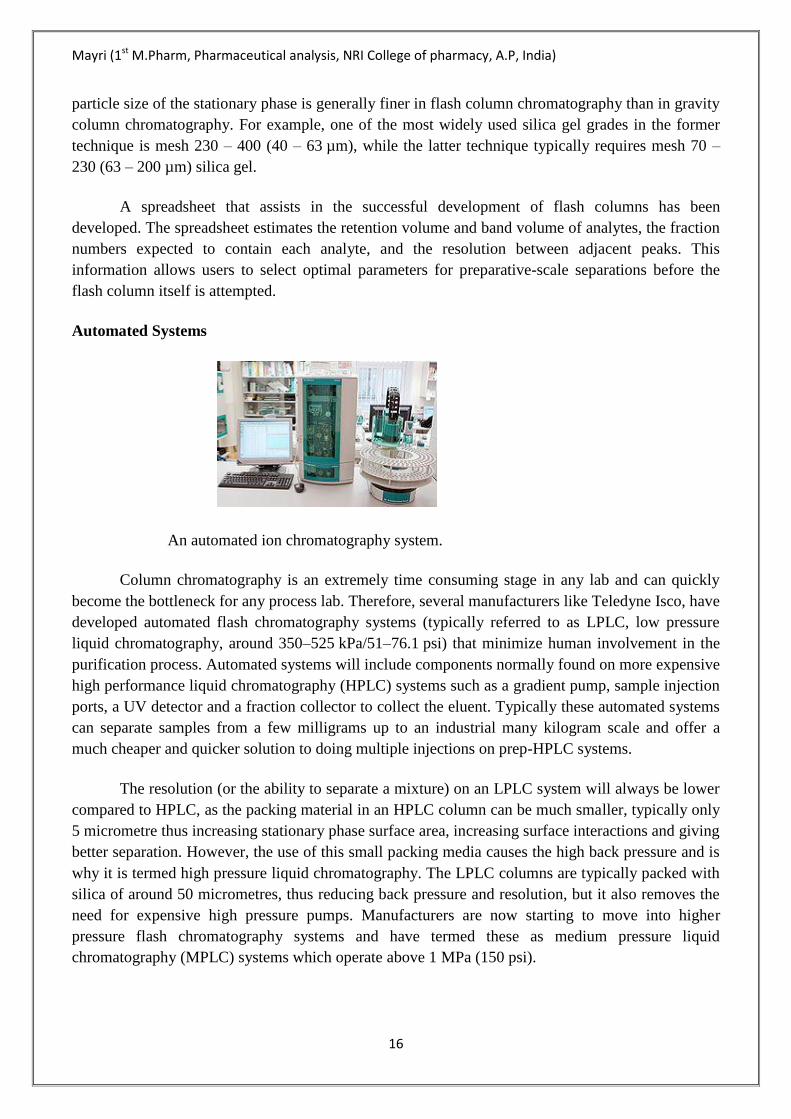
Automated Systems
An automated ion chromatography system.
Column chromatography is an extremely time consuming stage in any lab and can quickly
become the bottleneck for any process lab. Therefore, several manufacturers like Teledyne Isco, have
developed automated flash chromatography systems (typically referred to as LPLC, low pressure
liquid chromatography, around 350–525 kPa/51–76.1 psi) that minimize human involvement in the
purification process. Automated systems will include components normally found on more expensive
high performance liquid chromatography (HPLC) systems such as a gradient pump, sample injection
ports, a UV detector and a fraction collector to collect the eluent. Typically these automated systems
can separate samples from a few milligrams up to an industrial many kilogram scale and offer a
much cheaper and quicker solution to doing multiple injections on prep-HPLC systems.
The resolution (or the ability to separate a mixture) on an LPLC system will always be lower
compared to HPLC, as the packing material in an HPLC column can be much smaller, typically only
5 micrometre thus increasing stationary phase surface area, increasing surface interactions and giving
better separation. However, the use of this small packing media causes the high back pressure and is
why it is termed high pressure liquid chromatography. The LPLC columns are typically packed with
silica of around 50 micrometres, thus reducing back pressure and resolution, but it also removes the
need for expensive high pressure pumps. Manufacturers are now starting to move into higher
pressure flash chromatography systems and have termed these as medium pressure liquid
chromatography (MPLC) systems which operate above 1 MPa (150 psi).
Mayri (1st M.Pharm, Pharmaceutical analysis, NRI College of pharmacy, A.P, India)
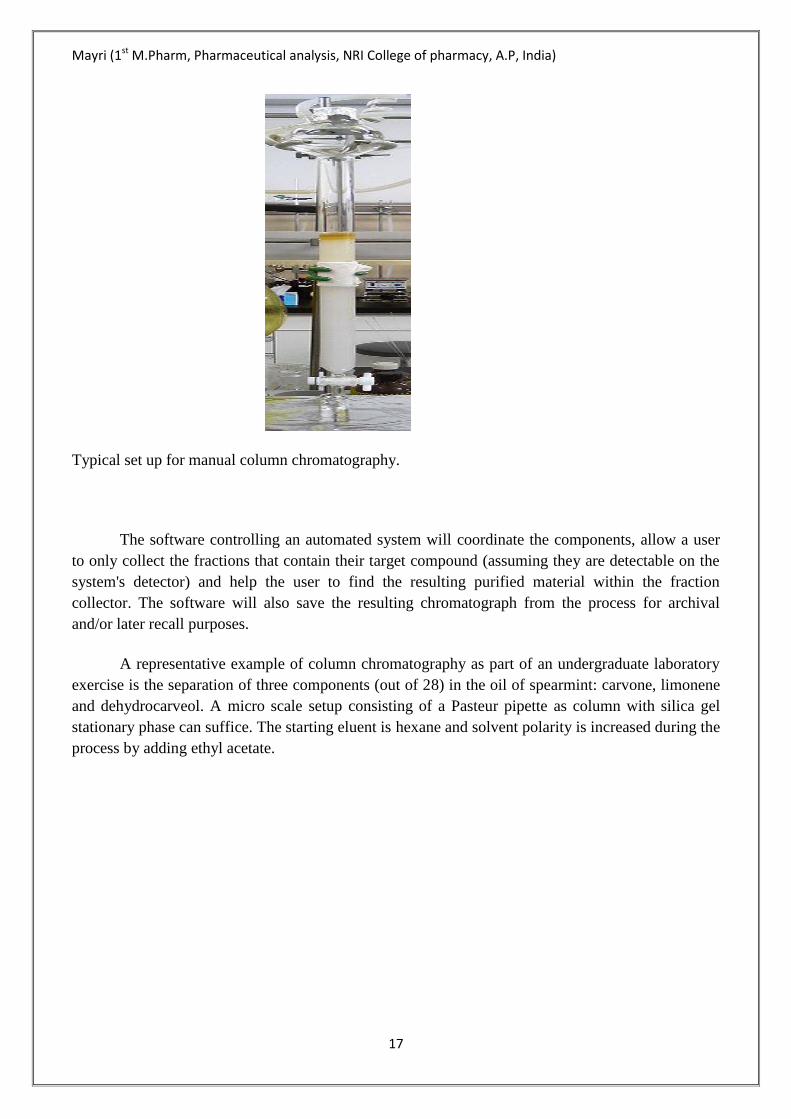
17
Typical set up for manual column chromatography.
The software controlling an automated system will coordinate the components, allow a user
to only collect the fractions that contain their target compound (assuming they are detectable on the
system's detector) and help the user to find the resulting purified material within the fraction
collector. The software will also save the resulting chromatograph from the process for archival
and/or later recall purposes.
A representative example of column chromatography as part of an undergraduate laboratory
exercise is the separation of three components (out of 28) in the oil of spearmint: carvone, limonene
and dehydrocarveol. A micro scale setup consisting of a Pasteur pipette as column with silica gel
stationary phase can suffice. The starting eluent is hexane and solvent polarity is increased during the
process by adding ethyl acetate.
Mayri (1st M.Pharm, Pharmaceutical analysis, NRI College of pharmacy, A.P, India)
18
Column Chromatogram Resolution Calculation
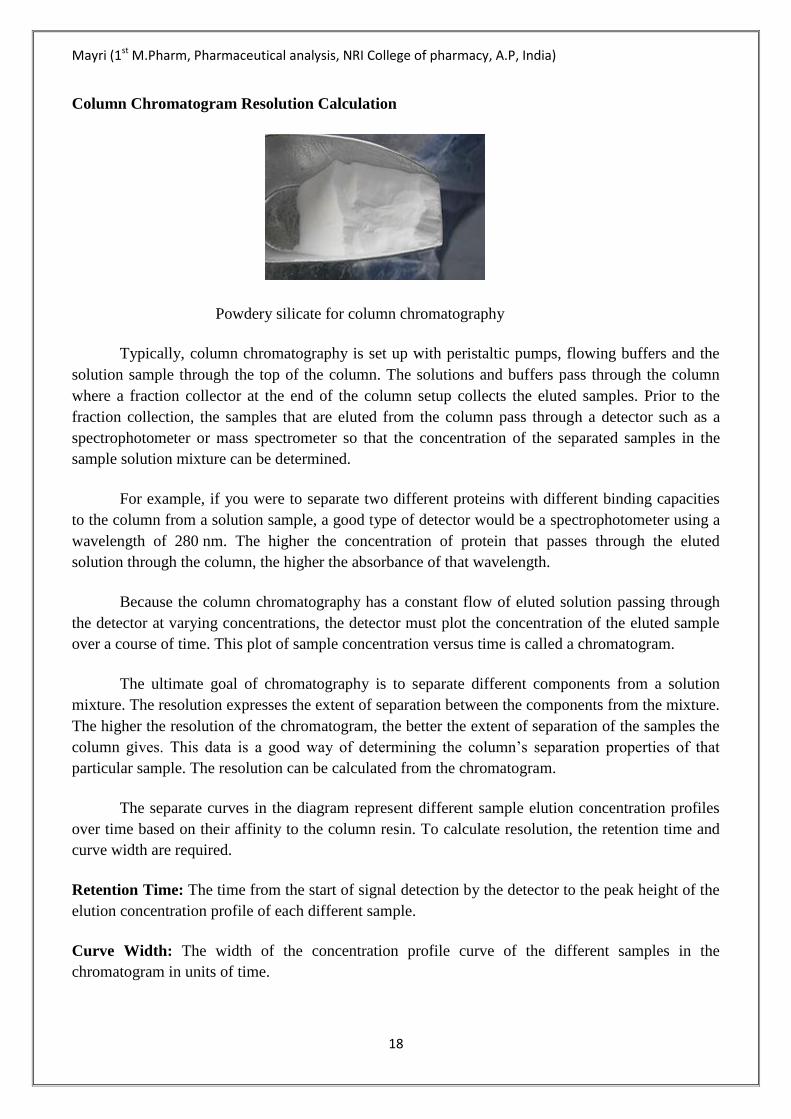
Powdery silicate for column chromatography
Typically, column chromatography is set up with peristaltic pumps, flowing buffers and the
solution sample through the top of the column. The solutions and buffers pass through the column
where a fraction collector at the end of the column setup collects the eluted samples. Prior to the
fraction collection, the samples that are eluted from the column pass through a detector such as a
spectrophotometer or mass spectrometer so that the concentration of the separated samples in the
sample solution mixture can be determined.
For example, if you were to separate two different proteins with different binding capacities
to the column from a solution sample, a good type of detector would be a spectrophotometer using a
wavelength of 280 nm. The higher the concentration of protein that passes through the eluted
solution through the column, the higher the absorbance of that wavelength.
Because the column chromatography has a constant flow of eluted solution passing through
the detector at varying concentrations, the detector must plot the concentration of the eluted sample
over a course of time. This plot of sample concentration versus time is called a chromatogram.
The ultimate goal of chromatography is to separate different components from a solution
mixture. The resolution expresses the extent of separation between the components from the mixture.
The higher the resolution of the chromatogram, the better the extent of separation of the samples the
column gives. This data is a good way of determining the column’s separation properties of that
particular sample. The resolution can be calculated from the chromatogram.
The separate curves in the diagram represent different sample elution concentration profiles
over time based on their affinity to the column resin. To calculate resolution, the retention time and
curve width are required.
Retention Time: The time from the start of signal detection by the detector to the peak height of the
elution concentration profile of each different sample.
Curve Width: The width of the concentration profile curve of the different samples in the
chromatogram in units of time.
Mayri (1st M.Pharm, Pharmaceutical analysis, NRI College of pharmacy, A.P, India)
19
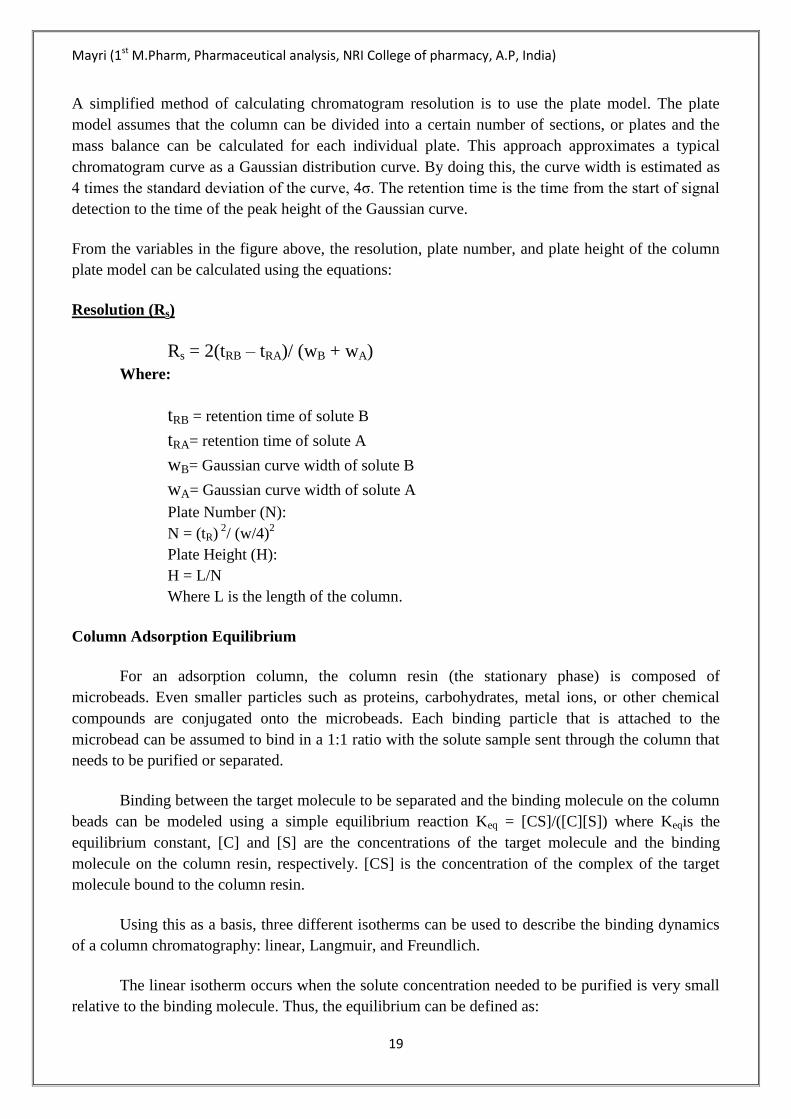
A simplified method of calculating chromatogram resolution is to use the plate model. The plate
model assumes that the column can be divided into a certain number of sections, or plates and the
mass balance can be calculated for each individual plate. This approach approximates a typical
chromatogram curve as a Gaussian distribution curve. By doing this, the curve width is estimated as
4 times the standard deviation of the curve, 4σ. The retention time is the time from the start of signal
detection to the time of the peak height of the Gaussian curve.
From the variables in the figure above, the resolution, plate number, and plate height of the column
plate model can be calculated using the equations:
Resolution (Rs)
Rs = 2(tRB – tRA)/ (wB + wA)
Where:
tRB = retention time of solute B
tRA= retention time of solute A
wB= Gaussian curve width of solute B
wA= Gaussian curve width of solute A
Plate Number (N):
N = (tR) 2
/ (w/4)2
Plate Height (H):
H = L/N
Where L is the length of the column.
Column Adsorption Equilibrium
For an adsorption column, the column resin (the stationary phase) is composed of
microbeads. Even smaller particles such as proteins, carbohydrates, metal ions, or other chemical
compounds are conjugated onto the microbeads. Each binding particle that is attached to the
microbead can be assumed to bind in a 1:1 ratio with the solute sample sent through the column that
needs to be purified or separated.
Binding between the target molecule to be separated and the binding molecule on the column
beads can be modeled using a simple equilibrium reaction Keq = [CS]/([C][S]) where Keqis the
equilibrium constant, [C] and [S] are the concentrations of the target molecule and the binding
molecule on the column resin, respectively. [CS] is the concentration of the complex of the target
molecule bound to the column resin.
Using this as a basis, three different isotherms can be used to describe the binding dynamics
of a column chromatography: linear, Langmuir, and Freundlich.
The linear isotherm occurs when the solute concentration needed to be purified is very small
relative to the binding molecule. Thus, the equilibrium can be defined as:
Mayri (1st M.Pharm, Pharmaceutical analysis, NRI College of pharmacy, A.P, India)
20
[CS] = Keq[C].
For industrial scale uses, the total binding molecules on the column resin beads must be
factored in because unoccupied sites must be taken into account. The Langmuir isotherm and
Freundlich isotherm are useful in describing this equilibrium. Langmuir Isotherm:
[CS] = (KeqStot[C])/ (1 + Keq[C]), where Stot is the total binding molecules on the beads.
Freundlich Isotherm:
[CS] = Keq[C] 1/n
The Freundlich isotherm is used when the column can bind to many different samples in the
solution that needs to be purified. Because the many different samples have different binding
constants to the beads, there are many different Keq’s. Therefore, the Langmuir isotherm is not a
good model for binding in this case.
3.5 Procedure Requirements:
1. Adsorption column:
Column Characteristics: The material of the column is mostly good quality neutral glass since
it should not be effected by solvents, acids or alkalis. An ordinary burette can also be used as
column for separation. The column dimensions are important for effective column separation.
The length: diameter ratio ranges from 10: 1 to 30: 1. For more efficiency the length: diameter
ratio can be 100: 1. The length of the column depends upon;
Affinity of compounds towards the adsorbent used
Number of compounds to be separated.
Type of adsorbent used.
Quantity of sample.
Packing of the column
Wet packing: This is the ideal technique. The required quantity of the adsorbent is mixed
with the mobile phase solvent in the beaker and poured into the column. The stationary
phase settles uniformly in the column and there is no entrapment of air bubbles. There will
not be any crack in the column of adsorbent. The bands eluted from the column will be
uniform and ideal for separation.
Dry packing:In this technique, the required quantity of adsorbent is packed in the column in
dry form and the solvent allowed to flow through the column till equilibrium is reached. The
demerit with this technique is that air bubbles are entrapped between the solvent and the
stationary phaseand the column may not be uniformly packed. Cracks appear in the
adsorbent present in the column. Hence uniformity in flow characteristics and clear bands of
the separated component cannot be obtained.
Mayri (1st M.Pharm, Pharmaceutical analysis, NRI College of pharmacy, A.P, India)
21
Adsorbents:
An adsorbent used in column chromatography should meet the following criteria:
The particle size and geometry: the particle should have uniform size distribution and have
spherical shape. Particle size 60 to 200µ.
Should have high mechanical stability.
Should be inert and should not react with solute or other components.
Insoluble in the solvent or mobile phase used.
It should be colorless to facilitate observation of zones and recovery of components.
It should allow free flow of mobile phase.
It should be useful for separating for wide variety of compounds.
Above all it should be freely available, inexpensive, etc……
Selection of stationary phase:
The success of chromatography depends upon the proper selection of stationary phase. The
selection of stationary phase in column chromatography depends on the following:
Removal of impurities: when a small quantity impurity is present and there is
difference in affinity when compare to the major component, a weak adsorbent is
sufficient.
Number of components to be separated: when few components are to be separated,
weak adsorbent is used. When more components are to be separated, a strong
adsorbent is selected
Affinity differences between components: when components of similar affinities, a
strong adsorbent will be effective. When there are more differences in affinities, a
weak adsorbent is selected.
Length of the column used: when a shorter is used, strong adsorbent has to be used.
When a longer column is used a weak adsorbent can be used.
Quantity of adsorbent used: 20 or 30 times the weight of the adsorbent is used for
effective separation. Adsorbate: adsorbent ratio 1: 20 or 1: 30.
2. Solvents:
S.No Solvent
1. n-hexane
2. Cyclo hexane
3. Carbon tetra chloride
4. Benzene
5. Toluene
6. Trichloro ethylene
Mayri (1st M.Pharm, Pharmaceutical analysis, NRI College of pharmacy, A.P, India)
22
7. Diethyl ether
8. Chloroform
9. Water
3. Elution technique:
Isocratic elution: only one type eluent is passed throughout the separation process.Eg:
(1:1) petroleum ether : benzene
Gradient elution: more than one eluent is taken in the increasing order of their polarity
or solvent strength or eluent strength.Eg: benzene < chloroform < methanol < formic
acid.
Procedure:
The column chromatography requires a vertical column (preferably glass column) with a
knob at the bottom end. This is preferably a burette shaped cylindrical column without graduations or
readings.
Stationary phase or adsorbent, mostly fine sand will do or that recommended for the
experiment. The particles of stationary phase should be of uniform size and shape without
contamination.
Mobile phase preferably solvents of chromatography grade either a single solvent or a
mixture of solvents as required for the separation.
Cotton wool or asbestos pad to plug the exit of column at the bottom and there by hold the
column of stationary phase and let only escape of solvent and sample.
The stationary phase material is suitably moistened with mobile phase and packed
sufficiently in the column with a cotton or asbestos pad at the bottom. The extract material or sample
to be separated is placed on the top of packed stationary phase with a second cotton or asbestos pad
in between.
The mobile phase is poured into the column over the sample. A collecting beaker is placed at
the bottom of column near the end to collect the elute.
Detectors:
Chromatography detector is a device used in gas chromatography (GC) or liquid
chromatography (LC) to visualize components of the mixture being eluted off the chromatography
column. There are two general types of detectors: destructive and non-destructive. The destructive
detectors perform continuous transformation of the column effluent (burning, evaporation or mixing
with reagents) with subsequent measurement of some physical property of the resulting material
(plasma, aerosol or reaction mixture). The non-destructive detectors are directly measuring some
Mayri (1st M.Pharm, Pharmaceutical analysis, NRI College of pharmacy, A.P, India)
23
property of the column effluent (for example UV absorption) and thus affords for the further analyte
recovery.
Destructive detectors:
Flame ionization detector: The column effluent is injected into hydrogen flame and the flame
conductivity is measured. Only used in GC.
Aerosol-based detector [NQAD]: The column effluent is nebulized, the mobile phase
evaporated, a water shell condensed on it and then it is detected. Very sensitive detection for
reverse phase applications.
Flame photometric detector, (FPD): Column eluate is burned in hydrogen flame. The light of
the flame is filtered through an optical filter. Allows the detection of sulfur and phosphorus.
Atomic-emission detector (AED): The column effluent is injected into plasma and the plasma
spectrum is recorded. This detector allows for immediate determination of the elements present
in the analyte.
MS detector: The column effluent is continuously injected into mass spectrometer. This detector
allows for immediate determination of the molecular weight of analyte and/or fragmentation
pattern thus providing a significant amount of information about analyte.
Evaporative light scattering detector (ELD): The column effluent is continuously evaporated
and the light scattering of the resulting aerosol is measured. Only used in LC.
Non-destructive detectors:
UV detectors: fixed or variable wavelength, which includes diode array detector (DAD or
PDA). The UV absorption of the effluent is continuously measured at single or multiple
wavelengths. These are by far most popular detectors for LC.[3]
Thermal conductivity detector, (TCD): Measures the thermal conductivity of the effluent. Only
used in GC.
Fluorescence detector: Irradiates the effluent with a light of set wavelength and measure the
fluorescence of the effluent detector. At a single or multiple wavelength. Used only in LC
Electron Capture Detector, (ECD): The most sensitive detector known. Allows for the
detection of organic molecules containing halogen, nitro groups etc.
Conductivity monitor: Continuously measures the conductivity of the effluent. Used only in LC
when conductive eluents (water or alcohols) are used.
Photoionization detector, (PID): Measures the increase in conductivity achieved by ionizing
the effluent gas with UV radiation.
Refractive index detector (RI or RID): Continuously measures the refractive index of the
effluent. Used only in LC. The lowest sensitivity of all detectors. Useful when nothing else
works and at high analyte concentrations.
Radio flow detector: Measures radioactivity of the effluent. This detector can be continuously
measures the optical angle of rotation of the eluant. Used only in LC when chiral compounds are
being analyzed.
Mayri (1st M.Pharm, Pharmaceutical analysis, NRI College of pharmacy, A.P, India)
24
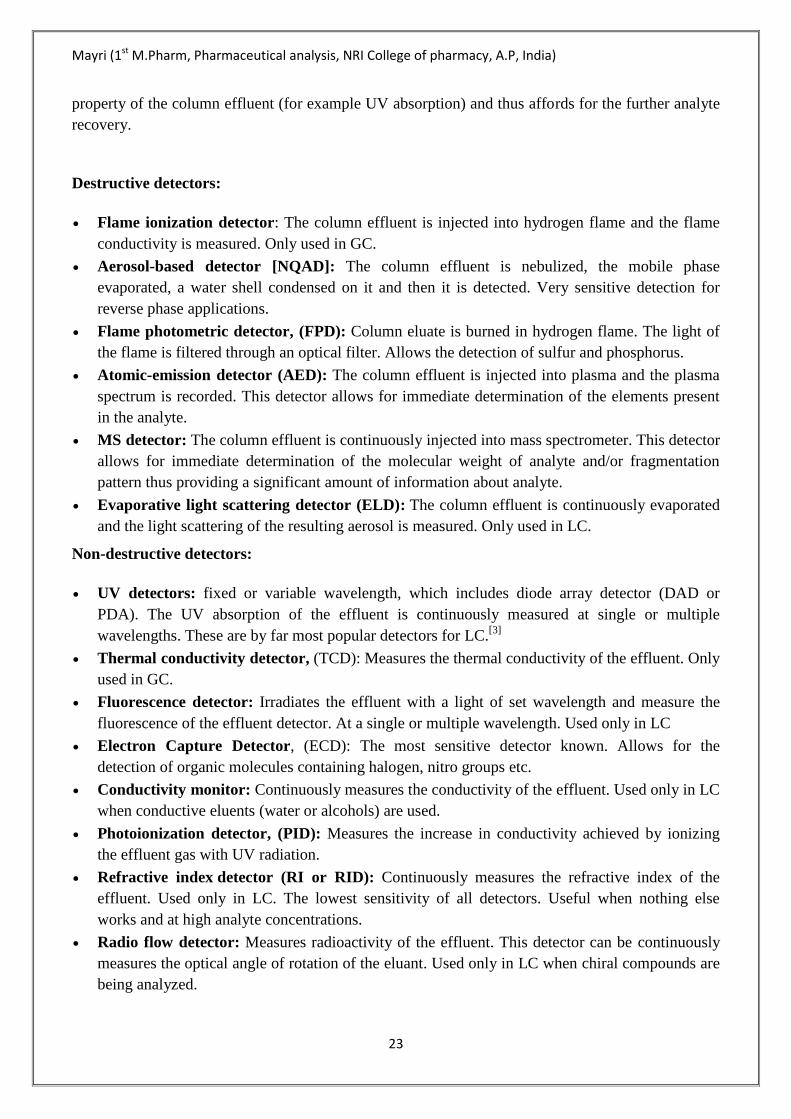
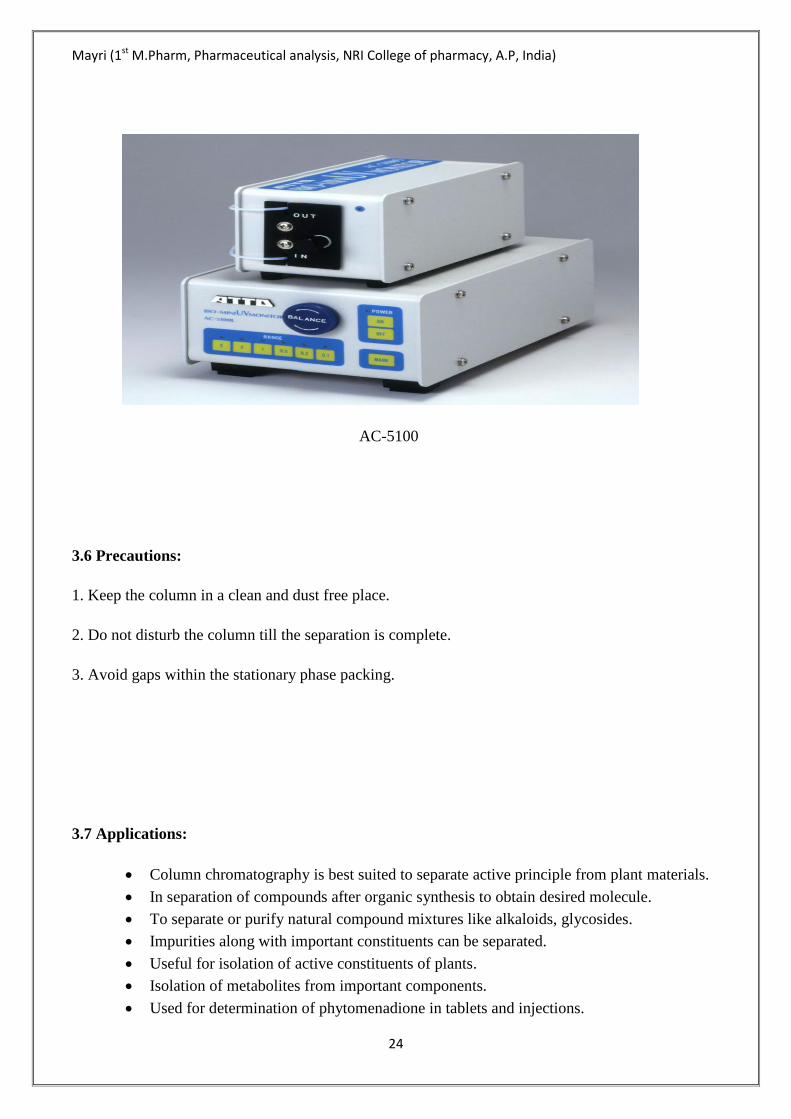
AC-5100
3.6 Precautions:
1. Keep the column in a clean and dust free place.
2. Do not disturb the column till the separation is complete.
3. Avoid gaps within the stationary phase packing.
3.7 Applications:
Column chromatography is best suited to separate active principle from plant materials.
In separation of compounds after organic synthesis to obtain desired molecule.
To separate or purify natural compound mixtures like alkaloids, glycosides.
Impurities along with important constituents can be separated.
Useful for isolation of active constituents of plants.
Isolation of metabolites from important components.
Used for determination of phytomenadione in tablets and injections.
Mayri (1st M.Pharm, Pharmaceutical analysis, NRI College of pharmacy, A.P, India)
25
Used for determination of primary and secondary glycosides in digitalis leaves.
Determination of flucinolone, acetonide or betamethasone in formulations.
Used for the separation diastereomers, geometric isomers from tautomer’s, recemates.
Used for separation of inorganic ions like copper ion, cobalt ion, nickel ion.
Mayri (1st M.Pharm, Pharmaceutical analysis, NRI College of pharmacy, A.P, India)
26
References:
1. Instrumental methods of chemical analysis by Gurdeep R.Chatwal&Sham K.Anand.
2. Instrumental methods of chemical analysis by Kaur.
3. www.Wikipedia. Org/ wiki/ paper chromatography.
4. www. Chemguide. Co. uk/ analysis/ chromatography/ paper. Htm/
5. www. Uwplatt. Edu/ chemep/ chem /chemscape.