paper no. 2840
TRANSCRIPT

Modeling Performance of Galvanic Point Anodes for Cathodic Prevention of Reinforcing Steel in Concrete Repairs
M. Dugarte*, A.A. Sagüés**
* Department of Civil and Environmental Engineering, Universidad del Norte, Km. 5 Vía Puerto Colombia, Barranquilla - COLOMBIA.
** Department of Civil and Environmental Engineering, University of South Florida, 4202 East Fowler Ave., Tampa, FL 33620, U.S.A.
ABSTRACT
This paper addresses projecting the performance of point anodes for patch repairs applications as function of service parameters and anode aging. Input data from a concurrent experimental test program are presented as well. Modeling of a generic patch configuration was implemented by a simplified finite differences method. The model calculates the throwing distance that could be achieved by a given number of anodes per unit perimeter of the patch, concrete thickness, concrete resistivity, amount of steel and amount of polarization needed for cathodic prevention. The model projections and aging data suggest that anode performance in likely application scenarios may derate soon even if a relatively optimistic 100 mV corrosion prevention criterion were assumed. The effect of adopting less conservative criteria proposed in the literature is presented as well and the need for supporting information is discussed. Key Words: anodes, zinc, cathodic prevention, concrete, corrosion, reinforcing steel.
INTRODUCTION Sacrificial point anodes are commercially available to be cast in patch repairs of concrete to prevent the initiation of “halo effect” corrosion on the rebar in areas around the patch.1, 2, 3, 4 The extent of preventive action from a sacrificial point anode system to the rebar assembly merit further analysis by modeling. This paper presents a modeling approach in order to predict how much rebar polarization may be achieved at different aging conditions in a real concrete structure with sacrificial point anodes embedded. The proposed model exemplifies a system representing a patch repair application in reinforced concrete structures. The approach used here combine experimental data on the anodic polarization as a function of service time (PF curves) and the polarization information for the steel coupled to the anode, as input parameters in conjunction with other variables.5, 6 The anode performance is measured by how far away from the patch perimeter (the “throwing distance” xT) an amount of cathodic polarization meeting or exceeding a required minimum (the“prevention criterion” CP) can be provided to the passive rebar surrounding the patch repair area. A generic patch repair configuration with a 1-D approximation was used in the modeling to calculate the
©2013 by NACE International.Requests for permission to publish this manuscript in any form, in part or in whole, must be in writing toNACE International, Publications Division, 1440 South Creek Drive, Houston, Texas 77084.The material presented and the views expressed in this paper are solely those of the author(s) and are not necessarily endorsed by the Association.
1
Paper No.
2840

throwing distance that could be achieved for different scenarios created using the following data: number of anodes per unit perimeter, patch geometry, concrete thickness, concrete resistivity, amount of steel and amount of polarization needed for cathodic prevention and other variables. Several numerical models including finite element analysis and boundary element methods have been applied in the past to corrosion of steel in concrete.7, 8, 9 In this paper, the model was implemented using the finite differences method. This numerical modeling is based not only on geometry of the patch area and concrete resistivity values from a real system but also on actual polarization curves of the cathodic and anodic elements that may be adjusted for different geometries and resistivity values of the concrete element to be evaluated. Results from the 1-D model allow determining the current and potential distribution on the cathode as a function of the distance from the anode element. One of the advantages of this model is the capability to access system performance and the model can be applied to estimating the number of anodes per unit length in a repair patch perimeter, needed to obtain a desired protective throwing power.
EXPERIMENTAL PROCEDURE System modeled The numerical model proposed in this paper used a simplified system representing a reinforced concrete slab (which may represent a bridge deck, parking structure floor, or a part of a wall) having a patch zone in which all the concrete has been replaced during the repair procedure. The patch area is assumed to be roughly circular with sacrificial point anodes of the type evaluated experimentally in previous work, 5, 6 placed at uniform distance inside the patch perimeter. The rebar mat in the slab system is treated as roughly corresponding to a uniform amount of steel surface to be polarized per unit area. Thus, the problem can be considered on first approximation as a 1-D current distribution computation for modeling purpose. Additional simplifications of the model involve assuming uniform concrete resistivity, concrete thickness, and rebar polarization properties. The latter include time-and potential-independent anodic passive dissolution current density and a time independent cathodic reaction (oxygen reduction) current density for the steel. The polarization function for the point anode and its dependence on service time, t, correspond to that observed experimentally for two types of sacrificial point anodes (C and W) evaluated experimentally in previous investigation.5, 6 The base conditions for the model then correspond to an anode placed at the end of a linear reinforced concrete beam, with the galvanic current running lengthwise and a distributed sink current density on the steel given by the local concrete potential and the polarization function of the steel. At the outer slab edge no current leaving the slab was assumed. At the anode end of the beam (patch perimeter) the potential is a function of the end potential and the polarization function of the anode. The nomenclature to be used in the model is listed in Table 1. Principles and model parameters Calling ESU the steady state potential that the passive rebar in the area around patch would achieve in the absence of any galvanic coupling, and ES (x,t) the rebar potential (given in the CSE scale) at service time t and a distance x away from the patch perimeter, then the performance anode condition is given by
ESU – ES (xT,t) = CP (1) Following the treatment described elsewhere for similar conditions, 7 at any given distance x charge conservation under the above assumptions requires that the concrete potential satisfies:
©2013 by NACE International.Requests for permission to publish this manuscript in any form, in part or in whole, must be in writing toNACE International, Publications Division, 1440 South Creek Drive, Houston, Texas 77084.The material presented and the views expressed in this paper are solely those of the author(s) and are not necessarily endorsed by the Association.
2

d2EC/dx2 = - ρ SF tC
-1 iS (2) At the patch perimeter (anodes location), by Ohm's law:
IA=w tC ρ -1 dEC/dx |x=0 (3) At the outer slab edge:
dEC/dx = 0|x=L (4)
Table 1
Nomenclature of Model Variables and Parameters
Parameter Description
CS (V) Nominal Tafel slope, cathodic reaction on steel
CP (V) Cathodic prevention criterion value
E0S (V) Nominal equilibrium potential, cathodic reaction on steel
EA (V) Potential of the mortar at a point immediately adjacent to the metallic surface of the anode
EC (V) Potential of the concrete away from the immediate proximity of the steel surface
ES (V) Potential of the concrete at a point immediately adjacent to the steel surface
ESU (V) Unpolarized steel potential
A (cm) Effective anode diameter
S (cm) Rebar diameter
i0S (A-cm-2) Nominal exchange current density, cathodic reaction on steel
IA (A) Galvanic current delivered by anode
iL (A-cm-2) Nominal limiting current density, cathodic reaction on steel
iP (A-cm-2) Anodic passive current density on steel surface
iS (A-cm-2) Net current density on steel surface
k1 Configuration parameter: k1 = SF tc-1
k2 (cm) Configuration parameter: k2 = SF w
L (cm) Distance from perimeter of the patch to outer edge of the concrete slab.
cm Concrete resistivity
RA Effective current constriction resistance of concrete around the active zone(s)
RSUL -cm Effective length-specific current constriction resistance of concrete at the steel surface
SF(cm2-cm-2) Steel placement density (amount of steel surface area per surface area of concrete slab)
t (s) Amount of time since anode placement and energizing
tC (cm) Concrete slab thickness
w (cm) Anode center-to-center placement distance along patch perimeter
xT (cm) Throwing power
©2013 by NACE International.Requests for permission to publish this manuscript in any form, in part or in whole, must be in writing toNACE International, Publications Division, 1440 South Creek Drive, Houston, Texas 77084.The material presented and the views expressed in this paper are solely those of the author(s) and are not necessarily endorsed by the Association.
3

The net steel current in the model is assumed to depend only on potential, iS(ES). The anode current is assumed to depend on both potential and aging condition, IA (EA, t) as confirmed by the PF curves obtained experimentally in previous work. 5, 6 Accounting for the presence of the current constriction resistances, and by using the configuration parameters k1= ρ SF tC
-1 and k2= SF w, the ruling equation and anode-end boundary condition for the model become:
d2EC/dx2 = - k1 iS (EC-RS iS) (5)
IA(EC+RA IA)= k2 k1-1 dEC/dx |x=0 (6)
Thus, giving as inputs parameters for the model: k1, k2, L, RS, RA, and the theoretical functions: iS(ES) and IA(EA, t), solution of Equation (5) with the boundary conditions in Equations (4, 6) yields EC(x, t) as output which are the potential distribution as a function of distance and time. The use of the parameters k1 and k2 permits obtaining solutions that are roughly scalable for all concrete systems having the same values of those parameters, and the same anode and steel polarization properties. The sign convention used in writing the system equations is to declare iS < 0 when iS is a net cathodic current. That choice permits keeping the customary polarity designation when evaluating the results, with electrode potentials referred to the electrolyte and absolute values of activation-polarized anodic/cathodic current densities respectively increasing/decreasing with potential. Interpretation of the findings is thus facilitated compared with other model alternatives. 8 Model Inputs The ranges of values for model inputs k1 and k2 correspond to typical dimensions of reinforced concrete elements and concrete resistivity conditions that may be encountered in the field. L was fixed at 200 cm which approaches a semi-infinite condition compared with the throwing power values that may be usually expected; the solution is in that case conservatively evaluated and with low sensitivity to the precise value of L. Model inputs RS and RA were estimated from geometric considerations and from the input values of k1 and k2. For RS the approach corresponding to the current flow between two concentric cylinders was assumed to apply on first approximation. In such case the length-specific current constriction resistance RSUL is given by: 8
RSUL= (2)-1 ln (tC/S) (7)
Where S is the rebar diameter (diameter of the inner cylinder) and tC is an approximation to the diameter of the outer cylinder, in this case taken to be in the order of the characteristic thickness of the system. Taking into account the problem scaling, the term RS in Equation (5) is then
RS= S RSUL (8) Complications in estimating RA stem from the metallic anode being surrounded by consecutive shells corresponding to corrosion products, proprietary anode pellet mortar, anode placement mortar/concrete if different from the slab concrete, and finally the slab concrete itself. Moreover, current distribution can be highly complicated if the metallic surface of the anode is not uniformly activated. In such case the polarization function IA(EA, t), even if determined by instant-Off measurements, may itself contain a considerable ohmic component per arguments described in detail by Sagüés et al, 8 and as discussed in a previous publication.5 Assuming that only the uniform part of the current constriction effect needs to be considered, the value of RA may be estimated on first approximation as corresponding to that for the
space between a sphere of effective diameter A in an spherical medium of diameter in the order of tC and resistivity equal to that of the slab concrete,10 so that
©2013 by NACE International.Requests for permission to publish this manuscript in any form, in part or in whole, must be in writing toNACE International, Publications Division, 1440 South Creek Drive, Houston, Texas 77084.The material presented and the views expressed in this paper are solely those of the author(s) and are not necessarily endorsed by the Association.
4

RA ~ ½ -1 [(A)-1 - tC-1] (9)
Assuming that the anode pellet mortar is highly conductive and that any ohmic effects due to corrosion
product accumulation are already built into IA(EA, t), then the effective anode diameter A is considered to be in the order of the characteristic outer dimension of the anode mortar pellet. A rounded-off value representative of the sacrificial point anodes was used in the model (Table 2). 5, 6 The function iS(ES) for the model inputs is chosen to be representative of the behavior of the steel and was obtained experimentally as described in previous publication. 5 This function is abstracted from the combined data set of instant-Off potential measurements as function of rebar current assuming for the cathodic reaction an increasing current density with decreasing potential following simple Tafel kinetics, until a nominal limiting current density value iL is reached (Figure 1). For more negative potentials the current is fixed at iL thus creating a simplified combined activation-concentration limited cathodic polarization curve. The anodic reaction on the rebar is assumed to correspond to a potential-
independent passive dissolution current density iP. Thus when i0S 10^ ((ES-E0S)/CS) <= iL:
iS = i0S 10^ ((ES-E0S)/βCS) - iP (10) and when otherwise:
iS = iL - iP (11)
Where i0S, E0S and βCS are the nominal exchange current density, nominal equilibrium potential and nominal Tafel slope respectively for the species undergoing the cathodic reaction. The values of iP, i0S, E0S A and βCS were determined by least square fitting to the data shown in Figure 1, treating the portion of the polarization diagram spanned by the data as if the cathodic reaction were simply activation-polarized. Application of the chosen parameter set resulted in a visually plausible fit function. However, it is cautioned that the fit procedure is prone to produce alternative parameter sets with nearly similar fit quality, so the set chosen for these calculations should be viewed only as a representative example of the steel polarization function parameters (Table 2).
The value of iL (iL = 2 A/cm2) is a preset parameter and was chosen to represent cases where cathodic diffusional limitation was unlikely (e.g. concrete atmospherically exposed at moderate relative humidity regimes presented by Sagüés et al.11 Smaller iL values were chosen based on previous findings to represent moist conditions.11 A family of graphs representing the anodic behavior at various stages of anode aging, IA(EA, t) obtained experimentally for sacrificial point anodes embedded in a concrete system,5, 6 are used here as an input parameter for the model calculations.
Application of mathematical model Numeric solutions of the ruling equation with boundary conditions as mentioned above were obtained by the finite differences method using a 20-element array and an iterative Jacobi technique with a relaxation factor between consecutive calculations chosen to achieve stability and prompt convergence of the model solution. Separate calculations were performed for each value of time t for which information on anodic behavior was available. The functions iS(ES) and IA(EA, t) were entered as numeric arrays, which permitted manipulation to obtain reciprocal functions by lookup and interpolation
A The values of i0S, E0S are not independent for the purposes of these calculations [Kranc 1992] so E0S was
specified arbitrarily. ©2013 by NACE International.Requests for permission to publish this manuscript in any form, in part or in whole, must be in writing toNACE International, Publications Division, 1440 South Creek Drive, Houston, Texas 77084.The material presented and the views expressed in this paper are solely those of the author(s) and are not necessarily endorsed by the Association.
5

-0.6
-0.5
-0.4
-0.3
-0.2
-0.1
0.0
1.00E-09 1.00E-08 1.00E-07 1.00E-06 1.00E-05
i / A cm-2
E C
SE / V
All C&W Set 1+2 Cath
Abstraction
as well as easily obtaining values of expressions such as iS (EC-RS iS) or IA(EC+RA IA) as included in the model calculations.
Figure 1: Combined EIO-log i Representation of the Individual Instant-Off Potential and Current Density Values for Passive Rebars. The Solid Line Represents the Abstraction Function.
Table 2 Steel and General Model Parameters for Model Cases
Steel: i0S = 2.03 E-9 A-cm-2 E0S = -0.00 VCSE
*
CS = 0.138 V iP = 2.59 E-8 A-cm-2 iL = 2 E-6 A-cm-2 ESU= -0.153 VCSE **
S = 2.2 cm
Parameters used as base for k1, k2 cases and for constriction resistances
A = 5 cm tc = 20 cm L = 200 cm SF = 1
k1 (kΩ) 3.33 , 1.00, 3.00
k2 (cm) 25, 50, 75
CP (V) 0.10, 0.15, 0.20
T (months) 1, 4 , 10, 13
Anode Current to Steel in Patch 0, ½
*Nominal value **Value resulting from the other inputs
©2013 by NACE International.Requests for permission to publish this manuscript in any form, in part or in whole, must be in writing toNACE International, Publications Division, 1440 South Creek Drive, Houston, Texas 77084.The material presented and the views expressed in this paper are solely those of the author(s) and are not necessarily endorsed by the Association.
6
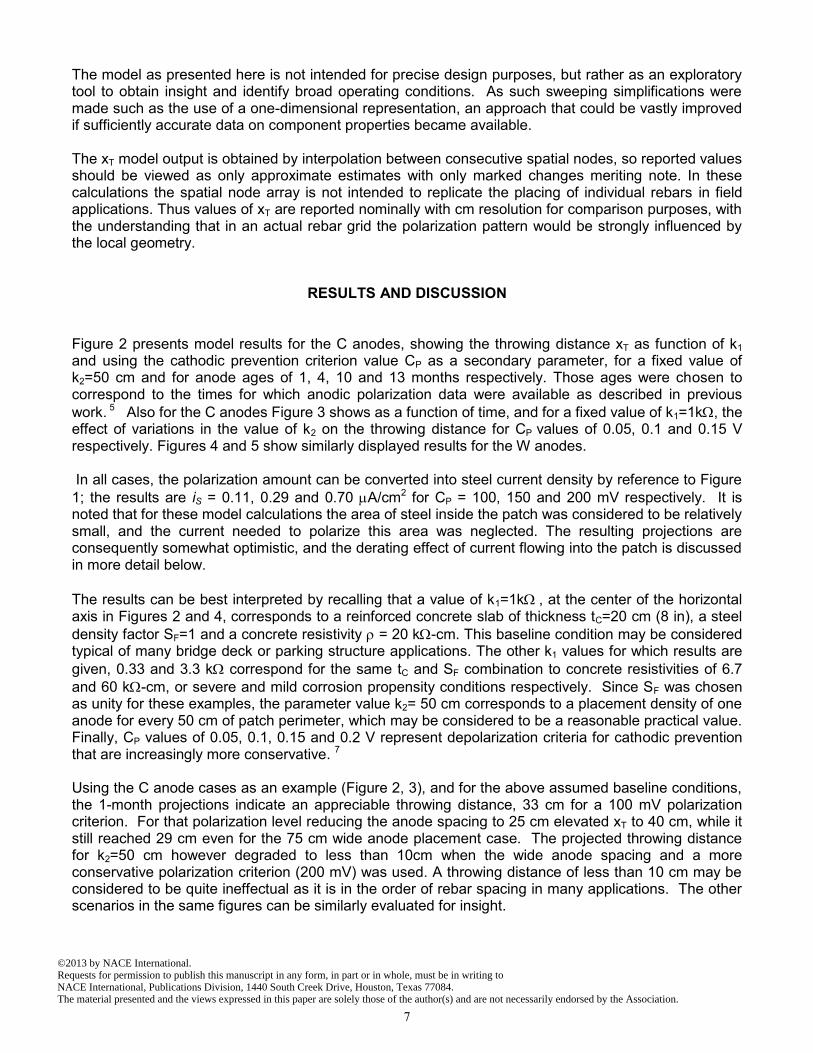
The model as presented here is not intended for precise design purposes, but rather as an exploratory tool to obtain insight and identify broad operating conditions. As such sweeping simplifications were made such as the use of a one-dimensional representation, an approach that could be vastly improved if sufficiently accurate data on component properties became available. The xT model output is obtained by interpolation between consecutive spatial nodes, so reported values should be viewed as only approximate estimates with only marked changes meriting note. In these calculations the spatial node array is not intended to replicate the placing of individual rebars in field applications. Thus values of xT are reported nominally with cm resolution for comparison purposes, with the understanding that in an actual rebar grid the polarization pattern would be strongly influenced by the local geometry.
RESULTS AND DISCUSSION Figure 2 presents model results for the C anodes, showing the throwing distance xT as function of k1 and using the cathodic prevention criterion value CP as a secondary parameter, for a fixed value of k2=50 cm and for anode ages of 1, 4, 10 and 13 months respectively. Those ages were chosen to correspond to the times for which anodic polarization data were available as described in previous
work. 5 Also for the C anodes Figure 3 shows as a function of time, and for a fixed value of k1=1k, the effect of variations in the value of k2 on the throwing distance for CP values of 0.05, 0.1 and 0.15 V respectively. Figures 4 and 5 show similarly displayed results for the W anodes. In all cases, the polarization amount can be converted into steel current density by reference to Figure
1; the results are iS = 0.11, 0.29 and 0.70 A/cm2 for CP = 100, 150 and 200 mV respectively. It is noted that for these model calculations the area of steel inside the patch was considered to be relatively small, and the current needed to polarize this area was neglected. The resulting projections are consequently somewhat optimistic, and the derating effect of current flowing into the patch is discussed in more detail below.
The results can be best interpreted by recalling that a value of k1=1k, at the center of the horizontal axis in Figures 2 and 4, corresponds to a reinforced concrete slab of thickness tC=20 cm (8 in), a steel
density factor SF=1 and a concrete resistivity = 20 k-cm. This baseline condition may be considered typical of many bridge deck or parking structure applications. The other k1 values for which results are
given, 0.33 and 3.3 k correspond for the same tC and SF combination to concrete resistivities of 6.7
and 60 k-cm, or severe and mild corrosion propensity conditions respectively. Since SF was chosen as unity for these examples, the parameter value k2= 50 cm corresponds to a placement density of one anode for every 50 cm of patch perimeter, which may be considered to be a reasonable practical value. Finally, CP values of 0.05, 0.1, 0.15 and 0.2 V represent depolarization criteria for cathodic prevention that are increasingly more conservative. 7 Using the C anode cases as an example (Figure 2, 3), and for the above assumed baseline conditions, the 1-month projections indicate an appreciable throwing distance, 33 cm for a 100 mV polarization criterion. For that polarization level reducing the anode spacing to 25 cm elevated xT to 40 cm, while it still reached 29 cm even for the 75 cm wide anode placement case. The projected throwing distance for k2=50 cm however degraded to less than 10cm when the wide anode spacing and a more conservative polarization criterion (200 mV) was used. A throwing distance of less than 10 cm may be considered to be quite ineffectual as it is in the order of rebar spacing in many applications. The other scenarios in the same figures can be similarly evaluated for insight.
©2013 by NACE International.Requests for permission to publish this manuscript in any form, in part or in whole, must be in writing toNACE International, Publications Division, 1440 South Creek Drive, Houston, Texas 77084.The material presented and the views expressed in this paper are solely those of the author(s) and are not necessarily endorsed by the Association.
7

The projected throwing distance decreased with service time to various extents depending strongly on the polarization prevention criterion used. Thus, continuing with the above example, for baseline conditions and 13 mo age the projected 100 mV throwing distance for the 50 cm anode spacing was reduced to 23 cm. For the same anode spacing increasing the polarization criterion to 150 mV lowered the projected throwing distance to less that 10 cm, and the model projected that the 200 mV criterion was no longer reachable. The 200 mV criterion could be met at 13 mo by reducing the anode spacing to 25 cm, but the projected throwing distance was poor (<10 cm). The projections for the W anodes resulted in xT values that were comparable to those of the C anodes at early ages, but generally smaller later on, in keeping with the relative anode polarization behavior of the anodes in the experimental tests as discussed in previous work. 5
Figure 2: Model projections of throwing distance for C anodes at the indicated service times. All graphs are for k2 = 50 cm, CP as shown. Absent symbol/line: polarization not achievable or xT
< 1 cm.
©2013 by NACE International.Requests for permission to publish this manuscript in any form, in part or in whole, must be in writing toNACE International, Publications Division, 1440 South Creek Drive, Houston, Texas 77084.The material presented and the views expressed in this paper are solely those of the author(s) and are not necessarily endorsed by the Association.
8

CP = 0.05V
1
10
100
1 10 100
x T
/c
m
k2=25 cm
k2=50 cm
k2=75 cm
CP = 0.10V
1
10
100
1 10 100
x T
/c
m
k2=25 cm
k2=50 cm
k2=75 cm
CP = 0.15V
1
10
100
1 10 100
Time / months
x T
/c
m
k2=25 cm
k2=50 cm
k2=75 cm
Figure 3: Model projections of throwing distance for C anodes, as a function of time. Legends
indicate values of k2 (cm). Absent symbol/line: polarization not achievable or xT < 1 cm. As indicated earlier, the projections would become more pessimistic when current demand by the steel in the patch area is considered. The extent of this effect was addressed by evaluating model projections for the case where the region inside the patch required half of the galvanic current from the galvanic point anode, so that the anode current is distributed equally between the patch area and the
©2013 by NACE International.Requests for permission to publish this manuscript in any form, in part or in whole, must be in writing toNACE International, Publications Division, 1440 South Creek Drive, Houston, Texas 77084.The material presented and the views expressed in this paper are solely those of the author(s) and are not necessarily endorsed by the Association.
9

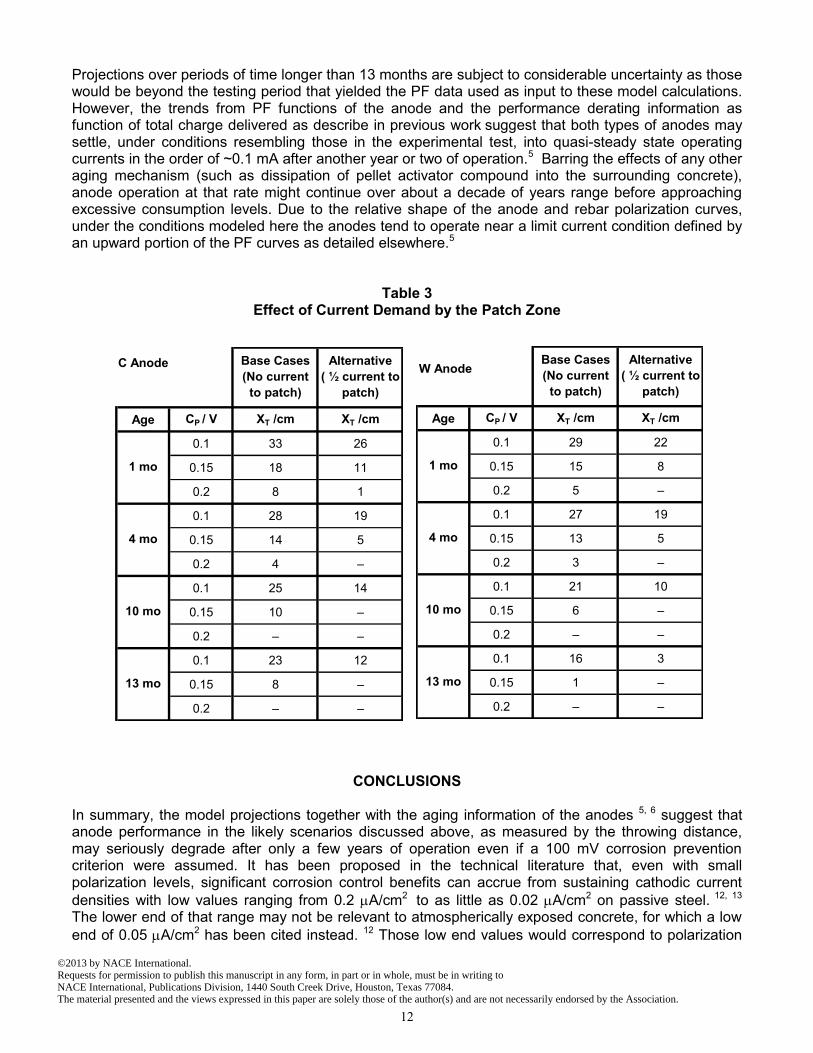
surrounding concrete. The results are presented in Table 3 for the baseline condition with k1=1k and a 50 cm anode spacing. As expected the projected performance degraded compared to the cases where the entire anode current flowed outside the patch. The extent of degradation depended particularly on the polarizability of the anode. Thus the projected effect was relatively small early on when the added current demand caused only a relatively small shift of the anode potential toward more positive values. However, the shift would be more pronounced as later anode ages are considered, where a consequently steeper polarization curve applies.
Figure 4: Model projections of throwing distance for W anodes at the indicated service times. All graphs are for k2 = 50 cm, CP as shown.
At age 13 months the projections indicated a substantial reduction in the throwing distance to about ⅓ to ½ of the value obtained when no current to the patch was assumed depending on anode type. In an
©2013 by NACE International.Requests for permission to publish this manuscript in any form, in part or in whole, must be in writing toNACE International, Publications Division, 1440 South Creek Drive, Houston, Texas 77084.The material presented and the views expressed in this paper are solely those of the author(s) and are not necessarily endorsed by the Association.
10
actual system the patch zone may be small compared to its surroundings, so the galvanic current partition and resulting effect in polarization would be somewhat in between the two extreme situations (no current vs. ½ of the current going to the patch) considered in Table 3.
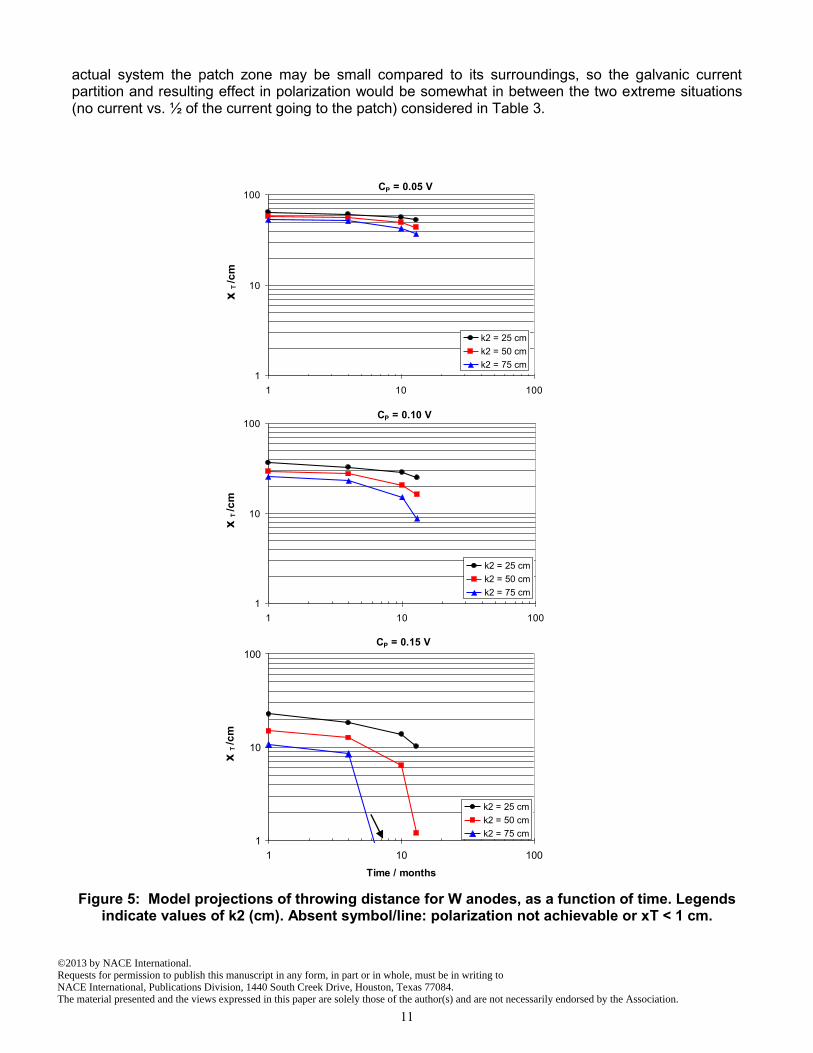
Figure 5: Model projections of throwing distance for W anodes, as a function of time. Legends
indicate values of k2 (cm). Absent symbol/line: polarization not achievable or xT < 1 cm.
CP = 0.05 V
1
10
100
1 10 100
x T
/c
m
k2 = 25 cm
k2 = 50 cm
k2 = 75 cm
CP = 0.10 V
1
10
100
1 10 100
x T
/c
m
k2 = 25 cm
k2 = 50 cm
k2 = 75 cm
CP = 0.15 V
1
10
100
1 10 100
Time / months
x T
/c
m
k2 = 25 cm
k2 = 50 cm
k2 = 75 cm
©2013 by NACE International.Requests for permission to publish this manuscript in any form, in part or in whole, must be in writing toNACE International, Publications Division, 1440 South Creek Drive, Houston, Texas 77084.The material presented and the views expressed in this paper are solely those of the author(s) and are not necessarily endorsed by the Association.
11
C Anode
Age CP / V XT /cm XT /cm
0.1 33 26
0.15 18 11
0.2 8 1
0.1 28 19
0.15 14 5
0.2 4 –
0.1 25 14
0.15 10 –
0.2 – –
0.1 23 12
0.15 8 –
0.2 – –
10 mo
13 mo
1 mo
4 mo
Alternative
( ½ current to
patch)
Base Cases
(No current
to patch)
W Anode
Age CP / V XT /cm XT /cm
0.1 29 22
0.15 15 8
0.2 5 –
0.1 27 19
0.15 13 5
0.2 3 –
0.1 21 10
0.15 6 –
0.2 – –
0.1 16 3
0.15 1 –
0.2 – –
10 mo
13 mo
Base Cases
(No current
to patch)
Alternative
( ½ current to
patch)
4 mo
1 mo
Projections over periods of time longer than 13 months are subject to considerable uncertainty as those would be beyond the testing period that yielded the PF data used as input to these model calculations. However, the trends from PF functions of the anode and the performance derating information as function of total charge delivered as describe in previous work suggest that both types of anodes may settle, under conditions resembling those in the experimental test, into quasi-steady state operating currents in the order of ~0.1 mA after another year or two of operation.5 Barring the effects of any other aging mechanism (such as dissipation of pellet activator compound into the surrounding concrete), anode operation at that rate might continue over about a decade of years range before approaching excessive consumption levels. Due to the relative shape of the anode and rebar polarization curves, under the conditions modeled here the anodes tend to operate near a limit current condition defined by an upward portion of the PF curves as detailed elsewhere.5
Table 3
Effect of Current Demand by the Patch Zone
CONCLUSIONS
In summary, the model projections together with the aging information of the anodes 5, 6 suggest that anode performance in the likely scenarios discussed above, as measured by the throwing distance, may seriously degrade after only a few years of operation even if a 100 mV corrosion prevention criterion were assumed. It has been proposed in the technical literature that, even with small polarization levels, significant corrosion control benefits can accrue from sustaining cathodic current
densities with low values ranging from 0.2 A/cm2 to as little as 0.02 A/cm2 on passive steel. 12, 13 The lower end of that range may not be relevant to atmospherically exposed concrete, for which a low
end of 0.05 A/cm2 has been cited instead. 12 Those low end values would correspond to polarization
©2013 by NACE International.Requests for permission to publish this manuscript in any form, in part or in whole, must be in writing toNACE International, Publications Division, 1440 South Creek Drive, Houston, Texas 77084.The material presented and the views expressed in this paper are solely those of the author(s) and are not necessarily endorsed by the Association.
12

levels in the order of only 34 to 65 mV for 0.02 and 0.05 A/cm2 respectively (Figure 1), with consequently greater throwing distances than those obtained for the case of 100 mV. It is noted
however that the 0.2 A/cm2 high end of the range does not improve prognosis relative to the situations addressed earlier, as it corresponds in the present model to a CP value approaching 150 mV (Figure 1). That case has already been addressed above, and yielded generally poor performance projections. There are indeed benefits from long term application of cathodic currents, in particular from an increase in pH near the surface of the rebar and also a decrease in chloride content if contamination already exists.14, 15 Those effects are to be expected at substantial cathodic current densities. However, the extent of benefits at the very low polarization levels that correspond to the low end of the current density-based criteria awaits sufficient experimental demonstration. Should future research develop adequate supporting evidence, the less conservative criterion requirements may merit further consideration.
ACKNOWLEDGEMENTS
This investigation was supported by the State of Florida Department of Transportation and the U.S. Department of Transportation. The opinions, findings and conclusions expressed in this publication are those of the authors and not necessarily those of the supporting agencies.
REFERENCES
1. Bennett, J. and Talbot, C., “Extending the Life of Concrete Patch Repair with Chemically Enhanced Zinc Anodes”, Paper No. 02255, Corrosion/2002, NACE International, Houston, (2002). 2. Bennett, J. and McCord, W., “Performance of Zinc Anodes Used to Extend the Life of Concrete Patch Repairs”, Paper No. 06331, Corrosion/2006, NACE International, Houston, (2006). 3. Sergi, G. and Page, C., "Sacrificial anodes for cathodic prevention of reinforcing steel around patch repairs applied to chloride-contaminated concrete". In: Mietz, J. et al (eds.), Corrosion of Reinforcement in Concrete, IOM Communications, London, European Federation of Corrosion Publications, No. 31, p.93-100, 2001. 4. Whitmore, D. and Abbott, S., “Using Humectants to Enhance the Performance of Embedded Galvanic Anodes”, Paper No. 03301, Corrosion/2003, NACE International, Houston, (2003). 5. Dugarte, M. and Sagüés, A.A., “BD544-09 Galvanic Point Anodes for Extending the Service Life of Patched Areas Upon Reinforced Concrete Bridge Members”. 6. Dugarte, M. and Sagüés, A.A., “Polarization Of Sacrificial Point Anodes For Cathodic Prevention Of Reinforcing Steel In Concrete Repairs - Part 1: Experimental Findings”. (In preparation for submission to Corrosion journal (2013)).
7. Presuel-Moreno, F.J., Kranc, S.C., and Sagues, A. A, “Cathodic Prevention Distribution in Partially Submerged Reinforced Concrete”, Corrosion, Vol. 61 p.548-558 (2005B). 8. Kranc, S.C and Sagüés, A.A., "Computation of Reinforcing Steel Corrosion Distribution in Concrete Marine Bridge Substructures", Corrosion, Vol. 50, p.50, (1994).
©2013 by NACE International.Requests for permission to publish this manuscript in any form, in part or in whole, must be in writing toNACE International, Publications Division, 1440 South Creek Drive, Houston, Texas 77084.The material presented and the views expressed in this paper are solely those of the author(s) and are not necessarily endorsed by the Association.
13

9. Sagüés, A.A. and S.C. Kranc, S.C.“Model for a Quantitative Corrosion Damage Function for Reinforced Concrete Marine Substructure”, Rehabilitation of Corrosion Damaged Infrastructure, p.268, Proceedings, Symposium 3, 3rd. NACE Latin-American Region Corrosion Congress, NACE International, Houston, (1998). 10. Landolt, D. "Corrosion and Surface Chemistry of Metals", CRC Press (2007) 11. Sagüés, A.A., Pech-Canul, M.A., and Al-Mansur, A.K.M., “Corrosion macrocell behavior of reinforcing steel in partially submerged concrete columns”, Corr. Sci. Vol. 45 p.25-30 (2003). 12. Pedeferri, P., “Cathodic protection and Cathodic Prevention” Constr. Build. Mater. Vol. 10, No. 5 (1996), p. 391. 13. Sergi, G., Simpson, D. and Potter, J. "Long-term performance and versatility of zinc sacrificial anodes for control of reinforcement corrosion", Proceedings of Eurocorr 2008, The European Corrosion Congress “Managing Corrosion for Sustainability”, 7-11 September 2008, Edinburgh. 14. Glass G. K. and Buenfeld N. R., “Theoretical basis for designing reinforced concrete cathodic protection systems”, British Corrosion Journal vol. 32, pp. 179-184 (1997). 15. Glass, G. K., Reddy, B. and Clark, L. A.,"Making concrete immune to chloride induced corrosion", Proceedings of the Institution of Civil Engineers, Construction Materials, 160 (4) (2007) 155-164.
©2013 by NACE International.Requests for permission to publish this manuscript in any form, in part or in whole, must be in writing toNACE International, Publications Division, 1440 South Creek Drive, Houston, Texas 77084.The material presented and the views expressed in this paper are solely those of the author(s) and are not necessarily endorsed by the Association.
14