paper number: 1825 composite cure process modeling · pdf filecomposite cure process induced...
TRANSCRIPT

COVER SHEET
NOTE: This coversheet is intended for you to list your article title and author(s) name only
—this page will not appear on the CD-ROM.
Paper Number: 1825
Composite Cure Process Modeling and Simulations using COMPRO® and
Validation of Residual Strains using Fiber Optics Sensors
Thammaiah Sreekantamurthy, Tyler B. Hudson, Tan-Hung Hou, Brian W. Grimsley
https://ntrs.nasa.gov/search.jsp?R=20160012030 2018-05-03T14:14:14+00:00Z

(FIRST PAGE OF ARTICLE – align this to the top of page – leave space blank above ABSTRACT)1
ABSTRACT
Composite cure process induced residual strains and warping deformations in
composite components present significant challenges in the manufacturing of advanced
composite structure. As a part of the Manufacturing Process and Simulation initiative
of the NASA Advanced Composite Project (ACP), research is being conducted on the
composite cure process by developing an understanding of the fundamental
mechanisms by which the process induced factors influence the residual responses. In
this regard, analytical studies have been conducted on the cure process modeling of
composite structural parts with varied physical, thermal, and resin flow process
characteristics. The cure process simulation results were analyzed to interpret the cure
response predictions based on the underlying physics incorporated into the modeling
tool. In the cure-kinetic analysis, the model predictions on the degree of cure, resin
viscosity and modulus were interpreted with reference to the temperature distribution in
the composite panel part and tool setup during autoclave or hot-press curing cycles. In
the fiber-bed compaction simulation, the pore pressure and resin flow velocity in the
porous media models, and the compaction strain responses under applied pressure were
studied to interpret the fiber volume fraction distribution predictions. In the structural
simulation, the effect of temperature on the resin and ply modulus, and thermal
coefficient changes during curing on predicted mechanical strains and chemical cure
shrinkage strains were studied to understand the residual strains and stress response
predictions. In addition to computational analysis, experimental studies were conducted
to measure strains during the curing of laminated panels by means of optical fiber Bragg
grating sensors (FBGs) embedded in the resin impregnated panels. The residual strain
measurements from laboratory tests were then compared with the analytical model
predictions. The paper describes the cure process procedures and residual strain
predications, and discusses pertinent experimental results from the validation studies.
1 Thammaiah Sreekantamurthy, Analytical Mechanics Associates, Mail Stop 226, NASA Langley
Research Center, Hampton, VA, 23681-2199. 2 Tyler B. Hudson, National Institute of Aerospace, Mail Stop 226, NASA Langley Research Center,
Hampton, VA, 23681-2199. 3 Tan-Hung Hou, Mail Stop 226, NASA Langley Research Center, Hampton, VA, 23681-2199. 4 Brian W. Grimsley, Mail Stop 226, NASA Langley Research Center, Hampton, VA, 23681-2199.
INTRODUCTION
Composite cure process induced residual strains and warping defects present
significant challenges in the manufacturing of advanced composite structural
components. Lack of effective means for overcoming these defects has resulted in ad-
hoc and time-consuming trial and error approaches to alter the cure process during the
manufacturing phase. Hence, better approaches have been sought to overcome residual
strains and warping defects. However, a multitude of complex physical phenomena
occurring in the composite cure process has hindered a better understanding of the
formation of the cure induced defects. Composite cure process modeling and simulation
methods have come a long way in recent years to enable analytical evaluation of the
curing process. Cure process simulation software is becoming available to assess the
curing responses from simulations of the physics of curing phenomenon such as cure
kinetics, fiber-bed compaction, warping deformations and residual strains. In parallel
development, real-time measurement and monitoring of cure state through the use of
thermo-couples, fiber-optics, acoustics, dielectric, and other in-situ sensors have
provided opportunities to measure the physical state of resin, and thus providing a better
understanding of the curing phenomenon. As a part of the Manufacturing Process and
Simulation initiative of the NASA Advanced Composite Project (ACP), research is
being conducted on the composite cure process by developing an understanding of the
basic mechanisms by which the process induced factors influence the residual
responses.
The primary focus of this study was to develop cure process models of composite
parts using commercial-off-the-shelf software to analyze and understand the cure
responses with reference to the known physics of the composite curing process, and to
compare the residual strain predictions from the analysis with those measured using
fiber optics strain sensors in the laboratory. In this regard, analytical studies were
conducted on the cure process modeling of composite structural parts such as composite
flat panel, angle section, and corner-section components using commercial software
COMPRO® and RAVEN® from Convergent Manufacturing Technology, Vancouver,
Canada. This paper is focused on the cure process modeling and analysis of laminated
panels. The studies involved thermo-kinetic, resin flow compaction, and residual strain
analysis of the curing part. Experimental tests were conducted to measure strains during
the curing of laminates by means of optical fiber strain sensing techniques. The paper
first describes the material characteristics of the Hexcel® 8552 resin, followed by
analysis of two- and three-dimensional cure models of laminates. The paper then
describes the laminate fabrication with embedded optical strain sensors for residual
strain measurements. Finally, the strains measured in the experimental tests are
compared with those from the cure process analysis, and the results are summarized
with concluding remarks.
AN UNDERSTANDING OF THE PHYSICS OF CURE MECHANICS
The earliest attempts to understand the mechanics of composite cure processes
began in early ‘80s soon after mechanics of composite materials became well developed
and widely modeled for simulation of structural responses. Many research articles have
been published since then on the cure process of composites. References [1-6] describe
and discuss key concepts in the curing of epoxy matrix, thermo-chemical phenomenon
including heat of reaction, viscosity, resin flow, residual stress and strain formation in
the fiber-reinforced composites. Reference [3] states that although residual stress effects
on structural integrity have been modeled and analyzed, the process of residual stress
development during cure processing has not been well understood. Reference [4]
explored many facets of the complex curing phenomenon to develop an understanding
for advancement of the state-of-the-art. More recently, Johnston [7] and Hubert [8]
focused on implementation of models of the curing mechanics incorporating material
cure characteristics so that these cure processes can be simulated using structural
analysis software MSC/NASTRAN®. An architecture of a cure process simulation
software called COMPRO® for modeling the composite cure process has been
implemented as described in references [9, 10] and the software operates on a database
of material cure characteristics, and utilizes sophisticated finite element software
ABAQUS® [11].
HEXCEL® IM7-8552 MATERIAL CHARACTERISTICS
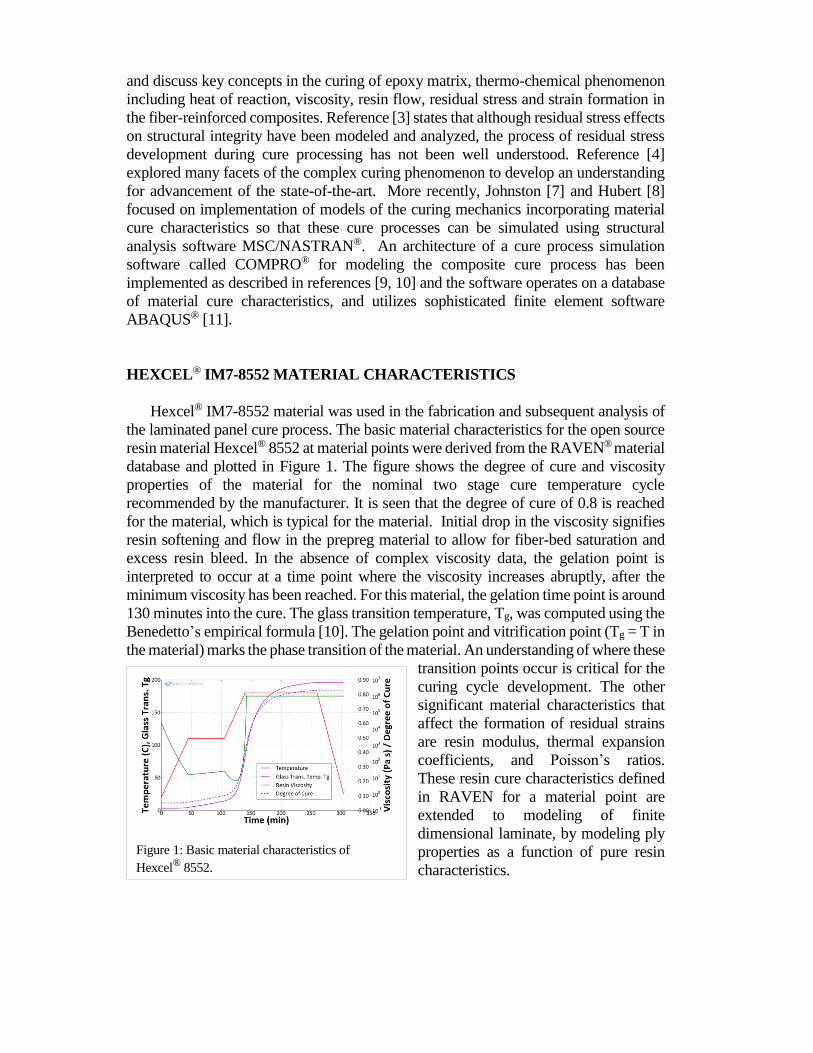
Hexcel® IM7-8552 material was used in the fabrication and subsequent analysis of
the laminated panel cure process. The basic material characteristics for the open source
resin material Hexcel® 8552 at material points were derived from the RAVEN® material
database and plotted in Figure 1. The figure shows the degree of cure and viscosity
properties of the material for the nominal two stage cure temperature cycle
recommended by the manufacturer. It is seen that the degree of cure of 0.8 is reached
for the material, which is typical for the material. Initial drop in the viscosity signifies
resin softening and flow in the prepreg material to allow for fiber-bed saturation and
excess resin bleed. In the absence of complex viscosity data, the gelation point is
interpreted to occur at a time point where the viscosity increases abruptly, after the
minimum viscosity has been reached. For this material, the gelation time point is around
130 minutes into the cure. The glass transition temperature, Tg, was computed using the
Benedetto’s empirical formula [10]. The gelation point and vitrification point (Tg = T in
the material) marks the phase transition of the material. An understanding of where these
transition points occur is critical for the
curing cycle development. The other
significant material characteristics that
affect the formation of residual strains
are resin modulus, thermal expansion
coefficients, and Poisson’s ratios.
These resin cure characteristics defined
in RAVEN for a material point are
extended to modeling of finite
dimensional laminate, by modeling ply
properties as a function of pure resin
characteristics.
Figure 1: Basic material characteristics of
Hexcel®
8552.

CURE PROCESS MODELING AND ANALYSIS SIMULATIONS
Cure process modeling and analysis of
laminated composite panels were performed on
two- and three-dimensional (3D) laminates to
understand the responses beyond the material
point. Analytical models of the cure kinetics,
resin chemical shrinkage, fiber-bed compaction
and resin flow in porous medium, deformation
and strain mechanics were studied in reference to
the physics of the laminate cure process. Model
parameters having significant influence on the
laminate cure responses were identified.
Parameters included temperature and pressure
gradients, heat flow, degree of cure and rate of
cure, resin viscosity, permeability, resin modulus,
fiber volume fraction, thermal expansion
coefficient, orientation, and number of plies. A
vacuum hot-press was chosen for the laminate curing process, which facilitated fiber-
optics strain sensor wires passage into the hot-press chamber. The recommended cure
cycle temperature and pressure in the hot-press were the same as for an autoclave.
Detailed studies were performed using two- and three-dimensional cure process
models of laminated panels, which were based on the finite element models of the
composite laminates, and the Hexcel® 8552 material cure characteristics. Analytical
models of the selected laboratory test cases of square panels made of Hexcel® IM7-8552
prepreg sheets of size 30.5 cm x 30.5 cm (12 inch x 12 inch) were setup using
COMPRO® and ABAQUS® software tools, so that simulations results from the analysis
can be compared with residual strain and warping response measurements during the
cure process. Cure process analysis simulations required through-the-thickness
modeling to capture the thermal heat transfer, fiber-bed compaction, and stress and
strains in the material using solid finite elements. The finite element models were
developed using four layers of solid hexagonal elements across the thickness of the
panel. The composite prepreg consisting of uniaxial, and cross-ply laminates with
[012/9012] and [+4512/-4512] layups were analyzed. The first set of cure process analyses
were performed using a plain strain two-dimensional (2D) model of the panel (Figure
2a). Although, the 2D model served to approximate the through-the-thickness
responses, a full 3D model of the laminate panels was required to capture the cure
response distribution across the panel surface (Figure 2b). However, the 2D plain strain
cure process model having much less number of solid 3D elements across the thickness
is computationally less intensive than the 3D cure process model of the full panel. The
3D model consisted of about 3000 solid elements and included a tooling assembly
consisting of top and bottom caul plates for the hot-press cure. Cure process response
computations involved sequential uncoupled analysis using the thermo-chemical model,
flow-compaction model, and residual stress and deformation models. Here, flow-
compaction and structural analysis were based on the pre-determined temperature
distribution in the part. Smeared layup properties were used for the heat transfer analysis
as well as for fluid flow analysis employing the porous solid elements of ABAQUS®,
whereas the structural analysis accommodated composite ply properties.
(a)
(b)
Figure 2: (a) Two-dimensional (2D),
and (b) three-dimensional (3D) models
of the panel cure process showing the
prepreg layup in tooling assembly.
Transient heat transfer simulation established the temperature responses during
the cure cycle over the surface as well as through-the-thickness of the panel model. The
degree of cure, viscosity response, and resin modulus variation during the curing cycle
were computed using the cure-kinetic models of Hexcel® 8552 resin. Selected heat-
transfer boundary conditions on the tooling surfaces allowed for heat conduction into
the prepreg material. The nonlinear friction contact surface interactions between the
contact surfaces of the prepreg material and the surfaces of the steel caul plate tooling
assembly were modeled in ABAQUS® with hard penalty constraints for “make or
break” in the contact mechanisms defined to operate within the shear stress limits of the
contact. Necessary boundary conditions were setup in the finite element models of the
prepreg and tooling assembly of the panel. The flow-compaction simulation was
performed to carry out the resin bleed and fiber-bed compaction in order to predict fiber
volume fraction distribution in the consolidated prepreg part, and to predict the
thickness of the laminate. The compaction model included specification of resin bleed
surfaces, which were the two short side edge surfaces of the 2D model, and were the
four side edge surfaces in the case of the 3D model. These models included the applied
compaction pressure load during the cure cycle. The structural deformation and stress
simulation included explicit composite layer definition of the part to simulate the
formation of residual stresses and strains during the cure cycle, and included the
temperature distribution to be applied
during the cycle, which was determined
in the previous simulation step of the
heat transfer analysis. The analysis
included “Tool-removal / Model
change” interaction conditions of
ABAQUS® to simulate tool removal to
get the final residual stress, strain, and
warping deformation of the
consolidated panel.
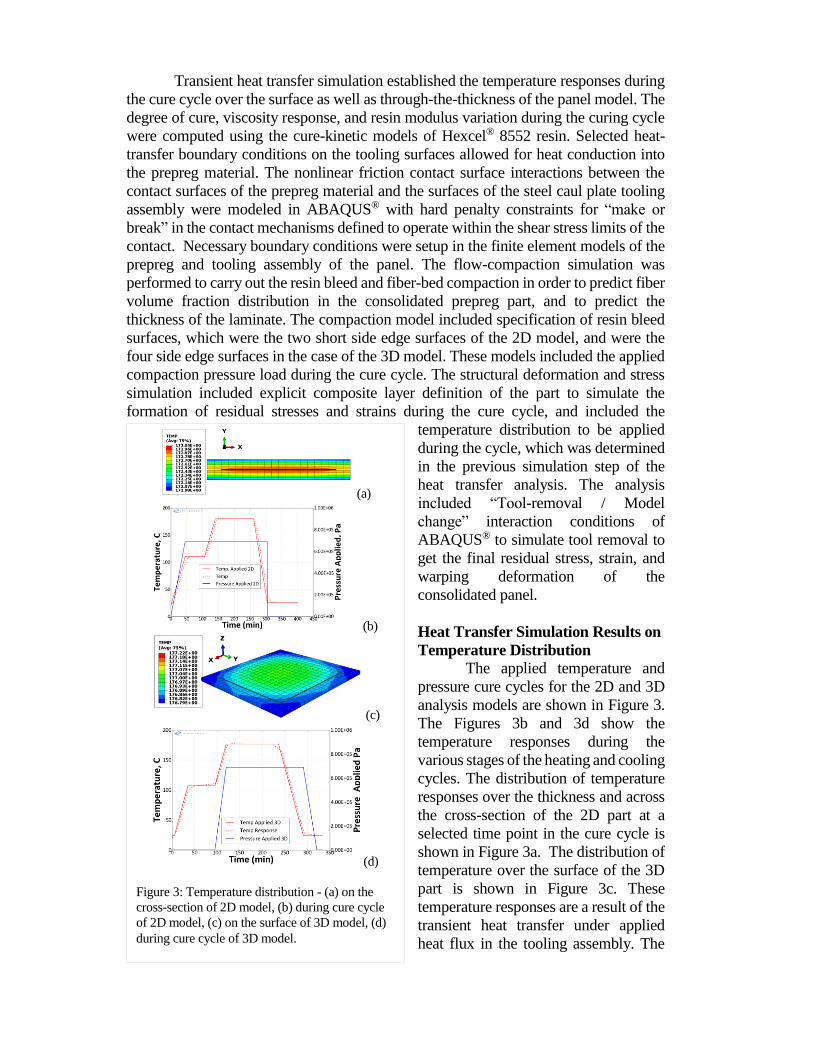
Heat Transfer Simulation Results on
Temperature Distribution The applied temperature and
pressure cure cycles for the 2D and 3D
analysis models are shown in Figure 3.
The Figures 3b and 3d show the
temperature responses during the
various stages of the heating and cooling
cycles. The distribution of temperature
responses over the thickness and across
the cross-section of the 2D part at a
selected time point in the cure cycle is
shown in Figure 3a. The distribution of
temperature over the surface of the 3D
part is shown in Figure 3c. These
temperature responses are a result of the
transient heat transfer under applied
heat flux in the tooling assembly. The
(a)
(b)
(c)
(d)
Figure 3: Temperature distribution - (a) on the
cross-section of 2D model, (b) during cure cycle
of 2D model, (c) on the surface of 3D model, (d)
during cure cycle of 3D model.
temperature response of the thin prepreg laminate essentially followed the applied
temperature (Figure 3), with little exothermic overshoots and little temperature gradient
over the part and tooling assembly. There were some basic differences in the modeling
of the 2D and 3D analyses regarding the applied temperature, applied pressure, and
incremental time-step inputs. Therefore, the temperature responses from these analyses
were different over the cure cycle as plotted
in Figure 4. The degree of cure and viscosity
responses computed for these models for an
element located at the center of the panel are
shown in the figure. These responses were
similar to the basic cure characteristics at a
material point. Minor variation of viscosity
over the surface existed at any given point
in the cure, but significant variation
occurred between consecutive time points
of cure. The spatial and temporal
distribution in the temperature
responses were used in the uncoupled
flow-compaction analysis, to estimate
the fiber volume fraction, compaction
strains, and compaction thickness of the
part. The cure shrinkage strain
responses that occur due to chemical
reactions will be discussed later along
with other thermal strains. The cure
shrinkage strain, compaction strains,
thermal strains, and formed the total
strain occurring during the cure cycle.
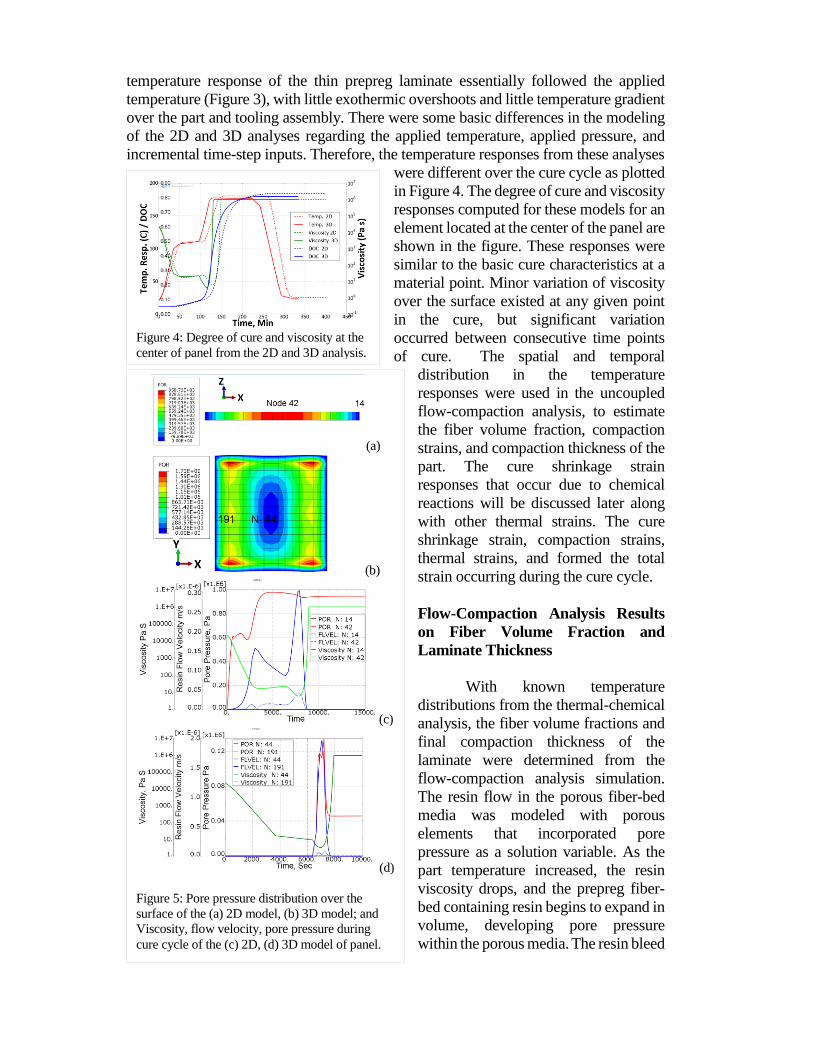
Flow-Compaction Analysis Results
on Fiber Volume Fraction and
Laminate Thickness
With known temperature
distributions from the thermal-chemical
analysis, the fiber volume fractions and
final compaction thickness of the
laminate were determined from the
flow-compaction analysis simulation.
The resin flow in the porous fiber-bed
media was modeled with porous
elements that incorporated pore
pressure as a solution variable. As the
part temperature increased, the resin
viscosity drops, and the prepreg fiber-
bed containing resin begins to expand in
volume, developing pore pressure
within the porous media. The resin bleed
Figure 4: Degree of cure and viscosity at the
center of panel from the 2D and 3D analysis.
(a)
(b)
(c)
(d)
Figure 5: Pore pressure distribution over the
surface of the (a) 2D model, (b) 3D model; and
Viscosity, flow velocity, pore pressure during
cure cycle of the (c) 2D, (d) 3D model of panel.
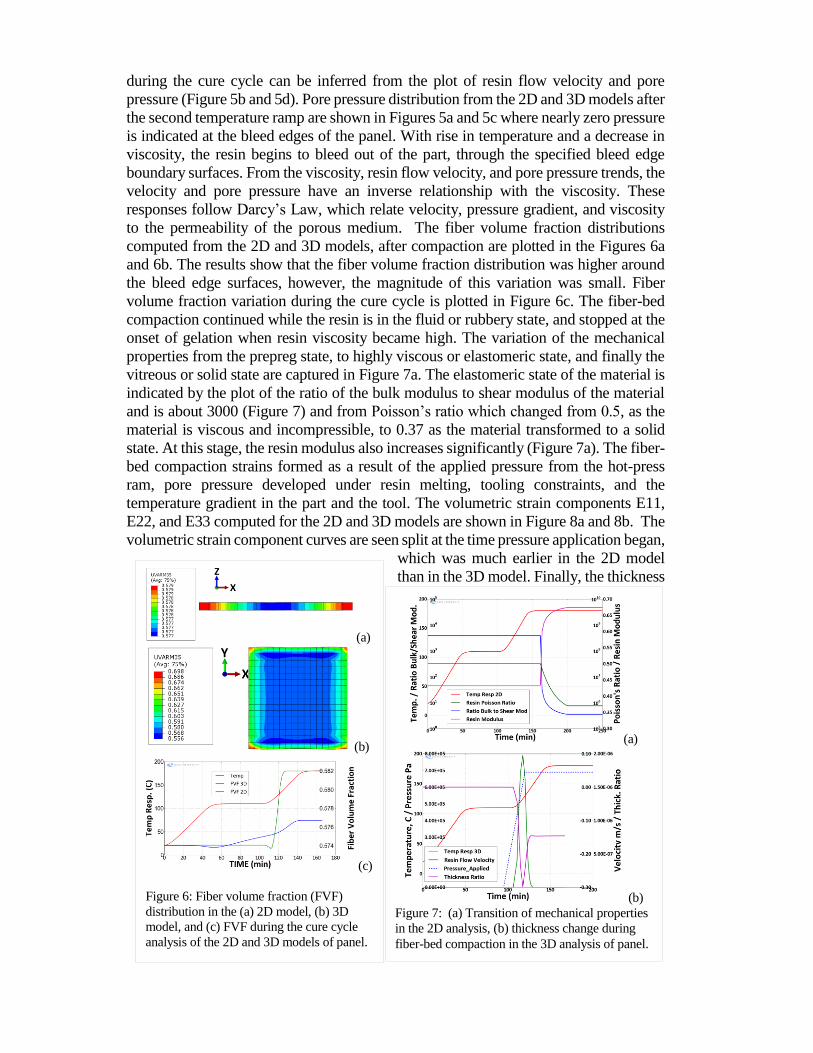
during the cure cycle can be inferred from the plot of resin flow velocity and pore
pressure (Figure 5b and 5d). Pore pressure distribution from the 2D and 3D models after
the second temperature ramp are shown in Figures 5a and 5c where nearly zero pressure
is indicated at the bleed edges of the panel. With rise in temperature and a decrease in
viscosity, the resin begins to bleed out of the part, through the specified bleed edge
boundary surfaces. From the viscosity, resin flow velocity, and pore pressure trends, the
velocity and pore pressure have an inverse relationship with the viscosity. These
responses follow Darcy’s Law, which relate velocity, pressure gradient, and viscosity
to the permeability of the porous medium. The fiber volume fraction distributions
computed from the 2D and 3D models, after compaction are plotted in the Figures 6a
and 6b. The results show that the fiber volume fraction distribution was higher around
the bleed edge surfaces, however, the magnitude of this variation was small. Fiber
volume fraction variation during the cure cycle is plotted in Figure 6c. The fiber-bed
compaction continued while the resin is in the fluid or rubbery state, and stopped at the
onset of gelation when resin viscosity became high. The variation of the mechanical
properties from the prepreg state, to highly viscous or elastomeric state, and finally the
vitreous or solid state are captured in Figure 7a. The elastomeric state of the material is
indicated by the plot of the ratio of the bulk modulus to shear modulus of the material
and is about 3000 (Figure 7) and from Poisson’s ratio which changed from 0.5, as the
material is viscous and incompressible, to 0.37 as the material transformed to a solid
state. At this stage, the resin modulus also increases significantly (Figure 7a). The fiber-
bed compaction strains formed as a result of the applied pressure from the hot-press
ram, pore pressure developed under resin melting, tooling constraints, and the
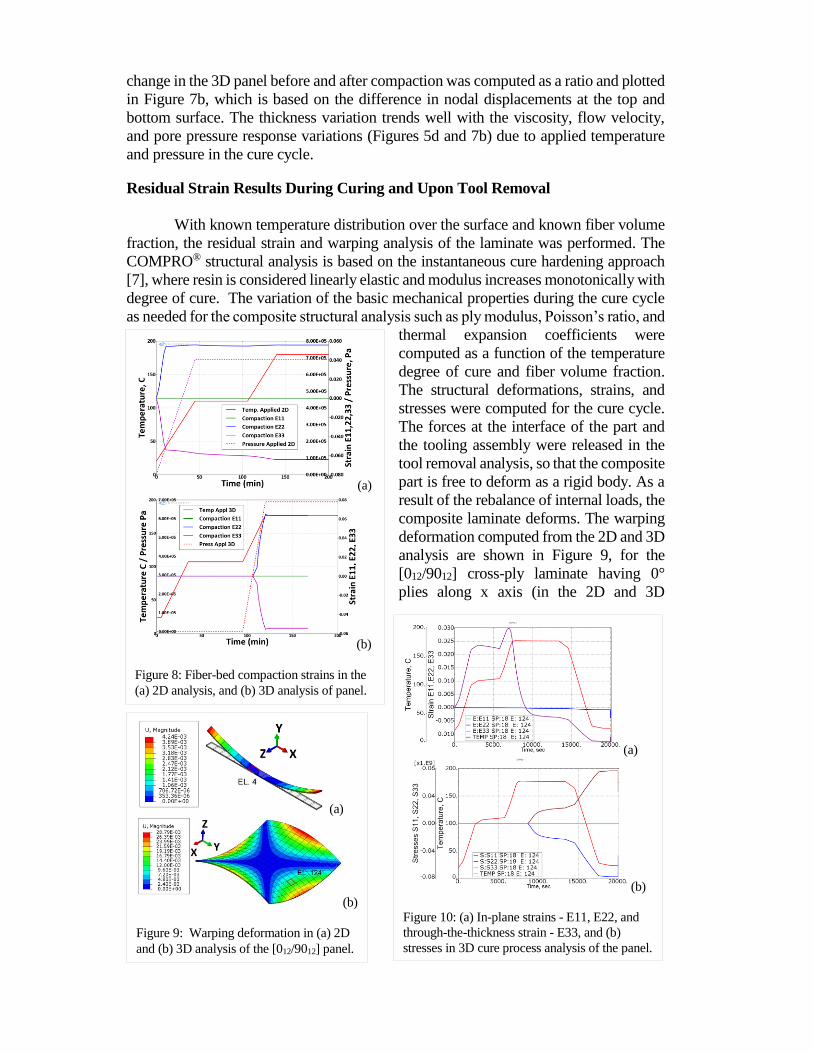
temperature gradient in the part and the tool. The volumetric strain components E11,
E22, and E33 computed for the 2D and 3D models are shown in Figure 8a and 8b. The
volumetric strain component curves are seen split at the time pressure application began,
which was much earlier in the 2D model
than in the 3D model. Finally, the thickness
(a)
(b)
Figure 7: (a) Transition of mechanical properties
in the 2D analysis, (b) thickness change during
fiber-bed compaction in the 3D analysis of panel.
(a)
(b)
(c)
Figure 6: Fiber volume fraction (FVF)
distribution in the (a) 2D model, (b) 3D
model, and (c) FVF during the cure cycle
analysis of the 2D and 3D models of panel.
change in the 3D panel before and after compaction was computed as a ratio and plotted
in Figure 7b, which is based on the difference in nodal displacements at the top and
bottom surface. The thickness variation trends well with the viscosity, flow velocity,
and pore pressure response variations (Figures 5d and 7b) due to applied temperature
and pressure in the cure cycle.
Residual Strain Results During Curing and Upon Tool Removal
With known temperature distribution over the surface and known fiber volume
fraction, the residual strain and warping analysis of the laminate was performed. The
COMPRO® structural analysis is based on the instantaneous cure hardening approach
[7], where resin is considered linearly elastic and modulus increases monotonically with
degree of cure. The variation of the basic mechanical properties during the cure cycle
as needed for the composite structural analysis such as ply modulus, Poisson’s ratio, and
thermal expansion coefficients were
computed as a function of the temperature
degree of cure and fiber volume fraction.
The structural deformations, strains, and
stresses were computed for the cure cycle.
The forces at the interface of the part and
the tooling assembly were released in the
tool removal analysis, so that the composite
part is free to deform as a rigid body. As a
result of the rebalance of internal loads, the
composite laminate deforms. The warping
deformation computed from the 2D and 3D
analysis are shown in Figure 9, for the
[012/9012] cross-ply laminate having 0°
plies along x axis (in the 2D and 3D
(a)
(b)
Figure 9: Warping deformation in (a) 2D
and (b) 3D analysis of the [012/9012] panel.
(a)
(b)
Figure 10: (a) In-plane strains - E11, E22, and
through-the-thickness strain - E33, and (b)
stresses in 3D cure process analysis of the panel.
(a)
(b)
Figure 8: Fiber-bed compaction strains in the
(a) 2D analysis, and (b) 3D analysis of panel.
models) and 90° plies along y axis (in the 3D model) or along z axis (in the 2D model).
The 2D model could only capture the cross-sectional warping of the laminated panel,
whereas the 3D model captured the complete deformation with double asymmetrical
curvature on the panel edges.
The strains developed during the cure and upon tool removal in the 3D analysis
are shown in Figure 10a, for the 18th ply, which is located in the 3rd element (no. 124)
from the bottom surface. The corresponding strains from the 2D analysis are shown in
Figure 11b, for the element 4 located at center of the strip. The through-the-thickness
strains from the 2D analysis were comparable to those from the 3D analysis. In the 3D
analysis, the in-plane strains E11 and E22, were compressive and an order of magnitude
lower than the through-the-thickness strain E33 during the cure cycle. Other details of
the in-plane strains from the 3D analysis will be discussed later. In the 2D analysis, the
in-plane strains were smaller by a factor of 2 compared to those from the 3D analysis.
In the tool removal time step (at 20,000 sec.), there was a rebalance of forces from the
tool and the part, which caused a significant change in the in-plane strains E11 and E22
(Figure 10a), which is seen as a sudden jump in the strain curve. The in-plane stresses
from the 3D analysis (Figure 10b) were comparable to those from 2D analysis (not
plotted).
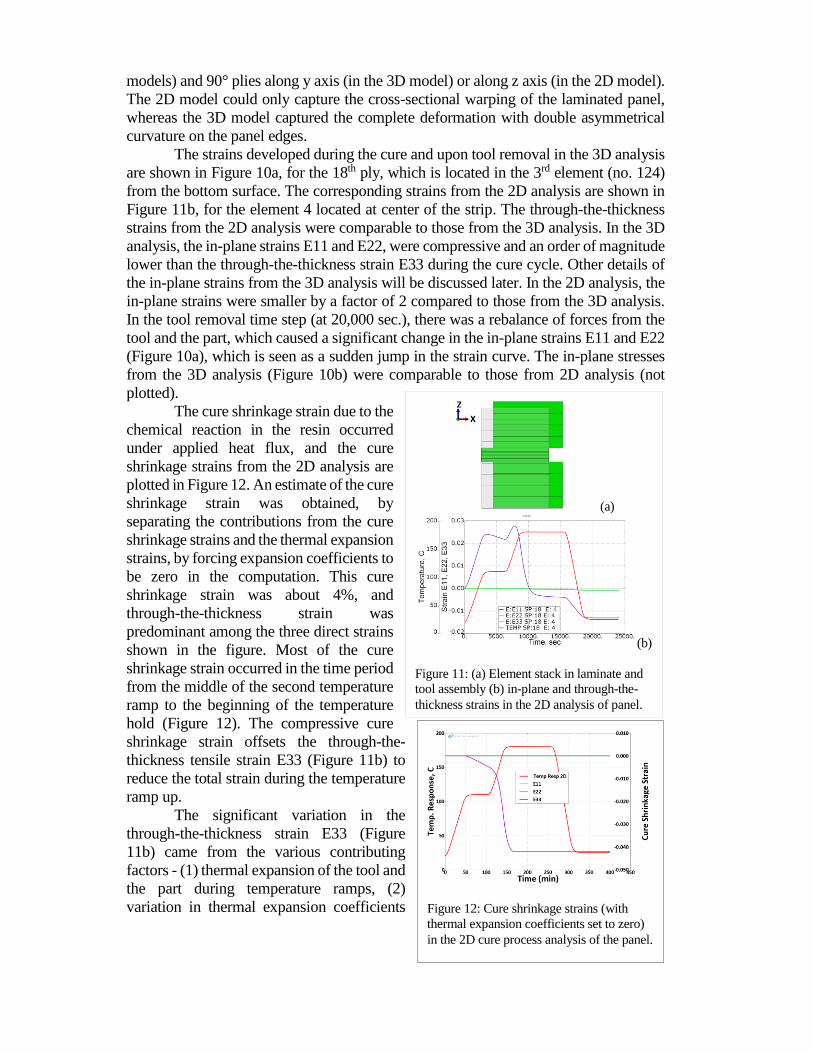
The cure shrinkage strain due to the
chemical reaction in the resin occurred
under applied heat flux, and the cure
shrinkage strains from the 2D analysis are
plotted in Figure 12. An estimate of the cure
shrinkage strain was obtained, by
separating the contributions from the cure
shrinkage strains and the thermal expansion
strains, by forcing expansion coefficients to
be zero in the computation. This cure
shrinkage strain was about 4%, and
through-the-thickness strain was
predominant among the three direct strains
shown in the figure. Most of the cure
shrinkage strain occurred in the time period
from the middle of the second temperature
ramp to the beginning of the temperature
hold (Figure 12). The compressive cure
shrinkage strain offsets the through-the-
thickness tensile strain E33 (Figure 11b) to
reduce the total strain during the temperature
ramp up.
The significant variation in the
through-the-thickness strain E33 (Figure
11b) came from the various contributing
factors - (1) thermal expansion of the tool and
the part during temperature ramps, (2)
variation in thermal expansion coefficients
(a)
(b)
Figure 11: (a) Element stack in laminate and
tool assembly (b) in-plane and through-the-
thickness strains in the 2D analysis of panel.
Figure 12: Cure shrinkage strains (with
thermal expansion coefficients set to zero)
in the 2D cure process analysis of the panel.
(CTE) of plies during cure, (3)
rebalancing of applied pressure load with
pore pressure development, and (4) resin
cure shrinkage strain. The strain increase
in the first 2500 sec. (42 min.) comes
from the thermal expansion, and peak of
this strain occurred between 6000 and
8000 sec. (100-133 min.). During the
temperature ramps, the tool plate and the
laminate expanded, both transversely and
laterally. As a result, there was a
significant lateral shearing of the
laminate, as depicted in Figure 11a,
which shows an instant of sheared cross-
section of the laminate and tool. This
shearing, coupled with contact friction
forces, contributed to the through-the-
thickness and in-plane strains. Further
change in the through-the-thickness
strain E33 occurred during the cool down
cycle and upon tool removal. Moreover,
there is coupling of the in-plane and out-
of-plane deformations brought by the
inherent asymmetry in the 012/9012 cross-ply panel. Additional results on the 3D model
will be discussed after describing the test cases.
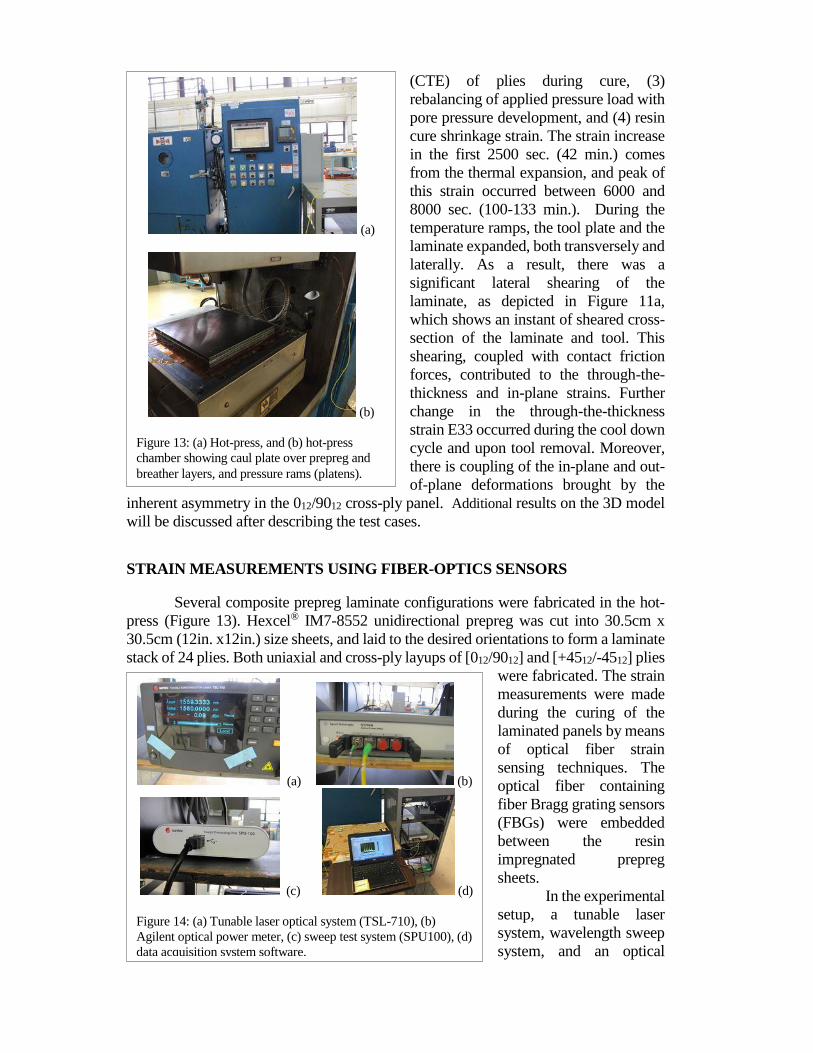
STRAIN MEASUREMENTS USING FIBER-OPTICS SENSORS
Several composite prepreg laminate configurations were fabricated in the hot-
press (Figure 13). Hexcel® IM7-8552 unidirectional prepreg was cut into 30.5cm x
30.5cm (12in. x12in.) size sheets, and laid to the desired orientations to form a laminate
stack of 24 plies. Both uniaxial and cross-ply layups of [012/9012] and [+4512/-4512] plies
were fabricated. The strain
measurements were made
during the curing of the
laminated panels by means
of optical fiber strain
sensing techniques. The
optical fiber containing
fiber Bragg grating sensors
(FBGs) were embedded
between the resin
impregnated prepreg
sheets.
In the experimental
setup, a tunable laser
system, wavelength sweep
system, and an optical
(a) (b)
(c) (d)
Figure 14: (a) Tunable laser optical system (TSL-710), (b)
Agilent optical power meter, (c) sweep test system (SPU100), (d)
data acquisition system software.
(a)
(b)
Figure 13: (a) Hot-press, and (b) hot-press
chamber showing caul plate over prepreg and
breather layers, and pressure rams (platens).
power meter were used to interrogate the spectral information from the embedded
FBGs. A change in wavelength response from the FBGs provided a measure of strain
at the embedded sensor location. The change of wavelength of an FBG due to strain and
temperature can be approximately described by the equation (1), where, Δλ is the
wavelength shift and λo is the initial wavelength. The first term accounts for impact of
strain on the wavelength shift, ε is the strain experienced by the grating, where pe is 0.24
as specified by the FBG manufacturer. The second term accounts for the temperature
effects on the wavelength shift, where αΛ is the thermal expansion coefficient and αn is
the thermo-optic coefficient. The coefficient specified for (αΛ +αn) is 7.5x10⁻⁶.
A Santec tunable laser (TSL-710,
Figure 14a) was used to create a narrow-
band light wave at a specified
wavelength. The light wave is passed to
the FBGs through a passive optical
circulator, which functions to direct the
wave from one port to another in a single
direction. Reflected light from the FBG
travels back through the optical circulator
into the Agilent optical power meter
(Figure 14b). The optical power meter
measures the wavelength dependent loss,
which is a ratio of the power of the
reflected light to the power of a reference
signal through an optical fiber without
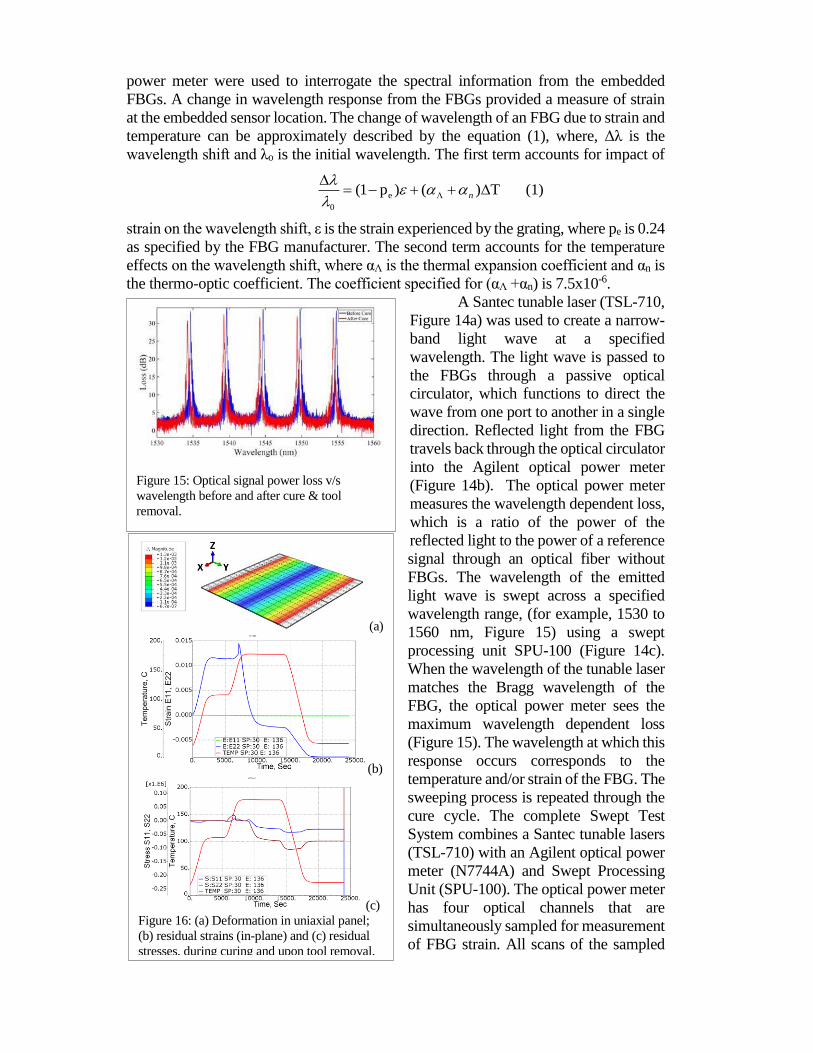
FBGs. The wavelength of the emitted
light wave is swept across a specified
wavelength range, (for example, 1530 to
1560 nm, Figure 15) using a swept
processing unit SPU-100 (Figure 14c).
When the wavelength of the tunable laser
matches the Bragg wavelength of the
FBG, the optical power meter sees the
maximum wavelength dependent loss
(Figure 15). The wavelength at which this
response occurs corresponds to the
temperature and/or strain of the FBG. The
sweeping process is repeated through the
cure cycle. The complete Swept Test
System combines a Santec tunable lasers
(TSL-710) with an Agilent optical power
meter (N7744A) and Swept Processing
Unit (SPU-100). The optical power meter
has four optical channels that are
simultaneously sampled for measurement
of FBG strain. All scans of the sampled
(a)
(b)
(c)
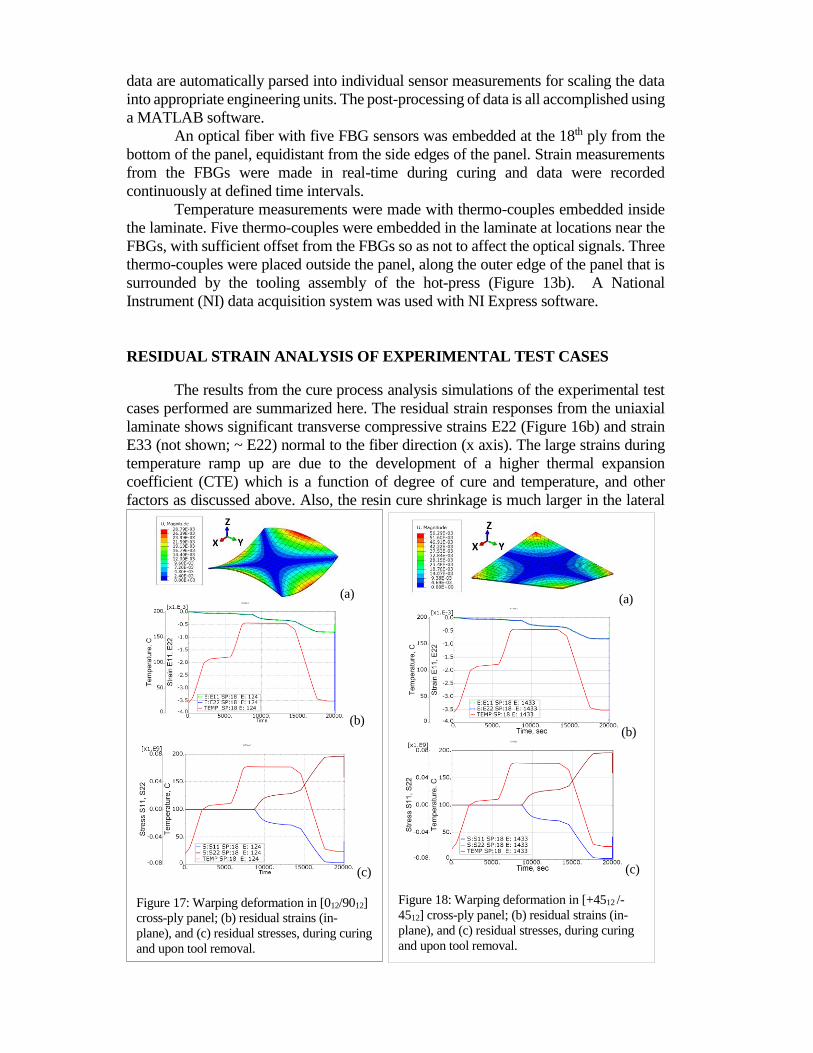
Figure 16: (a) Deformation in uniaxial panel;
(b) residual strains (in-plane) and (c) residual
stresses, during curing and upon tool removal.
(1) T)()p1( e
0
n
Figure 15: Optical signal power loss v/s
wavelength before and after cure & tool
removal.
data are automatically parsed into individual sensor measurements for scaling the data
into appropriate engineering units. The post-processing of data is all accomplished using
a MATLAB software.
An optical fiber with five FBG sensors was embedded at the 18th ply from the
bottom of the panel, equidistant from the side edges of the panel. Strain measurements
from the FBGs were made in real-time during curing and data were recorded
continuously at defined time intervals.
Temperature measurements were made with thermo-couples embedded inside
the laminate. Five thermo-couples were embedded in the laminate at locations near the
FBGs, with sufficient offset from the FBGs so as not to affect the optical signals. Three
thermo-couples were placed outside the panel, along the outer edge of the panel that is
surrounded by the tooling assembly of the hot-press (Figure 13b). A National
Instrument (NI) data acquisition system was used with NI Express software.
RESIDUAL STRAIN ANALYSIS OF EXPERIMENTAL TEST CASES
The results from the cure process analysis simulations of the experimental test
cases performed are summarized here. The residual strain responses from the uniaxial
laminate shows significant transverse compressive strains E22 (Figure 16b) and strain
E33 (not shown; ~ E22) normal to the fiber direction (x axis). The large strains during
temperature ramp up are due to the development of a higher thermal expansion
coefficient (CTE) which is a function of degree of cure and temperature, and other
factors as discussed above. Also, the resin cure shrinkage is much larger in the lateral
(a)
(b)
(c)
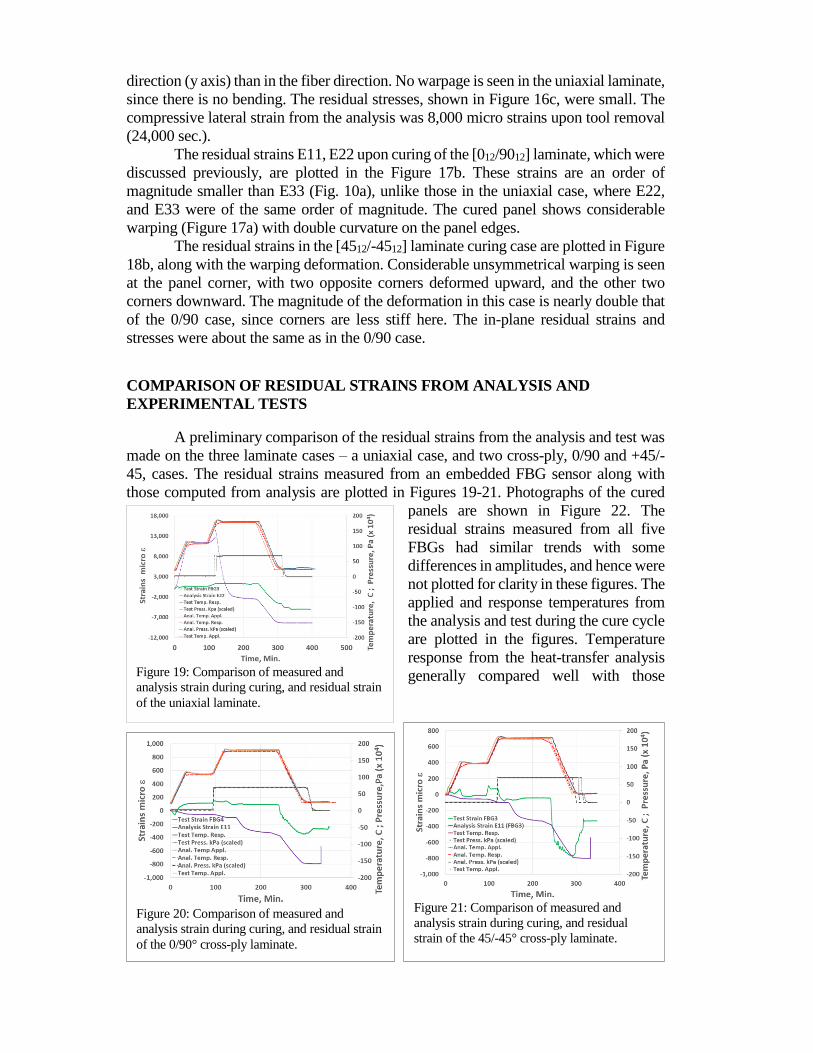
Figure 18: Warping deformation in [+4512 /-
4512] cross-ply panel; (b) residual strains (in-
plane), and (c) residual stresses, during curing
and upon tool removal.
(a)
(b)
(c)
Figure 17: Warping deformation in [012/9012]
cross-ply panel; (b) residual strains (in-
plane), and (c) residual stresses, during curing
and upon tool removal.
direction (y axis) than in the fiber direction. No warpage is seen in the uniaxial laminate,
since there is no bending. The residual stresses, shown in Figure 16c, were small. The
compressive lateral strain from the analysis was 8,000 micro strains upon tool removal
(24,000 sec.).
The residual strains E11, E22 upon curing of the [012/9012] laminate, which were
discussed previously, are plotted in the Figure 17b. These strains are an order of
magnitude smaller than E33 (Fig. 10a), unlike those in the uniaxial case, where E22,
and E33 were of the same order of magnitude. The cured panel shows considerable
warping (Figure 17a) with double curvature on the panel edges.
The residual strains in the [4512/-4512] laminate curing case are plotted in Figure
18b, along with the warping deformation. Considerable unsymmetrical warping is seen
at the panel corner, with two opposite corners deformed upward, and the other two
corners downward. The magnitude of the deformation in this case is nearly double that
of the 0/90 case, since corners are less stiff here. The in-plane residual strains and
stresses were about the same as in the 0/90 case.
COMPARISON OF RESIDUAL STRAINS FROM ANALYSIS AND
EXPERIMENTAL TESTS
A preliminary comparison of the residual strains from the analysis and test was
made on the three laminate cases – a uniaxial case, and two cross-ply, 0/90 and +45/-
45, cases. The residual strains measured from an embedded FBG sensor along with
those computed from analysis are plotted in Figures 19-21. Photographs of the cured
panels are shown in Figure 22. The
residual strains measured from all five
FBGs had similar trends with some
differences in amplitudes, and hence were
not plotted for clarity in these figures. The
applied and response temperatures from
the analysis and test during the cure cycle
are plotted in the figures. Temperature
response from the heat-transfer analysis
generally compared well with those
Figure 19: Comparison of measured and
analysis strain during curing, and residual strain
of the uniaxial laminate.
Figure 20: Comparison of measured and
analysis strain during curing, and residual strain
of the 0/90° cross-ply laminate.
Figure 21: Comparison of measured and
analysis strain during curing, and residual
strain of the 45/-45° cross-ply laminate.

measured using thermo-couples. The
temperature overshoot after the second
ramp was due to hot press temperature
control system enforcing applied
temperature on the part, and is not the
exothermal peak of reaction.
In the cross-ply laminate cases, the
FBGs were placed along the fiber direction.
The FBGs were placed at the 18th ply from
the bottom of the panel. In the uniaxial case,
the FBGs were placed normal to the fiber
direction, in a slit cut in the middle 6 prepreg
sheets so that fibers did not overlap the
FBGs, to minimize errors in measured strain when the fibers bend over the sensor wire
of larger diameter.
The residual strain curves plotted from the analysis and test results show that
they have a similar overall trend during the curing cycle. However, in the uniaxial case,
during the temperature ramp up, the residual strains from the analysis were significantly
large compared to test strains. In the uniaxial case, the residual strain that remained after
tool removal was about ~5050 micro strains in the test verses ~8000 in the analysis,
which are attributed to the resin contraction under cooling and resin cure shrinkage.
Reference [12] notes a residual strain of 4200 micro strain was measured in a 24 ply
uniaxial graphite epoxy laminate cured at 130° C. Also, reference [13], notes a strain
of 4960 micro strain at the end of curing of a pure epoxy of Bisphenol A-type EP at
170° C. The measured strain appear to be consistent with those noted in the references
[12, 13], although these cases are not directly comparable.
At this time, there was little indication on the exact causes for the variation
between the analysis and test strain. However, a few plausible factors that might have
caused the differences between the measured strain and predicted strain are indicated
here. Factors related to the analysis data include - high values of the resin modulus
corresponding to the low viscosity state, in the early stage of cure, causing significant
strain build up during the temperature ramp up in the uniaxial case; the lack of available
open source Hexcel® 8552 data on the resin modulus characteristics; coupling of in-
plane and high shear strains arising in the contact mechanism of the part and tool
assembly of the hot-press cure; and omitted contribution of compaction strains in the
total-strain.
Factors related to test include - slippage in the embedded FBG’s preventing
accurate strain measurements in the low viscosity state of the resin during the heating
cycle; slit cut across to embed FBGs normal to the fiber in the uniaxial case, which
could have prevented bonding of the optical sensor with adjacent material until the resin
solidified in the cure; and unverified coefficients to factor out FBG strain and
temperature components from the wavelength data of the FBGs.
Residual strain results from the test and analysis on the cure process of 0/90
cross-ply laminate are plotted in Figure 20. In this case, the residual strains measured
with FBG4 located at 0.1m from the panel edge were compared with the analysis strains
at element 124 (Figure 9b). The resulting analysis and test strain trends compare well
during the cure cycle, as well as during the tool-removal step, although the magnitudes
differed. Nevertheless, the magnitude of strain during temperature ramp up were much
(a)
(b)
Figure 22: Warpage in unbalanced cross-ply
laminates (a) 0/90°, and (b) +45/-45°
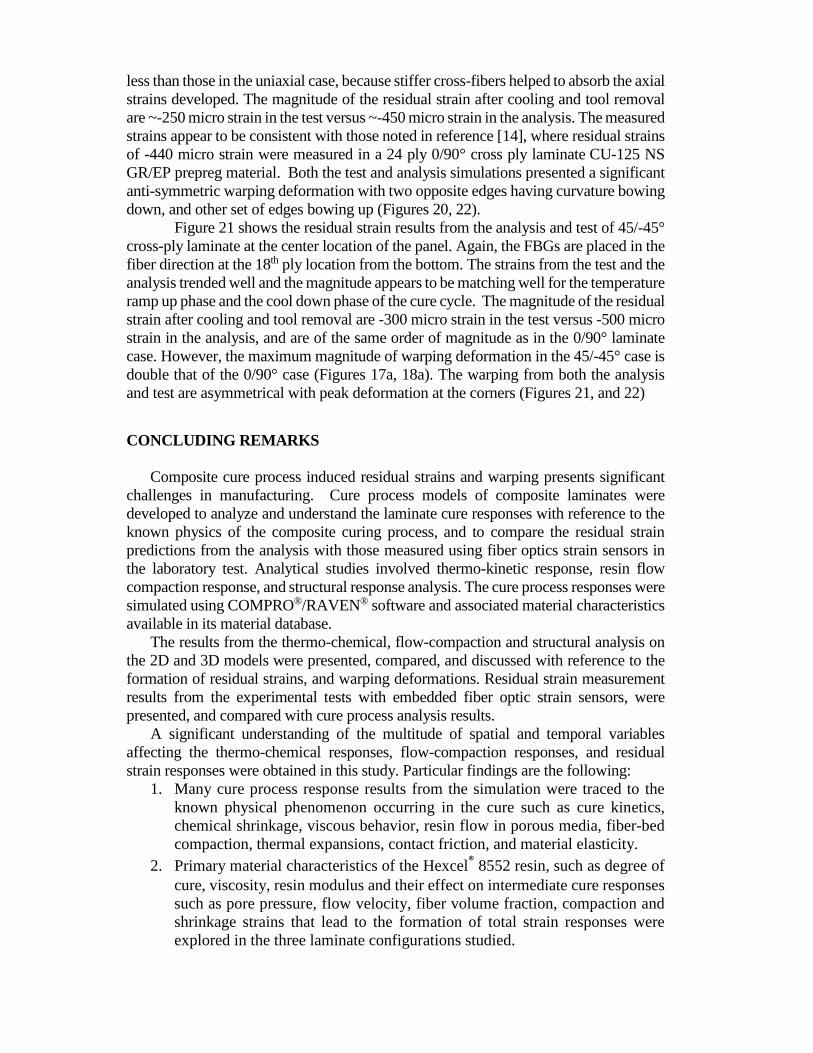
less than those in the uniaxial case, because stiffer cross-fibers helped to absorb the axial
strains developed. The magnitude of the residual strain after cooling and tool removal
are ~-250 micro strain in the test versus ~-450 micro strain in the analysis. The measured
strains appear to be consistent with those noted in reference [14], where residual strains
of -440 micro strain were measured in a 24 ply 0/90° cross ply laminate CU-125 NS
GR/EP prepreg material. Both the test and analysis simulations presented a significant
anti-symmetric warping deformation with two opposite edges having curvature bowing
down, and other set of edges bowing up (Figures 20, 22).
Figure 21 shows the residual strain results from the analysis and test of 45/-45°
cross-ply laminate at the center location of the panel. Again, the FBGs are placed in the
fiber direction at the 18th ply location from the bottom. The strains from the test and the
analysis trended well and the magnitude appears to be matching well for the temperature
ramp up phase and the cool down phase of the cure cycle. The magnitude of the residual
strain after cooling and tool removal are -300 micro strain in the test versus -500 micro
strain in the analysis, and are of the same order of magnitude as in the 0/90° laminate
case. However, the maximum magnitude of warping deformation in the 45/-45° case is
double that of the 0/90° case (Figures 17a, 18a). The warping from both the analysis
and test are asymmetrical with peak deformation at the corners (Figures 21, and 22)
CONCLUDING REMARKS
Composite cure process induced residual strains and warping presents significant
challenges in manufacturing. Cure process models of composite laminates were
developed to analyze and understand the laminate cure responses with reference to the
known physics of the composite curing process, and to compare the residual strain
predictions from the analysis with those measured using fiber optics strain sensors in
the laboratory test. Analytical studies involved thermo-kinetic response, resin flow
compaction response, and structural response analysis. The cure process responses were
simulated using COMPRO®/RAVEN® software and associated material characteristics
available in its material database.
The results from the thermo-chemical, flow-compaction and structural analysis on
the 2D and 3D models were presented, compared, and discussed with reference to the
formation of residual strains, and warping deformations. Residual strain measurement
results from the experimental tests with embedded fiber optic strain sensors, were
presented, and compared with cure process analysis results.
A significant understanding of the multitude of spatial and temporal variables
affecting the thermo-chemical responses, flow-compaction responses, and residual
strain responses were obtained in this study. Particular findings are the following:
1. Many cure process response results from the simulation were traced to the
known physical phenomenon occurring in the cure such as cure kinetics,
chemical shrinkage, viscous behavior, resin flow in porous media, fiber-bed
compaction, thermal expansions, contact friction, and material elasticity.
2. Primary material characteristics of the Hexcel® 8552 resin, such as degree of
cure, viscosity, resin modulus and their effect on intermediate cure responses
such as pore pressure, flow velocity, fiber volume fraction, compaction and
shrinkage strains that lead to the formation of total strain responses were
explored in the three laminate configurations studied.
3. During the heating cycle, large tensile strains E22, and E33 predicted in the
uniaxial laminate analysis were not captured in the test, and plausible factors
to trace these differences such as modulus, slippage of FBGs were identified.
4. Strain trends from the cross-ply laminate analysis mostly agreed with the test
as discussed previously, indicating the capability of the physics based cure
process models in predicting the residual strains.
In conclusion, this analytical and experimental study has provided insight into
bridging the gap between the known physics of the cure process and the use of cure
process simulation software and optical strain measurement techniques to understand
the development of residual strain responses in the curing of laminates in a hot press.
ACKNOWLEDGEMENT
The authors gratefully acknowledge technical discussions on the COMPRO®
and RAVEN® software with Mr. C. Lynam, Dr. A. Forghani, and Dr. A. Arafath, from
the Convergent Manufacturing Technology (CMT), Vancouver, BC, Canada.
REFERENCES
1. Lee, W.L., Loos, A.C., and Springer, G.S., “Heat of Reaction, Degree of Cure, and Viscosity
of Hercules 3501-6 Resin,” Journal of Composite Materials, Vol. 16, Nov. 1982.
2. Loos, A. C., and Springer, G.S., “Curing of Epoxy Matrix Composites,” Journal of
Composite Materials, Vol. 17, March 1983.
3. Kim, K.S., and Hahn, H.T., “Residual Stress Development during Processing of
Graphite/Epoxy Composites”, Composites Science and Technology, Vol. 36, pp. 121-132,
1989.
4. White, S.R., and Han, H.T, “Process Modeling of Composite Materials: Residual Stress
Development during cure. Part I. Model Formulation,”; “…Part II. Experimental Validation,”
Journal of Composite Materials, Vol. 26, No. 16, 1992.
5. Bogetti, T.A., and Gillespie, J.W., “Process-Induced Stress and Deformation in Thick-
Section Thermoset Composite Laminates,” Journal of Composite Materials Vol. 26, No. 5,
pp. 626-660, 1992.
6. Smith, G.D., and Poursartip, A.,“A Comparison of Two Resin Flow Models for Laminate
Processing,” J. of Composite Materials, Vol. 27, No. 17, 1993.
7. Johnston, A., Vaziri, R., and Poursartip, A., “A Plane Strain Model for Process-Induced
Deformation of Laminated Composite Structures,” Journal of Composite Materials, Vol. 35,
No. 16, 2001.
8. Hubert, P., and Poursartip, A., “Aspects of the Compaction of Composite Angle Laminates:
An Experimental Investigation,” Journal of Composite Materials, Vol. 35, No. 1, 2001.
9. COMPRO Common Component Architecture User’s Guide, Release 2.0, Convergent
Manufacturing Technologies Inc., Vancouver BC, Canada, August 12, 2008.
10. Introduction to COMPRO; Introduction to RAVEN; COMPRO Model Documentation,
Convergent Manufacturing Technologies Inc., Vancouver BC, Canada, 2014.
11. ABAQUS, The Abaqus software is a product of Dassault Systèmes Simulia Corp.,
Providence, RI, USA, 2013.
12. Kang H., Kang D., et al., “Cure Monitoring of Composite Laminates using Fiber Optic
Sensors,” Smart Materials and Structures, Vol. 11, pp 279–287, 2002. 13. M. Harsch, et al., “Influence of Cure Regime on the Strain Development in an Epoxy Resin
as Monitored by a Fiber Bragg Grating Sensor,” Macromol. Mater. Eng., Vol. 292, pp. 474–
483, 2007. 14. Kang H., Kang D., et al., “Simultaneous Monitoring of Strain and Temperature during and
after Cure of Unsymmetric Composite Laminate using Fibre-Optic Sensors,” Smart Materials
and Structures, Vol. 12, pp 29–35, 2003.