paper pnml 2 - old.eaap.orgold.eaap.org/previous_annual_meetings/2004bled/papers/pnml2.1... ·...
TRANSCRIPT

EAAP 2004
Paper PNML 2.1
[email protected] SCALE PIG FARMING SYSTEMS
OPPORTUNITIES & CHALLENGES
Sandra Edwards
School of Agriculture, Food & Rural DevelopmentUniversity of Newcastle
WHAT IS LARGE SCALE?
l Corporate ownership
– large no of animals per company
– may be over many sites
l Large herd size
– large no of animals per site
INTEGRATED PRODUCTION
USA 2000:
10 largest companies controlled ~20% of all breeding sows
(Hardy,1997)
HERD SIZES
0
20
40
60
80
100
<100 100-300 300+ >400 >500
UK (1) UK(2) UK (3)
0
2 0
4 0
6 0
8 0
1 00
<25 0 2 50 -50 0 5 00 +
USA
ECONOMIES OF SCALE
l Purchasing and marketing
l Spreading of overhead costs– automation of processes– specialist consultancy
l Logistics of production

IMPROVED ECONOMIC EFFICIENCYpurchasing power
Herd size 1-99 -199 -299 -399 400+
£/tonne
Sow feed 149 143 142 142 136
Grower feed 195 173 182 172 166
(PIC, 1998)
IMPROVED PRODUCTION EFFICIENCYlabour
Swine units (farrow to wean)
Enterprise size(litters)
<175 >175
Hours/litter 6.0 4.3
(Langemeier, 1997)
IMPROVED PRODUCTION LOGISTICS
l Large contemporary batch sizes– Dry sow housing: parity groupings minimal mixing– Farrowing: human supervision cross fostering
IMPROVED PRODUCTION LOGISTICSfarrowing
Control Humanintervention
Stillborn (%) 6.8 1.6
Died 0-24h (%) 5.2 2.5
Died 24h-weaning (%) 6.2 6.0
Total deaths (%) 18.2 10.1
(White et al, 1996)
IMPROVED PRODUCTION LOGISTICS
l Large contemporary batch sizes– Dry sow housing: parity groupings minimal mixing– Farrowing: human supervision cross fostering– Health management: all-in all-out site segregation– Nutrition management: phase feeding
IMPROVED PRODUCTION LOGISTICSall-in all-out
AI AOcleaned
AI AONot cleaned
Continuousflow
DLWG (g/d) 658 619 610
Viable bacteria(cfu/m3)
132 177 201
Dust(mg/m3)
1.80 2.31 2.51
(Cargill & Banhazi, 1998)

IMPROVED PRODUCTION LOGISTICSall-in all-out
AI AO Continuous flow
2-6 monthsDLWG (g/d) 768 705Days to market +7.6
% lung lesions 26 76
(Purdue University, 1997)
IMPROVED PRODUCTION LOGISTICSsite segregation
% of herds Small Medium Large
Separate nursery 35 45 75
Separate grow/finish 48 57 78
(USDA, 2001)
IMPROVED PRODUCTION LOGISTICSsite segregation
On site Off site
Day 12-21DLWG (g/d) 104 189 **Gain:feed .67 .98 **
Day 21-56DLWG (g/d) 433 506
**
Gain:feed .72 .76 *
(Patience et al., 2000)
Modelling Phase Feeding30-95 kg (Sept 02 costs)
Singlefeed
Twofeeds
Threefeeds
DLWG (g) 698 703 709
FCR 2.69 2.69 2.70
Feed cost(£/pig)
21.46 20.35 19.42
N excretion(kg/pig)
3.24 2.94 2.28
IMPROVED PRODUCTION LOGISTICSphase feeding
Small(<2,000)
Medium(2-10,000)
Large(>10,000)
% herds
Reduce N by dietmanipulation
7 17 40
Manure nutrientmanagement plan
19 67 91
(USDA, 2001)
IMPROVED PRODUCTION ?sow performance
Herd size 1-99 -199 -299 -399 400+
Pigs/sow/yr 19.1 21.8 22.1 22.1 22.3
Replacementrate (%)
31 40 49 46 53
(PIC, 1998)
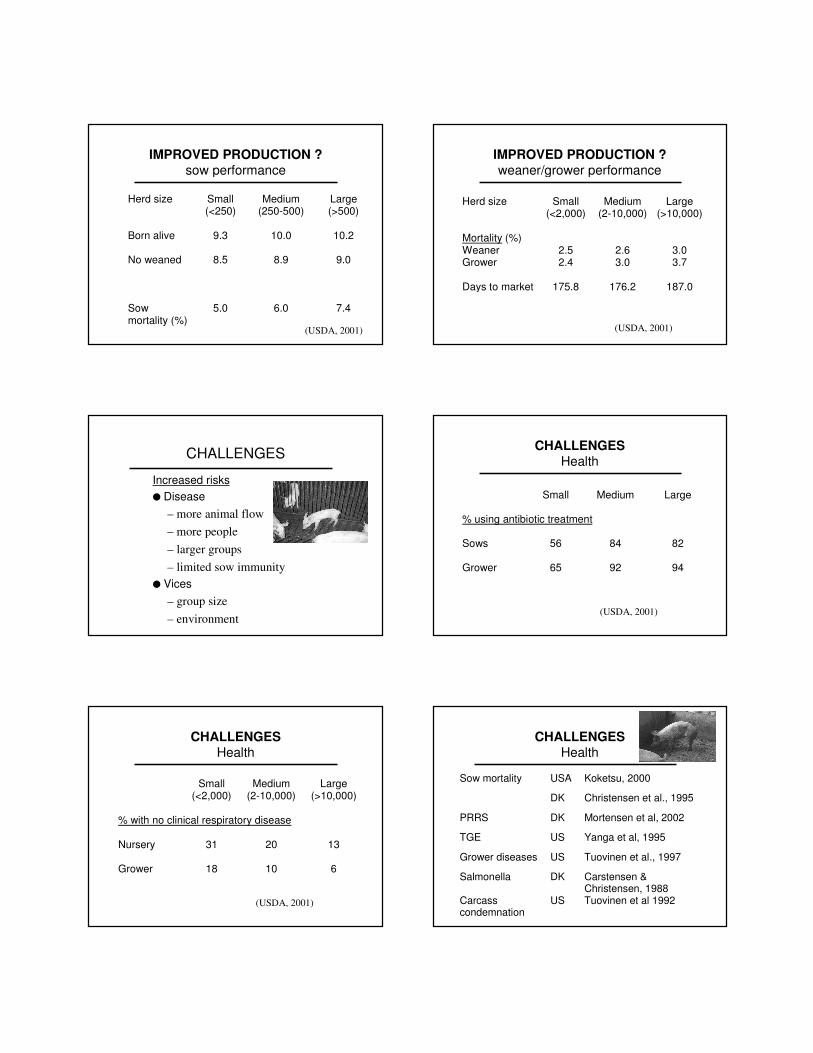
IMPROVED PRODUCTION ?sow performance
Herd size Small(<250)
Medium(250-500)
Large(>500)
Born alive 9.3 10.0 10.2
No weaned 8.5 8.9 9.0
Sowmortality (%)
5.0 6.0 7.4
(USDA, 2001)
IMPROVED PRODUCTION ?weaner/grower performance
Herd size Small(<2,000)
Medium(2-10,000)
Large(>10,000)
Mortality (%)Weaner 2.5 2.6 3.0Grower 2.4 3.0 3.7
Days to market 175.8 176.2 187.0
(USDA, 2001)
CHALLENGES
Increased risksl Disease
– more animal flow– more people– larger groups– limited sow immunity
l Vices– group size– environment
CHALLENGESHealth
Small Medium Large
% using antibiotic treatment
Sows 56 84 82
Grower 65 92 94
(USDA, 2001)
CHALLENGESHealth
Small(<2,000)
Medium(2-10,000)
Large(>10,000)
% with no clinical respiratory disease
Nursery 31 20 13
Grower 18 10 6
(USDA, 2001)
CHALLENGESHealth
Sow mortality USA Koketsu, 2000
DK Christensen et al., 1995
PRRS DK Mortensen et al, 2002
TGE US Yanga et al, 1995
Grower diseases US Tuovinen et al., 1997
Salmonella DK Carstensen &Christensen, 1988
Carcasscondemnation
US Tuovinen et al 1992

CHALLENGESVice
Tail biting(N=55)
Control(N=37)
Herd sizesows 421 199growers 2973 1764
No pigs/stockman
720 524 ***
(Moinard et al., 2003)
CHALLENGES
l Environmental impact– odour– noise– manure disposal
CHALLENGESEnvironment
l Nitrate Vulnerable Zones (Directive 91/676/EEC)– limits on N deposition/ha/annum
l IPPC (Directive 96/61/EC)– all units over 750 sows or 2000 finishing pig places
– implementation of Best Available Techniques
CHALLENGESEnvironment
Small(<2,000)
Medium(2-10,000)
Large(>10,000)
Odour complaints (% herds)
No complaints 99 95 87
>2 complaints 0.4 2 3
(USDA, 2001)
CHALLENGES
l Staffing– recruitment– retention– motivation
l Family labour v employed labour
CHALLENGESLabour
(Segundo, 1989)
Job satisfaction (%) <500 sows >500 sows
Very satisfied 65 48
Moderately satisfied 29 31
Dis-satisfied 6 21

CHALLENGESLabour
(English et al, 1992)
Source of dissatisfaction % of stockpeople
Attitudes of other workers 24
Management style 24
The work itself 12
The physical environment 10
CHALLENGES
l Public image– environmental impact– animal welfare– socio-economic impact– food safety
Factors influencingfood purchasing decisions
Factor % of respondents ratingas important
Family health 98Taste 97Conditions for animals 88Environmental concerns 88Price 82Production method 62
FSA, 2001
Factors influencingfood purchasing decisions
Factor % of respondents ratingas important
Prompted Unprompted
Family health 98 12Taste 97 18Conditions for animals 88 1Environmental concerns 88 2Price 82 46Production method 62 10
FSA, 2001
BALANCING CONSIDERATIONS
l Economy of scale
– costs– logistics
l Risks
– disease– staffing– environment– public perception
CONCLUSIONS
l Large-scale production givesadvantages of economy of scale
l Good animal and human managementis more critical
l Public image requires positive action