papers internationalsymposium polders of the world
TRANSCRIPT

Q%r • S
PAPERS INTERNATIONALSYMPOSIUM
polders of the world
Lelystad - The Netherlands - 1982
VOLUME III
LATE PAPERS
I
BIBLIOTHEEK DE HAAFF
DroevendaaJsesteeg 3a
[ 6708 PB Wagenden
in
^^S^ö
ISï-i-DLO stituut voor Bes- en UatuuronderzGC»
Postbus 23 6700 AA WAGENINGEN
INTERNATIONAL INSTITUTE FOR LAND RECLAMATION AND I IMPROVEMENT/ILRI P.O. BOX 45 - 6700 AA WAGENINGEN - THE NETHERLANDS 1982
EH EER
0000 0623 6778

These papers were received after closing date
The selection and presentation of material expressed in this publication are the responsibility of the authors concerned and do not necessarily reflect the views of the publishers.
© International Institute for Land Reclamation and Improvement ILRI, Wageningen, The Netherlands, 1982 This book or any part thereof must not be reproduced without acknowledgement.
ISBN 90 70260 778
Printed in The Netherlands

CONTENTS
POLDER PROJECTS
J.J. Sallaber. Open polder in the delta of the province of
Entre Rios, Argentina
LAND AND WATER MANAGEMENT ASPECTS
V.V. Dhruva Narayana and S.K. Kamra. Subsurface drainage for
saline soil reclamation 12
POLDER ASPECTS
G. Heerten. Modern technique in bank protection 22
M.Th. Radu. Hydraulic problems related to planning of
polders, solved by using programmable pocket calculators 34
SOCIO-ECONOMIC AND PHYSICAL PLANNING ASPECTS
H. Hengeveld. Land evaluation for urban development in
The Netherlands 44
, ,,„ 7.SCT.iU'JT VOOR NATUURBEHEER
PÜÓÏBUS 9201 6800 HB ARNHEM-NEDERLAND
ENVIRONMENTAL ASPECTS
W.J. Wolff and J.J. Zijlstra. Effects of reclamation of tidal
flats and marshes in The Netherlands on fishes and fisheries 57
W. Joenje. Nature in new wadden-polders conservation by
exploitation 68

OPEN POLDER IN THE DELTA OF THE PROVINCE OF ENTRE RIOS,
ARGENTINA
J.J. Sallaber
Instituto Nacional de Ciencia y Têcnicas
Hidricas, Buenos Aires, Argentina
Abstract
In the Delta of the Parana River there are 440,000 ha. with good possi
bilities for economic development, but subject to frequent floods. As a
possible solution, the idea of an open polder was devised, with a dam
50 km. long and two auxiliary canals to facilitate drainage and allow
for the outflow of rain water.
A Description of the Project Area
In the Argentine Republic (Map 1) the Delta of the Parana River is lo
cated at the confluence of the Parana and Uruguay rivers with the River
Plate (Map 2). The Parana river contributes with the greater proport
ion of sediments (6,000,000 tons/year). It comprises 1,800,000 ha. ext
ending from the city of Diamante up to the River Plate.
Its geographical center is located 170 km. from Buenos Aires. The area
is also known as the Delta of Entre Rios, because it falls under that
province.
Its geographical limits are: West - Cualeguay river; South - Parana
river with its branches Parana Ibicuy, Parana Guazu and Gutierrez;
East - Uruguay river and North - Provincial route up to the Médanos
Station and then the Southern watershed of the Ftancay stream.

SOLrviA f j
f> AC r r ie
OceAN
A RGENTIN£ * e PUBLIC
MAP 1 \

A.2 Geomorphology
The project area is a vast concave flatland with a scant S.E. slope of
low height compared to the rivers surrounding it. This flatland has
greater heights on the river banks, forming embankments which occupy
15% of the area and rise up to 1.50 m. above the natural terrain with
widths ranging between 10 and 100 m.
This configuration hampers the drainage of the land as normally required
by plantations during the rainy season and the extraordinary outflow re
quired by the floods.
There are other natural elevations formed by fixed sand dunes rising up
to 10 m. which are of great importance as they serve for the settlement
of works such as the Urquiza railway line.
The main rivers according to their importance are: the Parana river,
with its branches Parana Ibicuy, Parana Guazu and Gutierrez, the Uruguay
river and the Gualeguay river.
Within the project area we may mention the Paranacito river which origi
nates West of the project area and advances to the East toward the Uru
guay river.
There are other short streams flowing into the Uruguay river: Las Animas
Mosquito, Martinez, La Tinta, Sagastume, Baltasar, etc. The other rivers
found in the area are very short brooks of little importance.
At the mouth of these streams there are embankments. Most of the rivers,
specially those of little importance, are covered with vegetation, which
hampers the drainage even further.
A.3 Use of the land
Total population is at 14,000 inhabitants. The area with greater popula
tion density is that near the Uruguay river.
In the West, the main productive activity is extensive cattle breeding,
and some agriculture. In the East the predominant activity is extensive
forestry with cattle breeding as a supplement jointly with agriculture
and fruit growing. Forestry has favoured the installation of saw mills,
and cellulose and particle-board factories.

A.4 Soils
The soils are of the alluvial type, supported by a base of marine banks.
The final layers of the accumulated sediments which rise above the wa
ters are composed in the 0.70 m. closer to the surface of organic matter,
clay, slime and fine sand. Below one meter depth, the main component is
fine sand. These layers of clay and clayish sand are precisely those
which determine the low permeability for the infiltration of rain water
and also for lateral conduction. On the other hand, the chemical cha
racteristics of the soils make them fit for the development of vegetable
species, pasture, agriculture and forestry.
A.5 Climate
The weather is temperate humid, without dry season. The temperatures are
moderate due to the proximity with the ocean and the river environment.
The mean annual temperature is 17.6 °C with Summer means of 23°C and
Winter means of 9°C. Rainfall is regular, more intense at the beginning
of Autumn and end of Spring, with a monthly average of 100 mm which de
creases from June to August to 65 mm per month. The annual average is
1000 mm.
A. 6 Hydrology
The zone is subject to relatively frequent and extended floods (most of
them - and the most serious ones - due to the rise of the Parana river).
The advance of the waters is due to the spillage of the Parana Ibicuy
and Gualeguay rivers and the duration of the floods results from the
concave geomorphological configuration of the terrain and the insuffi
ciency of the rivers of the Entre Rios Delta to drain the waters. Local
rains may worsen the situation and the Southeasterly winds produce wind-
tidal floods from the River Plate and delay the drainage.
In the Uruguay river floods are not so frequent and less important.
The floods caused by each of the rivers have partial effects, but when
added together, as is the case under certain circumstances, they can

reach catastrophic magnitudes. This is not so much due to their height
(1.05 m. maximum in certain areas) or their velocity (5 km/day) as be
cause of their extension (which may cover the whole area) and their du
ration (up to several months with consequences persisting over a whole
year).
A.7 Waterbalance
The waterbalance shows there are annual deficiencies in the range of
14 mm. This deficit does not affect the growth of adult plants; however,
if it coincides with extended low water periods in the river, it may
cause the drying up of plantations of young trees.
On the other hand, the excess of water can reach important levels
(200 mm) due to the season in which it occurs (May to October). As this
is the period with the lowest water demand, with the lack of good infil
tration or superficial runoff, water accumulates covering the land.
B. Goals and strategies
B.l Reasons for impoldering
The floods cause social damages with the forced exodus of the popula
tion due to the flooding of housing and/or isolation; suspension of
school activities; interruption of family income derived from the lack
of economic activity and economic losses of young crops and forest plaii
tations and animals; forced removal of cattle to higher lands; impossi
bility to fell trees; lack of productivity of fields during and after
the flood; suspension of industrial and commercial activities; isola
tion of the area resulting from the barring of local roads.
B.2 New functions of the area
Solving the problem of the floods would allow for the maintenance of
the area's current function while promoting greater development.

B.3 The project as part of a regional plan
The project is part of an idea with a larger scope, consisting in the
impoldering of the whole Delta of the Parana river. But this river is
not regulated (Qm=16,000 m3/s and Qmax=25,000 to 30,000 m3/s) and it
would be very risky to carry out such a plan yet, because of the lack
of thorough studies. Before designing the hydraulic engineering pro
ject, it would be necessary to count with numerous and precise hydro-
logical data. There already are some polders and projects in the Delta
of the Parana river (see References).
C. Technical and economic feasibility
The work is considered to be technical and economically feasible. How
ever, the lack of sufficient data to develop a definite project prevents
its implementation. A rough cost estimate of the works is in the region
of U.S. dollars 20,000,000. It would therefore be necessary to create
a coordinating body to channel the efforts of all sectors and manage
the available economic and technical resources.
D. Design
To avoid the aforementioned damages, several general and partial pro
jects and studies were developed (see References). The project at hand
(Map 2) consists basically in the construction of a dyke starting from
the Medanos station in a NW-W direction on the current sand dunes line,
up to the point where their height decreases, and then SW up to the Pa
rana Ibicuy river. This dyke would have a lateral canal serving for
drainage and to provide filling material. The dyke would have a length
of 50 km. with a maximum height of 6 m. and 2.50 m. width at the top,
with a 1:2 to 1:3 slope and 50 to 100 m3 per linear meter. The dyke
would prevent the inflow of the water from the Parana and Gualeguay
rivers and to the West would leave an expansion area of 90,000 ha. for
the floods. The unprotected area is used nearly exclusively for cattle
breeding and when floods are about to occur, the cattle could be moved
to the other side of the dyke, i.e. to the protected zone.


The protected zone would become an open polder (an idea successfully
implemented in the Delta of the Orinoco river in Venezuela) protected
from the most important floods (Parana and Gualeguay rivers).
To improve the outflow of rain water and floods, the project includes
the construction of two auxiliary canals with a length of about 20 km.,
connecting the Paranacito river from the pointe of deflection of its
course toward the Uruguay and Parana rivers. It would also be necessa
ry to debrush the area and channel all the rivers and streams so they
may increase their capacity to the maximum, with the added benefit of
improving their navigation.
In some interior rivers it would be necessary to place gates and small
pumping stations to control the water level.
E. Management and operation
No studies or ideas have been put forth as yet, but it follows that
they should be under a coordinating body as mentioned in the last para
graph of point C, because the different tasks required in a multidisci-
plinary regional project necessitate the participation of various na
tional and provincial agencies, as well as private activities which
would otherwise hinder the type of dynamism required to tackle such a
project.
References
Studies and proyects
Diaz Marta, M; Sallaber J.J. and Friedman R. 1975. Desarrollo del Delta
de Entre Rios. Un problema hidrâulico y su posible soluciSn. VII Con
greso Nacional del Agua. Argentina. April 1975, pp. 75-89.
Marsan R.H. 1974. Endicamientos en el Delta. Boletîn de la Asociaciôn
Forestal Argentina, pp. 32-65.
INTA 1977. Estudio ecológico y socioeconómico del Delta Entrerriano. E£
tacion Experimental Agropecuaria Delta del Parana. Entre Rios. Argen
tina, 590 pp.
NEDECO. 1962. Reclamation proyects in the Parana River. NEDECO. The
10

Hague. Netherlands. 160 pp.
Completed polders along the Delta of the Parana River
Lechiguanas: 23.500 ha.- Mazaruca: 5.000 ha.- Don Ernesto: 500 ha.-
Tajber: 800 ha.- INTA: 56 ha.- Las Carabelas: 1.000 ha.- Don Antonio:
3.700 and 900 ha.- Victoria: 4.900 ha.- Don Mario: 575 ha.- Don Humber-
to: 720 ha.- Don Orlando: 1.970 ha.- Ipora: 800 ha.
11

SUBSURFACE DRAINAGE FOR SALINE SOIL RECLAMATION
V.V. Dhruva Narayana
Central Soil & Water Conservation
Research & Training Institute/
Dehradun, India
S.K.Kamra
Central Soil Salinity Research
Institute/ Karnal, India
Abstract
In India^ there are nearly 1.2 m ha of inland saline soils
which lie barren. An area of this nature, near Bidaj (30
km from Ahmedabad, India), was selected for reclamation by
construction of open seepage drains of 200 m spacing,
leaching the salt by ponding and adopting suitable crop
rotations. An experiment with closely spaced open drains at
15 to 25 m spacing (1.5 m deep on average) was also started
in June, 1978 in one of the critical areas (barren land) of
the farm. Changes in the salinity levels of soil and water
were monitored and salt and water balance analysis made.
Results of this study have indicated that this drainage
system reduced flood losses, the salinity in the soils and
the groundwater levels and increased the cultivated ares
and the crop yields. In the drainage experimental area,
the improvements were significantly higher in the area
having drains at 15 and 20 m spacings.
1 Introduction
In India, there are nearly 1.2 m ha of inland saline soils,
which lie barren and wait for some feasible reclamation
technology for their improvement. The Bidaj farm (30 km
from Ahmedabad on the Ahmedabad-Baroda highway) of the
12

National Dairy Development Board (N.D.D.B.), Anand, India
is one such area (with about 80 ha) whose productivity was
low due to high soil salinity and waterlogging conditions.
1.1 Soils and water quality
The soils of the Bidaj farm are heavy textured clay loams
(Narayana et al. 1981) and highly saline in nature. The
pH varied from 8.0 to 8.2 and EC varied from 7 to 32
mmhos/cm. The shallow ground waters are medium to high in
salinity (2 to 4.5 mmhos/cm) but at some depth (60-75 m),
the ground water with salinity in the range of 1.6 to 2.0
mmhos/cm are available.
2 Reclamation
The programme of reclamation (Narayana 1981) in this area
included the following measures s
a) construction of two main open drains and laterals at
200 m spacing;
b) systematic layout of fields with irrigation channels
at the head and the drains at the tail ends of each
field;
c) adoption of suitable crop rotations in the reclaimed
area.
To accelerate the desalinization of these soils« an experi
ment with closely spaced open drains at 15, 20 and 25 m
(1.5 m deep) was started in June, 1978 in one of the
fields, seriously affected by soil salinity.
3 Performance evaluation
Soil and water samples were collected during November, 1976
(for providing bench-mark data prior to reclamation) and
again from time to time after the reclamation was started.
Sampling was also done from the experimental area, where
closely spaced drains were provided. The extent of saving
13

in flood losses due to drainage In terms of farm inputs
and crop yields were recorded.
The performance of the drainage system and the relative
effect of drain spacing on the rate of soil amelioration is
also evaluated by monitoring the changes in the levels of
salinity of the soil profile and the water table.
3.1 Water and salt balances
The water and salt balances of the area are computed by
following the procedure outlined by Luthin (1957).
I + P = E + R + R O + W (1)
where« I = amount of irrigation water; P • amount of preci
pitation; E • amount of évapotranspiration; R « amount of
deep percolation; RO « runoff from the study area; and W •
change in the amount of moisture stored.
Z' « (IC. + PC + GC - RC ) x 10~5 (2) i p g r
where« C « salt concentration in ppm; i » suffix represent
ing the concentration of irrigation water; P » suffix
denoting precipitation; g = suffix denoting groundwater;
r » suffix denoting drainage water; and Z' - change in
salt content of the 100 cm of soil profile in tonnes/ha.
For this purpose« data were collected from the experimental
area with close spaced drains and also from the total farm
area at Bidaj. This analysis was conducted with suitable
assumptions for three periods viz. a) rainy season (June 15
to November 15), b) winter season (November 16 to March 31)
and c) summer season (April 01 to June 14).
4 Results and discussion
4.1 Flood losses
The drainage system installed on the farm have brought down
14

Plot H 142 (General area)
Nov. 76 Nov. 77 Nov. 78 Nov. 79 Nov. 80
Figure I. Change in soil salinity status—0-15 cm depth
-Plot H 142 (General area)
,25 m spacing
20 m spacing
Nov. 76 Nov. 77 Nov. 78 Nov. 79
Figure 2. Change in soil salinity status-1 m profile
Nov. 80
15

the flood damages from Rs. 133,000 In 1976-77 to Rs.66,000
in 1978-79 and Increased the corresponding cultivated area
from 28 ha to 42 ha (Anonymous 1979).
4.2 Soil improvement
The soil salinity in the lower depth ranges, that is below
30 cm, has been reduced by more than 50 percent of the 1976
levels (Figures 1 & 2).
In the experimental area (Table 1), the present values of
soil salinity, in all the treatments, are within the tolera
ble limits for crop production. However, the plots with
drains at 15 m spacing are relatively in better condition
followed by 20 and 25 m spaced plots.
4.3 Ground water
In 1976, the ground water levels in the November month
were almost near the surface. However, during September,
1979, the water levels were at a depth of 40 to 95 cm
below the ground level (Figure 3). Jon. Jul. Jan. Jul. Jan. Jul. Jan. Jul. Jan.
20 m spacing! 200 L-
Figure 3. Changes in water table levels in the plots with drains at different spacings
16

ld
«1
§ •p c
8 •p H (O m
<w o 0)
1 18 O) 0)
$ •o
•p
i c o w u (0
f o
•9
o 00 CT» H
<*H
• • • • • • • * i n v o c o t ^ c M C M e o a »
H c o m v O C T » C T > C M O
CT»
CT.
pH *• CM i-l
co
CO
co
CO
00
r» CT» CM H
CM CM
co
c M ^ c M t - v o H ' t f O
\o oo <o r- o H iH CM
co
00 f» CT.
CT.
CT.
CT.
00
in
CT. CM CM
o\ CT. H
00
in
ro
CM
CT.
CT.
00 in H
r» C M o\ CM
vO CO CO
CM
CO CO CM
<d •H •P •H c H
i n i n i n i n i n m c - r ^ • • • • • • • • r H r H H H H M O O O O c o c o c o c o c o c o c o c o
O O ü O O O O O
6 m
E o CM
id u
CM
C fl) I U O» * «> © G <d m 4 5 -H ^ a « m *d u o id >öco >ö
§ CT> 8 rH H
<U H 3 VO 4 (0 H > -P Id CT» CT» «0 > H h ß
CT.-H fl C H O - H fl> •H C M +> >i-H 0) • (d H » ^ !> H > i CO M ( O H O h « - H +> ß I CO +> C -WVO
O C Ö HCT. * - ' -H W O «H
£
K 0) (0
6 H (d
» 3J O H
ß H
S
•p
I U
l 0) n •
3} •O » S <u •O (O 0) •P w 3 <U
65
17

4.4 Water balance
The results of water balance analysis conducted for the
general farm area and those areas treated with drains at
different spacings are presented in Table 2. The values of
water surpluses in period 1 (rainy season) and 2 (winter
season) under different drainage treatments (15, 20, 25 m
spacings) do not differ very much. However, the water
deficits in period 3 (summer) differ within the drainage
value. These differences are due to the fact that no crops
are grown in the drainage experimental area while some
forage crops are grown in the general area during the summec
Further the water table situation which control the evapo
ration, particularly during summer (water deficit period)
also varied from treatment to treatment as shown by Figare 3.
4.5 Salt balance
The salt balance analysis, presented in Table 1, indicate
that maximum salt removal (nearly 15 to 16 tonnes/ha) takes
place in all the treatments during the monsoon season
(period l). During this period, on an average, about 500mm
of water surplus is leaching the salts through the soil
profile. On a rough estimate, from the leaching curves
(Narayana and Kamra 1981), this is sufficient to leach
nearly 40 percent (15.5 tonnes/ha) of the original salts
i.e. 38 tonnes/ha (Table 1).
In the winter season (period 2), there is slight increase
(4 tonnes/ha) in the salinity status in all the plots
because the ground water, containing about 1600 ppm, is
pumped out from deeper aquifers and applied as irrigation
water to various crops. It is in period 3 (the summer
season) that the effect of close spaced drains is reflected
on the salinity changes. In the general study area,
where the drains are spaced at 200 m and in the experiment
al area where the drains are spaced at 25 m, 6 to 8 tonnes/
ha of salt was added during period 3 because the water
table depth below ground level was less than 100 cm
(Figure 3). In the experimental area with 15 and 20 m

o C O H H Cv
Pi
CO
PS M
(O
m
+>
•H o m 0) fi (0
m «H o « o
A U 0 +> (0
CM
0 »H
•a
«0
u»
S3 OVH CM H 14
P*
VO
O CM
m m
co
H
vO vO VO t » ON OV Cft i H
vo vo m CM
ov en crv o Tj« Tj- TT CO * • * ^ CM
VOVO vo O co oo oo co VO VO VO ^ i
COCOO CM VO VOCH CM
HCM
co c i co CM 00 00 co o «? <<? <<* co
CO
o o o CO H CM
I I
o o o c o
o o oco CM CM
I I
O O CM f N H
o o o m vo * in 5i« N H H r t
O O O O
O O O m m o 5* CMH
o o o CO o o m o t O CMH
O O I O O
o o o o o o •<* CMH
00 00 CO CM t - c» r» CM in m m vo + + ++
o r» r> <̂ oo TC * * H
I I I
vo vo vo m m m m o HHftr-t
+ + + + 00 coco VO co co co CM co co co ^>
+ + ++ m in CM «* COCO H-tf
C M H I I I I
00 CO 00
+ + + $
vo vo va m m m m CA m m in * + + + +
u n w m 0 <0 +5 +) +J-Ö M O O O H • H e - I H H > 0 , 0 , 0 , 0 ( ^ I»
S O» 0» 0> <0 c a c v
• P o o o «J
& i0 (0 IÔ O, O, OiH
(O m B w n) > u 0 6 6 6 0 H i n o in 0 10 H CM CM 0
» 0 , 0 ( 1 1 )
U CMH 0 (0 •P » u (0 s V
H H O (0 (3 <O,Q CJwv-
<0 «0
o.gg'S 0 O H 5 •P CM 10 01 10 M
3 a 0 - ^ * - * T I h i D A Q
«1 G •H (0 u m
13 H H -H û O, u u u i o n (0 IÖ 10 0, Dt OiH >i n n m (0 H
M 0 E 6 S 0JÖ i n o u ï S ï H CM CM O ^
(0A O-O
19
spaced drains, the corresponding salinity build up was less
than 3 tonnes/ha. As a result, the rate of soil désalini
sation was much faster in the closely spaced drainage area
than in the area with widely spaced drains» However,
with proper management of rain water during rainy season,
it is seen that these soils can also be reclaimed gradually
even with widely spaced surface-cum-subsurface drains.
A comparison of the computed and observed values of sali
nity in the top one meter profile (Table l) during 1980
shows that the values agree well.
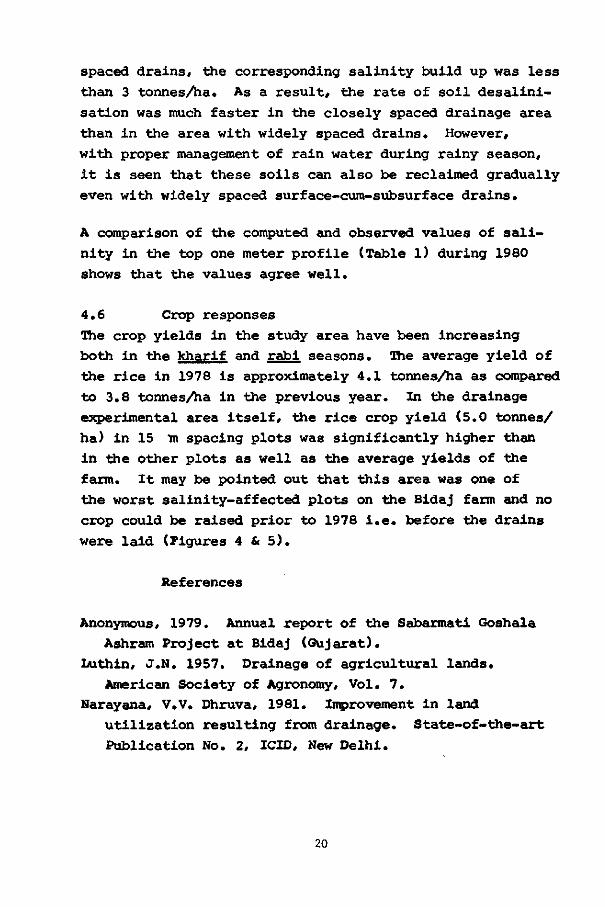
4.6 Crop responses
The crop yields in the study area have been increasing
both in the kharif and rabl seasons. The average yield of
the rice in 1978 is approximately 4.1 tonnes/ha as compared
to 3.8 tonnes/ha in the previous year. In the drainage
experimental area itself, the rice crop yield (5.0 tonnes/
ha) in 15 Tr» spacing plots was significantly higher than
in the other plots as well as the average yields of the
farm. It may be pointed out that this area was one of
the worst salinity-affected plots on the Bidaj farm and no
crop could be raised prior to 1978 i.e. before the drains
were laid (Figures 4 & 5).
References
Anonymous, 1979. Annual report of the Sabarmati Goshala
Ashram Project at Bidaj (Gujarat).
Luthin, J.N. 1957. Drainage of agricultural lands.
American Society of Agronomy, Vol. 7.
Narayana, V.V. Dhruva, 1981. Improvement in land
utilization resulting from drainage. State-of-the-art
Publication No. 2, ICID, New Delhi.
20

Figure 4. A view of the problem area before drainage
Figure 5. A view of the problem area after drainage
Narayana, V.V. Dhruva, I.P.Abrol and D.S.Thakur 1981.
Subsurface drainage for saline soils at Bidaj (Gujarat),
Indian Farming/ February/ 1981 issue.
Narayana* V.V.Dhruva and S.K.Kamra 1981. Studies on the
design and performance of drainage system for saline
soils af Bidaj, Gujarat. Annual Report, CSSRI, Karnal,
219 p.
21

MODERN TECHNIQUE IN BANK PROTECTION
G. Heerten
Naue Fasertechnik, Espelkamp, F.R. Germany
Abstract
In the last twenty years a rapid development in design and construction
of revetments could be observed. This paper will explain modern bank
protection technique using non-woven geotextiles and prefabricated
interlocking concrete blocks. Fundamentals of the application of geo
textiles also are presented including filtration properties and long-
term behaviour.
1 Introduction
Polders are deep lying marshlands being reclaimed from the sea.
Normally they are enclosed by dikes and intersected by drainage canals.
Therefore a lot of banks normally built up from soils in the range from
silty sands to clay have to be protected.
Modern bank protection technique has to fulfil the following require
ments considering the special polder conditions:
- optimum technical layout for long-term use and for minimizing the
maintenance cost
- approved installation technique for quick and safe installation
in the dry and underwater
22

- most favourable layout considering environmental aspects.
As a standard solution on the banks of dikes and drainage canals revet
ments were placed, built of a filter layer and a cover layer. The
filter layer has to stabilize the subsoil by a sufficient soil tightness
and permeability to water. The cover layer is an armour layer protecting
the revetment against the attack of waves, currents, ice and damage by
ships.
The development in revetment construction shows the growing use of
synthetic filter fabrics (geotextiles) as filter layers and of
prefabricated mattresses as cover layers.
Figure 1 for example is showing a construction method for bank protec
tion on large canals with traffic of sea-going vessels like the
Kiel-Canal or the Suez-Canal, recommended 1982 by the Working-Group 14
"Synthetic Materials for Underground Construction and Hydraulic
Engineering" of the German Society of Soil Mechanics and Foundation
Engineering
—
—
8
UI
s —
— •
1
.50-
3
—
8
8
- ' V ^ ' *
^"^ 1— Filtermatl
J * * ^ ^ '— Schwung durch
e
-Stat, nachzuweisende Aufhangung der Oeckschicht
Figure 1. Revetment construction for large canals, Zitscher (1982)
2
2.1
Revetment design
The filter layer
As mentioned above the filter layer in a revetment construction has to
23

stabilize the subsoil with a sufficient soil tightness and permeability
to water. Layers of sand, gravel or bushy twigs are traditionally used
but also with the use of synthetic filter fabrics (geotextiles) a good
experience of more than 20 years is given. Some results of the long-
term resistance of geotextiles in coastal engineering are given by
Heerten (1980).
2.1.1. Kinds of geotextiles
A lot of different synthetic filter fabrics are offered and we have to
distinguish woven geotextiles and non-woven geotextiles. Non-woven
geotextiles could be thermal bonded, resin bonded or needle-punched.
The properties of fabrics are very different, influenced by the polymer
properties and by the manufacturing process. For woven fabrics for
example we have to distinguish the kinds of threads (multi-filament,
mono-filament, tape threads), the kind of woving, the used polymer and
the finish (e.g. PVC-coating). Non-woven fabrics also are produced by
different polymers and we have to distinguish the method to obtain the
cohesion of the fibres or filaments.
Because of its high resistance against ultra-violet irradiation, high
specific strength and specific gravity the use of geotextiles produced
of polyester fibres is advantageous especially for under water in
stallation.
2.1.2. Mechanical properties of geotextiles
Selecting a geotextile for a given application the engineer has to
consider the fabric load and the fabric function. The requirements to
fabric strength, elongation, penetration resistance and buoyancy mostly
have to consider only the fabric loads during installation because these
loads mostly are sometimes higher than under regular conditions in the
revetment completed. In Table 1 some minimum values for the mechanical
properties of geotextiles in revetment constructions after guidelines of
the Federal Institution of Waterways Engineering (BAW, Karlsruhe) and
the Ministery for Nourishment, Agriculture and Forestry of NRW are given.
24

Table 1. Requirements to mechanical properties of geotextiles
Application
fabric weight
fabric thickness
fabric strength
Federal Institution for Waterways Engineering
(BAW) Inland and coastal waterways
3,5 to 6,0 mm (depending on revetment typ and sub soil)
>: 600 to 800 N (DIN 53858, depending on revetment typ)
Ministry for Nourishment, Agriculture and Forestry, Nordrhein-Westfalen
little rivers, creeks and ditches
woven non-woven
>: 200 g/m2 2r 250 g/m2
Z: 2,5 mm
> 1600 N ^ 300 N (DIN 53857) (DIN 53857)
in addition the BAW recommendations on puncture resistance, abrasion, strength at 50?ó elongation and filtration properties have to be considered
2.1.3. Filtration properties of geotextiles
After the workmanlike installation of filter and amour layer the long-
term working of the bank protection mainly depends on the filtration
properties of the filter layer.
The traditionally used filter materials like sand and gravel are dimen
sioned after the well known filtration rules e.g. from Terzaghi or the
U.S. Corps of Engineers. By this a coordination between the diameters of
the soil particles of the subsoil and the filter layer is given. In many
cases the filter on fine soils has to be built up from two or more
separat filter layers. Limited by the accuracy of installation technique
by underground construction work with heavy machines like excavator and
bulldozer the thickness of these filter layers has to be 20 cm minimum.
This minimum thickness is not given by the filtration rules mentioned
above but is given by experience of underground construction work. But
Wittmann (1981) showed that the thickness of a filter layer also is very
important for its working. Many of the filter layers designed by the
given filtration rules would fail having not the thickness of'filtration
25

length" of about 20 cm minimum. A filter layer of soil particles is not
working as a thin sieve but is working as a filtration body with a
given pore size distribution built up from all the soil particles of
the filter layer and the incorporated sub soil particles. The inter
action of the original sub soil and the soil particles of the filter
layer is very important for forming a stable, long-term working filter
layer.
Discussing the filtration properties of geotextiles we have to distin
guish the properties of woven and non-woven fabrics. The filtration
properties of woven fabrics are given by the mesh size or the fabric
openings. The woven geotextile is acting as a thin sieve. The filter
conditions could be stable with nearly all soil particles being larger
than the mesh size or unstable with nearly all soil particles being
smaller than the mesh size (Figure 2). This unstable conditions often
are given on sub soils in the range from silty sands to clay as they
mostly could be found in polders.
en g e o t e x t i l e
ament e.g. 0,03 n
Figure 2. Filtration characteristic of geotextiles
The filtration properties of non-woven geotextiles are influenced by the
fibre size, the fabric weight and thickness. Thermal bonded non-woven
fabrics are relatively thin and they would act nearly as a woven fabric
with irragular openings. Needle-punched non-woven fabrics are consider-
26

able thicker than all other types of geotextiles. Caused by the needle-
punching process the voids volume of needle-punched geotextiles is
about 85%. The filter conditions are comparable to soil-filter condi
tions (Figure 3). The interaction of fibres and soil particles is
forming a stable, long-term working filter layer. Own investigations
have confirmed these conditions (1981 and 1982). In figure 3 some data
of virgin non-woven fabrics (porosity n, permeability kn ) and of the
dug out fabrics (pore space clogged by soil, remaining porosity n',
remaining permeability kn ) are given.
fibres
soil particles
(porosity)
(permeability)
[m/s] Krc*n
Figure 3. Clogging of voids volume and decrease of permeability
of non-woven needle-punched fabrics
The estimated permeability of the clogged geotextiles is 5 to 12 times
higher as the measured soil permeability, which is in the range of
k~1,0 to 5,0 • 10~5 m/s. The remaining porosity of n'= 0,32 to 0,74
27

guarantees a sufficient long-term permeability. In contrast to these
results for most of the investigated woven fabrics a lower permeability
as given by the soil was estimated. The relation of the permeability of
the woven geotextiles and the permeability of the soils was in the
range of 0,16 to 1,8.
These results underline the advantageous filtration properties of
non-woven needle punched geotextiles.
2.1.4. Filtration rules for geotextiles
The effective opening size Dw (similar Ogg) and the permeability
coefficient kn are the main filtration parameters of geotextiles,
estimated in special laboratory tests (Heerten, 1981).
Dw required is given by filtration rules as a function of the particle
distribution curve of the soil and the load conditions. The filtration
rules to fulfil the sand-tightness are determined as follows
(Cu = uniformity dgn / d-jg):
a) non cohesive soils
static load conditions: Cu > 5 D w <10 • d̂ g
and Dw 4 dgg
static load conditions: Cu < 5 Dw< 2.5 • d5p
and Dw * dgn
dynamic load conditions: Dw < d^g
b) cohesive soils and all load conditions:
Dw < 10 • d5o and
Dw < dgg and Dw < 0,1 mm
Static load conditions are given by laminar flow including the change of
flow direction. Dynamic load conditions are given by high turbulent flow,
wave attack or pumping phenomenon.
In a second step the hydraulic conditions have to be controlled by esti
mating the permeability - reduction factor as described by Heerten
(1981, 1982). By this the interaction of soil and geotextile is
considered and hydraulic over-pressures in a revetment construction are
28

prevented.
2.1.5. Selection of geotextiles considering environmental aspects
A modern revetment design should be environmental friendly and the
banks should be greened over in a short time. It is a special advantage
of needle-punched geotextiles that the fibres remain moveable against
one another after the needle-punching process. By this a unhindered
growth of plants and their roots is guaranteed without changing the
filtration properties of the non-woven geotextile. The conditions by
using woven geotextiles are less advantageous because the roots will
stunt in a fixed mesh size (e.g. pvc-coated) or the filtration proper
ties will inadmissible change with a moveable mesh size.
2.2. The revetment armour layer
To protect the banks of rivers, canals and dykes against the attack of
waves, currents, ice and damage by ships the filter layer has to be
covered with an armour layer. Often these armour layers were built up
from riprap or grouted riprap. But a growing use of prefabricated matt
resses in revetment construction work could be observed.
A well known example of these new bank protection technique is the
"terrafix"-revetment system, built up from a needle-punched non-woven
geotextile and interlocking concrete blocks. The special shape of the
blocks, shown in Figure 4, with moulded-on conical pegs and correspon
ding holes guarantees an optimum interlock in horizontal and vertical
direction permitting tilt and rotation movements of the blocks and
keeping the whole revetment structure flexible. Due to the interlock
between the blocks, the weight per unit area of the system can be
reduced considerably in comparison to a heavy weight riprap layer, which
generally derivesits stability from the stone dead weight alone.
The "terrafix"-revetment can be installed in the dry, but however, a
special advantage of the system becomes apparent where underwater in
stallation is necessary. Block sections of 8 m in length and 4 m in width
have been installed by crane (Figure 5) and block sections of 15 m X 6 m
29

Figure 4. Interlocking concrete blocks of the "terrafix"-revetment
system
t t t t t t *
Figure 5. Installation of "terrafix"-block sections by crane
30

have been installed with a special floating barge (Figure 6).
The wires (stainless steel, coated wires) drawn in the block sections
are anchored at the crest of the slope forming a hanging revetment.
This hanging system eliminates the problems perhaps caused by low
friction forces between the revetment and the subgrade and in addition,
it ensures that adequate toe protection is provided which has been a
traditional prohlßna ia the revetment design.
Only a few vegetation periods are necessary to green over the
"terrafix"-revetment (Figure 7). Caused by the needle-punched non-woven
geotextile and the special joints between the concrete blocks aquatic
growth generally developes above and below the water level, also
encouraging the development of small marine life.
3. "terrafix"-Installation at Flevoland Polders
About 70.000 m2 of the "terrafix"-revetment system have been installed
on the banks of the Hooge Vaart and Lage Vaart at Flevoland Polders and
could be specified as follows:
a) filter layer
"terrafix"-geotextile, non-woven needle-punched polyester fibre
fabric, fabric weight 300 g/m2, thickness 3,1 mm, opening size
0,07 mm, permeability 5,7 • 10--5 m/s
b) armour layer
Naue interlocking concrete blocks, dimension 55 cm long, 17 cm wide,
8 cm high, weight of single block 16,5 kg, weight of armour layer
150 kg/m2, block sections 6,0 m long, 3,8 m wide, fitted out with
stainless wires 0 5 mm, block section weight 3700 kg
After the first installation of the "terrafix"-revetment system in 1979
in the meantime the interlocking concrete blocks are greened over in
the Flevoland Polder and the canal banks are well protected. The
"terrafix"-revetment system has proofed that all requirements on
modern bank protection technique are fulfilled.
31

Figure 6. Installation of "terrafix"-block sections by a floating barge
Figure 7. "terratix"-revetment greened over
32

4. Conclusions
The requirements on modern bank protection technique - minimizing,
installation and maintenance costs, quick and safe installation in the
dry and underwater, environmental friendly - lead to the development
of special revetment systems. The "terrafix"-revetment system a combi
nation of a non-woven needle-punched geotextile and interlocking
concrete blocks is an example for modern revetment design performing
all requirements mentioned above. More than 500.000 m2 "terrafix"-
revetment system are installed in Europe, USA, Canada and Australia.
References
Heerten, G. 1980. Long-Term Experience with the Use of Synthetic
Filter Fabrics in Coastal Engineering. Proc. 17th International
Coastal Engineering Conference, Am. Soc. Civ. Eng., March 23-28,
1980, Sydney
Heerten, G. 1981. Geotextilien im Wasserbau - Anwendung, Prüfung,
Bewährung -. Mitteilungen des Franzius-Instituts der Technischen
Universität Hannover, Heft 52.
Heerten, G. 1982. Dimensioning the Filtration Properties of Geotex-
tiles Considering Long-Term Conditions. Proc. 2nd International
Conference on Geotextiles, August 1-6, 1982, Las Vegas
Zitscher, F.-F. 1982. Empfehlungen für die Anwendung von Kunst
stoffen im Erd- und Wasserbau. Die Bautechnik, May/June 1982,
W. Ernst & Sohn, Berlin.
33

HYDRAULIC PROBLEMS RELATED TO PLANNING OF POLDERS, SOLVED BY
USING PROGRAMMABLE POCKET CALCULATORS
M.Th. Radu
Haskoning, Nijmegen, The Netherlands
Abstract
Backwater calculations are essential for any important polder project
and have to be accurate enough to provide a basis for comparing the
economics and the social implications of alternative designs.
Methods have been developed by which the capability of pocket calcula
tors, with limited functions, was used to compute the backwater effect
of the polder works.
1 Introduction
In many cases, as in those of polder projects elaborated by Haskoning
and Nedeco in Bangladesh, Morocco and Kenya, it was required to carry
out all studies in the respective countries, sometimes close to the
project site. Computer facilities to run mathematical models were not
always directly available to the designers.
Given the wide variety of possible effects of dyke systems on water le
vels during floods, a large number of alternatives had to be analysed
within a short period by quick calculations, using programmable pocket
calculators.
2 Calculation of the effects of flood control projects
In all the cases analysed in this paper the time of travel of the flood
peaks between both ends of the conveyance system under consideration was
3A

at least a couple of days, with an average speed of propagation of less
than 0,2 m/sec and a very slow variation of the river stages during
floods (less than 0,1 m per day).
For the above mentioned reasons, water surface profiles were computed
for steady discharges, equal to the peak flows of floods of some speci
fied frequencies.
Because the water depths were always greater than critical at all
points, calculations started at the downstream end of the study areas
and were carried back upstream until the water surface profiles with and
without project became almost identical.
According to the type of the watercourse, to be described below, two
methods of computation were used to determine the shape of the flow pro
files; namely the standard step method and the direct-integration one.
3 Main characteristics of the flood plains under study, sche-
matization and boundary conditions
Four different types of natural watercourses or artificial channels were
studied :
a A flat, broad and wide flood plain, where the main channel can be
hardly defined from maps which show contour lines. It was the case
of the Rharb Plain in Morocco.
b A broad and wide flood plain which shape could be fairly approxi
mated by a parabola, in case of the Garsen -Lango la Simba flood
plain in the Delta of the Tana River in Kenya.
c A rather narrow, flat and unsymmetric flood plain but with the
main channel highly incised. That is the case of the flood control
projects along the Atrai River, a tributary of the Brahmaputra
River in Bangladesh.
d Improved natural channels or artificial channels where it was
possible to define, with a fair approximation, reaches having a
constant cross section and grade.
35

In the first two cases the main problem was to define the cross sectio
nal areas which are effective in conducting the flow and to avoid re
gions where the water is quiescent or eddying.
When available, aerial photographs were used to draw the flow pattern,
as showed in Figure 1 and 2.
Figure 1 The flood plain of Rharb River in Morocco
Figure 2 The flood plain of Tana River in Kenya
When aerial photographs were not available, or when they covered only
part of the area under consideration, a flow net construction was used
to determine the flow pattern.
As a rule, the conveyance channels were divided into reaches ending at
sections where the width or the depth or both egin to increase or de
crease or where changes of roughness or bottom slope occur.
36

Roughness of the main channels was determined, from actual observations
when available, taken from streams in the area under study. However, the
roughness of the flood plains was in most cases estimated.
An example of flow pattern in case without project, during high floods,
is given in Figure 3.
/
/ V
Figure 3 Flood plain of Tana River in Kenya
4 The Standard Step Method
For the first cross section the total head line elevation for a given
discharge has to be known.
The water surface elevation in all but one cross section is obtained by
trial and error, matching the two values obtained for the elevation of
the total-headline calculated :
- by adding the flow velocity head to the water surface elevation
m
by adding the head losses along the reach under study to the ele
vation of the total-headline at the lower end of the reach (E ). s
It is assumed that no change of mass or momentum occurs between flow in
the main channel and the overbank flow.
37

The following equation is used :
(E ) . = (E ) . ± Ae , in m (1) m i s i
where i is the index number of the section and
Ae is the accepted error, in m.
The average friction slope over the reach under study is approximated by
taking the mean of the values computed at its both ends. If overbank
flow or if roughness varies with channel stages, the friction slope is
given by
Sf = (Q/ k ) 2 (2)
and t h e v e l o c i t y head i s c a l c u l a t e d f o r t h e average v e l o c i t y i n t h e main channel (V ) , as
m CIV2 / 2 g= (a /2g )S , (K / A J 2 (3)
m r m m where Q = d i s c h a r g e , i n m 3 / s ec
K = K + K, + K , i n m 3 / s ec m i r
K , K, , K = conveyances of the main channel, and of the left and m i r
right flood plain, respectively, in m3/sec.
When the Chézy formula is used.
K = CAR * , in m3/sec (4)
where C = the Chézy's coefficient, in m /sec
R = the hydraulic radius, in m
A = wetted area, in m 2
5 Programs for small calculators
Programs developed for the following calculator types : HP-67, HP-41c,
Ti-59, allow for calculation of the water surface profiles using the
standard step method along channels with compound cross sections, i.e.
main channel and flood plain. They can also provide, if desired, the
average velocity in the main channel and the distribution of discharges,
in case of overbank flow, over the main channel and the flood plain.
The programs use as much as possible the facilities of the calculators
for automatic data processing.
38

Depending on the storage capacity of the calculators, calculations can
be done more or less automaticaly. A trial value of the water surface
elevation has to be used for successive stations except the first one.
For HP-67 and Ti-59 all the calculations, including testing of the two
terms of the equation 1 for a given accepted error and the decision to
accept or to reject the results for a certain step calculation, are
automatic, but if the assumed value of the water surface elevation was
not correct a new trial value has to be used.
The values of the hydraulic properties, such as wetted area and hydrau
lic radius, have to be entered manually for each step, if the channel
cannot be schematized as an uniform one.
An example of such a program developed for a HP-67 calculator is given
in Figure 3.
In this specific case the flood plain was very flat and it was defined
only by the average bottom elevation on both sides (H , H ) , the average L R
width (B , B ) and the roughness (n ). Area-elevation data and hydraulic L R p
radius data for each section were calculated in advance only for the
main channel.
INITIATE 0 ST0A;0ST0E/ DEFINE ERROR/ a e STO 8 /
\ ENTERIWDj /
\ E N T E R / S T O R E qj . ln, , ) ; /
\ENTER<Ainli;IRm>i /
ALL t8: COMPU and OfsPLAY
C A U - ' ä ' -C - q M f f l&®
\ENTER(üp) | ; (B L ) i ; / \ H L ) i i l B R ^ ' H R ) i i /
\ CALL f8;C0MPUTE KL.KR
«KL-KR-Knilj and (s,!,
( DISPLAY [KL)j<KR)j andTsfl-, )
["COMPUTE IE,,)! |
( DISP'LAYTËJT)
/ ^ \ VES
\ ( \ 1
9 , CALLUS -1 / COMPUTE a , /
DISPLAY i f )
ENTERAL /
1 COMPUTEIEslj
1
( DISPLAY IE s l i )
( DISPLAY ISflj )
| STORE (Sfl, |
( DIsftLAYIEmlj )
| STORE (EmTn
1 STO A
^_
COMPUTE I Vmli
DISPLAY I VB)T~~)
X COMPUTEIO^Ii
3 1 Hitili )
COMPUTEtOplj
( DISPLAYIQpll )
0
Figure 4 Flow chart of a program for computing the water surface
profile for a channel with compound section 39

In other cases as that of backwater calculation for very large dischar
ges along the flood plain of the Tana River in Kenya, the cross sections
were fairly schematized as parabolas.
Each cross section was defined by the width of the channel at unit depth
(b) and by the bottom elevation.
The wetted area (A) and the wetted perimeter (P) are given by :
A = 2/3 b y1"5, in m2 (5)
P = M + (b2/8) In ((2y + M)/(B y " IT)), in m (6)
where M = (4 y2 + b2 y/4) 0 - 5 (7)
y = flow depth, in m
In this case, only one trial value has to be used for each cross sec
tion, because, if the difference between the two terms of the equation 1
is larger than the accepted error, the program allows for automatic new
trials using larger or smaller values for the water surface elevation
until the difference between the two terms of the equation will be less
than the accepted error.
6 Method of Direct Integration
When dealing with uniform channels having a constant slope or when natu
ral water courses can be divided in reaches where the cross section and
slope can be assumed uniform and the hydraulic exponents are determined,
the water surface profiles were sometimes determined directly by inte
grating the differential equation of the gradually varied flow. This
method affords a direct computation without need of successive steps.
In applying this method a serious draw back lied in the difficulty of
using accompanying tables.
Let us take the example of the equation developed by Bakhmeteff for a
channel with positive bottom slope.
S L/y = ((u -u )-(l-J) (P(u_,N)-F(u.,N)) (8) O o 2. 1 2 1
40

where L, y and S = length, normal depth in m and bottom slope, respec-o o
tively
u = dimensionless stage variable : (y/y )
y = depth of flow, in m
j = dimensionless quantity : (aC2S T/gP) , averaged over the o av
reach under study
a = Coriolis coefficient
C = Chézy's coefficient, in m /sec
T = top width, in m
P = wetted perimeter, in m
g = acceleration due to gravity, in m/sec2
F(u,N) = varied flow function : (- ç du )
o u -1
N = hydraulic exponent : (2 log (K /K )/log(y /y )) av o av o
K = conveyance calculated with the average depth (y ), in
m3/sec
K = conveyance calculated with the normal depth, in m3/sec.
In the past, the solution of this equation was found by the use of the
varied-flow-function tables, which gives values of F (u,N) for different
u and N. With the pocket calculators the values of the varied-flow-func
tion can be directly calculated in the following way :
By using series method we can integrate the varied-flow-function term by
term to obtain :
For u > 1 1-N 1-2N
F(U'N) = l = T + ^ r î + • • • <9>
For u < 1 N+l 2N+1
F(u,N) = u + + ̂ + . . . (10) N+l 2N+1
The number of terms to be used depends on the desired accuracy.
A special program was developed to calculate F (u,N) for any N and u,
for a HP41C pocket calculator.
41

Refering to values given by Ven Te Chow (1959) , up to 20 terms have to
be taken to get three significant figures if u is close to unity, say
u = 1.07 and not more than 4 terms if u is larger than 2.
When using a HP-41C, the longest series is calculated in not more than
25 seconds and the shortest one in less than 5 seconds.
Three main problems can be solved by using the method of direct integra
tion for a channel reach with given geometry and roughness and positive
slope :
a given channel discharge Q and flow depths in two consecutive sec
tions, 1 and 2, it is required to find the distance between 1 and
2 or the depth in a certain section situated between 1 and 2.
The computation is easy because the average value of the parameter
j and that of the hydraulic exponent N in the Bakhmeteff formula
can be calculated with the given information at both ends of the
reach under consideration,
b given channel discharge Q and only the depth at one end of the
reach under study, say y, it is required to find the other depth, s aY y9» at a distance L.
This case is more complicated because the flow depth at only one
end of the reach is know and the value of the hydraulic exponent
(N) and that of the parameter j in the Bakhmeteff equation can not
be calculated as before.
According to Chertousov (1957) the following procedure of computa
tion was used. We can write :
E = S L/y -(l-T)F(u.,N) + u. (11) o o 1 1
which value can be calculated assuming in a first approximation that y = y.
av Jl
and also
F(u2)=u2-(l-3)F(u2) = E (12)
and solving by trial and error the above equation for U , a first
value of y„ is obtained. This value is used to recalculate y and 2 av
the procedure is repeated until the desired accuracy is obtained.
A special program was written to perform these calculations.
c given the depths y and y at both ends of the reach under study
and its length L, it is required to find the discharge Q.
Because the discharge is unknown the equilibrium depth cannot be
calculated directly. 42

The equation of Bakhmeteff can be written
y ((u -u )-(l-f) (F(u ,N)-F(u1,N))=f(yo)=SoL, (13)
where S L is known, o
The equation f(y ) = S L has to be solved by trial and error and
after knowing the value of the equilibrium depth (y ) with the
desired precision, that of the channel discharge (Q) can been
easily found by using Chézy's formula.
The solution of such a problem is generally tedious if programm
able pocket calculators are not used.
7 Conclusions
In spite of the specific limitations of the programmable pocket calcula
tors, the combination of their internal logic and the external mathema
tical logic will enable the analysis of a wide variety of backwater
problems inherent in designing dykes and other flood protection struc
tures for polder projects.
References
1. Ven Te Chow, 1959, Open-Channel Hydraulics, McGraw-Hill Book Com
pany, New York
2. Chertousov, M.D., 1957, Hydraulics : Special Course, Gosenergoiz-
dat, Moskow
43

LAND EVALUATION FOR URBAN DEVELOPMENT IN THE NETHERLANDS
H. Hengeveld
Infra Consult, Deventer,
The Netherlands
Abstract
Applications of land evaluation procedures for urban development in The
Netherlands show that important information can be provided for planning
and design of urban extensions.
1 Introduction
A large part of The Netherlands consists of polderareas. The greater
part of the Dutch urban areas are located in polders in the western part
of the country. Soil conditions, watermanagement, natural and artificial
elevations and waterways have been the most important physical elements
in forming the spatial structure (Hengeveld et al., 1977; Lambert 1971).
Although the pre-urban cores were founded on higher, dry places with a
good bearing capacity, from mediaevel time on extensive engineering
works were necessary to make growth of the cities possible.
The necessity of extensive engineering works also exists today. The
total set of works is called bouwrijp maken (building-site preparation).
It includes:
a) earthworks
b) a subsurface drainage system
c) a sewersystem
d) a system of urban watercourses
e) pavement
44

f) green areas
g) foundation of buildings
In the polders, with a peat or claysoil and a groundwatertable mostly
above 0.50 m below surface, earthworks are necessary because:
- when driving over the soil, the permeability of the soilsurface in
wet conditions decreases to almost zero.
- under wet conditions the bearingcapacity of the soils are insuf
ficient to drive over it and to store materials.
Two types of solutions for this problem are applied:
the urban quarter is covered by a landfill with a 1 to 2 meter thick
layer of sand. A subsurface drainagesystem is installed.
- under paved surfaces and buildings a layer of sand is caried in a
digged groove. An intensive subsurface drainagesystem is installed.
The necessity of bouwrijp maken results in high costs of the new deve
loped urban land. Table 1 gives a rough indication of the resulting
costs. In 1981 about 20% of the total costs of a dwelling of about
f 110.000,— were costs to develop the land. During the last 15 years
the municipalties had to invest about f 2 * 10° per year in bouwrijp
maken, on a total investment of about f 10.0 x 1o" per years for the
total sector earthworks, road- and dikeconstruction and watermanagement
(prices 1982).
Table 1. Cost indication of bouwrijp maken in The Netherlands.
(f per hectare; 35 - 50 dwellings per hectare; prices 1982)
acquisition 50.000,— - 75.000,—
earthwork and
watermanagement 50.000,— - 250.000,—
pavement 150.000,— - 250.000,—
sewage system 100.000,— - 200.000,—
urban green 60.000,— - 100.000,—
large infrastructure works p.m.
foundation of dwellings 20.000,— - 400.000,—
45

The costcalculation of every plan is assessed by the Ministry of housing
and physical planning. In principle, the total costs of an urban exten
sion have to born by the plan itself. Only large infrastructural works
with functions for (a larger part of) the city are calculated by ratio
of use.
2 Land evaluation for urban development
Given the costs and costdifferences as mentioned in paragraph 1 it is
clear that to select the best location for new urban areas an assessment
of the existing situation of the soil and of the watermanagement is
desirable. Several systems are developed to assess data which are
gathered in a survey. These assessment systems are called land
evaluation. Land evaluation is defined as the process of assessment of
land performance when used for specific purposes, involving the execu
tion and interpretation of surveys and studies of land forms, soils,
vegetation, climate and other aspects of land in order to indentify and
make a comparison of promising kinds of land use in terms of applicable
to the objectives of the evaluation (FAO, 1976).
In a land evaluation procedure for urban development, the existing
situation of the soil and the watermanagementsystem is compared with the
requirements to meet for the buildingsite. The existing situation has to
be investigated in a soil-hydrological survey. Works are necessary to
abolish the limitations of the existing situation. These works differ
from place to place, seen on a regional scale as well as on a local
scale. These differences in works give differences in costs. As a cri
terium for the evaluation of potential locations for urban development
is used the costs of bouwrijp maken. To relate the costs of bouwrijp
maken to the data of the survey, it is necessary to have a frame of
reference, a standard, to measure the relative seriousness of the
limitation. The result is a map which indicates in one way or another
the capability of subareas in the planningarea for urban development.
The indication will be the costs per subarea. If the land evaluation is
a part of a more general potential surface analyses, the costfigures are
converted into a point-score, which can be combined with other scores
(Buchanan, 1978). Another reason for the conversion is to be free from
46
the actual amounts of money which, given the rough measure of detail,
have to be handled with care.
To measure the capability via the costs, the method of bouwrijp maken
has to be established for every subarea. Depending on the level of
detail, elements of the method of bouwrijp maken can be distinguished.
At the outset of a local plan one can distinguish general works and spe
cific works (Heidemij, 1979). General works have to be made over the
whole surface of the subarea . They are independent of a specific urban
design. Normally two groups of works are distinguished:
1) earthworks, leveling and groundwatercontrol
2) that part of construction of watercourses and sewage system that
depends on the soil
Specific works are related to a specific land use type within the urban
area and thus related to the urban design, e.g.:
3) foundation construction for dwellings
4) foundation for roads
5) earthworks for urban green
Working on regional level the bouwrijp maken is subdivided in less ele
ments because an urban design is not under discussion. An average urban
design can be used and specific works can be taken together.
The land evaluation is elaborated and illustrated with some studies done
in The Netherlands. A number of evaluations have been made during the
last ten years and described by Hengeveld (1982-a).
3 Land evaluation on regional level
The objective of the evaluation of regional level is to generate infor
mation for the selection of locations for new urban extensions. In the
polderarea between the rivers Waal and Meusse, the locations of new
urban quarters have to be selected (Grontmij, 1972). An urban quarter in
this study is defined as a micro-structure with low-rise houses and an
average land use of
- parcels for houses and gardens 45%
- urban green and water 30%
47

roads and paths 25%
average density 25 dwellings per hectare
With this average land use type two sets of limitations are
distinguished:
"soil and water"; the works to overcome this limitation are the
numers 1), 2) and 4) mentioned in paragraph 2.
"depth of sand"; the work to overcome this limitation is the
construction of the foundation.
To asses the limitation "soil and water", the soil map is simplified in
such a way that subareas are formed with a distinct difference in
costs for bouwrijp maken. This soil map is combined with data of the
level of groundwater, waterlevel in the polders, surface levels and a
geotechnical judgement of the Holocene deposits.
Summarized, it gives the frame of reference as shown in Table 2 together
with a costmap (figure 1).
Table 2. Frame of reference for the limitation "soil and water". Costs
of bouwrijp maken in f/hectare (prices 1972)
group 1 dry sand 128.000,-
group 2 wet sand 158.000,-
group 3 dry loam 140.000,-
group 4 moderate dry loam 156.000,-
group 5 wet loam 184.000,-
group 6 moderate dry heavy clay 170.000,-
group 7 wet heavy clay 191.000,-
group 8 wet heavy clay on peat 217.000,-
To assess the limitation "depth of sand" a map with the thickness of the
Holocene layers is made. Dwellings have to be founded on the underlying
Pleistocene layers. The frame of reference is given in Table 3.
48

Figure 1 Part of the costmap for the limitation "soil and water" for
urban development. The numbers are the groups of Table 1
Figure 2 Part of the land evaluation map for urban development. 1 indi
cates the cheapest terrain, 5 the most expensive
49

0,80
1,75
2 ,50
4 ,00
5,50
8,00
m
m
m
m
m
m
65 . 000 ,—
104 .000 ,—
124 .000 ,—
135 .000 ,—
141 .000 ,—
154 . 000 , - -
Table 3. Frame of reference for the limitation "depth of sand"; Costs of
the construction of the foundation in f/hectare (prices 1972)
group 1 average depth of foundation
group 2
group 3
group 4
group 5
group 6
The necessary works have to be designed and the costs have to be
calculated. The results are given in Tables 1 and 2.
The total result is a map with the costs of bouwrijp maken for every
subarea. In this planningregion the costs vary between f 260.000,— and
f 420.000,— per hectare (Fig. 2).
4 Land evaluation on local level
The objective of the land evaluation on local level is to generate
information for the urban design, that is for the location of land use
types as low rise houses, blocks of flats, roads, urban green, or any
other type of land use to be distinguished in the local plan. The proces
is the same as discussed in paragraph 3. In the example discussed here a
single-value costmap is made for every type of work mentioned in
paragraph 2 and in Table 4 (Heidemij, 1979). Table 4 gives the cost-
classes as distinguished in the planningarea for every type of work.
Figure 3 gives for a part of the planningarea some single-value
costmaps. For every type of land use a combined-value cost map has been
made depending on the desired surface use of the plan. In one of the
alternatives the surface of the area for low-rise houses exist of 23%
houses, 29% roads and 48% gardens and urban green.
50

Table 4. Frame of references for all limitations. Costs in f/m2
(prices 1979)
types of work costs
earthworks
watermanagement etc.
roads
5,10 9,21 9,76
4,25 9,25 8,25
13,75 21,50 1,00
foundation blocks of flats 270,00 305,00
foundation low rise houses 77,50 157,00 177,50
foundation bungalows 70,00 115,00 131,50
urban green 2,90 1,40 0,75
sports fields 3,20 2,95 5,70
5,75 13,00 20,50
Figure 3 Part of some single-value maps: a) foundation low rise houses,
b) roads. Costs in f/m2
51
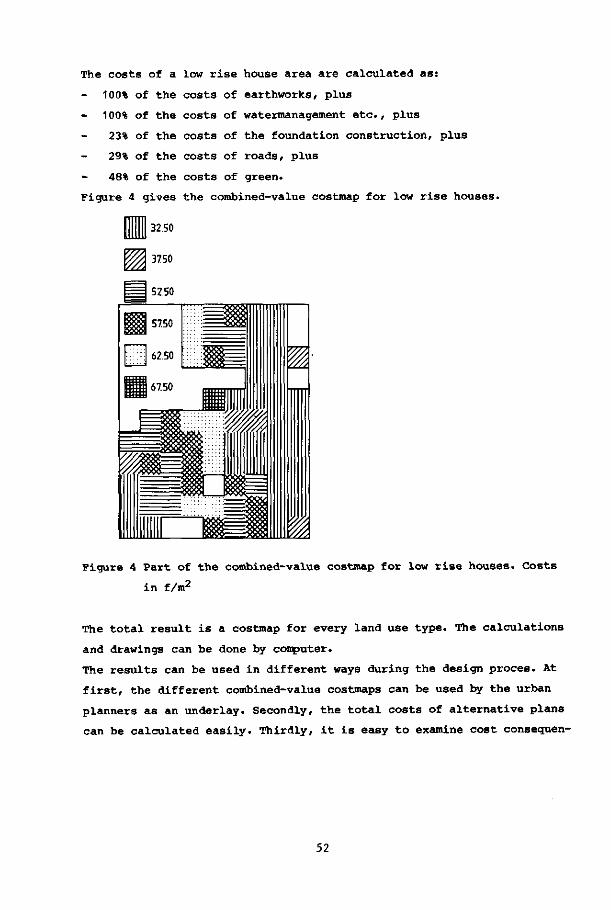
The costs of a low rise house area are calculated as:
100% of the costs of earthworks, plus
100% of the costs of watermanagement etc., plus
23% of the costs of the foundation construction, plus
29% of the costs of roads, plus
48% of the costs of green.
Figure 4 gives the combined-value costmap for low rise houses.
Figure 4 Part of the combined-value costmap for low rise houses. Costs
in f/m2
The total result is a costmap for every land use type. The calculations
and drawings can be done by computer.
The results can be used in different ways during the design proces. At
first, the different combined-value costmaps can be used by the urban
planners as an underlay. Secondly, the total costs of alternative plans
can be calculated easily. Thirdly, it is easy to examine cost consequen-
52

ces of changes in surface use. At last a plan with minimal costs can be
computed by a optimization program (Figures 5 and 6).
Besides the place-bound costs also the costs of infrastructure are very
relevant for urban planning. Threshold Analysis is a planning technique
which combines the land evaluation with the calculation of the cost of
infrastructure (Hengeveld, 1982-b).
6 Evaluation and conclusions
The land evaluation procedures as described in the paragraphs 2 to 5
hardly knows any methodological problems: they are simple techniques.
Problems can arise with the collection of adequate soil-hydrological
data versus costs. Applications on regional level cannot afford exten
sive surveys. In the Netherlands it proved to be possible to collect the
necessary information from existing maps and archives. Soil- and hydro-
logical surveys are necessary for local urban development anyway. When
the survey is done in the beginning of the planning proces a land eva
luation can be made without extra costs for a survey.
It can be concluded that a land evaluation generates important infor
mation for urban planning (Hengeveld, 1982-a). In the Dutch polder
situation, the costs of works depending on soil and water in a plan-
ningarea varies up to 300 % for different locations. The costs of
constructions of the foundations are 1 to 3 times as large as that of
the rest of the bouwrijp maken and they vary up to 300% for different
locations in regions of the polders. Also the costs of infrastructure,
utilities and management of the urban areas are considerable as well as
the variation in it.
53

Figure 5 Alternative with cost minimization with 9000 low rise houses
with a density of 36,4 dwelling/hectare. Total costs
f 132.000.000,—
54

Figure 6. Alternative with costminimization with 9000 low rise houses
with a density of 49,5 dwellings per hectare. Total costs
f 116.700.000,—
55

Buchanan 1978. Midden Randstad Study, Volume V. Plan area models,
Den Haag.
FAO 1976. A framework for land evaluation. Soils Bulletin no.32, FAO,
Roma.
Grontmij 1972. Bodemgeschiktheidsbeoordeling voor woningbouw in het
stadsgewest Nijmegen.Zeist.
Heidemij 1979. Bodemkundig-hydrologisch onderzoek ten behoeve van het
bouwrijp maken van Tolberg-Roosendaal, Arnhem.
Hengeveld, H., J. Luijendijk, and J. v.d. Kley 1977. Effects of urbani
zation on watermanagement in the western part of The Netherlands.
Proc. of the Amsterdam Symposium, October 1977, Effects of Urbaniza
tion and Industrialization on the Hydrological Regime and on Water
Quality. IAHS-AISH Publ. No. 123, pp 500 - 513.
Hengeveld, H. 1982-a. Land evaluation for urban development in The
Netherlands. Proc. of the Planologische Discussiedagen, Amsterdam,
mei 1982. DUP, Delft, pp 287 - 301 (in Dutch).
Hengeveld, H. and C. de Vocht (eds.), 1982-b. Role of water in urban
ecology. Urban ecology, 6 (1981/1982) Special Issue. Elsevier,
400 pp.
Lambert, A.M. 1971. The making of the dutch landscape; a historical
geography of the Netherlands. Seminar Press, London.
56

EFFECTS OF RECLAMATION. OF TIDAL FLATS AND MARSHES IN THE
NETHERLANDS ON FISHES AND FISHERIES
W.J. Wolff
Research Institure for Nature
Management, Texel, the Netherlands
&
J.J. Zijlstra
Netherlands Institute for Sea
Research, Texel, the Netherlands
Abstract
It is generally accepted that coastal waters are important for fisheries.
They are usually rich in food, are the sites of important maricultures
and serve as nurseries for several species of fish. Reclamation of
coastal habitats thus has the potential to affect the size of fish
stocks and fisheries negatively.
Two main types of effects may be expected, viz. destruction of the
habitat of fishes, i.e. the place were they live, and destruction or
decrease of the food supply of fishes. On the basis of existing know
ledge on the ecology of coastal waters an assessment is made of these
effects. The theoretical considerations are compared to a number of
field observations made after reclamations in the past 50 years.
Various estimates of the damage to fishstocks and fisheries are dis
cussed and compared to the estimated profits of the new polders.
1 Introduction
About 0.1% of the total sea area of the world yields more than 50% of
the world fisheries production. This 0.1% is made up by coastal upwel-
ling areas and-shelf seas. Similarly, the North Sea, containing only
0.004% of all sea water, yields about 5% of world fisheries production.
These few figures may serve to illustrate the importance of shallow
seas for the world's fisheries.
57

The edges of these seas are considered to have extra importance (Odum,
1971; Zijlstra, 1972, Clark, 1977, Turner, 1977) as sources of food,
as spawning areas and/or nurseries of young fish and as the sites of
various mariculture activities and coastal fisheries.
Around the North Sea the estuarine Wadden Sea and the river estuaries
have been indicated to be extremely important as nurseries of some
commercially exploited species of fish (Zijlstra, 1972) and as the
sites of highly productive cultures of shellfish (Korringa, 1969).
Coastal fisheries in these areas are of minor importance nowadays, but
have been valuable in the past (Postuma & Rauck. 1978).
Along the East coast of North America, an area rich in estuaries, the
notion that salt marshes deliver organic matter and hence food to
estuaries and estuaries do so to the open sea has been an article of
faith for many years (Odum, 1971; Clark, 1977), but this has never
been demonstrated for marshes around the North Sea (Wolff et al., 1980;
Dankers et al., in prep.). Nowadays, this theory has been challenged
in North America as well (Nixon, 1980).
Whatever this may be, it will be clear that reclamation may have a
serious impact on various important aspects of estuarine ecosystems.
The Dutch North-Seacoast with its numerous embankments going on for
centuries already provides us with interesting possibilities to inves
tigate the impacts of polders on estuarine fishes and estuary-dependent
fisheries.
This paper tries to indicate which effects are theoretically possible
and which effects have actually been observed. It continues with an
attempt to quantify some of the effects of polders in coastal areas
of the North Sea and finally tries to compare the benefits of new
polders to the costs of lost fisheries.
2 Effects of polders on fishes and
fisheries: hypotheses
Three main effects of embankments may be hypothesized, viz.
- loss of habitat;
- loss of migration routes;
- loss of food sources.
58

Loss of habitat occurs when salt marshes and tidal flats are reclaimed.
Species of fish and invertebrates living in these areas, in some cases
only during part of the tidal cycle, loose their possibility to occur
in these areas. Depending on the population dynamics of these species
such a loss of area and food may imply a reduction of the size of the
population of these species, but only when area, food or a similar
factor limits the population size. Limitation of the population size
by area is very obvious in sedentary invertebrates such as cockles and
mussels, but is difficult to demonstrate in fishes and mobile inverte
brates. This is even more so when different life stages occur in
different areas, e.g. when tidal flats are used only as a nursery for
the juvenile stages. So far, indications for the presence of a limiting
factor related to area have only been found for plaice (Pleuronectes
platessa) and sole (Solea solea) (Rauck & Zijlstra, 1975), but actual
proof has never been obtained.
Along the coasts of the North Sea it is highly unlikely that reclama
tion of salt marshes will result in loss of habitat for fishes, since
hardly any species lives in the intricate network of salt-marsh creeks.
Embankment of tidal flats and shallow water, however will lead to loss
of habitat for several species, e.g. flatfishes, mullets, brown shrimps
and possibly herring.
Loss of migration routes will be important in particular for
migrating species with different life-stages in the open sea and in
fresh (or brackish) water. When the connection between these two
types of habitats is disrupted by a reclamation project, the species
concerned will not be able to complete their life-cycle and thus
decrease in number, eventually down to zero. This will even be true
when the habitats themselves remain unaffected.
Loss of food sources will usually be identical to loss of habitat,
unless the food is derived from another habitat where the species
concerned does not occur. A theoretical example is fishes living in
coastal waters being dependent, directly or indirectly, on foo-1
produced in salt-marsh areas where the fishes cannot live. Of course,
the food obtained in this way should be a limiting factor for the
population size, since otherwise no effects will occur when such salt
marshes are embanked.
It is evident that when a fish population is affected in some way by
59

a reclamation, a fishery dependent on this species will be affected
as well.
3 Effects of polders on fisheries:
observations from the Netherlands
3.1 Loss of habitat
In 1932 the Zuiderzee was changed from a tidal, brackish-water area
into a stagnant freshwater lake. This meant the loss of an important
area of habitat for estuarine fishes. Havinga (1954) summarized the
changes observed in the fish populations and the fisheries (Table 1).
His data very clearly show how estuarine fish have been replaced by
freshwater species and how the fisheries changed accordingly. In addi
tion, the total yield for human consumption declined from about 18,000
tons annually in 1926-31 to about 7000 tons in 1946-51, when fresh
water conditions were well established (Zijlstra, 1976).
The Zuiderzee reclamation also presents us with one of the most con
vincing cases that embankments affect the population size of a species.
The Zuiderzee was the area where a local race of herring (Zuiderzee
herring) had its spawning area as well as its nursery. On average
about 10 million kg of this type of herring were caught in the Zuider
zee annually. After the closure of the dam this catch rapidly dropped,
eventually to zero. Outside the dam, in the Wadden Sea, 1.6-3 million
kg were caught annually before the closufa. In 1931, when the dam was
partly completed, 4.4 million kg were caught outside it and in the
period 1933-36 10.7-15.1 million kg were caught annually. The animals
spawned at the outer side of the dam. The larvae did not develop to
young fish, however, and ultimately the population declined. In 1937
7.4 million kg «/ere caught, in 1938 1.2 million and in 1939 only
12,000 kg. The fishery has stopped in that year (Havinga, 1954).
A similar story relates to the anchovy (Engraulis encrasicholus) which
also spawned in the Zuiderzee. In late spring these fish migrated to
this only larger area in Dutch coastal waters where salinity conditions
were satisfactory and temperature high enough in some years for develop
ment of eggs and larvae. On average about 2 million kg were caught in
the Zuiderzee annually. After the closure the Zuiderzee population
60

disappeared and was hardly or not able to use the Wadden Sea as a
replacing spawning area (Havinga, 1954; Postuma & Rauck, 1978).
At none of the subsequent and smaller reclamations in the Netherlands
comparable observations on the effect of habitat loss on fish stocks
have been made. Although the loss of habitat was clear in all cases,
an effect on fish stocks could not be demonstrated. This lack of evi
dence for changes in fish stocks as a result of embankments may have
two causes. The first is that there was no effect on the fish stocks,
since the area of habitat does not limit the population size. However,
the second possibility is that an effect was present, but could not be
demonstrated due to its smaller scale and the large year-to-year
variability in the recruitment and thus size of the fish stocks. This
may be illustrated by the following figures. Since there is evidence
that juvenile plaice prefer tidal flats as a habitat (Kuipers, 1973),
the loss of habitat due to reclamation may be expressed as the area of
flats lost. Reclamation of the Grevelingen estuary caused the loss of 2
40 km of tidal flats. Assuming that all flats around the North Sea
have equal value as nurseries, this would mean a loss in nursery area
of less than 1%. A similar result may be obtained by using data on
plaice densities. Wolff et al. (1981) estimated an average density of 4 2
276 two-year-old plaice per 10 m of tidal flats in the Grevelingen 2
estuary just prior to its closure in 1971. With 40 km of tidal flats
this would imply that the closure of the Grevelingen estuary would have
caused the loss of about 1 million plaice. This figure should be com
pared to the average size of the North Sea plaice stock at 1-2 years
of age of 337 x 10 individuals (Bannister et al., 1974). So even a
relatively large loss of habitat would mean a reduction of not much
more than 0.5% of the total stock. Since year-class size can vary
between years by a factor of 3, the effects of an embankment on recruit
ment are usually hidden in the naturally occurring year-class variations.
However, it has to be stressed that this does not mean that reclamations
have no effects on fish stocks.
The situation is different for äedentary invertebrates. Especially in
the case of mussels (Mytilus edulis) embankment of sufficiently large
areas (Braakman, 1952; Grevelingen, 1971) is reflected immediately in
the yield of the mussel culture.
61

3.2 Loss of migration routes
In most reclamations loss of migration routes coincides with loss of
habitat and the effects of the latter will be enough to explain any
changes. In the case of closures of river mouths the habitats involved
may remain unaffected whereas their connection may be blocked.
However, the only case in which the effects of this could be studied,
concerns the Rhine estuary. Here so many other influences affect the
fish stocks (notably pollution) that any effects of closure of the
river mouth cannot be demonstrated (Wolff, 1978).
Table 1. Changes in the fisheries yields of the former Zuiderzee due
to its closure in 1932. All figures denote tons per year.
After Havinga (1954).
1930
31
32
33
34
35
36
37
38
39
40
41
Her r ing
C.10; ,000
12
0
0
0
0
0
0
0
0
Anchovy
3598
378
0
0
0
0
0
0
0
0
0
F lounder
3,647
2,321
1,273
1,265
1,124
232
48
43
25
27
45
63
Smelt
1,285
1,349
476
337
447
317
271
130
209
24
7
73
Eel
838
941
1,048
2,125
2 ,688
1,907
2,405
3,595
2 .588
2 ,108
3,205
4 ,563
F reshwater s p e c i e s
7
8
14
11
25
32
60
145
243
2920
1674
1782
3.3 Loss of food sources
It is conceivable that fish stocks, or rather the food organisms of
such stocks, depend on food sources produced outside their habitat.
Examples are particulate organic matter originating form salt marshes
and transported by tidal currents to shallow coastal waters as well as
62

matter produced in estuaries and exported to the open sea. Embankment
of salt marshes or even complete estuaries would terminate such a
transport of potential food and thus could have an impact on fish
stocks. We do not know of any example of salt-marsh reclamation in
the North Sea causing a reduction of fish stocks due to removal of
food sources. We also consider it unlikely that such effects exist,
since it seems that North Sea salt marshes act as net importers
instead as exporters of particulate organic matter (Wolff et al.,
1980; Dankers et al., in prep.).
It might be argued that reclamation of entire estuaries causes a de
crease of fish stocks in the adjacent open sea because of the termina
tion of estuarine 'outwelling' (Odum, 1971). However, apart form the
hypothesis that net 'outwelling' of particulate organic matter does not
occur in North Sea coast estuaries (Postma, 1954, 1961; Wolff, 1977),
such an effect would be very difficult to distinguish from the effects
considered in chapters 3.1 and 3.2. Moreover, as already stated in
these chapters, such effects have never been demonstrated.
4 Discussion
The only demonstrable negative effect of reclamations on fish stocks and
fisheries in the coastal areas of the North Sea is due to loss of habi
tat. Clear examples, discussed in chapter 3.1, are loss of spawning
habitat for two species of fich resulting in decline or disappearance
of fish populations, and loss of habitat for mussels resulting in
decrease of the mussel stock.
Not demonstrated but likely to occur are negative effects of loss of
habitat on other coastal species of fish and invertebrates. In fact,
Anonymous (1974), Dankers (1978) and Anonymous (1979) assumed that
these would occur when they estimated the effects of reclamation of
part of the Wadden Sea.
Not demonstrated but likely to occur are also the negative effects of
disrupted migration routes for species of fish.
Not demonstrated and unlikely to occur are negative effects of recla
mation of salt marshes on fish and invertebrates. The only effects de
monstrated resulted from reclamation of tidal flats and shallow coastal
63

waters.
Assuming that all effects demonstrated or likely to occur, do so indeed,
we may be able to estimate the effects of reclamation on stocks of fish
and marine invertebrates and on the fisheries yield. The Netherlands
Institute for Fisheries Research did so in the late sixties for two
potential reclamation schemes in the Dutch Wadden Sea (Anonymous, 1974).
When an error in the report is corrected, the damage to the fisheries
on plaice, sole, herring and brown shrimp may be recalculated per ha.
The capitalized damage (täte of discount 10%, period unlimited)
arrives at about Hfl. 3700.- for a scheme near the island of Ameland1
and at Hfl. 1700.- to Hfl. 3300.- for a scheme at the Balgzand tidal
flats. It is not clear what has caused the differences.
Dankers (1978) made a reassessment for the Balgzand tidal flats and he
estimated that the loss of 1 ha of tidal flat habitat on average would
result in the annual loss for the fisheries of:
1500 kg of plaice;
100 kg of sole;
17.5 kg of brown shrimp;
unknown amount of herring and other pelagic fish, but comparable to
the total loss of plaice, sole and shrimp together;
50 kg of cockles;
unknown amount of mussels produced by mariculture.
The yield of lugworms for bait (about 4000 per ha) is not included,
since the lugworm fishery is not limited by the available lugworm stock.
Capitalizing the estimated amounts lost (rate of discount 10%, period
20 years) suggested an economic loss of nearly Hfl. 40,000.- per ha
(see NEI & RIN, 1978), thus considerably higher than the earlier
estimate, even after accounting for the rate of inflation. Although the
cockle fishery is a new development since the earlier estimate, Danker's
estimate is almost certainly too high. He seems to have overestimated
the number of plaice present and not to have accounted for mortality of
plaice between the juvenile stage and the recruitment to the fisheries.
Moreover, his assumptions on the amount of herring dependent on tidal
flats are not supported by recent observations.
Finally, Rijkswaterstaat published a study (Anonymous, 1979) on the
costs and benefits of the embankment of salt marshes and tidal flats
near Zwarte Haan, Friesland. For these high-lying tidal flats, which
64

have less importance for fisheries (mainly plaice and shrimps), the
yield was calculated by the Netherlands Institute for Fisheries
Research at about Hfl. 925.- per ha per year. Capitalizing this amount
in the same manner as has been done in the earlier studies would result
in a value of about Hfl. 5400.- per ha. It seems that this is a
relatively low estimate which is not representative for the average
tidal flat area in the Wadden Sea. Therefore, considering the various
estimates made about economic losses to the fisheries in relation to
the reclamation of tidal flats in the Dutch Wadden Sea, the capitalized
losses might range between Hfl. 5000.- and Hfl. 10,000.-.
The economic value of areas reclaimed either for agriculture or other
human uses, generally will be higher than this value for fisheries.
Reclamation usually involves considerable costs, however. Therefore in
the final cost-benefit analysis the negative benefits of lost fisheries
yields may play a highly important role.
References
Anonymous 1974. Rapport van de Waddenzeecommissie. Staatsuitgeverij,
's-Gravenhage, 326 pp.
Anonymous 1979. Analyse plan indijking Zwarte Haan-Holwerd. Report
Rijkswaterstaat, 120 pp.
Bannister, R.C.A., D. Harding & S.J. Lockwood 1974. Larval mortality
and subsequent year-classes strength in the plaice (Pleuronectes
platessa L.). In: J.H.S. Blaxter (ed.). The early life history of
fish. Springer Verlag, Berlin, p. 21-37.
Clark, J. 1977. Coastal Ecosystem Management. Wiley-Interscience, New
York, 928 pp.
Dankers, N. 1978. De ecologische gevolgen van havenaanleg op het Balg-
zand. Report Rijksinstituut voor Natuurbeheer, 98 pp.
Dankers, N., M.A. Binsbergen, R. Laane, M.H. Rutgers van der Loeff &
J. Zegers in prep. Transport of water, suspended material and
dissolved matter between a salt marsh and the estuary.
Havinga, B. 1954. Pisces. In: L.F. de Beaufort (ed.). Veranderingen in
de flora en fauna der Zuiderzee (thans IJsselmeer) na de afsluiting
in 1932. De Boer, Den Helder, p. 253-267.
65

Korringa, P. 1969. Shellfish of the North Sea. Serial Atlas of the
Marine Environment Folio 17. Geogr.Soc, New York.
Kuipers, B. 1973. On the tidal migration of young plaice (Pleuronectes
platessa) in the Wadden Sea. Neth. J. Sea Res. 6: 376-388.
NEI & RIN 1978. Een haven op het Balgzand? Een economische en ecolo
gische afweging van de voor- en nadelen van een beperkte zeehaven
ontwikkeling ten behoeve van Den Helder. Report Ned.Economisch
Instituut en Rijksinstituut voor Natuurbeheer.
Nixon, S.A. 1980. Between marshes and coastal waters - a review of 20
years of speculation and research on the role of salt marshes in
estuarine productivity and water chemistry. In: P. Hamilton & K.B.
Macdonale (eds.) - Estuarine and wetland processes. Mar.Sei. 11:
437-525.
Odum, E.P. 1971. Fundamentals of ecology, 3 ed. Saunders, Phila
delphia, 574 pp.
Postma, H. 1954. Hydrography of the Dutch Wadden Sea. Arch, neérl.
Zool. 10: 405-511.
Postma, H. 1961. Transport and accumulation of suspended matter in the
Dutch Wadden Sea. Neth. J. Sea Res. 1: 148-190.
Postuma, K.H. & G. Rauck 1978. The fishery in the Wadden Sea. In:
N. Dankers, W.J. Wolff & J.J. Zijlstra (eds.). Fishes and fisheries
of the Wadden Sea. Balkema, Rotterdam, p. 139-157.
Rauck, G. & J.J. Zijlstra 1975. On the nursery-aspects of the Wadden
Sea for some commercial fish species and possible long-term changes.
Symp. on the changes in the North Sea fish stocks and their causes,
36: 1-16.
Turner, R.E. 1977. Intertidal vegetation and commercial yields of
penaeid shrimp. Trans. Amer. Fish. Soc. 106: 411-416.
Wolff, W.J. 1977. A benthic food budget for the Grevelingen estuary,
the Netherlands, and a consideration of the mechanisms causing high
benthic secondary production in estuaries. In: B.C. Coull (ed.).
Ecology of marine benthos. University of South Carolina Press,
Columbia, pp. 267-280.
Wolff, W.J. 1978. The degradation of ecosystems in the Rhine. In: M.W.
Holdgate & M.J. Woodman (eds.). The breakdown and restoration of
ecosystems. Plenum Press, New York, p. 169-187.
Wolff, W.J., M.J. van Eeden & E. Lammers 1979. Primary production and
66

import of particulate organic matter on a salt marsh in the
Netherlands. Neth. J. Sea Res. 13: 242-255.
Wolff, W.J., M.A. Mandos & A.J.J. Sandee 1981. Tidal migration of plaice
and flounders as a feeding strategy. In: N.V. Jones W.J. Wolff
(eds.). Feeding and survival strategies of estuarine organisms.
Plenum Press, New York, p. 159-171.
Zijlstra, J.J. 1972. On the importance of the Wadden Sea as a nursery
area in relation to the conservation of the southern North Sea
fishery resources. Symp. Zool. Soc. London 29: 233-258.
Zijlstra, J.J. 1976. Waar bleef de Zuiderzeeharing? Waddenbulletin
11: 174-178.
67

NATURE IN NEW WADDEN-POLDERS CONSERVATION BY EXPLOITATION
W. J o e n j e
State University, Groningen
The Netherlands
Abstract
In recent engineering projects along the North Sea coasts large areas
of tidal sandflats have been embanked, which often gain a nature reserve
status. The plant colonisation and primary succession is described;
nature management practises, notably grazing, and the significance for
wildlife protection are discussed, exemplified by the Lauwerszee polder
9100 ha, embanked in 1969.
Introduction
The application of modern technology along the North Sea coast now ren
ders solid solutions to the old problems of security, land reclamation
and fresh water management. Only gradually the far reaching ecological
impact of these huge mutations in the highly valuable coastal fringe of
our marine wetlands gains a general concern (Saeijs 1982, Wadden Sea
Working Group, in press)» but in the meantime over 5000 ha of saltmarsh
and tidal flats are being diked in the Wadden Sea area alone and plans
exist to embank well over 20.000 ha.
One answer to the problems of storm surge danger and of the inundations
in the coastal plain by excess riverdischarge is rather specific. With
the straigtening of the bending old dikes, new dams enclose seabed and
reservoir-lakes with a free drainage on the low tide by large sluices
(Figure 1). Several extended areas in bights and estuaries of the Wadden
68

Sea have thus been and will be embanked as a by-product of this design.
More or less the same holds for the saline stagnant lakes and sandflats
created in the Dutch Delta region.
100
50
NAP
- 5 0
-100 L
reservoir level Lauwersoog Zoutkamp Dokkumer nw. zijlen
10 14 16 18 november 1972
Figure 1. Storm effect on water levels in the reservoir-lake and at sea,
showing the limits of the hydrological control.
The sandflats in the new polders often are left to spontaneous succession
of natural phenomena. However, by no means the losses of saltmarsh and
wadden ecosystems can be compensated in the new nature developing at the
landward side of the dam (Heydemann 1981); here the creative develop
ments provide us a new reality, which may gain significance for nature
conservation.
A clear example is the Lauwerszee-polder, 9100 ha embanked in 1969 as
an estuary of the Dutch Wadden Sea. Other comparable situations are to
be found in the German part, e.g. the Hauke-Haien-Koog 1958 (Brehm 1977)
the Meldorfer Bight 1972, 1978, the Eider estuary 1972, whereas another
2100 ha embankment at the german-danish border is under construction.
In a wider perspective the newly created basins in the Dutch Delta
69

(Saeijs 1982, Beeftink 1975) and polders along the English eastcoast
are worth mentioning (Gray 1976, 1977).
Biological studies into the processes of ecosystem development up to
some stage of maturity have not yet been undertaken, long lasting as
they would be; our knowledge is limited to the first stages, the possibi
lities for research often being excluded by cultivation, e.g. in the
Wieringermeer (Feekes 1936), the Lake IJsselpolders (Feekes & Bakker
1954, Bakker 1960) and also in Japanese polders (Iwata & Ishizuka 1967).
This paper focusses on the Lauwerszee-polder (Figure 2), which presents
a model for the study of natural succession and subsequent nature manage
ment practises (Joenje 1977, 1978, 1982)
2 The environment
Different from 'man-made' polders uniformed by agricultural adjustments,
the embanked sandy wadden shallows consist of a number of different envi
ronments. The essentials appear to be the height- and soil gradients and
the lack of artificial drainage structures (Figure 2).
5 ^ 5
„<7* ff /
1 4 LJ
Sî''^>
.1
lil ) êt-2 r-->
6
I I sand 0 -3 % lutum
r ~ l sand 3 -5
H l silty sand 5-12
I Q sandy clay and clay 12-50
0 . 3km
Figure 2. Soil types in the Lauwerszee-polder.Lutum refers to fraction
^2 /im. Inset : the discharge area D (200.000 ha) and some other
embankments (2) Noordoostpolder, (3) Flevopolders, (4) Wierin
germeer, (5) Veerse Meer, (6) Grevelingen.
70

The highest coarser grained parts of the sandflats show a quick desali
nation, especially the upper zones of height-gradients, where rainwater
laterally percolates through the soil. The horizontal parts and the low
lying finer sands, still poor in humus but with a few % of clay, loose
salt much slower and in some locations a high salinity e.g. 10 to 20 g
NaCl per liter soil moisture, will persist for several decades, caused
by the lack of local drainage and the slow flux of saline ground water
from the higher sandflats.
Characteristic groundwater fluctuation patterns show an extended water
logged winterperiod and summertables descending to 80 - 120 cm below
the soil surface, more or less independent from the absolute height.
These abiotics, together with the low-nutrient status of the sediments
offer a variety of natural environments on a large scale, open to colon
isation by plants and animals and subsequent primary succession, which
is in itself a rare phenomenon (compare the Krakatao islands or retreat
ing glaciers). The ground water regimes resemble those of dune slacks,
but also the natural condition in pleistocene coversands underlain by
boulderclay, a widespread soil typé in the North of the Netherlands and
Germany, the natural water-regime of which is now almost confined to
nature reserves escaped from ameliorations.
3 Colonisation
Emerging from seeds already present on the seabed and originating from
the surrounding saltmarshes, three annual halophytes seize the opportuni
ty to colonize the saline flats, though in low densities (Salieornia
europaea 0 to 300 plants per ha, Suaeda maritima to 10 and Atriplex
hastata to 2 plants per ha). The densities related to the dispersal by
tidal forces in the last winter before the enclosure. From this very
sparse pioneer vegetation, the 'memory' of the tidal condition, the next
generation grew up optimally, in wide aggregates around the parent
plants: no interference by other species , since only a few individuals
of other halo-tolerants are dispersed into the new land. These, most
being perennial (Spergularia media, S. marina, Aster tripolivm, Puooinel-
lia aapillaris, P. distans a.o.) , will appear to be the next dominants.
On the well drained edges of creeks and on top op musselbanks a large
71

Ob)
SALICORNIA 100% = 200 Tons
A.penelope
B leucopsis
A.crecca
Figure 3a. Annual biomass production of the principal colonising species
in the first 6 years.
3b. The consumption of Salioornia in the Lauwerszee-polder by
widgeon , teal and barnacle goose (after Van Eerden,in press).
number of plants from fresh environments indicate the effectiveness of
dispersal by wind and water. From Figure 3a the process by which the
vast plains are flooded by the green wave can be read. This exponential
increase of the annuals until the carrying capacity of the spot is reach
ed, is followed by the less conspicuous increase of the perennials
dominating after 6 years. The interesting question arises whether the
succes of the later colonising species is due to their more efficient
use of space and soil, or to the changes in the habitat, such as desalin
ation and soil ripening ; probably both.
72

4 Vegetation development
From the studied migration and colonisation it seems probable that the
principal colonising, salt tolerant species find no major dispersal prob
lem in reaching the area in time, i.e. as soon as their proper desalinat
ion stage presents substantial surfaces. Differences in the share they
take are related to the starting densities and their intrinsic capaci
ties for population increase.
It appears that the early changes in the abiotic environment , governed
by precipitation and aeration (desalination, soil-ripening) produce
more and more habitats suitable for ever more glycophyte species. The
desalination process acts as the 'échappement' for succession. The dif
ference with the hurried succession in more productive fresh polders
is most striking (Van der Toorn 1969).
Then gradually, other factors including biotic, begin to exert their
influence, e.g. drought and diminishing nutrient content (especially N)
on the higher sands, or inundations of low zones by fresh and nutrient-
rich water from the reservoir lake, as well as natural grazing by water
fowl (Van Eerden, in press)(Figure 3b), hare and mice.
Apart from leaching, a substantial amount of nutrients becomes fixed in
litter, the decay of which is rather slow.
4.1 Sands
After 8 years a number of communities have evolved, differing in number
of species and structure, but generally low in production. The vegetation
on the highest sands is very sparse and rich in species. Here a ca 2 cm
sheet of organic debris of vascular plants and mosses covers the sand.
Summer drought with water tables well below 110 cm select deeper rooting
species such as tap-root perennials, trees (notably Salix spp.) and
winter annuals and mosses with their growing season in the wetter part
of the year, as well as aphreatophytes (independent of a ground water-
table). When deeper soil layers are desalinated the standing crop of
these communities may rise considerably and, together with Phragmites
austvalis , the woody species increase, such as Hippophae vbarnnoid.es ,
Rubus aaesius, Salix repens, S. alba, S. cinerea a.o.
73

4.2 Silty sands
After 8 years the still brackish sands on lower level and the even more
saline silty sands carry a meagre meadow of Puooinetlia and Poa towards
Spergularia, Aster and Sdlioornia mixtures, only slowly increasing in
cover and number of species. Here the mass-grazing in autumn by waterfowl
removes the biomass and continues the mineral surface favourable for
germination of the annual halophytes they prefer so much.
Figure 4 . The effect of autumn grazing on the annual vegetation in the
10th year, demonstrated with an exclosure.
In ungrazed exclosures the surface is rapidly covered by a dense mat of
perennial grasses, notably Alopeaurus genioulatus and Agrostis stoloni-
feva. Together with Junaus gerardii- these perennials increase from the
lower siltier parts towards higher zones of silty sands. And Phragmites
australis follows as soon as the decreasing salinities permit.
74

In persistently saline areas the vegetation develops the aspect of a
saltmarsh with swards of Puaoinellia maritima and Juneus gerardi with
the other halophytes already mentioned and occasional plants of Artemisia
maritima, Limonium vulgare, Trigloahin maritima, Carex extensa and
Plantago maritima.
4.3 Dominance
Although natural succession rendered a variety of phytocoenoses in which
well over 320 species of vascular plants participate, it becomes clear,
that only a few develop mass stands in which other species tend to be
extruded and excluded. Indeed in vast areas the accumulating biomass and
litter of Agrostis stolonifera and Phragmites virtually exclude any
other species from germinating.
Ht '
12
10
8 i
6 \ 4
2
0
(A)
26'
24
22
20.
18
16
14.
12
10
8.
6-i»
2.
100 200 300 400
V
/ / /
»s
biomass + litter
100 200 3Ô0 43c> 500'
2 Figure 5. The relation between species density (per .25 m ) and biomass
2 + accumulated litter (g dwt. per .25 m ) in various samples
from the Lauwerszee-polder (A) and from the mainland (B).
75

This general phenomenon is illustrated in Figure 5, which gives the rel
ation between the species density and the amount of biomass + litter
(after Hendrikse & Wuring 1981). The comparison with the exploited
grasslands in sandy regions of the mainland (Drenthe) with a larger
number of species present, suggests that we might be able to increase
species-diversity in the more productive polder areas by removing bio
mass and litter, i.e. by some mode of harvesting.
5 Nature management
Here we enter into the open discussion whether nature management of these
polder communities should be a 'laissez-faire', which probably will
result in long lasting stages of extended and impenetrable reed and
willow stands, poor in species, but with unexpected establishments
(compare the Oostvaarders Plassen case, South Flevoland ).
or on the other hand, should be some mode of nature exploitation, such
as mowing, grazing, reed cutting a.o. The point however is more general.
Man has for long replaced the large herbivores in their functioning as
consuments of plant biomass. Most nature reserves in Europe have'always'
been subjected to some interference by man with respect to exploitation
of primary production. Any cessation in the removal of biomass generally
leads to deterioration of the reserve and loss of species. Therefore
some 'active' management must be considered in any Nature Management Plan
However, different and conflicting options may exist for the management
of one area and a system of priorities is needed : should botanical div
ersity or even the development of populations of rare or appreciated
plants (orchids, parnassia) prevail, or is the function as a breeding
ground foreither reed swamp or meadow birds preferable, or else, is the
internationally famous value as a hibernating area for waders and water
fowl a top priority to be optimized ? (Viz. note 1).
Because of the large surface of the nature area in the Lauwerszee-polder
there are possibilities to operate several management programmes side by
side in different zones, as will be discussed below.It must be pointed
out, that the management of nature reserves in new polders is still
very much a matter of trial and error, base on professional judgement
and luck. With a lack of quantitative models for succession, predictions
76

can hardly be made and thus, in practice the management tends to be exp
erimental and needs careful adjustments.
5.1 Grazing
5.1.1. Sheep
Within the central nature reserve (ca 4000 ha, Reitsma 1981) experimen
tal sheep grazing on a year around base started in the 9th year on
330 ha low-saline and high-desalinated sandflat. After three years a
study of the use of the area by 68 sheep and ca 115 lombs (the latter
removed in autumn) revealed the following (Van Dijk 1981, Figure 6 ).
FRESH, DRY AND SANDY SALINE, MOIST (FLOODED) AND SILTY
Figure 6. Distribution of sheep dung in the period August to November
1977 in the principal vegetation zones of the sheep-grazed
area in the N part of the Lauwerszee-polder (after Van Dijk ),
In early summer the use of the area and the consumption in different
communities was evenly distributed. In September the brackish Vuooinel-
lia-zone was highly preferred, until in October the waterlogged surface
77

and the goose dung made the animals change towards the higher Agrostis-
communities. Very little use was made of Phragmites, Festuaa rubraor the
annual halophytes in the lower zone. In Figure 6 the use of the area is
shown, as measured from the distribution and production of sheep dung.
A significant correlation between this factor and the grazing pressure
was found. Based on close estimation of the amount of damage from graz
ing per plant species on a large number of plots, a grazing preference
list of the common plant species was made (Figure 7, after Van Dijk I.e.)
aster tripolium
juncus articulatus
puccinellia maritima
festuca rubra
phragmites australis
juncus bufonius
lolium perenne
puccinellia distarts
agrostis stolonifera
o-- - ,
* » e
» .. «
%,2-W,
zn « i
« i
* * •
PREFERENCE CLASS
O
i "* 'i
1
* •
•
3
1 • l
07. 10X Z UKGRAZED PLANTS
Figure 7. Columns indicate the percentage ungrazed plants of 9 species
in vegetation samples of the sheep-grazed area (Figure 6);
Grazing preference class of these species is indicated by
open (mean) and solid dots (90 % of the species samples are
in that class ).
A general conclusion is that the animals show a strong preference for
a few low-frequent species, and use the dominant grasses only superfici
ally, with the exeption of PuooineVLia maritima.
Sheep grazing in such low densities apparently accentuates the differen
ces in standing crop and it seems unlikely that the rougher communities
will be reduced. Total consumption was estimated 7.5 % of the total
standing crop.
The number of sheep has been raised since then, and in the 14th year
1982, this experimental grazing is intensified by adding cattle (April
to November), aiming at a total consumption of 50 to 80 % of the estim
ated available production. This certainly will change the system drastic
ally as may be judged from observations in a nearby zone,given below.
78

5.1.2. Cattle
In another zone of 300 ha cattle grazing started in the same year (1982)
at density of 1 animal to the ha, aiming at a consumption of 60 % of the
estimated production (June to October). The area presented an uninfluenc
ed vegetation after 14 years of natural succession.
Within a fortnight the cattle had removed the flowering stalks in the
Phragmites-zones and had disrupted young Salix-bushes. They took a pref
erence for the lush Agrostts sward occurring in a wide zone within reach
of inundations. The higher zone of Aster tripoliwn-Poa trivialis was
quickly exploited and probably must be renamed. Species as Trigloahin
maritima, Plantago maritima, Carex otrubaea.0. were highly preferred.
On the other hand the flat growing species and low vegetation of Pucci-
nellia maritima remain relatively ungrazed. Trampling caused a visible
damage and a loss of nests.
These preliminary observations sustain the preset aim of the management,
i.e. to create a large area with short (grazed) grassland communities in
order to guarantee the refuge and grazing function for waterfowl and the
breeding area for meadow birds and waders.
Whether the first mentioned sheep + cattle grazing will be positive,
cannot yet be stated. Here the grazing should diversify the area by
diminishing the reed and ̂ grosiis-dominance and is expected to increase
botanical variety.
Other large zones in the central nature area comprise the practises
horse and/or cattle grazing ; a 'laissez-faire' still has its reference
of unaltered succession on over 600 ha.
5.2 Other management practises
It stands to reason, that in management of nature reserves the costs
must be low and often grazing presents the only profitable or least
costly method, especially in larger areas with low costs of fencing and
care. This holds true for the Lauwerszee-polder and for most of the
comparable new polders mentioned earlier. In addition the cutting of
reed and rushes is practised on a small scale.
79

Mowing for hay is relatively expensive and has not been practised signi
ficantly, but it would probably produce species-rich meadow communities
in the silty desalinated inundation zone.
In some areas the ground watertable is kept on a high level in order to
continue conditions a.o. for dune-slack type communities or elsewhere
saltmarsh vegetation (seepage area behind the primary dam).
In future other more expensive management activities might include
cutting of brush (Hippophae vhamnoia.es ) burning, or the creation of
slacks and isolated ponds on the most extended sandflats.
6 Future
The new polder habitats show many unusual features of nature at work
in a wide landscape, but increasingly influenced by man.
Regarding the nutrient-poor soils, the characteristic water regime and
the most probable nature (exploitation) management, the evolving grass
lands may well provide a refuge for many threatened plant and animal
species. On the one hand, as the internationally recognized wetland,
for the huge bird numbers , on the other hand as a new basis for the
prolonged existence of the threatened plant and animal life from the
low-productive and species-rich grasslands in nature reserves of the
nearby mainland and of the Wadden islands.
The study of the development of the new natural communities adjusted by
management holds a challenge for many years to come.
Note
Apart from the use as a grazing area by waterfowl (barnacle^ and grey
lag geese, widgeon and teal; mute swan and Bewick's swan harvesting Pot-
amogeton root nodules), the value as a breeding ground for various meadow
birds and waders is well documented in reports. The quiet, wide landscape
provides hunting grounds for a number of birds of prey nesting in the
polder (kestrel, marsh-, hen- and montagu's harrier, short-eared owl)
and many temporary visitors are reported, including osprey, peregrine
falcon. The permanent presence of 10 to 20 flamingo's and the breeding
80

success of the spoonbill refer to ecological conditions which have
become rare in Nortwestern Europe.
Acknowledgement
The author acknowledges thankfully the information from and fruitful
discussions with his colleagues in the Research Working Group Lauwers-
zee-polder (WOL). The permission for the use of experimental fields
was granted by the Lake IJsselpolder Development Authority, Lelystad.
References
Bakker, D. 1960. Het botanisch onderzoek in de IJsselmeerpolders. Vak
blad voor Biologen 4: 63-79.
Beeftink, W.G. 1975. The ecological significance of embankment and
drainage with respect to the vegetation of the South-West Nether
lands. J. Ecol. 63: 423-458.
Brehm, K. 1977. Factors affecting the vegetation of fresh water re
servoirs on the German coast. In: Ecological processes in coas
tal environments, R.L. Jefferies & A.J.Davy (eds.), Blackwell
Scient. Pub. London, pp.603-615.
Dijk, A.G.F, van, 1982. Sheep grazing in a new polder; aspects in
fluencing structure and development of the vegetation. Acta Bot.
Neerl. 31 : 144.
Eerden, M.R. van, (in press) In: Coastal waders and waterfowl in
winter, Drent, Evans, Goss-Custard & Hale (eds.),Cambridge Univ.
Press.
Feekes, W. 1936. De ontwikkeling van de natuurlijke vegetatie in de
Wieringermeerpolder, de eerste groote droogmakerij van de Zuider
zee. Thesis, Wageningen.
Feekes, W. and D. Bakker 1954. De ontwikkeling van de natuurlijke
vegetatie in de Noordoostpolder. Van Zee tot Land 6. Tjeenk
Willink, Zwolle.
81

Gray, A.J. 1977. Reclaimed land. In: The coastline, R.S.K. Barnes (ed.)
John Wiley & Sons, London, pp: 253-270.
Gray, A.J. 1976. The Ouse Washes and the Wash. In: Nature in Norfolk,
a heritage in trust, Jarrold, Norwich, pp.123-129.
Hendrikse, K. and G.Wuring, 1981. De relatie biomassa-soortendicht
heid van graslandvegetaties in de Lauwerszeepolder en het stroom-
dal van de Drentse Aa. Report Lab.Plantecology, State University
Groningen, 51 pp.12 app.
Heydemann, B. 1981. Biological consequences of diking on saltmarshes
and mud- and sandy flats. In: Environmental problems in the Wad-
den Sea region, C.H. Ovesen and S. Tougard, Esbjerg, pp: 31-72.
Iwata, E. and Ishizuka, 1967. Plant succession in Hachirogata-polder.
Ecol.Rev.17 :37-46.
Joenje, W. 1977. Plant succession and nature conservation of newly
embanked tidal flats in the Lauwerszeepolder. In: Ecological
processes in coastal environments, R.L. Jefferies and A.J. Davy
(eds.),Blackwell Scient.Publ. London, pp: 617-634.
Joenje, W. 1978. Plant colonization and succession on embanked
sandflats. Thesis, Groningen 160 pp.
Joenje, W. 1982. New Polders. In: Flora and vegetation of the
Wadden Sea Islands, K.S. Dijkema and W.J. Wolff (eds.).Report 9
of the Wadden Sea Working Group, Leiden.
Reitsma, Tj. 1981. Facetplan voor de bestemming natuur voor de voor
malige Lauwerszee. Flevo Bericht 131, IJsselmeerpolders Devel
opment Authority, Lelystad, 49 pp.
Saeijs, H.L.F. 1982. Changing estuaries. Thesis, Leiden, 412 pp.
Toorn, J. van der, M. Brandsma, W.B.Bates en M.G. Penny, 1969. De
vegetatie van Zuidelijk Flevoland in 1968. De Lev.Natuur 72:
56-62.
Wadden Sea Working Group (in press) Section Reports I - X, W.J.
Wolff et al (eds.), Balkema, Leiden.
82