papi - icl utkicl.cs.utk.edu/~mucci/latest/pubs/sc03papidod2.pdfpapi counter interfaces • papi...
TRANSCRIPT
PAPI
Performance Application Programming InterfacePhilip J. Mucci, [email protected]
Felix Wolf, [email protected]
SC 2003
Performance
“ The single most important impediment to good parallel performance is still poor
singlenode performance.”
William GroppArgonne National Lab
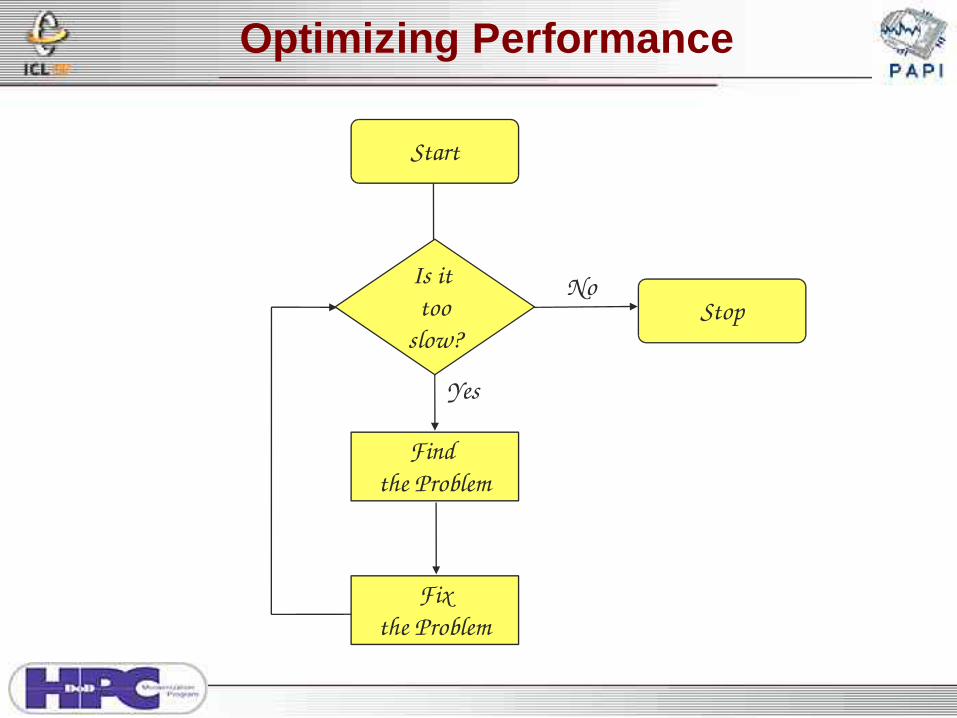
Optimizing Performance
Start
Find the Problem
Fixthe Problem
StopIs it too
slow?
Yes
No
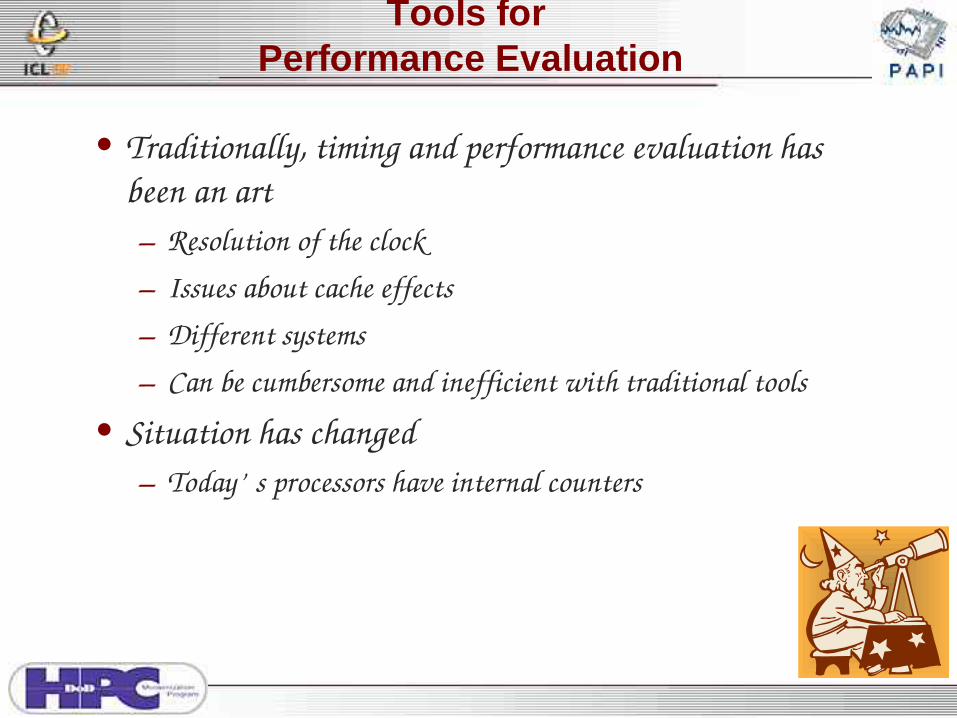
Tools for Performance Evaluation
• Traditionally, timing and performance evaluation has been an art– Resolution of the clock– Issues about cache effects– Different systems– Can be cumbersome and inefficient with traditional tools
• Situation has changed– Today’ s processors have internal counters
Performance Counters
• Today most high performance processors include hardware performance counters.
• Some are easy to access, others not available to users.• On most platforms the APIs, if they exist, are not
appropriate for the end user or well documented.• Existing performance counter APIs
– Compaq Alpha EV 6 & 6/7– SGI MIPS R10000– IBM Power Series– CRAY T3E, X1– Sun Solaris– Pentium and AMD
– IA64– HPPA RISC– Hitachi– Fujitsu– NEC
PAPI
• Performance Application Programming Interface
• The purpose of PAPI is to implement a standardized portable and efficient API to access the hardware performance monitor counters found on most modern microprocessors.
• The goal of PAPI is to facilitate the optimization of parallel and serial code performance by encouraging the development of crossplatform optimization tools.
PAPI Counter Interfaces
• PAPI provides 3 interfaces to the underlying counter hardware: 1. The low level interface manages hardware events in user
defined groups called EventSets, and provides access to advanced features.
2. The high level interface provides the ability to start, stop and read the counters for a specified list of events.
3. Graphical and enduser tools provide facile data collection and visualization.

PAPI Implementation
Tools
PAPI Low LevelPAPI High Level
Hardware Performance Counters
Operating System
Kernel Extension
PAPI Machine Dependent SubstrateMachine SpecificLayer
PortableLayer
High Level Interface
• Meant for application programmers wanting coarsegrained measurements
• Not tuned for efficiency• Calls the lower level API• Only allows PAPI Presets• Easier to use and less setup (less additional code)
than low level

High Level Functions
• PAPI_num_counters()• PAPI_start_counters()• PAPI_stop_counters()• PAPI_read_counters()• PAPI_accum_counters()• PAPI_ipc• PAPI_flips() • PAPI_flops()
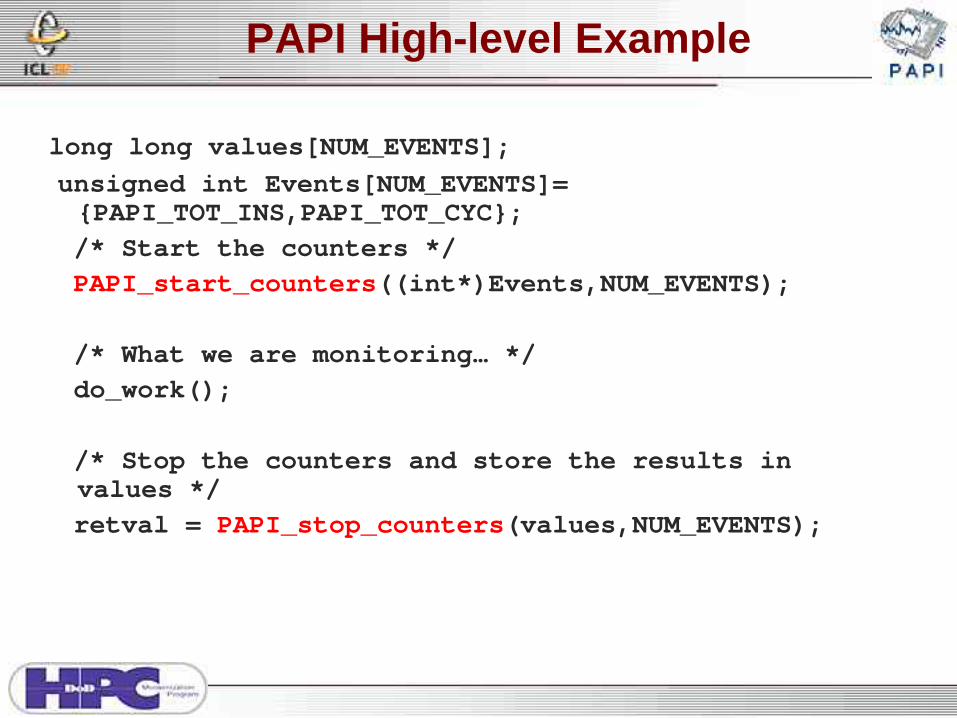
PAPI High-level Example
long long values[NUM_EVENTS]; unsigned int Events[NUM_EVENTS]=
{PAPI_TOT_INS,PAPI_TOT_CYC};
/* Start the counters */
PAPI_start_counters((int*)Events,NUM_EVENTS);
/* What we are monitoring… */
do_work();
/* Stop the counters and store the results in values */
retval = PAPI_stop_counters(values,NUM_EVENTS);
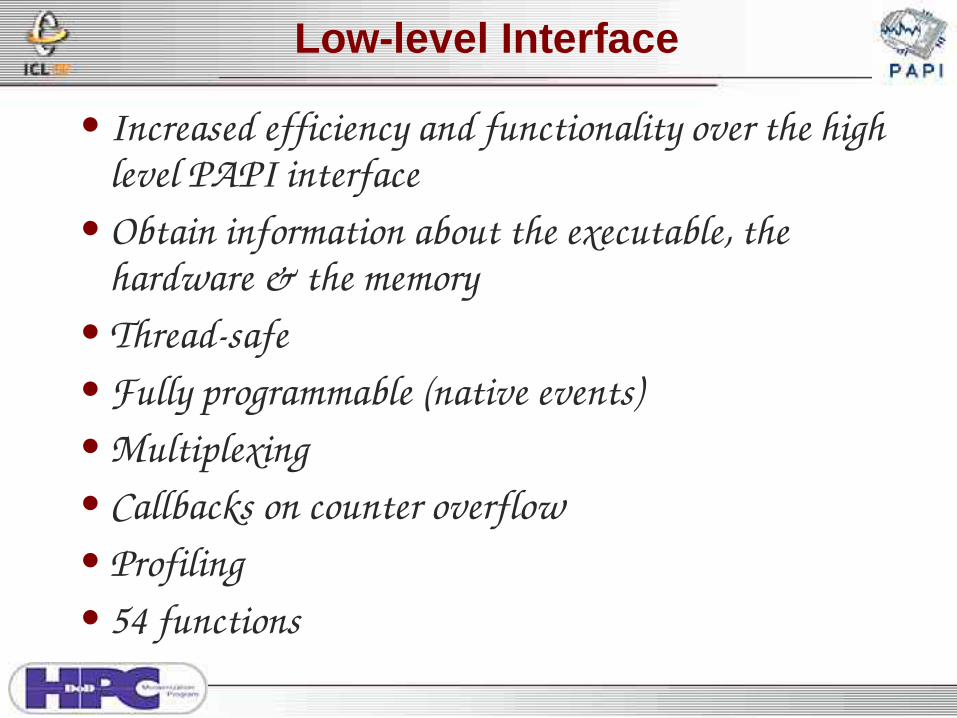
Low-level Interface
• Increased efficiency and functionality over the high level PAPI interface
• Obtain information about the executable, the hardware & the memory
• Threadsafe• Fully programmable (native events)• Multiplexing• Callbacks on counter overflow• Profiling• 54 functions
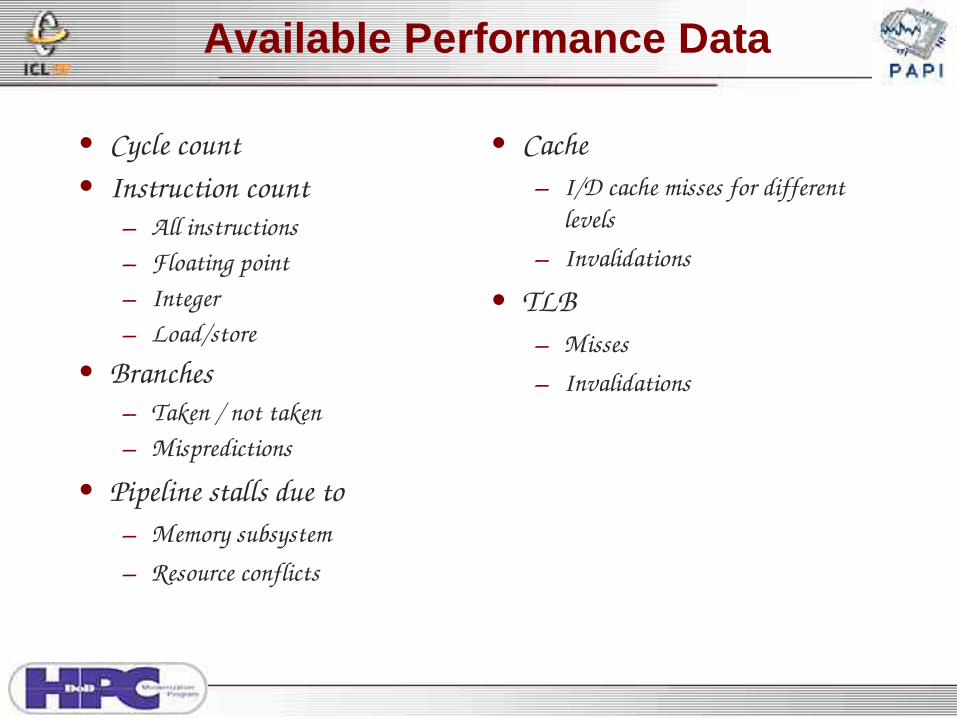
• Cycle count• Instruction count
– All instructions– Floating point– Integer– Load/store
• Branches– Taken / not taken – Mispredictions
• Pipeline stalls due to– Memory subsystem– Resource conflicts
• Cache– I/D cache misses for different
levels – Invalidations
• TLB – Misses– Invalidations
Available Performance Data
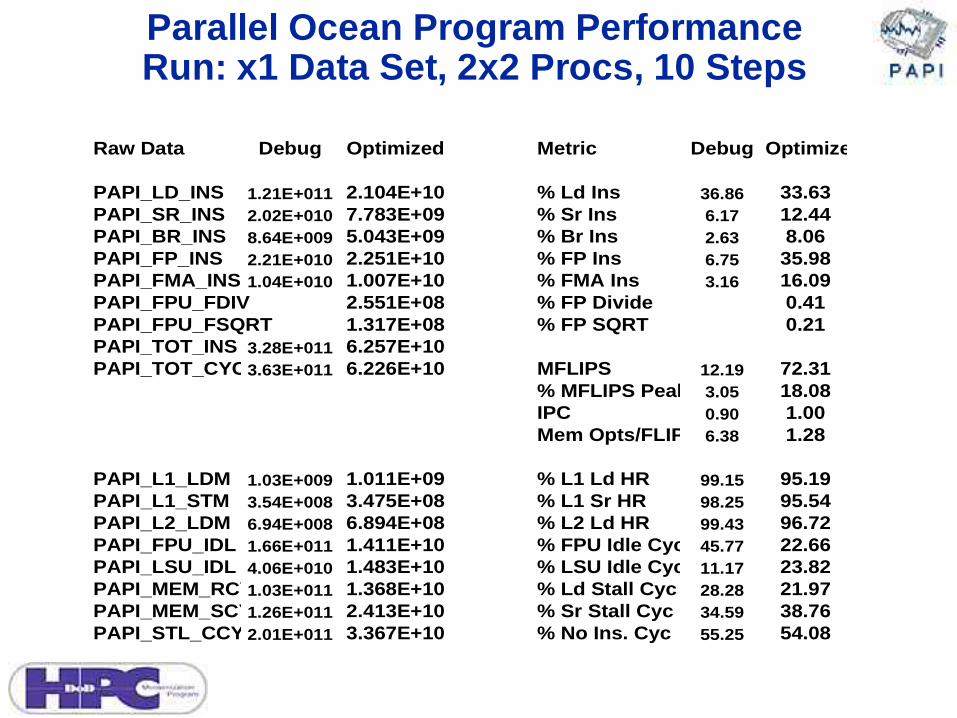
Parallel Ocean Program PerformanceRun: x1 Data Set, 2x2 Procs, 10 Steps
Raw Data Debug Optimized Metric Debug Optimized
PAPI_LD_INS 1.21E+011 2.104E+10 % Ld Ins 36.86 33.63PAPI_SR_INS 2.02E+010 7.783E+09 % Sr Ins 6.17 12.44PAPI_BR_INS 8.64E+009 5.043E+09 % Br Ins 2.63 8.06PAPI_FP_INS 2.21E+010 2.251E+10 % FP Ins 6.75 35.98PAPI_FMA_INS 1.04E+010 1.007E+10 % FMA Ins 3.16 16.09PAPI_FPU_FDIV 2.551E+08 % FP Divide 0.41PAPI_FPU_FSQRT 1.317E+08 % FP SQRT 0.21PAPI_TOT_INS 3.28E+011 6.257E+10PAPI_TOT_CYC3.63E+011 6.226E+10 MFLIPS 12.19 72.31
% MFLIPS Peak 3.05 18.08IPC 0.90 1.00Mem Opts/FLIP 6.38 1.28
PAPI_L1_LDM 1.03E+009 1.011E+09 % L1 Ld HR 99.15 95.19PAPI_L1_STM 3.54E+008 3.475E+08 % L1 Sr HR 98.25 95.54PAPI_L2_LDM 6.94E+008 6.894E+08 % L2 Ld HR 99.43 96.72PAPI_FPU_IDL 1.66E+011 1.411E+10 % FPU Idle Cyc 45.77 22.66PAPI_LSU_IDL 4.06E+010 1.483E+10 % LSU Idle Cyc 11.17 23.82PAPI_MEM_RCY1.03E+011 1.368E+10 % Ld Stall Cyc 28.28 21.97PAPI_MEM_SCY1.26E+011 2.413E+10 % Sr Stall Cyc 34.59 38.76PAPI_STL_CCY 2.01E+011 3.367E+10 % No Ins. Cyc 55.25 54.08
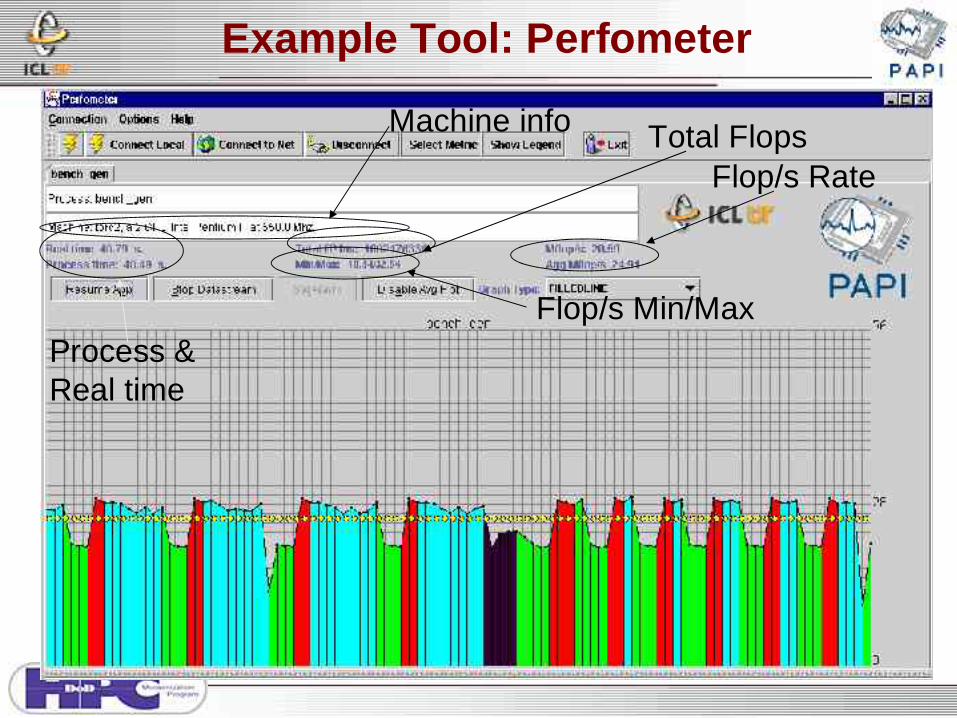
Machine info
Process &Real time
Flop/s RateTotal Flops
Flop/s Min/Max
Example Tool: Perfometer
Supported Architectures
• AMD Athlon and Opteron• Cray T3E and X1• HP Alpha (caveats)• IBM POWER3, POWER4• Intel Pentium Pro,II,III + 4, Itanium 1 + 2• MIPS R10K, R12K, R14K• Sun UltraSparc I, II, III
Standard PAPI Features
• Standardized Access to Performance Counters• Standardized Performance Metrics• Easy Access to PlatformSpecific Metrics• Multiplexed Event Measurement• Dispatch on Overflow• Event Profiling• Bindings for C, Fortran, Matlab, and Java
New in PAPI 3.0
• Lower Measurement Overheads• Overflow and Profiling on Multiple Simultaneous
Events• Easy Access to PlatformSpecific Metrics• High level API is now thread safe• Internal timer/signal/thread abstractions
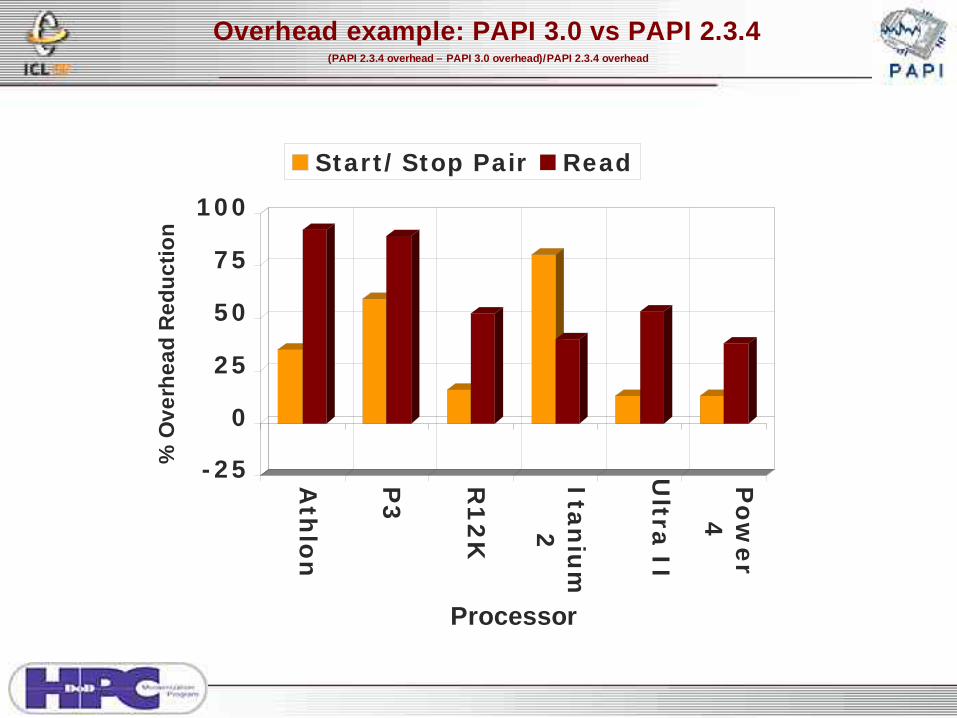
Overhead example: PAPI 3.0 vs PAPI 2.3.4(PAPI 2.3.4 overhead – PAPI 3.0 overhead)/PAPI 2.3.4 overhead
- 2 5
0
2 5
5 0
7 5
1 0 0
% O
verh
ead
Red
uct
ion
Ath
lon
P3
R1
2K
Itan
ium
2
Ultra
II
Po
we
r4
Processor
Start / Stop Pair Read
New in PAPI 3.0
• Lower Measurement Overheads• Overflow and Profiling on Multiple Simultaneous
Events• Easy Access to PlatformSpecific Metrics• High level API is now thread safe• Internal timer/signal/thread abstractions
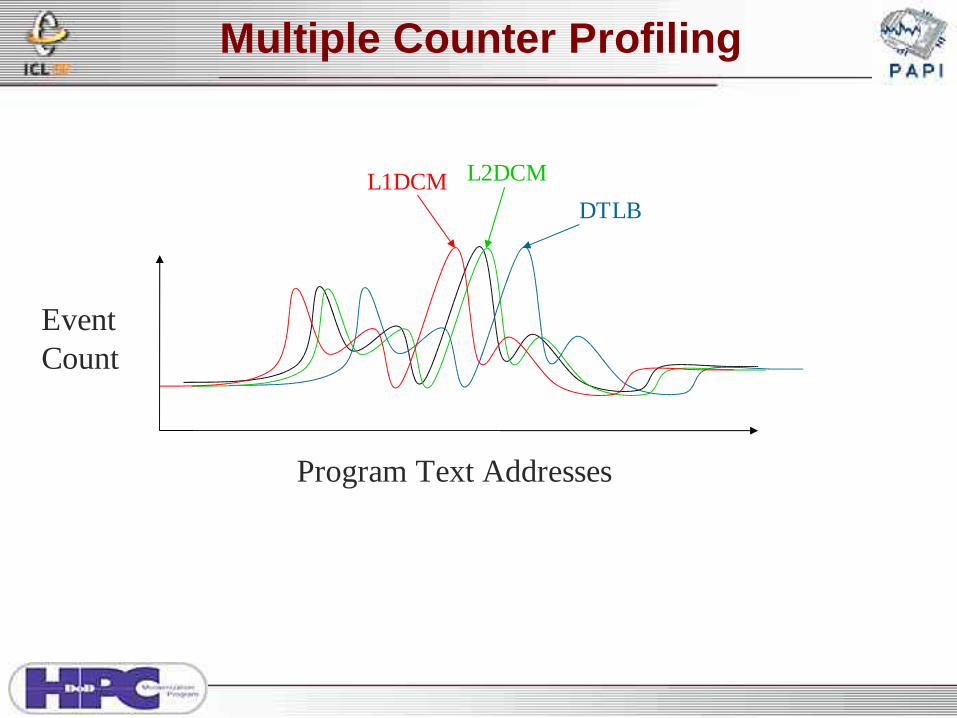
Multiple Counter Profiling
Program Text Addresses
EventCount
DTLB
L2DCML1DCM
New in PAPI 3.0
• Lower Measurement Overheads• Overflow and Profiling on Multiple Simultaneous
Events• Easy Access to PlatformSpecific Metrics• High level API is now thread safe• Internal timer/signal/thread abstractions

• TAU (Sameer Shende, U Oregon) http://www.cs.uoregon.edu/research/paracomp/tau/
• SvPablo (Celso Mendes, UIUC)http://www-pablo.cs.uiuc.edu/Project/SVPablo/
• HPCToolkit (John MellorCrummey, Rice Univ) http://hipersoft.cs.rice.edu/hpctoolkit/
• KOJAK (Bernd Mohr, FZ Juelich; U Tenn)http://www.fz-juelich.de/zam/kojak/
• psrun (Rick Kufrin, NCSA, UIUC) http://www.ncsa.uiuc.edu/~rkufrin/perfsuite/psrun/
• Titanium (Dan Bonachea, UC Berkeley) http://www.cs.berkeley.edu/Research/Projects/titanium/
• SCALEA (Thomas Fahringer, U Innsbruck) http://www.par.univie.ac.at/project/scalea/
Other Tools that use PAPI
Questions?
• http://icl.cs.utk.edu/papi/ PAPI Homepage