papua new guinea's public financial management a woeful tale
TRANSCRIPT

Papua New Guinea’s public financial management: a woeful tale

2015 PEFA assessment of Papua New Guinea’s (PNG’s) public financial management (PFM) This Public Expenditure and Financial Accountability (PEFA) assessment points to material weaknessses in PNG’s PFM system and demonstrates that no overall improvement in PNG’s PFM performance has occurred in recent years
1

“
“Public money is like holy water, everyone helps himself to it” Chinese
proverb

PNG’s PEFA history
◉PNG’s PEFA assessments:
2005 (unpublished)
2009 (unpublished)
2015 (published only by PEFA Secretariat)
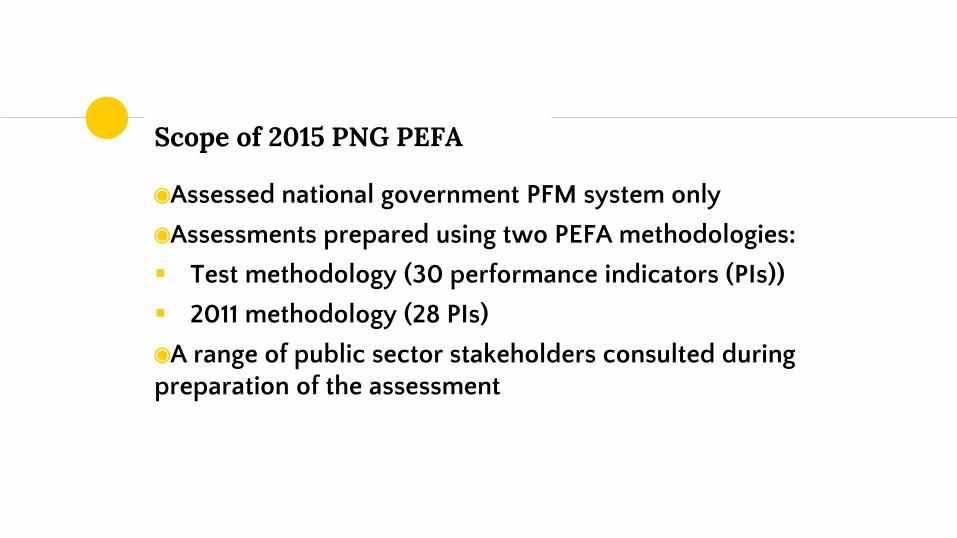
Scope of 2015 PNG PEFA
◉Assessed national government PFM system only
◉Assessments prepared using two PEFA methodologies:
Test methodology (30 performance indicators (PIs))
2011 methodology (28 PIs)
◉A range of public sector stakeholders consulted during preparation of the assessment
Poor PFM Inhibits service delivery and project
implementation, economic development, anti-corruption efforts and public accountability
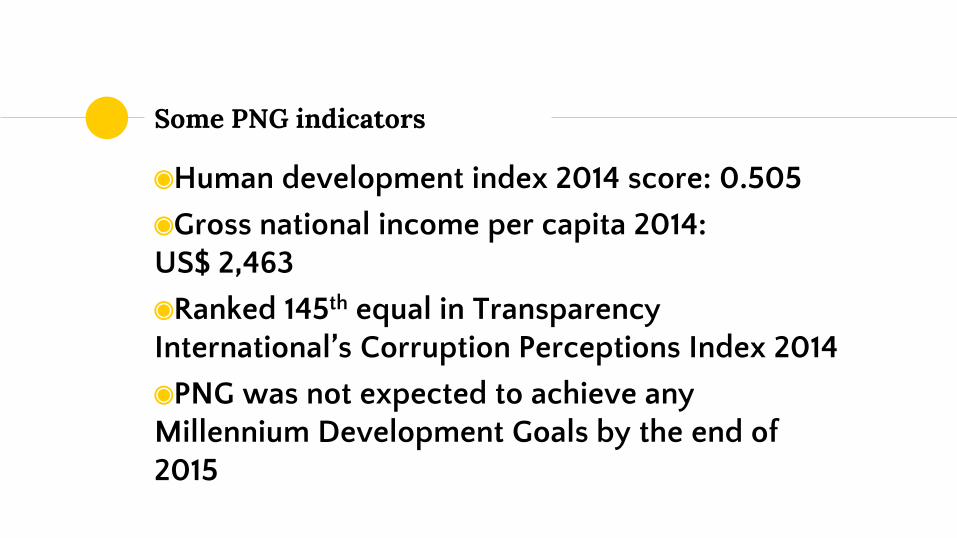
Some PNG indicators
◉Human development index 2014 score: 0.505
◉Gross national income per capita 2014: US$ 2,463
◉Ranked 145th equal in Transparency International’s Corruption Perceptions Index 2014
◉PNG was not expected to achieve any Millennium Development Goals by the end of 2015
PNG government’s 2015 PEFA expectations versus actual results
◉An Asian Development Bank 2014 report indicated PNG government’s objective for 2015 PEFA assessment was for ‘A’ and ‘B’ scores to represent 50% of total scores compared to 32% in 2009
◉In 2015 PEFA assessment A and B scores represented 17% of total scores using test methodology and 18% of total scores using 2011 methodology
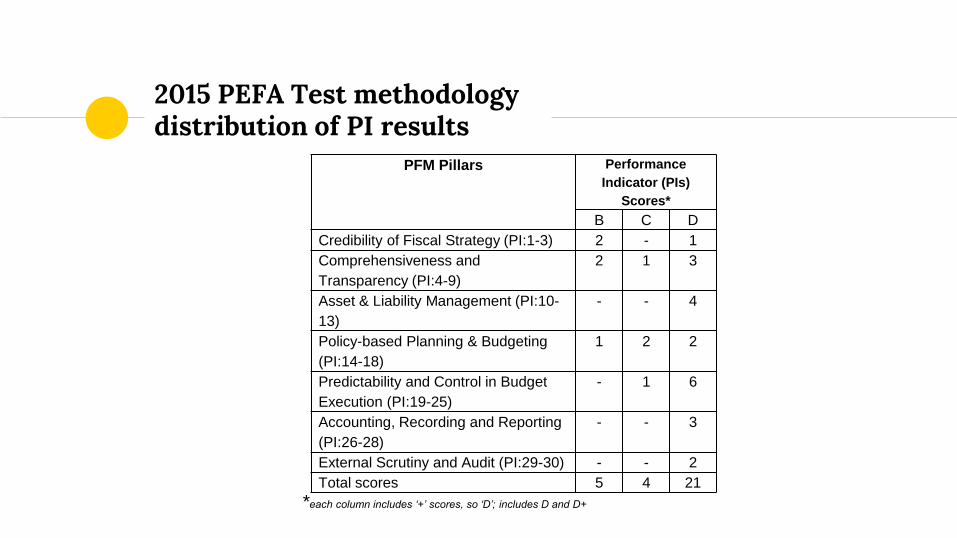
2015 PEFA Test methodology distribution of PI results
*each column includes ‘+’ scores, so ‘D’; includes D and D+
PFM Pillars Performance
Indicator (PIs)
Scores*
B C D
Credibility of Fiscal Strategy (PI:1-3) 2 - 1
Comprehensiveness and
Transparency (PI:4-9)
2 1 3
Asset & Liability Management (PI:10-
13)
- - 4
Policy-based Planning & Budgeting
(PI:14-18)
1 2 2
Predictability and Control in Budget
Execution (PI:19-25)
- 1 6
Accounting, Recording and Reporting
(PI:26-28)
- - 3
External Scrutiny and Audit (PI:29-30) - - 2
Total scores 5 4 21
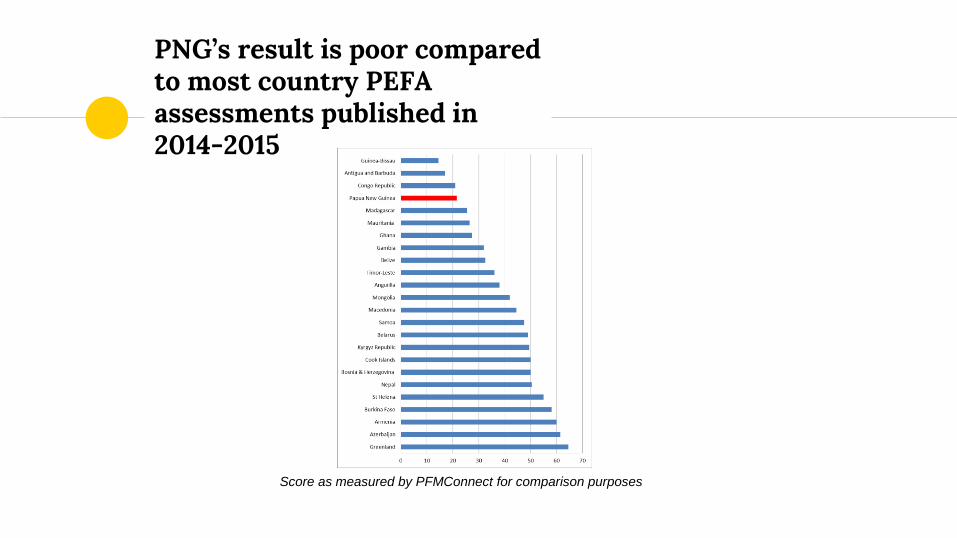
PNG’s result is poor compared to most country PEFA assessments published in 2014-2015
Score as measured by PFMConnect for comparison purposes
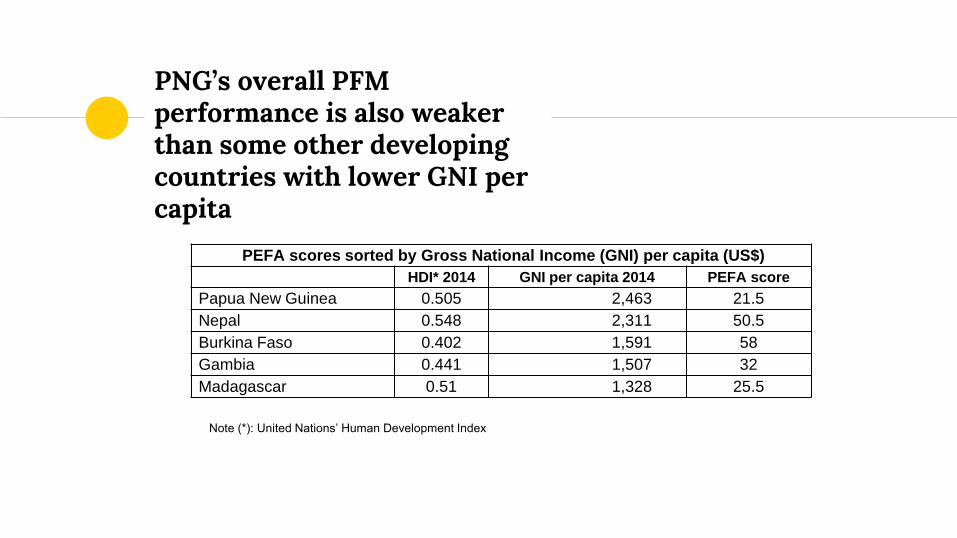
PNG’s overall PFM performance is also weaker than some other developing countries with lower GNI per capita
PEFA scores sorted by Gross National Income (GNI) per capita (US$)
HDI* 2014 GNI per capita 2014 PEFA score
Papua New Guinea 0.505 2,463 21.5
Nepal 0.548 2,311 50.5
Burkina Faso 0.402 1,591 58
Gambia 0.441 1,507 32
Madagascar 0.51 1,328 25.5
Note (*): United Nations’ Human Development Index
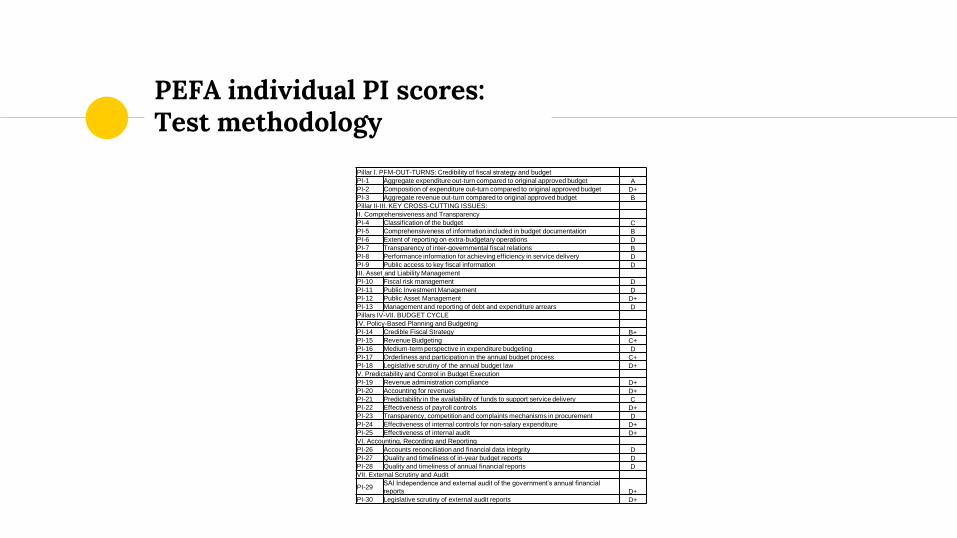
PEFA individual PI scores: Test methodology
Pillar I. PFM-OUT-TURNS: Credibility of fiscal strategy and budget
PI-1 Aggregate expenditure out-turn compared to original approved budget A PI-2 Composition of expenditure out-turn compared to original approved budget D+ PI-3 Aggregate revenue out-turn compared to original approved budget B Pillar II-III. KEY CROSS-CUTTING ISSUES:
II. Comprehensiveness and Transparency
PI-4 Classification of the budget C PI-5 Comprehensiveness of information included in budget documentation B PI-6 Extent of reporting on extra-budgetary operations D PI-7 Transparency of inter-governmental fiscal relations B PI-8 Performance information for achieving efficiency in service delivery D PI-9 Public access to key fiscal information D III. Asset and Liability Management
PI-10 Fiscal risk management D PI-11 Public Investment Management D PI-12 Public Asset Management D+ PI-13 Management and reporting of debt and expenditure arrears D Pillars IV-VII. BUDGET CYCLE
IV. Policy-Based Planning and Budgeting
PI-14 Credible Fiscal Strategy B+ PI-15 Revenue Budgeting C+ PI-16 Medium-term perspective in expenditure budgeting D PI-17 Orderliness and participation in the annual budget process C+ PI-18 Legislative scrutiny of the annual budget law D+ V. Predictability and Control in Budget Execution
PI-19 Revenue administration compliance D+ PI-20 Accounting for revenues D+ PI-21 Predictability in the availability of funds to support service delivery C PI-22 Effectiveness of payroll controls D+ PI-23 Transparency, competition and complaints mechanisms in procurement D PI-24 Effectiveness of internal controls for non-salary expenditure D+ PI-25 Effectiveness of internal audit D+ VI. Accounting, Recording and Reporting
PI-26 Accounts reconciliation and financial data integrity D PI-27 Quality and timeliness of in-year budget reports D PI-28 Quality and timeliness of annual financial reports D VII. External Scrutiny and Audit
PI-29 SAI Independence and external audit of the government’s annual financial
reports D+ PI-30 Legislative scrutiny of external audit reports D+
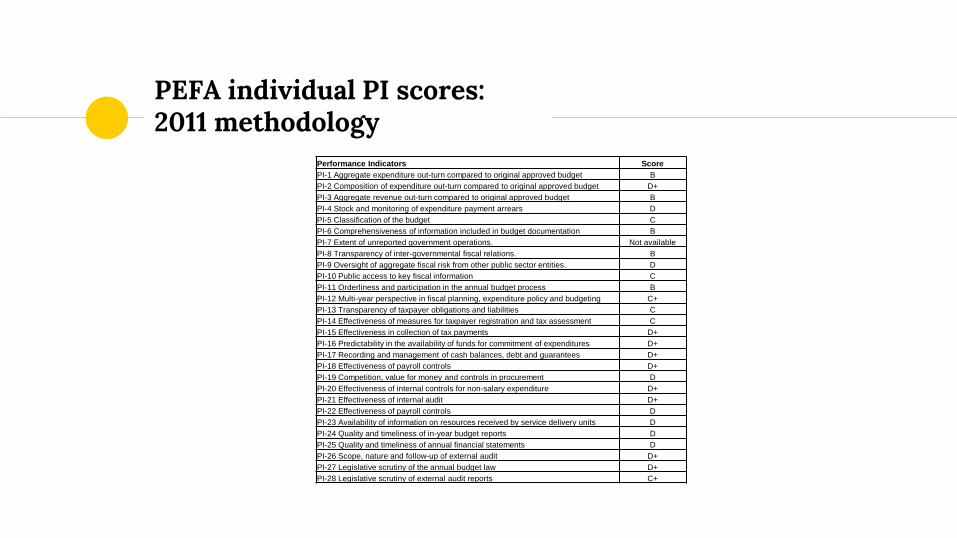
PEFA individual PI scores: 2011 methodology
Performance Indicators Score
PI-1 Aggregate expenditure out-turn compared to original approved budget B
PI-2 Composition of expenditure out-turn compared to original approved budget D+
PI-3 Aggregate revenue out-turn compared to original approved budget B
PI-4 Stock and monitoring of expenditure payment arrears D
PI-5 Classification of the budget C
PI-6 Comprehensiveness of information included in budget documentation B
PI-7 Extent of unreported government operations. Not available
PI-8 Transparency of inter-governmental fiscal relations. B
PI-9 Oversight of aggregate fiscal risk from other public sector entities. D
PI-10 Public access to key fiscal information C
PI-11 Orderliness and participation in the annual budget process B
PI-12 Multi-year perspective in fiscal planning, expenditure policy and budgeting C+
PI-13 Transparency of taxpayer obligations and liabilities C
PI-14 Effectiveness of measures for taxpayer registration and tax assessment C
PI-15 Effectiveness in collection of tax payments D+
PI-16 Predictability in the availability of funds for commitment of expenditures D+
PI-17 Recording and management of cash balances, debt and guarantees D+
PI-18 Effectiveness of payroll controls D+
PI-19 Competition, value for money and controls in procurement D
PI-20 Effectiveness of internal controls for non-salary expenditure D+
PI-21 Effectiveness of internal audit D+
PI-22 Effectiveness of payroll controls D
PI-23 Availability of information on resources received by service delivery units D
PI-24 Quality and timeliness of in-year budget reports D
PI-25 Quality and timeliness of annual financial statements D
PI-26 Scope, nature and follow-up of external audit D+
PI-27 Legislative scrutiny of the annual budget law D+
PI-28 Legislative scrutiny of external audit reports C+
2015 PEFA: Some key results
◉PI scores were poor for four of the seven Pillars assessed using the Test methodology
◉Numerous basic PFM functions are not undertaken effectively
◉Poor performance in PFM activities such as expenditure and payroll controls, preparation of annual financial statements and external scrutiny and audit has been tolerated by the government for at least the last seven years
◉Limited accountability and weak capacity inhibits PFM performance

Root causes of PNG’s poor PFM
◉The PEFA assessment identifies some contributing factors but does not address these in any detail:
A significant level of non-compliance with current PFM rules indicating a lack of government leadership
Relatively low overall PFM capacity in the public sector
Impact of PNG’s poor PFM
◉Service delivery at operational and project levels are impaired by weaknesses in various PFM activities
◉PNG’s poor overall standard of PFM does not promote efficiency in service delivery
Government response to 2015 PEFA
◉No apparent public disclosure of the 2015 PEFA results
◉PNG government has subsequently prepared a “road map” for PFM Reform but this has not yet been published
◉Whilst 2015 Budget identified reforms in state-owned enterprises, Government Finance Statistics and debt management, no reference was made to promoting increased accountability in PFM
Will the government’s PFM road map make meaningful progress?
◉The lack of transparency for the PFM road map raises suspicions that this plan may not be robust, viz.:
Is the plan fit for purpose and supported by all key stakeholders, particularly the government?
Are resources available to ensure the timely completion of planned activities?
Are the planned activities’ proposed time scales and performance standards realistic?
Can the road map activities be easily monitored?
Development partners’ role in future PFM reform
◉Development partners’ taxpayers and PNG citizens would hope that the PNG’s 2015 PFM road map is published and satisfies the criteria mentioned previously
◉Additional moral suasion and incentives by development partners may be necessary if the road map is to avoid a continuation of PNG’s recent seven years plus poor overall PFM record

Conclusions
◉PNG’s poor PFM performance is very concerning
◉The Government’s failure to publish PEFA reports and the new PFM road map indicates a lack of readiness to address the situation appropriately
◉International agencies must demand more engagement by the PNG Government
◉PEFA assessments must do more to identify root causes of poor PFM performance in fragile states

Postscript
◉ You can download PFMConnect’s blog at http://blog-pfmconnect.com/papua-new-guineas-poor-deteriorating-financial-management-can-turned-around/

We are PFMConnect Contact us to be advised about future presentations at http://www.pfmconnect.com, http://blog-pfmconnect.com, https://www.facebook.com/Improvingpublicfinancialmanagement/ & https://www.pinterest.com/pfmconnect/
Thanks!