parallel dasymetric mapping for gis modeling · parallel dasymetric mapping for gis modeling zhang...
TRANSCRIPT

Parallel Dasymetric Mapping for GIS Modeling ZHANG ZHEN
Mentors: CHENG LIU, KWAI WONG, LONNIE CROSBY, NICHOLAS NAGLE

Overview Population data Ancillary-level data
(land type data)
High-resolution population data

Why parallel? • Time: It will cost a long time to do
dasymetric mapping for the whole US according to all kinds of features.
• Space: All the data (50GB for the whole states using my method, maybe need more space if using more complicated algorithms) can hardly be fit into a single memory.

Stages • Stage 1: Data preparation
• Stage 2: Implement the serial method
• Stage 3: Implement the method in parallel
• Stage 4: Run the method on a larger scale
Input data • National Land Cover Data(NLCD) dataset
• Block group boundary file
• American Community Survey(ACS) Summary Table

National Land Cover Data
GDAL + QGIS
gdal_translate –projwin 503195 1616420 0 1284342 1332116 /Users/bhh/Desktop/GIS/nlcd_ 2011_edition.img …...

Block group boundary file
gdal_rasterize -b 1 -b 2 -b 3 -burn 0 -burn 0 -burn 0 -l another /Users/bhh/Desktop/GIS-ZHANG/cb_2015_47_bg_500k/yourinputfile.shp /Users/bhh/Desktop/youroutputfile.tif …........

American Community Survey(ACS) Summary Table
Total population
Asian population
White population
Black population
Processes 1,2,3,4
Processes 5,6,7,8
Processes 9,10,11,12
Processes 13,14,15,16
Doing dasymetric mapping for different groups simultaneously

Work Distribution NLCD data Block group boundary file ACS Summary Table
Input file
1,2,3,4 5,6,7,8 9,10,11.12 13,14,15,16
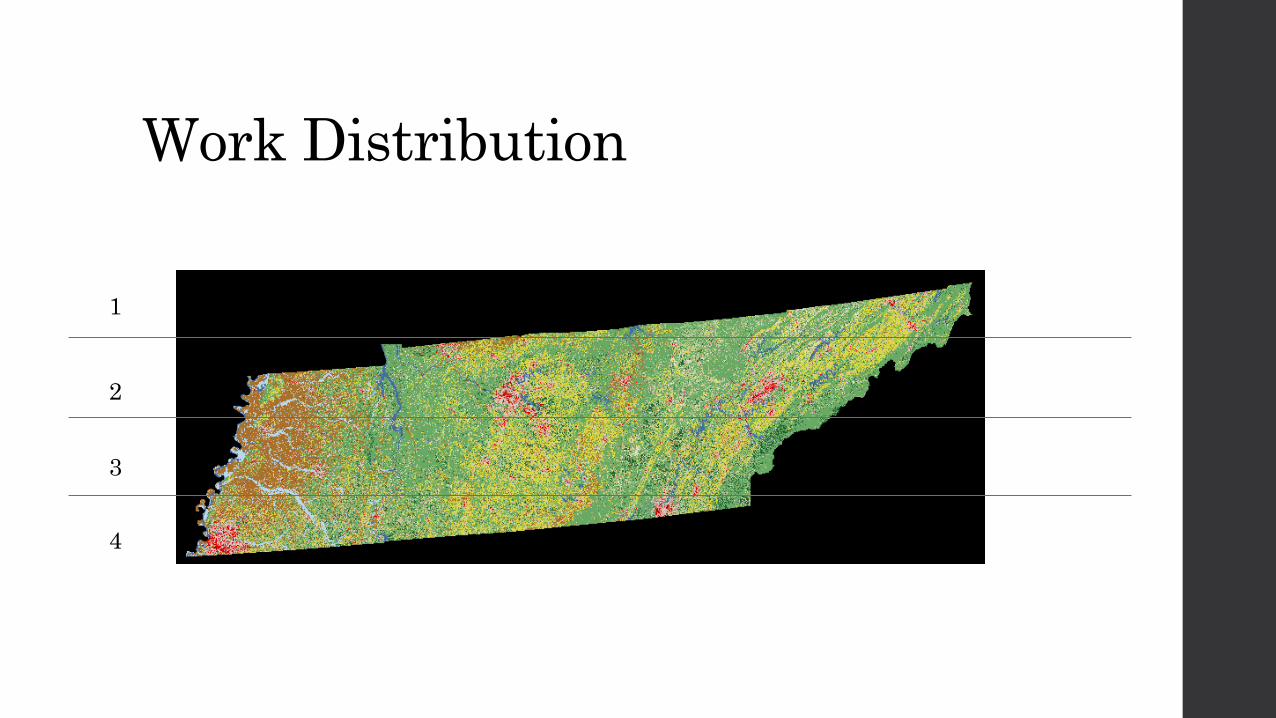
Work Distribution
1
2
3
4
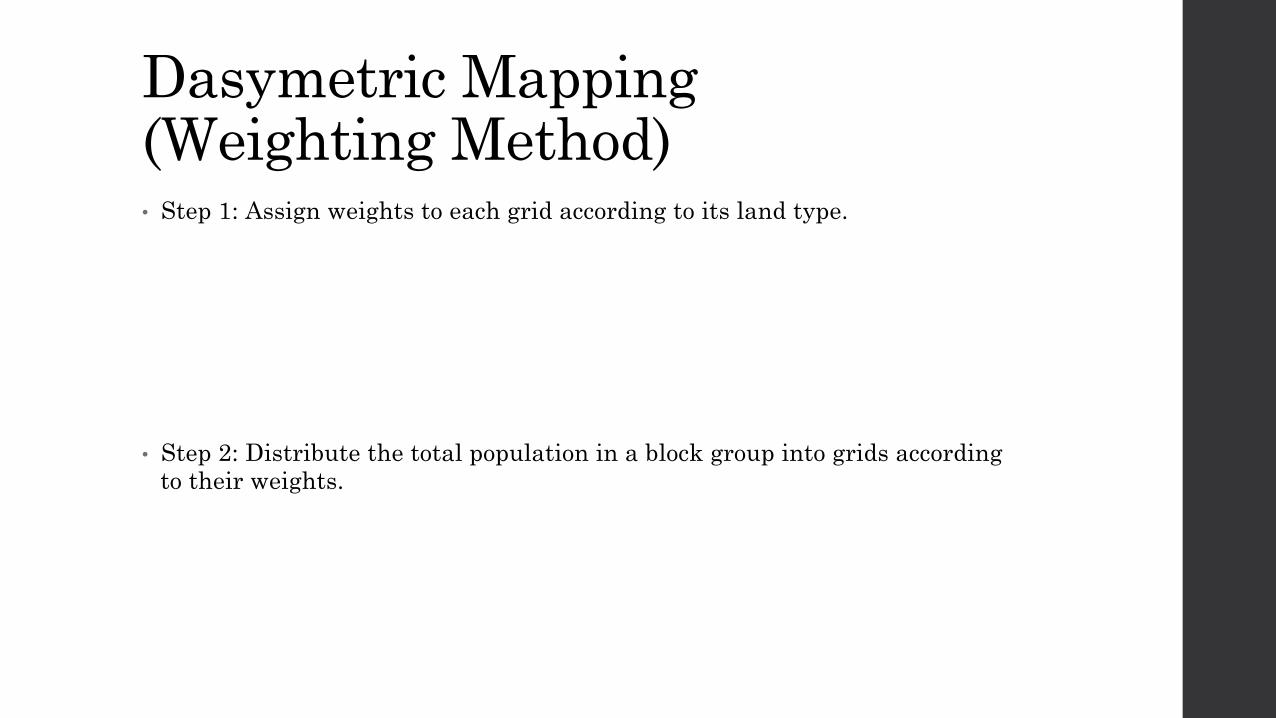
Dasymetric Mapping (Weighting Method) • Step 1: Assign weights to each grid according to its land type.
• Step 2: Distribute the total population in a block group into grids according to their weights.
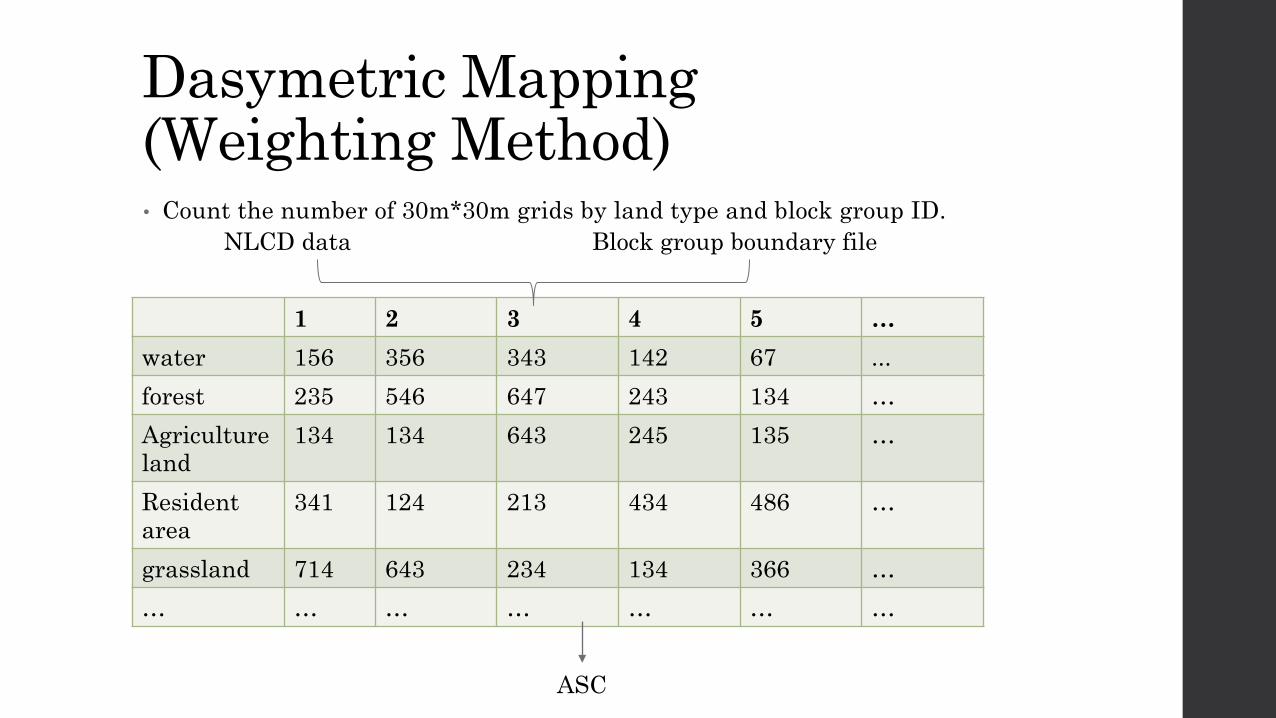
Dasymetric Mapping (Weighting Method) • Count the number of 30m*30m grids by land type and block group ID.
1 2 3 4 5 …
water 156 356 343 142 67 ...
forest 235 546 647 243 134 …
Agriculture land
134 134 643 245 135 …
Resident area
341 124 213 434 486 …
grassland 714 643 234 134 366 …
… … … … … … …
ASC
NLCD data Block group boundary file

Cont.
1
2
3
4
ASC1
ASC2
ASC3
ASC4
ASC
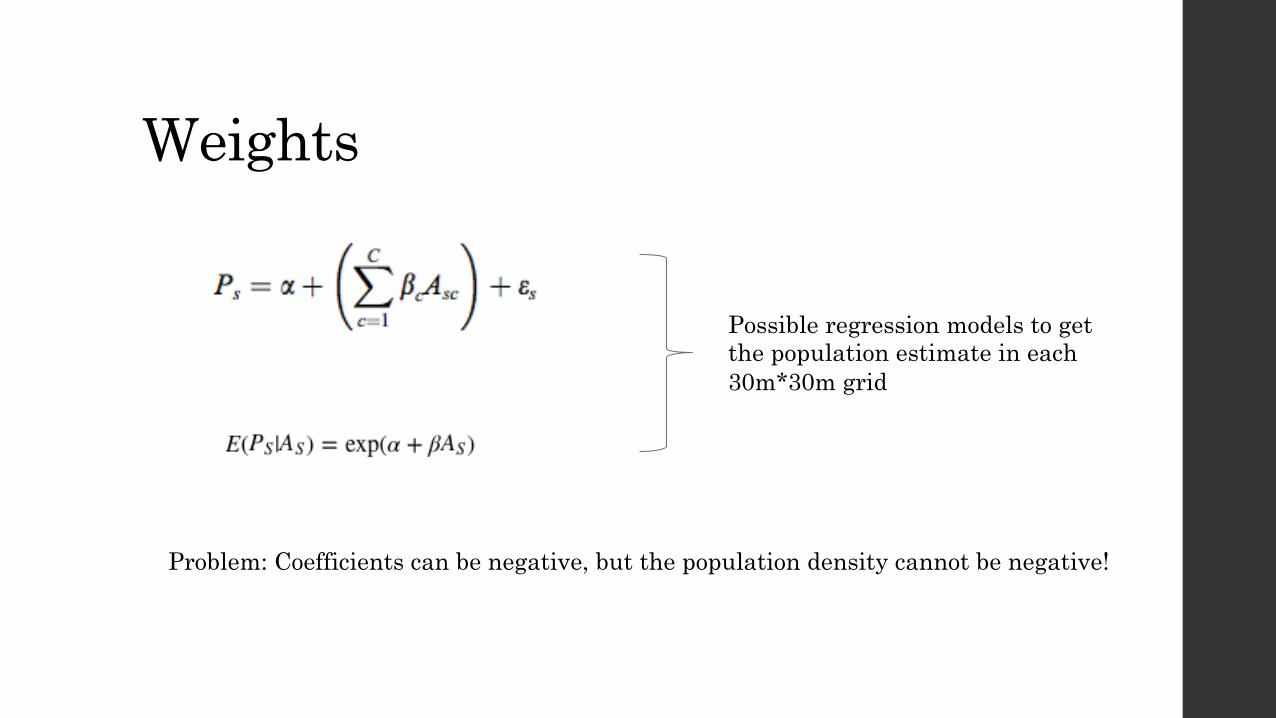
Weights
Possible regression models to get the population estimate in each 30m*30m grid
Problem: Coefficients can be negative, but the population density cannot be negative!
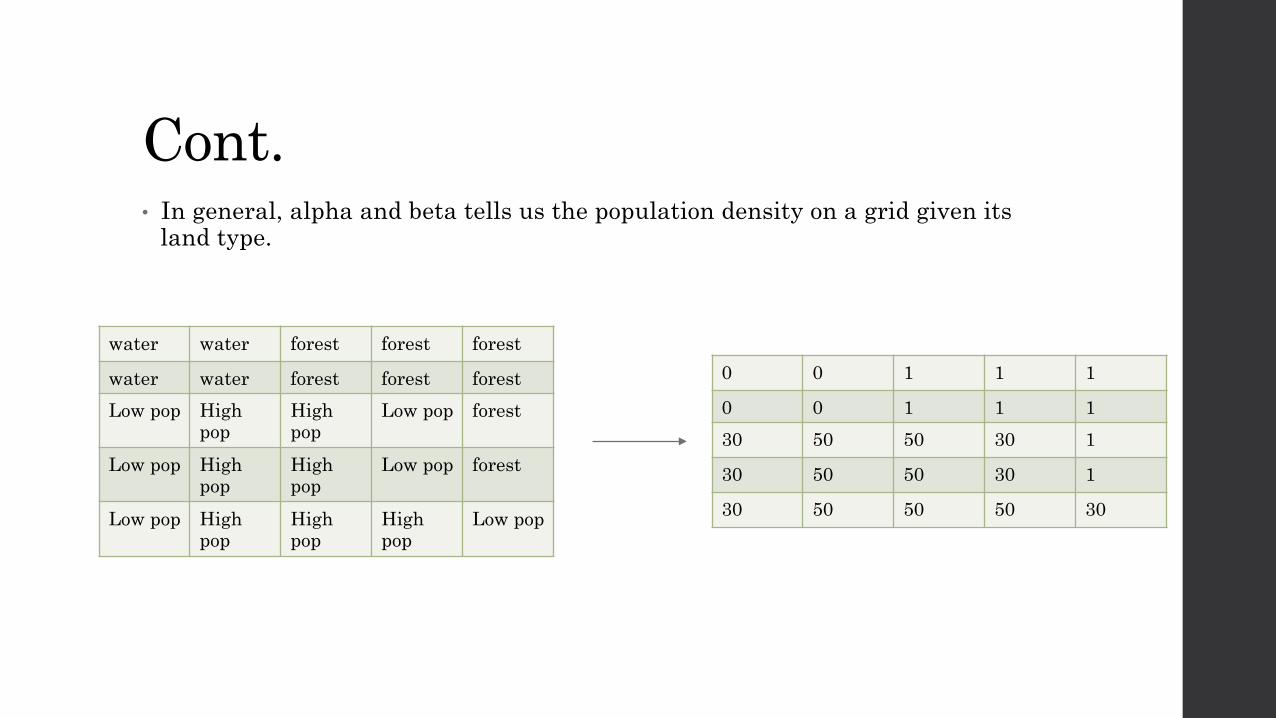
Cont. • In general, alpha and beta tells us the population density on a grid given its
land type.
water water forest forest forest
water water forest forest forest
Low pop High pop
High pop
Low pop forest
Low pop High pop
High pop
Low pop forest
Low pop High pop
High pop
High pop
Low pop
0 0 1 1 1
0 0 1 1 1
30 50 50 30 1
30 50 50 30 1
30 50 50 50 30
Calculation • However, population in a grid is not only determined by its land type, it is
also related to the total population of its block group.
• We need to adjust according to the total population in a block group.(ACS)
• Population in a grid is equal to the total population of the block group that it belongs to times the weight of this grid divided by the total sum of weights in this block group.
• The only unknown parameter: total weights of the block group, if it is known, we can do this process in parallel easily.

Total Weights • Will not cost a lot of time, because useful information is already stored.
ASC 40 water, 500 high pop, 300 low pop
Alpha, beta Weight for water:0 Weight for high pop: 50 Weight for low pop: 30
Total weights for this block group is: 40*0+500*50+300*30

Result
Total population
White population
Asian population
Black population

Future Work • Larger study area
• More population groups
• More complicated algorithms
• Some improvements
Easy (Our algorithm is scalable)

PMEDM Method
Advantages
Fast More accurate Errors can be estimated

Comparison
PMEDM Weighting Method(Parallel)

Reasons for the difference • Different coloring method (Not important)
• My code is performed on the whole Tennessee, thus there may be area with fewer population
• Dr. Nagle’s algorithm is more accurate
Some areas are grey rather than white
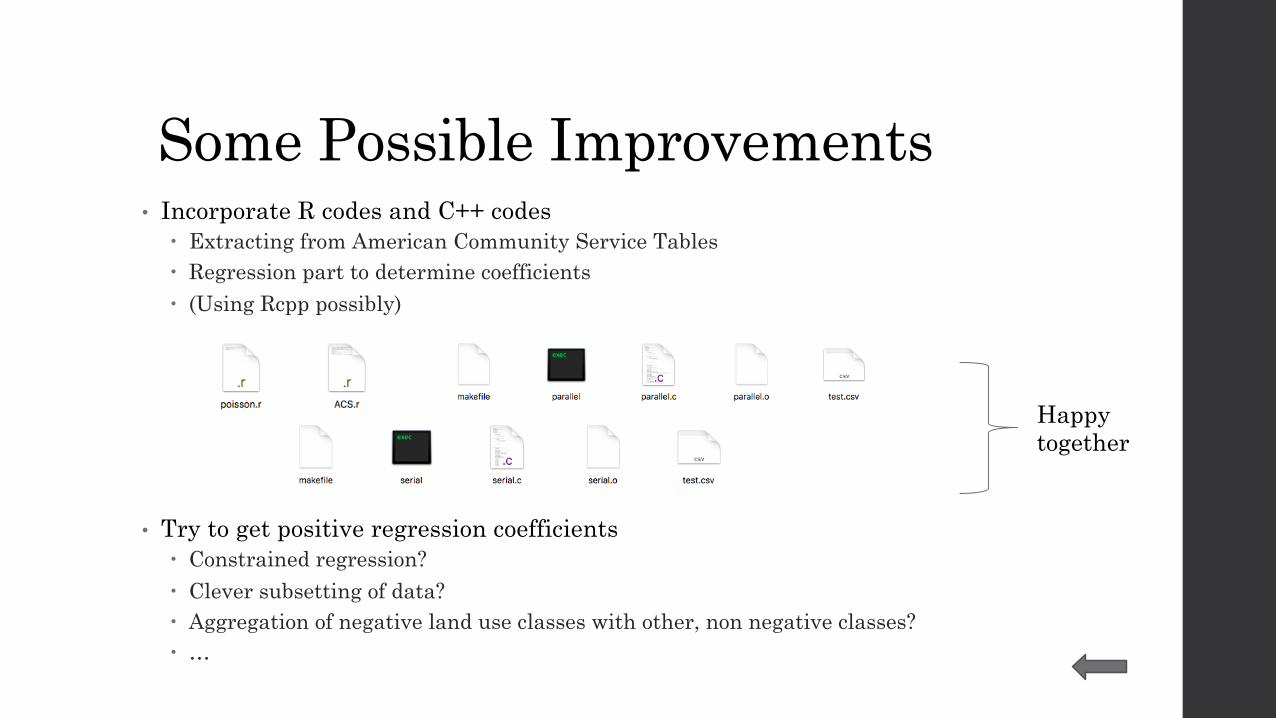
Some Possible Improvements • Incorporate R codes and C++ codes
� Extracting from American Community Service Tables � Regression part to determine coefficients � (Using Rcpp possibly)
• Try to get positive regression coefficients � Constrained regression? � Clever subsetting of data? � Aggregation of negative land use classes with other, non negative classes? � …
Happy together

References • Langford, M. (2006). Obtaining population estimates in non-census reporting
zones: An evaluation of the 3-class dasymetric method. Computers, Environment and Urban Systems, 30(2), 161-180.
• Jeremy Mennis and Torrin Hultgren, Intelligent Dasymetric Mapping and Its Application to Areal Interpolation Cartography and Geographic Information Science, Vol. 33, No. 3, 2006, pp. 179-194
• Nicholas N. Nagle , Barbara P. Buttenfield , Stefan Leyk & Seth Spielman (2014) Dasymetric Modeling and Uncertainty, Annals of the Association of American Geographers, 104:1, 80-95, DOI: 10.1080/00045608.2013.843439
• Dependence-Preserving Approach to Synthesizing Household Characteristics
• Numerical Optimization Chp4.1-4.2

Acknowledgements • Support from City University of Hong Kong, Oak Ridge National
Laboratory, Joint Institute for Computational Sciences and University of Tennessee are gratefully acknowledged.