parallel market software user manual
TRANSCRIPT
30 September 2018
This publication was produced for review by the United States Agency for International Development. It was prepared by Deloitte Consulting LLP. The author’s views expressed in this publication do not necessarily reflect the views of the United States Agency for International Development or the United States Government.
PARALLEL MARKET SOFTWARE
USER MANUAL
USAID GOVERNING FOR GROWTH (G4G) IN GEORGIA

USAID | GOVERNING FOR GROWTH (G4G) IN GEORGIA PARALLEL MARKET SOFTWARE USER MANUAL i
PARALLEL MARKET
SOFTWARE USER MANUAL
USAID GOVERNING FOR GROWTH
(G4G) IN GEORGIA
CONTRACT NUMBER: AID-114-C-14-00007
DELOITTE CONSULTING
LLP USAID | GEORGIA
USAID CONTRACTING OFFICER’S
REPRESENTATIVE: PHILLIP GREENE
AUTHOR(S): GRDS
ENERGY TRADING MECHANISM REFORM:
4420
LANGUAGE: ENGLISH
30 SEPTEMBER 2018
DISCLAIMER:
This publication was produced for review by the United States Agency for International Development. It was prepared by Deloitte Consulting LLP. The author’s views expressed in this publication do not necessarily reflect the views of the United States Agency for International Development or the United States Government.
USAID | GOVERNING FOR GROWTH (G4G) IN GEORGIA PARALLEL MARKET SOFTWARE USER MANUAL ii
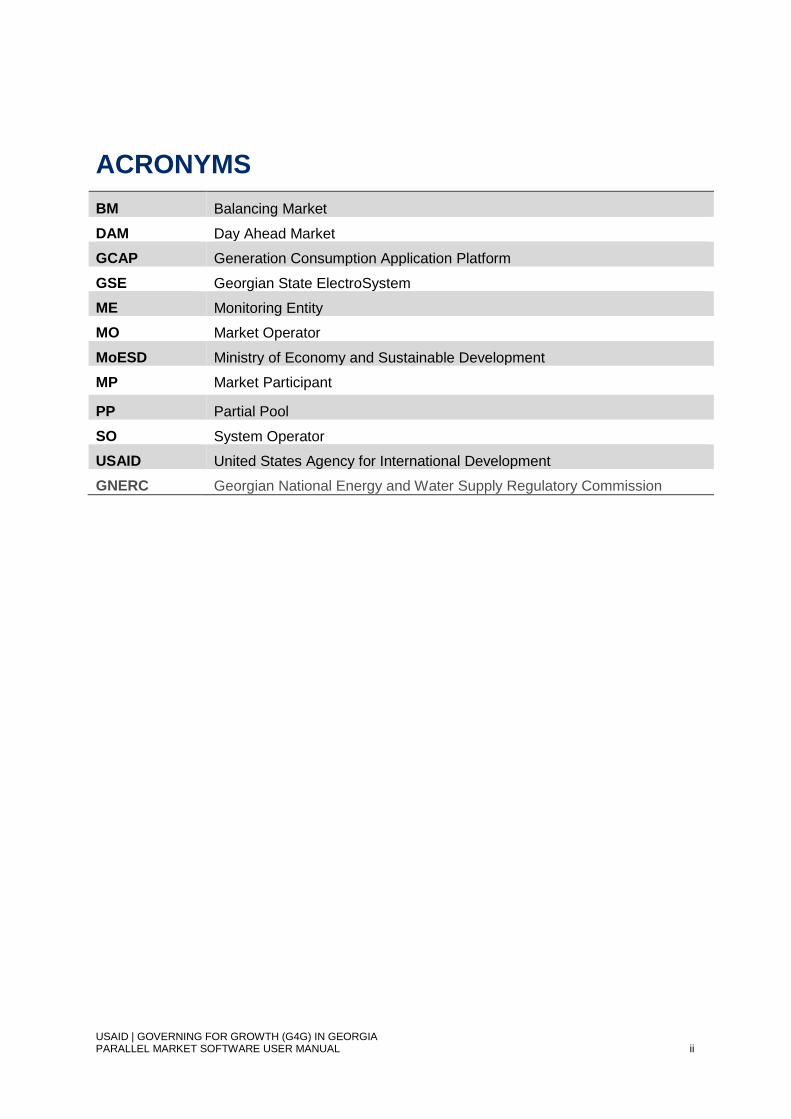
ACRONYMS BM Balancing Market
DAM Day Ahead Market
GCAP Generation Consumption Application Platform
GSE Georgian State ElectroSystem
ME Monitoring Entity
MO Market Operator
MoESD Ministry of Economy and Sustainable Development
MP Market Participant
PP Partial Pool
SO System Operator
USAID United States Agency for International Development
GNERC Georgian National Energy and Water Supply Regulatory Commission
USAID | GOVERNING FOR GROWTH (G4G) IN GEORGIA PARALLEL MARKET SOFTWARE USER MANUAL iii
CONTENTS
BACKGROUND ...................................................................................................................................... 4
1. ACCESSES AND MARKET STRUCTURE .................................................................................. 5
2. NOMINATIONS, MONITORING AND NOTIFICATIONS ........................................................... 10
3. ELECTRICITY BALANCE .......................................................................................................... 18
4. CONTRACTS .............................................................................................................................. 25
5. DAY AHEAD MARKET .............................................................................................................. 31
6. BALANCING (DEVIATION) MARKET ....................................................................................... 33
7. SETTLEMENT ............................................................................................................................ 38
8. ANALYTICS ................................................................................................................................ 45

4
USAID | GOVERNING FOR GROWTH (G4G) IN GEORGIA PARALLEL MARKET SOFTWARE USER MANUAL
BACKGROUND
This document is the Parallel Market Software User Manual for the software developed according to the Methodology for Parallel Market Software Development.
The developed software uses the data and results of calculations of Generation Consumption Application Platform (GCAP) software developed by GRDS upon Georgian State Electrosystem’s (GSE) request in 2014 (this requirement was featured in SoW for the development of Parallel Market software).
In this regard, the main inputs for the parallel market are planning applications sent by market participants (MPs) and electricity balances composed by the system operator (SO). However, besides daily and monthly applications and balances existing in GCAP, there was need for weekly applications and balances. Not to change the logic and interactions of users, weekly applications and balances are added in GCAP software (see chapter 2 and 3).
All the other modules were developed in the parallel market software.
The User Manual is a common document which describes the functionality for:
System Operator;
Market Operator;
Metering Operator;
Market Participants:
Generators;
Off-takers;
Traders.
Market Monitoring entities.
Each chapter of this document is aligned to the rights of each user type in each module.
At the time of preparing the Manual, there were no approved rules for a new (hourly) market with clearly defined options for each trade sector (segment) in Georgia, which is why the software uses a multi-optional approach, allowing it to be viewed as a tool to develop optimal rules for the electricity market in Georgia.
At the time of writing this Manual, an MO was not created in Georgia. All the main functions are actually performed by GSE. On the other hand, the launch of the parallel market software is needed as soon as possible.
In this regard, the Ministry of Economy and Sustainable Development (MoESD) held a meeting with G4G (the client) and GRDS (contractor, developer of the software, author of this document) and decided to entrust GSE with administration and operation of the software, thereby enabling the SO to perform the functions of the MO at this stage (this is reflected in Chapter 1 when determining accesses to the modules that perform certain functions).
During transition to the new market, in terms of creating the rules, work should be conducted with other key stakeholders (MoESD, Georgian National Energy and Water Supply Regulatory Commission (GNERC), Electricity System Commercial Operator (ESCO)). Because of this, a mechanism for implementing market monitoring functions based on analysis of the results provided by GSE has been developed.
The software will be designed considering previously implemented software for the Georgian market and will operate with them in a unified environment. The software is web-based which means that MPs will need no other software except browsers to work with the software.
Considering the large volume of functions, options in the software, training and distribution of the Methodology and trainings materials in addition to this User Manual are envisaged.

5
USAID | GOVERNING FOR GROWTH (G4G) IN GEORGIA PARALLEL MARKET SOFTWARE USER MANUAL
1. ACCESSES AND MARKET STRUCTURE Provision of accesses and access to the market structure belongs to the SO, while the accesses should be used by all users to enter the software.
Access to the system will be granted to all registered qualified enterprises and users of Generation Consumption Application Platform (GCAP) - GSE Nominations Software (generation licenses, distribution licensees, direct consumers, importers, exporters, and small power plants). Access also may be granted to new enterprises entering the wholesale electricity market. For wholesale customers, both the “consumer” and “off-taker” (was used in GCAP and is familiar to users) terms are used.
Single sign-on has been implemented so that users have one login/password combination for both GCAP and the parallel market software (Fig.1.1).
Figure 1.1 Login Page
Once user logs in he sees the homepage of the parallel market software
6
USAID | GOVERNING FOR GROWTH (G4G) IN GEORGIA PARALLEL MARKET SOFTWARE USER MANUAL
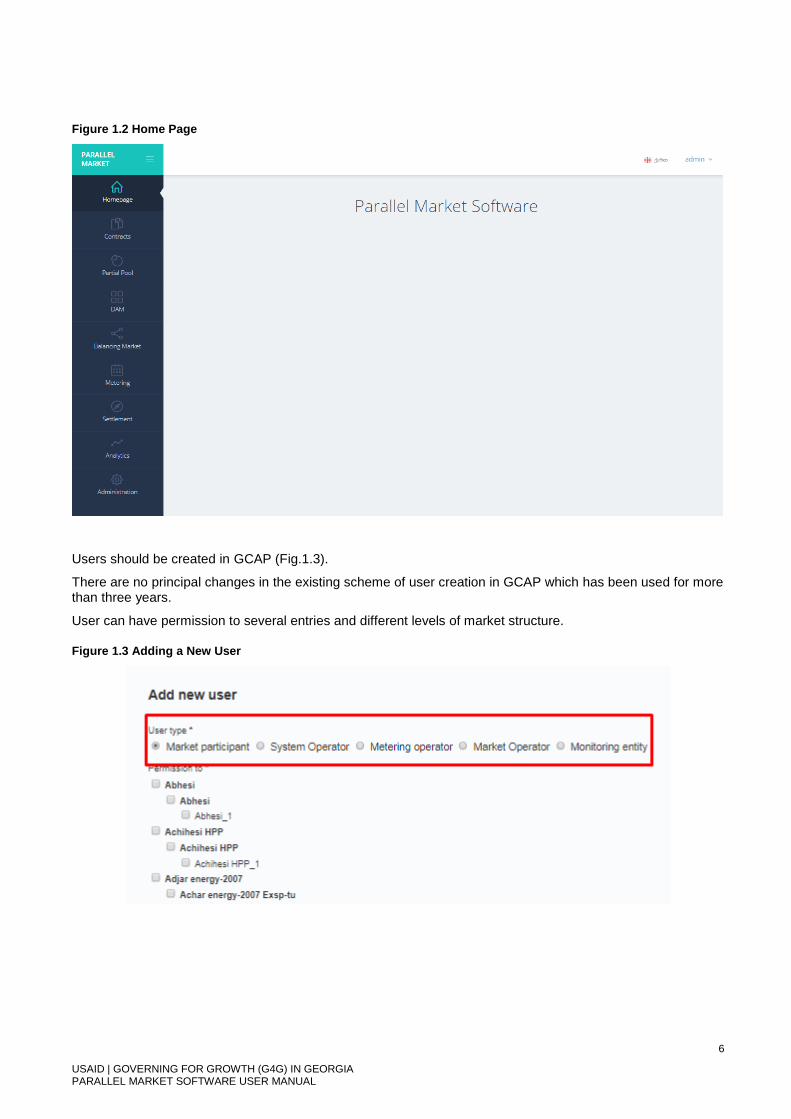
Figure 1.2 Home Page
Users should be created in GCAP (Fig.1.3).
There are no principal changes in the existing scheme of user creation in GCAP which has been used for more than three years.
User can have permission to several entries and different levels of market structure.
Figure 1.3 Adding a New User
7
USAID | GOVERNING FOR GROWTH (G4G) IN GEORGIA PARALLEL MARKET SOFTWARE USER MANUAL
There are five types of possible users on the electricity market with the following roles; the corresponding functions are given in accordance with the MoESD solution - MO functions were performed by the SO at the time of preparing this document.
Market Participant:
Upload planning applications (Chapter 2);
Communication with SO – (Chapters 2 and 3);
Receive final planning balance - (Chapter 3);
Send and confirm load shapes of bi-lateral non-regulated contracts (Chapter 4);
Send bids for the day-ahead market (DAM) to the MO (Chapter 5);
Access to the own results (Chapter 8).
System Operator:
Register new market participants in market structure (currently is done by GSE in GCAP);
Create users and assign them to the market participants (currently is done by GSE in GCAP);
The process is as follows: for the first time user receives username and password from System Operator (directly, by phone, by e-mail, via encrypted messaging applications, etc…). It is highly recommended that username and password are provided via separate channels to ensure higher security. Once provided user should login to the software and change the password. The cryptographic hash of it will be kept in the database.
Receive and monitor planning applications (Chapter 2);
Form final planning balances (Chapter 3);
Bi-lateral Contracts and Partial Pool module to register contracts (Chapter 4);
DAM module including bids (Chapter 5);
Calculation of the deviations and the identification of their initiatives based on the actual balance provided by the metering operator (GSE) (Chapter 6);
Balancing module to define prices (Chapter 6);
Settlement for regulated sector (partial pool) as well as for DAM and balancing market (BM) (Chapter 7);
Total results on contracting, DAM and BM volumes (Chapters 4, 5, 6, 7);
Analytical module (Chapter 8).
Metering Operator:
Upload actual balance (Chapter 6).
Market Operator:
Once the MO is created, redistribution of functions between the MO and SO will be done and the system of accesses will be changed according to the new distribution.
Monitoring entities.
MoESD, GNERC and ESCO will be able to view and monitor:
Planning balances by days;
Actual balances by days;
Deviations;

8
USAID | GOVERNING FOR GROWTH (G4G) IN GEORGIA PARALLEL MARKET SOFTWARE USER MANUAL
Settlement results;
Results of analysis.
Thus, at the initial stage, GSE will perform all the functions of both the SO and MO, and this should be taken into account when reading the document (in text below). Keeping both namesin the text is conditioned by the future optimization of the performed functions in the presence of the MO.
Market Structure – market structure is defined in the GCAP software (Fig. 1.4). The structure is defined as 3-level structure for all participants. That means there is one parent company which can own one or more participants (generator/off-taker/trader) which, in their turn, can have multiple nodes (for domestic market, export or import).
Figure 1.4 Market Structure
Generators may be thermal power-plants (TPPs), hydro-power plants (HPPs), Wind or Solar. HPPs in their
turn can be described as (Fig. 1.5):
Seasonal;
Regulated;
Deregulated.

9
USAID | GOVERNING FOR GROWTH (G4G) IN GEORGIA PARALLEL MARKET SOFTWARE USER MANUAL
Figure 1.5
All new customers exiting in the market should be created here and the checkbox should be checked, so that they are described as exiting off-takers. The voltage class should be selected for the ones where applicable (Fig. 1.6). A universal supplier can also be created here as a separate off-taker.
Figure 1.6
10
USAID | GOVERNING FOR GROWTH (G4G) IN GEORGIA PARALLEL MARKET SOFTWARE USER MANUAL
2. NOMINATIONS, MONITORING AND NOTIFICATIONS
This module is used by MPs (submitting planning applications, dialogue with SO) and the SO (monitoring of applications, dialogue with MPs). MPs only have access to their applications while the SO can view all applications.
GCAP (developed by GRDS and USAID funded) has modules that allow MPs to send their DAP and MAP data after which the data is monitored. However, the parallel market software may also work with week-ahead planning (WAP) data for which weekly applications, monitoring and notifications module in addition to upgrades for day/month ahead modules has been developed (the type of applications are defined by the practices used in power sector) in the GCAP software.
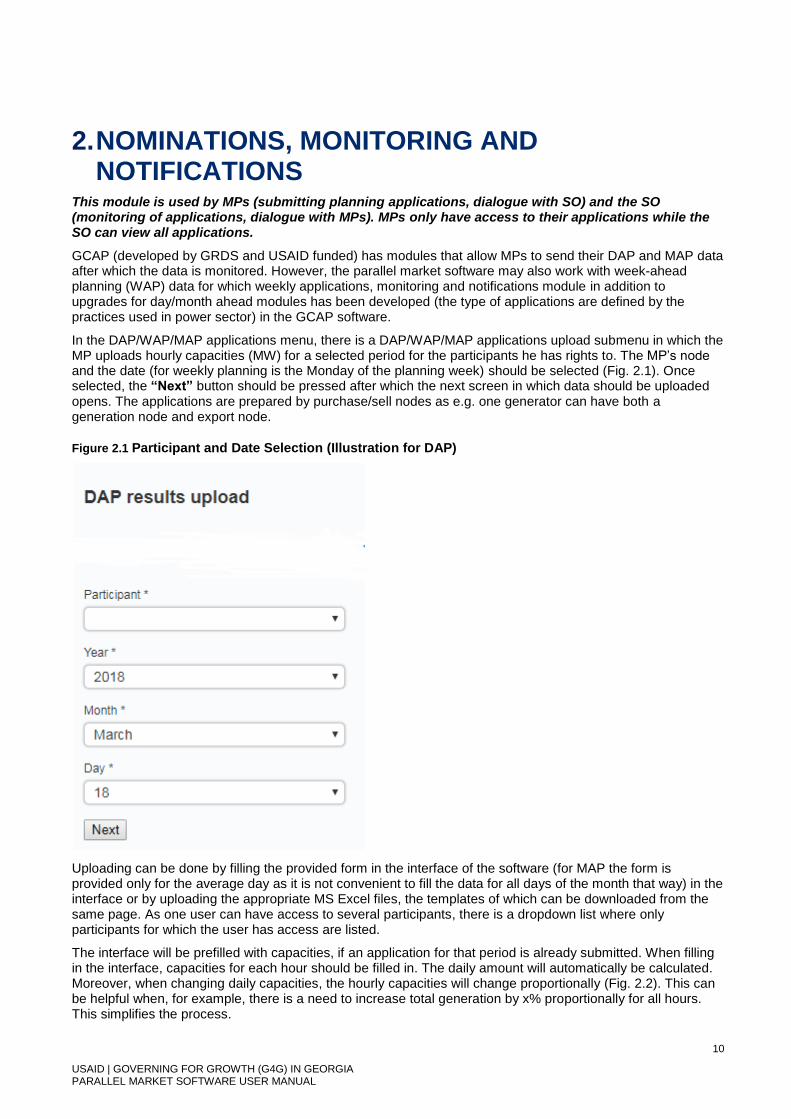
In the DAP/WAP/MAP applications menu, there is a DAP/WAP/MAP applications upload submenu in which the MP uploads hourly capacities (MW) for a selected period for the participants he has rights to. The MP’s node and the date (for weekly planning is the Monday of the planning week) should be selected (Fig. 2.1). Once selected, the “Next” button should be pressed after which the next screen in which data should be uploaded opens. The applications are prepared by purchase/sell nodes as e.g. one generator can have both a generation node and export node.
Figure 2.1 Participant and Date Selection (Illustration for DAP)
Uploading can be done by filling the provided form in the interface of the software (for MAP the form is provided only for the average day as it is not convenient to fill the data for all days of the month that way) in the interface or by uploading the appropriate MS Excel files, the templates of which can be downloaded from the same page. As one user can have access to several participants, there is a dropdown list where only participants for which the user has access are listed.
The interface will be prefilled with capacities, if an application for that period is already submitted. When filling in the interface, capacities for each hour should be filled in. The daily amount will automatically be calculated. Moreover, when changing daily capacities, the hourly capacities will change proportionally (Fig. 2.2). This can be helpful when, for example, there is a need to increase total generation by x% proportionally for all hours. This simplifies the process.
11
USAID | GOVERNING FOR GROWTH (G4G) IN GEORGIA PARALLEL MARKET SOFTWARE USER MANUAL
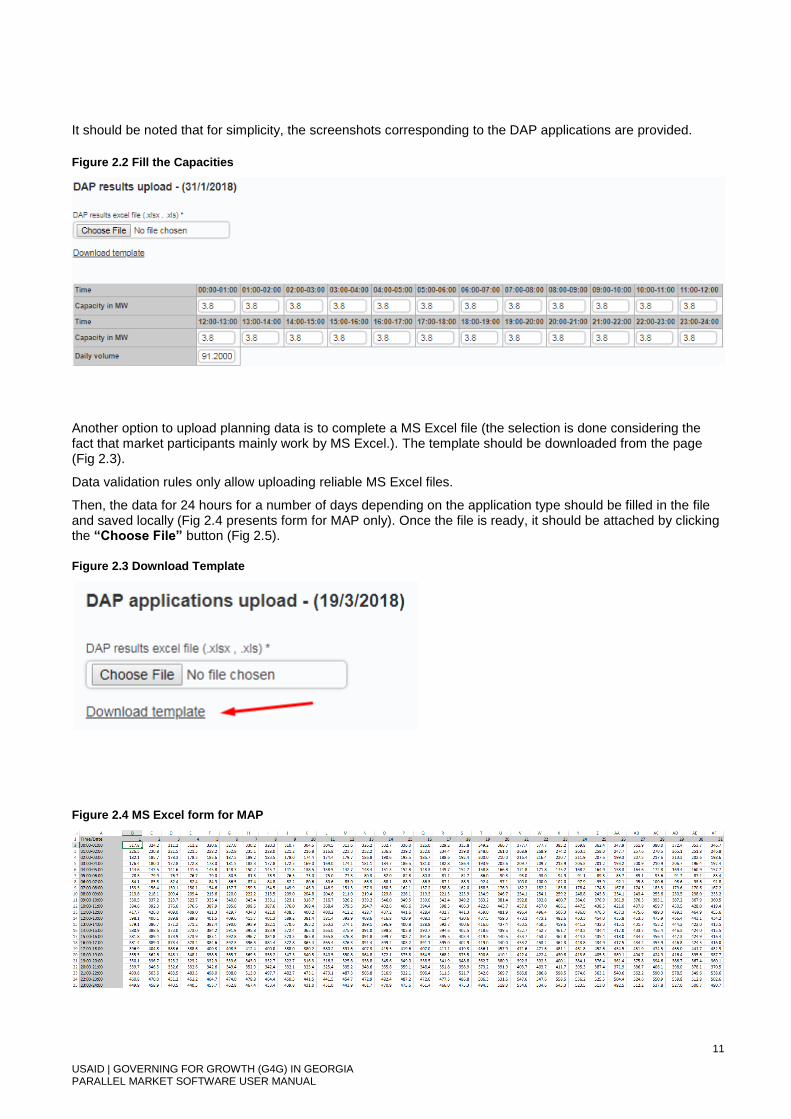
It should be noted that for simplicity, the screenshots corresponding to the DAP applications are provided.
Figure 2.2 Fill the Capacities
Another option to upload planning data is to complete a MS Excel file (the selection is done considering the fact that market participants mainly work by MS Excel.). The template should be downloaded from the page (Fig 2.3).
Data validation rules only allow uploading reliable MS Excel files.
Then, the data for 24 hours for a number of days depending on the application type should be filled in the file and saved locally (Fig 2.4 presents form for MAP only). Once the file is ready, it should be attached by clicking the “Choose File” button (Fig 2.5).
Figure 2.3 Download Template
Figure 2.4 MS Excel form for MAP

12
USAID | GOVERNING FOR GROWTH (G4G) IN GEORGIA PARALLEL MARKET SOFTWARE USER MANUAL
Note. MAP template is represented here as it is the largest one. The DAP application is the same MS Excel
document with just one column.
Figure 2.5 Attaching File
Once the data is filled or the file is attached, the MP can also write a comment regarding the capacities in applications and press the “Upload” button, so that the data is sent (Fig. 2.6). The MP and SO can see the comments in the applications list.
Uploaded applications are reflected immediately. Any user who has access to the selected participant can upload the application.
Figure 2.6 Comment and Upload
In the applications list, the MP can see all the applications of the nodes he has access to, and the SO can see all the applications (Fig.2.7). These are three different menus for DAP/WAP/MAP applications. The illustrated one is the DAP application list as an example.
Currently, GSE is the responsible entity to enter the purchase/sell nodes data as well as market structure as a whole (they also edit it). If the solution is revised the corresponding change in roles will be done in the software.
Figure 2.7 DAP Application List
The list also provides the following information regarding the application:
1. User who has uploaded the application;
2. Market participant for which the application is uploaded;
3. Purchase/sell node for which the application is uploaded. All the types of nodes are defined in market structure of GCAP;
4. Upload date and time;
5. The date of planning day/week/month. For week, the date of Monday is shown and for month only the year and month are shown;

13
USAID | GOVERNING FOR GROWTH (G4G) IN GEORGIA PARALLEL MARKET SOFTWARE USER MANUAL
6. Comment;
7. Status of application – “New uploaded DAP”, “Rejected DAP”, “Accepted DAP”, “Replaced with new one”, “Hasn’t uploaded”.
In the actions row, the MP can view his application while the SO has the following options:
1. View;
2. Monitoring ;
3. Accept – should be done based on SO’s expert assessment;
4. Reject - should be done based on SO’s expert assessment.
Pressing the “View” button allows both the MP and SO to see the application as it was uploaded (Fig. 2.8). There is also functionality to export the data to Excel by pressing “Download excel file” button.
Aggregated info will be shown in the electricity balance. The description of which is provided in Chapter 3.
Figure 2.8 DAP Application View
For the WAP/MAP application, the capacities are viewed for every day of the week/month. Monitoring of data
by the SO is performed based on expert assessment due to impossibility of automated determination based on
the following criteria:
For monthly planning:
Incorrect monthly volume;
Incorrect minimum and maximum load;
Big difference between daily volumes;
Big difference by weeks.
For weekly planning:
Incorrect weekly volume;
Incorrect minimum and maximum load;
big difference between daily volumes.
For daily planning:
Difference between volumes of planned and previous days;
Difference between volumes of planned and nearest previous same type of days (e.g. working
day, Saturday, Sunday);
Difference between volumes for the day of day ahead and month ahead planning.
When pressing the “Monitoring” button on the MAP applications list, a new page is opened. First, the total planned volumes for the month and for the same month of the last year are presented and the growth is calculated (Fig. 2.9). All these are included on the database of the GCAP software, where there is already data for the previous year. Fast changing processes in the system do not require earlier data to be considered in the monitoring.

14
USAID | GOVERNING FOR GROWTH (G4G) IN GEORGIA PARALLEL MARKET SOFTWARE USER MANUAL
Figure 2.9 Comparison with the Same Month of the Previous Year
In the table below, the average, minimum and maximum capacities are presented for every hour. Below the table there is a graph representing the data in the table (Fig. 2.10).
Figure 2.10 Monthly Average, Minimum and Maximum Capacities
The next table and corresponding graph represent the growth of the daily amount of each day to the first day of the month (Fig. 2.11). It’s a method to show the differences by days on the graph. Any day could be chosen here, however, it’s more logical to put the first day.
Figure 2.11 Growth to the First Day of the Month
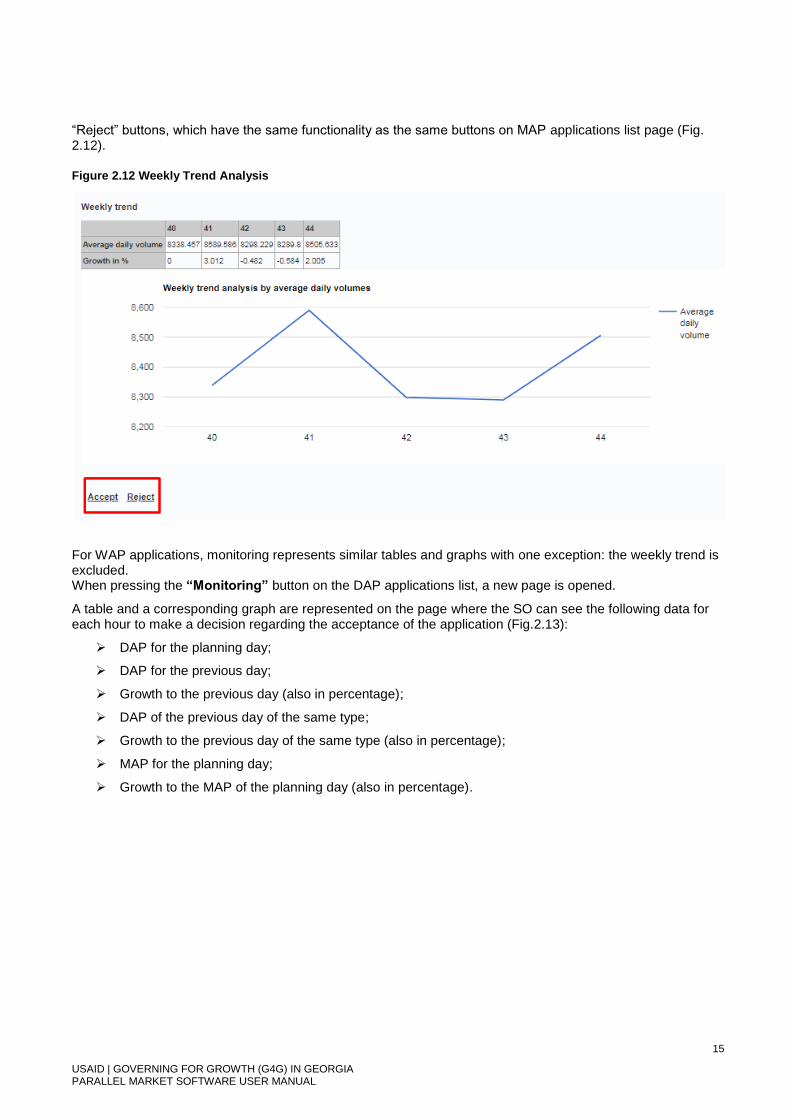
The next table and corresponding graph represent the weekly trend analysis. The growth to the average daily capacity of the first week of the month is calculated for each week. Below the table there are “Accept” and
15
USAID | GOVERNING FOR GROWTH (G4G) IN GEORGIA PARALLEL MARKET SOFTWARE USER MANUAL
“Reject” buttons, which have the same functionality as the same buttons on MAP applications list page (Fig. 2.12).
Figure 2.12 Weekly Trend Analysis
For WAP applications, monitoring represents similar tables and graphs with one exception: the weekly trend is excluded. When pressing the “Monitoring” button on the DAP applications list, a new page is opened.
A table and a corresponding graph are represented on the page where the SO can see the following data for each hour to make a decision regarding the acceptance of the application (Fig.2.13):
DAP for the planning day;
DAP for the previous day;
Growth to the previous day (also in percentage);
DAP of the previous day of the same type;
Growth to the previous day of the same type (also in percentage);
MAP for the planning day;
Growth to the MAP of the planning day (also in percentage).

16
USAID | GOVERNING FOR GROWTH (G4G) IN GEORGIA PARALLEL MARKET SOFTWARE USER MANUAL
Figure 2.13 DAP Monitoring
The SО monitors the application which can be formed for a day, week or month.
Both in the monitoring and in application list pages for DAP/WAP/MAP, there are “Accept” and “Reject” buttons. By clicking on the “Accept” button the SO confirms that the application can be represented in the initial planning balance in that way. As there are too many MPs, the system provides an additional option to mark several MPs, so that their applications are accepted by default, and the changes can be done only later while preparing the final balance (changes in balance are done by the SO and will be described in Module 3).
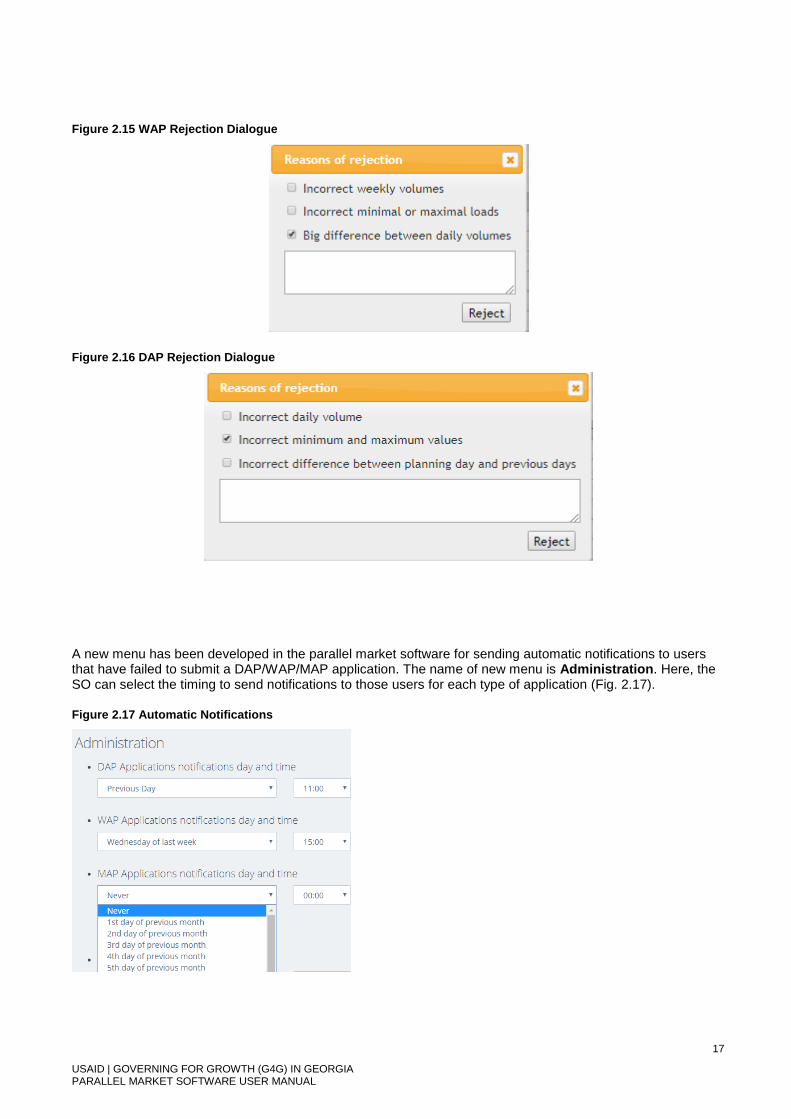
When rejecting the application, the software shows the screens (depending on the type of application) represented in Figure 2.14 – 2.16 where the SO can select any of provided comments and/or add his comment. After the application is rejected, a corresponding e-mail with a comment is sent automatically to the MP and the MP should change the application and re-submit it. One e-mail is sent per application.
Figure 2.14 MAP Rejection Dialogue
17
USAID | GOVERNING FOR GROWTH (G4G) IN GEORGIA PARALLEL MARKET SOFTWARE USER MANUAL
Figure 2.15 WAP Rejection Dialogue
Figure 2.16 DAP Rejection Dialogue
A new menu has been developed in the parallel market software for sending automatic notifications to users that have failed to submit a DAP/WAP/MAP application. The name of new menu is Administration. Here, the SO can select the timing to send notifications to those users for each type of application (Fig. 2.17).
Figure 2.17 Automatic Notifications
18
USAID | GOVERNING FOR GROWTH (G4G) IN GEORGIA PARALLEL MARKET SOFTWARE USER MANUAL
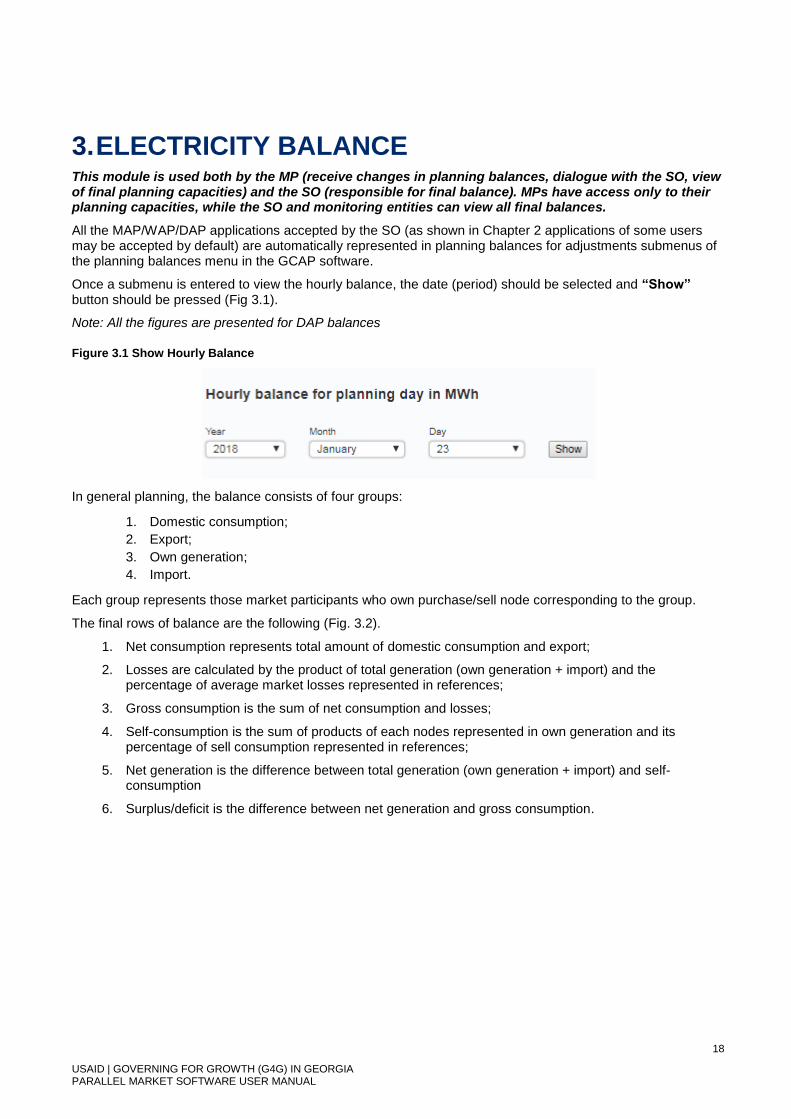
3. ELECTRICITY BALANCE This module is used both by the MP (receive changes in planning balances, dialogue with the SO, view of final planning capacities) and the SO (responsible for final balance). MPs have access only to their planning capacities, while the SO and monitoring entities can view all final balances.
All the MAP/WAP/DAP applications accepted by the SO (as shown in Chapter 2 applications of some users may be accepted by default) are automatically represented in planning balances for adjustments submenus of the planning balances menu in the GCAP software.
Once a submenu is entered to view the hourly balance, the date (period) should be selected and “Show” button should be pressed (Fig 3.1).
Note: All the figures are presented for DAP balances
Figure 3.1 Show Hourly Balance
In general planning, the balance consists of four groups:
1. Domestic consumption;
2. Export;
3. Own generation;
4. Import.
Each group represents those market participants who own purchase/sell node corresponding to the group.
The final rows of balance are the following (Fig. 3.2).
1. Net consumption represents total amount of domestic consumption and export;
2. Losses are calculated by the product of total generation (own generation + import) and the percentage of average market losses represented in references;
3. Gross consumption is the sum of net consumption and losses;
4. Self-consumption is the sum of products of each nodes represented in own generation and its percentage of sell consumption represented in references;
5. Net generation is the difference between total generation (own generation + import) and self-consumption
6. Surplus/deficit is the difference between net generation and gross consumption.

19
USAID | GOVERNING FOR GROWTH (G4G) IN GEORGIA PARALLEL MARKET SOFTWARE USER MANUAL
Figure 3.2 Total Rows in Balance
Surplus/deficit in the preliminary balance based on the MPs’ applications is practically unavoidable. In the planning balance, the SO can change capacities for any participant for any hour (automatically daily/weekly/monthly capacities will change) or daily/weekly/monthly capacities (hourly capacities will change proportionally). In case of making changes, the “Save” button should be pressed so the changes are saved (Fig. 3.3).
Figure 3.3 Save Balance
Import and export are represented in planning balance by countries:
1. Armenia;
2. Azerbaijan;
3. Russia;
4. Turkey.
The block of each country in both the export and import groups represents the participants who have nodes exporting to or importing from corresponding countries (Fig. 3.4 and Fig. 3.5).

20
USAID | GOVERNING FOR GROWTH (G4G) IN GEORGIA PARALLEL MARKET SOFTWARE USER MANUAL
Figure 3.4 Export Blocks
Figure 3.5 Import Blocks
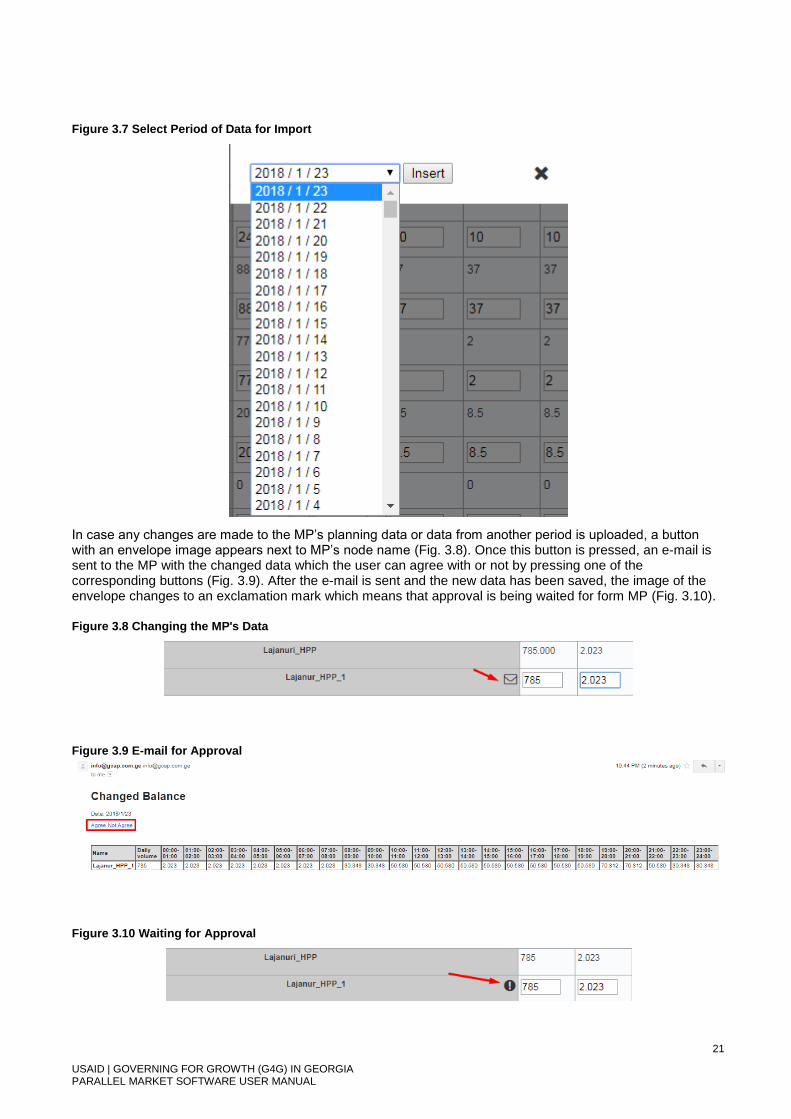
Balance also provides an option of importing planning data of different periods. This can be useful in case an MP has failed to submit a planning application and, e.g. the load shape of the previous planning period should be kept. In such a case, the most appropriate planning data of all previous ones is selected and only the total amount is changed. To do this, the SO has to click on the button that appears when bringing the cursor on the participant’s node with the image of a cloud with an arrow next to the participant’s name (Fig. 3.6). In the opened box, the planning data of the appropriate period should be selected (Fig. 3.7).
Figure 3.6 Import other Planning Data
21
USAID | GOVERNING FOR GROWTH (G4G) IN GEORGIA PARALLEL MARKET SOFTWARE USER MANUAL
Figure 3.7 Select Period of Data for Import
In case any changes are made to the MP’s planning data or data from another period is uploaded, a button with an envelope image appears next to MP’s node name (Fig. 3.8). Once this button is pressed, an e-mail is sent to the MP with the changed data which the user can agree with or not by pressing one of the corresponding buttons (Fig. 3.9). After the e-mail is sent and the new data has been saved, the image of the envelope changes to an exclamation mark which means that approval is being waited for form MP (Fig. 3.10).
Figure 3.8 Changing the MP's Data
Figure 3.9 E-mail for Approval
Figure 3.10 Waiting for Approval

22
USAID | GOVERNING FOR GROWTH (G4G) IN GEORGIA PARALLEL MARKET SOFTWARE USER MANUAL
The exclamation mark on its turn changes to tick or cross symbols depending on MP’s answer (Fig 3.11 and Fig. 3.12).
Figure 3.11 Approved Changes
Figure 3.12 Rejected Changes
Once balance is finalized, the “Make visible for MPs and send notifications” button should be pressed (Fig. 3.13). In this case, e-mails will be generated automatically and sent to all MPs with their confirmed load shapes.
Figure 3.13 Finalize Balance
The balance can be finalized even with the capacities not agreed with MPs because as already mentioned the final decision belongs to the SO.
All changes to the balance can also be done in Excel. This is useful for information sharing between the departments of the SO, who operates mostly by using MS Excel. To do this, the SO should first download the Excel file (Fig. 3.14), then make changes of capacities for the nodes (Fig 3.15), locally save it and choose and upload the changed balance in the same interface (Fig. 3.16). After this is done, the changes can be sent for approval.
Figure 3.14 Download MS Excel File

23
USAID | GOVERNING FOR GROWTH (G4G) IN GEORGIA PARALLEL MARKET SOFTWARE USER MANUAL
Figure 3.15 Changes in MS Excel File
Figure 3.16 Upload MS Excel File
The final MAP/WAP/DAP balances appear in the corresponding final balances submenu in the planning balances menu (Fig. 3.17).
Figure 3.17 Final Balances

24
USAID | GOVERNING FOR GROWTH (G4G) IN GEORGIA PARALLEL MARKET SOFTWARE USER MANUAL
Parallel market software will operate based on the final balances, where the view of the balances will be represented by participants without showing the parent company and the nodes of the participant as was it is done in the simulation software (Fig. 3.18).
Figure 3.18 Balance in Parallel Market Software
25
USAID | GOVERNING FOR GROWTH (G4G) IN GEORGIA PARALLEL MARKET SOFTWARE USER MANUAL
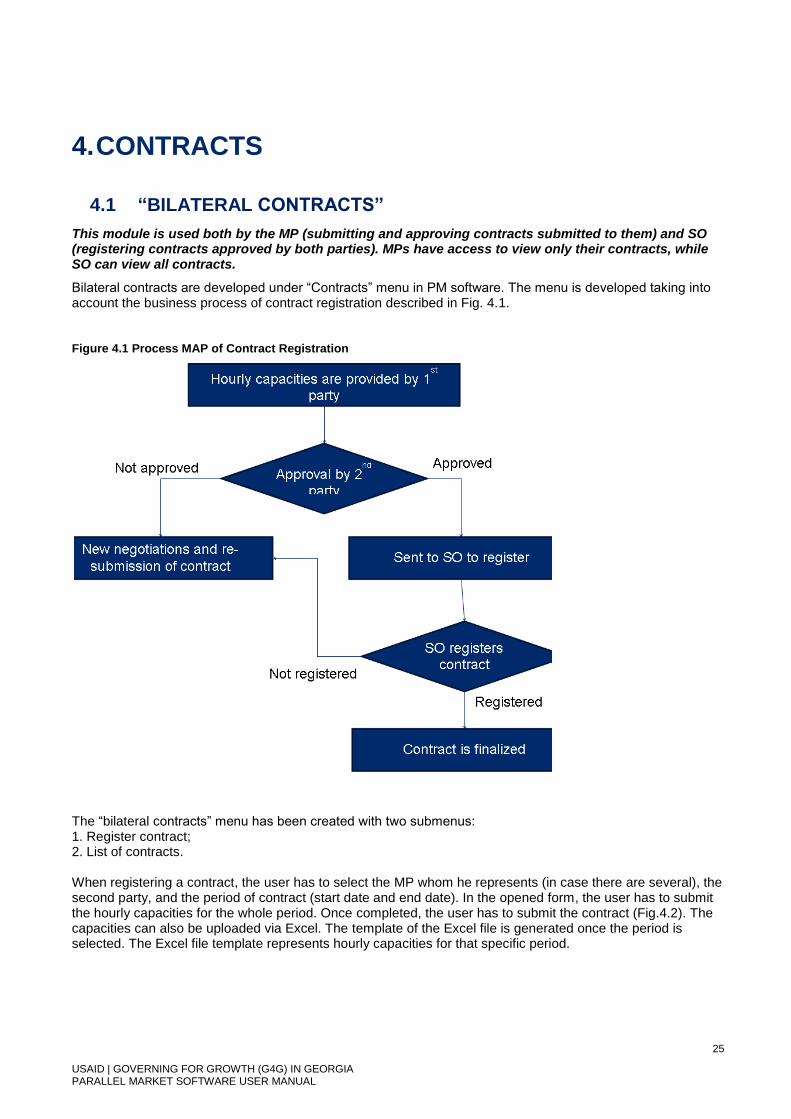
4. CONTRACTS
4.1 “BILATERAL CONTRACTS”
This module is used both by the MP (submitting and approving contracts submitted to them) and SO (registering contracts approved by both parties). MPs have access to view only their contracts, while SO can view all contracts.
Bilateral contracts are developed under “Contracts” menu in PM software. The menu is developed taking into account the business process of contract registration described in Fig. 4.1.
Figure 4.1 Process MAP of Contract Registration
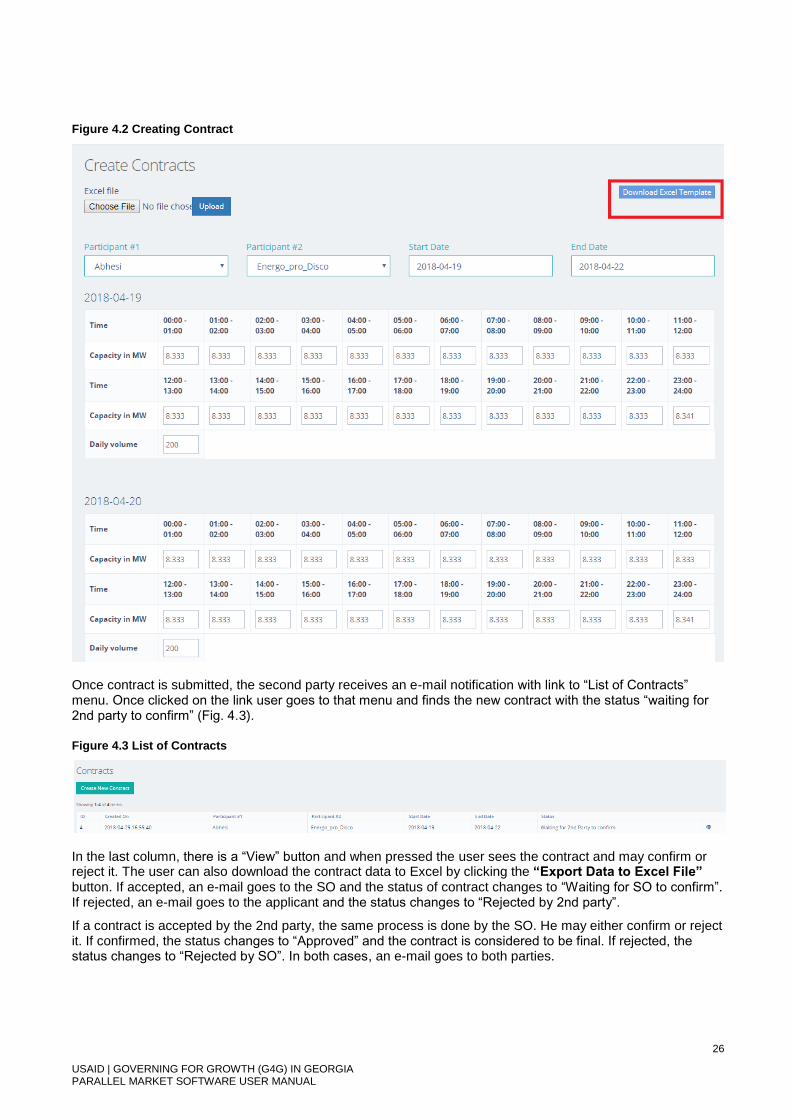
The “bilateral contracts” menu has been created with two submenus: 1. Register contract; 2. List of contracts. When registering a contract, the user has to select the MP whom he represents (in case there are several), the second party, and the period of contract (start date and end date). In the opened form, the user has to submit the hourly capacities for the whole period. Once completed, the user has to submit the contract (Fig.4.2). The capacities can also be uploaded via Excel. The template of the Excel file is generated once the period is selected. The Excel file template represents hourly capacities for that specific period.
26
USAID | GOVERNING FOR GROWTH (G4G) IN GEORGIA PARALLEL MARKET SOFTWARE USER MANUAL
Figure 4.2 Creating Contract
Once contract is submitted, the second party receives an e-mail notification with link to “List of Contracts” menu. Once clicked on the link user goes to that menu and finds the new contract with the status “waiting for 2nd party to confirm” (Fig. 4.3).
Figure 4.3 List of Contracts
In the last column, there is a “View” button and when pressed the user sees the contract and may confirm or reject it. The user can also download the contract data to Excel by clicking the “Export Data to Excel File” button. If accepted, an e-mail goes to the SO and the status of contract changes to “Waiting for SO to confirm”. If rejected, an e-mail goes to the applicant and the status changes to “Rejected by 2nd party”.
If a contract is accepted by the 2nd party, the same process is done by the SO. He may either confirm or reject it. If confirmed, the status changes to “Approved” and the contract is considered to be final. If rejected, the status changes to “Rejected by SO”. In both cases, an e-mail goes to both parties.
27
USAID | GOVERNING FOR GROWTH (G4G) IN GEORGIA PARALLEL MARKET SOFTWARE USER MANUAL
4.2 “PARTIAL POOL”
This module is accessible only for the SO. Calculations are made for each MP that participates in a trade and can be later viewed by that MP in the Analytics module.
The partial pool (PP) menu is available only for the SO (may be changed to the MO if the decision is made) and consists of the following submenus:
Generation Structure;
Generation Prices;
Generation Shares
Coefficients of Priorities;
Partial Pool calculation.
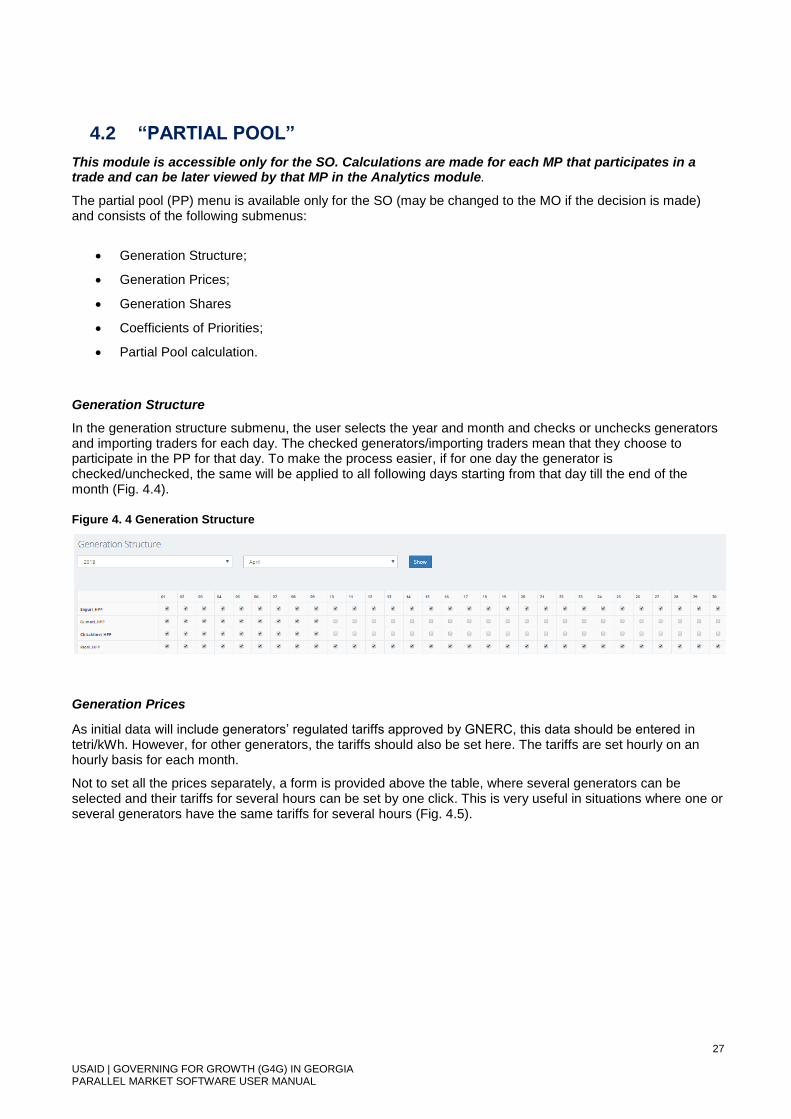
Generation Structure
In the generation structure submenu, the user selects the year and month and checks or unchecks generators and importing traders for each day. The checked generators/importing traders mean that they choose to participate in the PP for that day. To make the process easier, if for one day the generator is checked/unchecked, the same will be applied to all following days starting from that day till the end of the month (Fig. 4.4).
Figure 4. 4 Generation Structure
Generation Prices
As initial data will include generators’ regulated tariffs approved by GNERC, this data should be entered in tetri/kWh. However, for other generators, the tariffs should also be set here. The tariffs are set hourly on an hourly basis for each month.
Not to set all the prices separately, a form is provided above the table, where several generators can be selected and their tariffs for several hours can be set by one click. This is very useful in situations where one or several generators have the same tariffs for several hours (Fig. 4.5).

28
USAID | GOVERNING FOR GROWTH (G4G) IN GEORGIA PARALLEL MARKET SOFTWARE USER MANUAL
Figure 4.5 Generation Prices
Generation Shares
All domestic consumers and selected generators participate in the calculations of PP.
On this step, for each generator, an hourly share of its generation should be input for which that generator will participate in the PP. The share should be in the range from 0 to 1. Here again, a form is provided above the table where several generators can be selected and their shares for several hours can be set by one click (Fig. 4.6).
Figure 4.6 Generation Shares
Coefficients of Priorities
A coefficient of priority should be input here for each off-taker for allocation of each generation (Fig. 4.7).

29
USAID | GOVERNING FOR GROWTH (G4G) IN GEORGIA PARALLEL MARKET SOFTWARE USER MANUAL
Figure 4.7 Coefficients of Priorities
Partial Pool Calculations
In PP calculation, the user can select based on which data the calculations are made and the appropriate period should be selected. Once selected, the “Calculate” button should be pressed (Fig. 4.8).
Figure 4.8 Selecting the Type and Period of PP Calculations
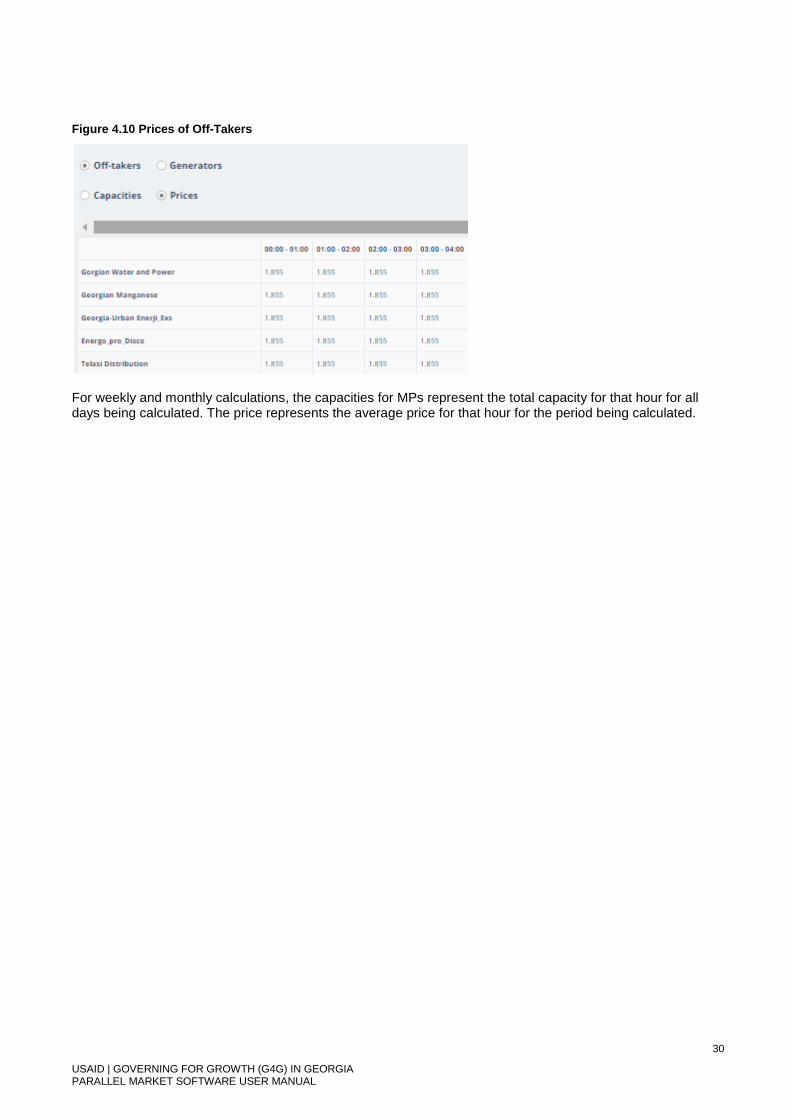
Once calculation are done the capacities and prices for off-takers and the capacities for generators can be observed (Fig.4.9-4.10).
Figure 4.9 Capacities of Off-Takers
30
USAID | GOVERNING FOR GROWTH (G4G) IN GEORGIA PARALLEL MARKET SOFTWARE USER MANUAL
Figure 4.10 Prices of Off-Takers
For weekly and monthly calculations, the capacities for MPs represent the total capacity for that hour for all days being calculated. The price represents the average price for that hour for the period being calculated.
31
USAID | GOVERNING FOR GROWTH (G4G) IN GEORGIA PARALLEL MARKET SOFTWARE USER MANUAL
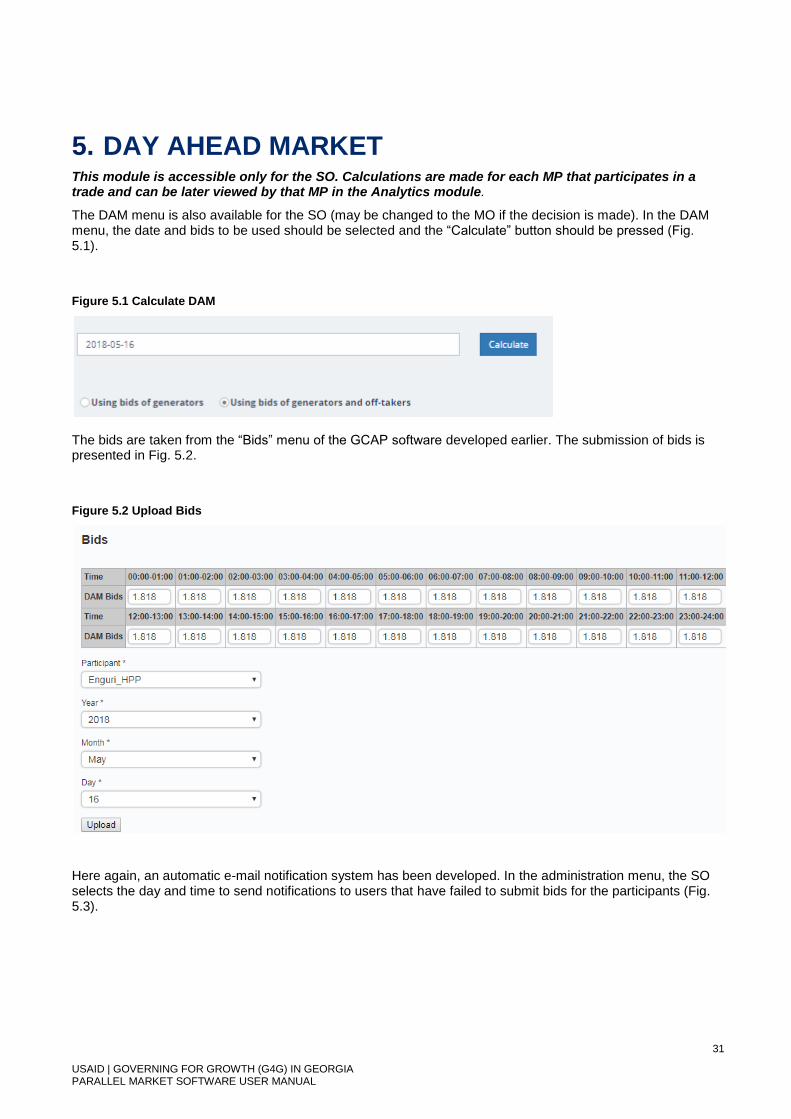
5. DAY AHEAD MARKET This module is accessible only for the SO. Calculations are made for each MP that participates in a trade and can be later viewed by that MP in the Analytics module.
The DAM menu is also available for the SO (may be changed to the MO if the decision is made). In the DAM menu, the date and bids to be used should be selected and the “Calculate” button should be pressed (Fig. 5.1).
Figure 5.1 Calculate DAM
The bids are taken from the “Bids” menu of the GCAP software developed earlier. The submission of bids is presented in Fig. 5.2.
Figure 5.2 Upload Bids
Here again, an automatic e-mail notification system has been developed. In the administration menu, the SO selects the day and time to send notifications to users that have failed to submit bids for the participants (Fig. 5.3).

32
USAID | GOVERNING FOR GROWTH (G4G) IN GEORGIA PARALLEL MARKET SOFTWARE USER MANUAL
Figure 5.3 Notifications for DAM Bids
Once the button is pressed, the DAM is calculated based on the algorithms described in the Methodology for
Parallel Market Software.
The SO can both view the marginal price on the DAM or the weighted-average one (Fig. 5.4 and 5.5). Users
will have access to the capacities and prices in the analytics menu described later in this manual.
Figure 5.4 DAM by Market Clearing Price
Figure 5.5 Pay as Bid Price
33
USAID | GOVERNING FOR GROWTH (G4G) IN GEORGIA PARALLEL MARKET SOFTWARE USER MANUAL
6. BALANCING (DEVIATION) MARKET
6.1 METERING AND ACTUAL BALANCE
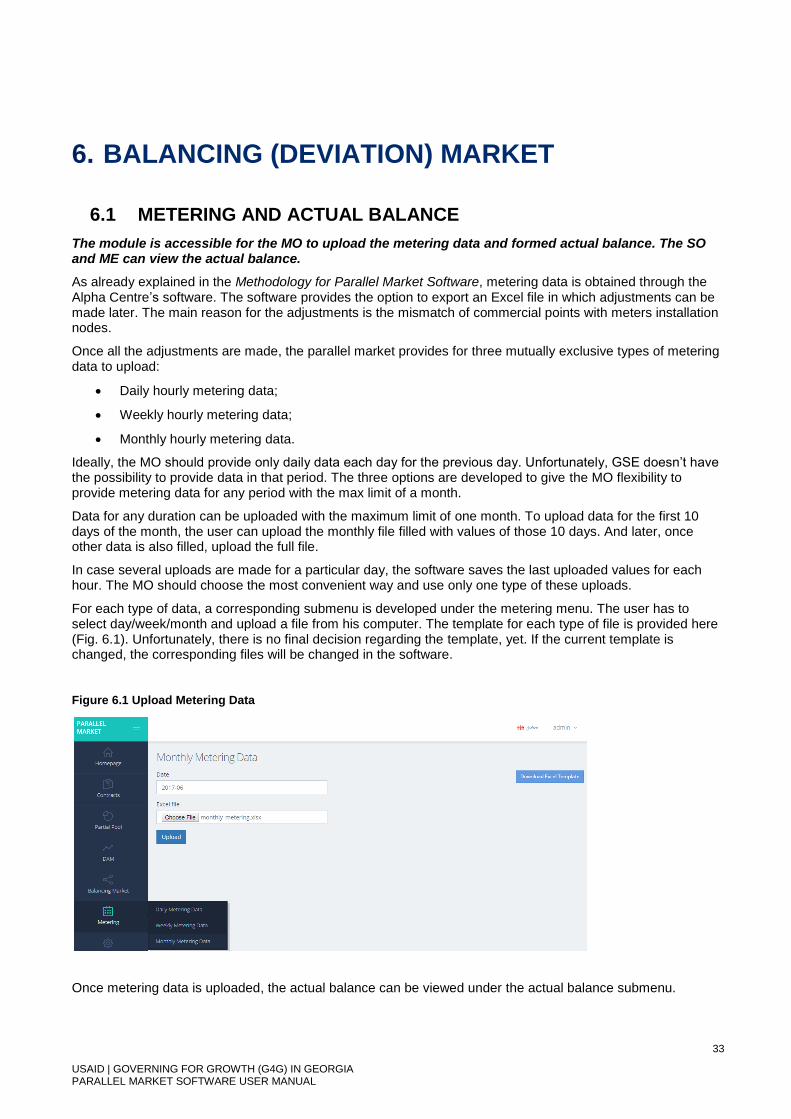
The module is accessible for the MO to upload the metering data and formed actual balance. The SO and ME can view the actual balance.
As already explained in the Methodology for Parallel Market Software, metering data is obtained through the Alpha Centre’s software. The software provides the option to export an Excel file in which adjustments can be made later. The main reason for the adjustments is the mismatch of commercial points with meters installation nodes.
Once all the adjustments are made, the parallel market provides for three mutually exclusive types of metering data to upload:
Daily hourly metering data;
Weekly hourly metering data;
Monthly hourly metering data.
Ideally, the MO should provide only daily data each day for the previous day. Unfortunately, GSE doesn’t have the possibility to provide data in that period. The three options are developed to give the MO flexibility to provide metering data for any period with the max limit of a month.
Data for any duration can be uploaded with the maximum limit of one month. To upload data for the first 10 days of the month, the user can upload the monthly file filled with values of those 10 days. And later, once other data is also filled, upload the full file.
In case several uploads are made for a particular day, the software saves the last uploaded values for each hour. The MO should choose the most convenient way and use only one type of these uploads.
For each type of data, a corresponding submenu is developed under the metering menu. The user has to select day/week/month and upload a file from his computer. The template for each type of file is provided here (Fig. 6.1). Unfortunately, there is no final decision regarding the template, yet. If the current template is changed, the corresponding files will be changed in the software.
Figure 6.1 Upload Metering Data
Once metering data is uploaded, the actual balance can be viewed under the actual balance submenu.
34
USAID | GOVERNING FOR GROWTH (G4G) IN GEORGIA PARALLEL MARKET SOFTWARE USER MANUAL
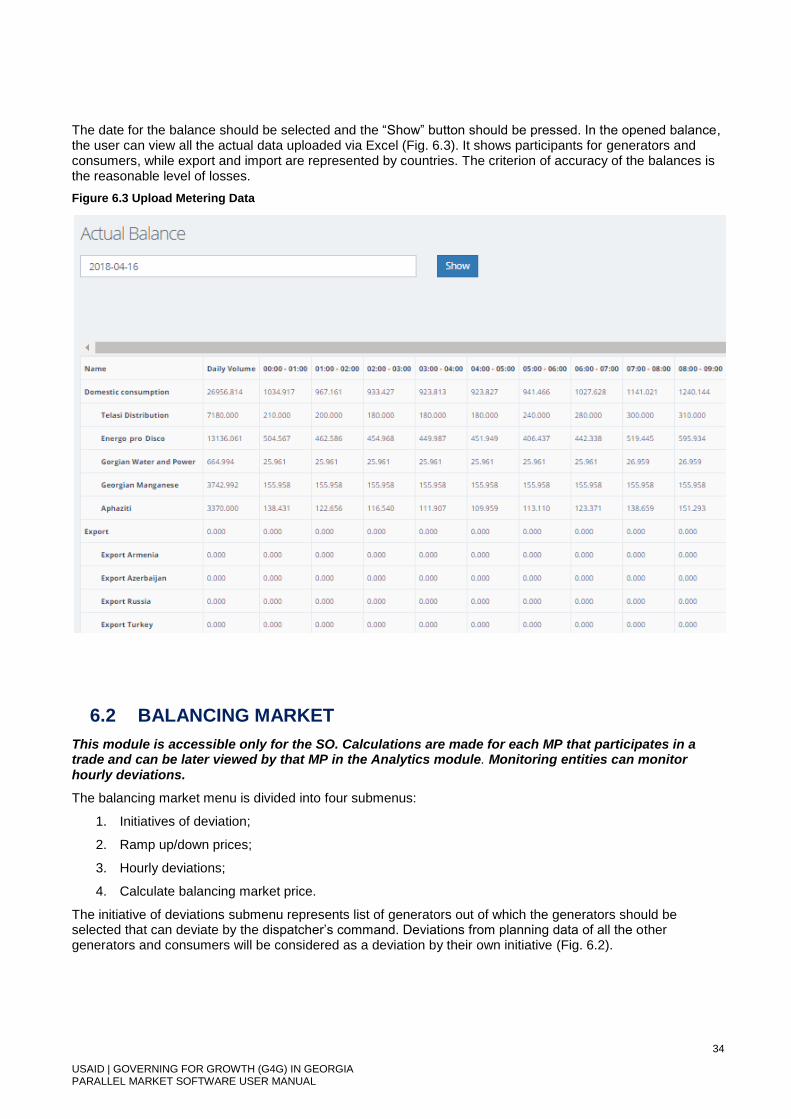
The date for the balance should be selected and the “Show” button should be pressed. In the opened balance, the user can view all the actual data uploaded via Excel (Fig. 6.3). It shows participants for generators and consumers, while export and import are represented by countries. The criterion of accuracy of the balances is the reasonable level of losses.
Figure 6.3 Upload Metering Data
6.2 BALANCING MARKET
This module is accessible only for the SO. Calculations are made for each MP that participates in a trade and can be later viewed by that MP in the Analytics module. Monitoring entities can monitor hourly deviations.
The balancing market menu is divided into four submenus:
1. Initiatives of deviation;
2. Ramp up/down prices;
3. Hourly deviations;
4. Calculate balancing market price.
The initiative of deviations submenu represents list of generators out of which the generators should be selected that can deviate by the dispatcher’s command. Deviations from planning data of all the other generators and consumers will be considered as a deviation by their own initiative (Fig. 6.2).

35
USAID | GOVERNING FOR GROWTH (G4G) IN GEORGIA PARALLEL MARKET SOFTWARE USER MANUAL
Figure 6.2 Initiatives of Deviation
The ramp up/down submenu represents list of all participants for which the percentages to their prices for DAM for ramp up and down should be set (the prices for DAM are increased by the corresponding percentages). These percentages are used to either award participants if they deviate by dispatcher’s command or to fine them in case of deviating by their own initiative (such mechanism has been discussed with stakeholders and is currently practicable). These percentages are set for each month, so the user has to select the month, set percentages and save the table (Fig. 6.3).
Figure 6.3 Ramp Up/Down % to Prices for DAM
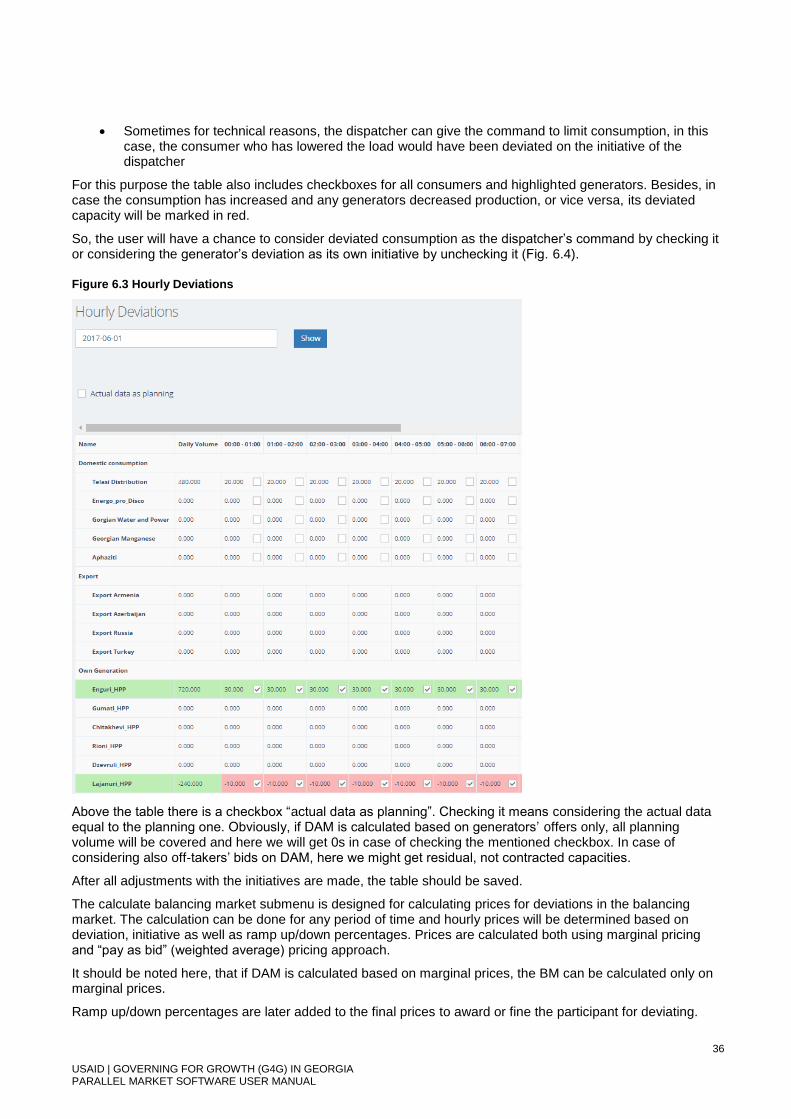
The hourly deviations table represents the difference between actual capacities generated/consumed and all contracted volumes based on planning data. If DAM is calculated based on generators’ offers only, the deviation will represent the difference between actual volume and planning volume. In case the DAM is calculated based on generators offers’ and off-takers’ bids, the difference will also include uncovered volumes on the DAM (they may occur because of demand/supply differences in bids/offers on DAM).
The table represents hourly deviations for the selected day. The generators that are checked in “Initiative of deviations” table are highlighted.
There can be cases when the initial set initiative may be later changed. This can happen in the following cases:
Consumption volume has increased, and some generator of checked ones has reduced generation (different directions), in this case it,s rejection will no longer be initiated by the dispatcher;
36
USAID | GOVERNING FOR GROWTH (G4G) IN GEORGIA PARALLEL MARKET SOFTWARE USER MANUAL
Sometimes for technical reasons, the dispatcher can give the command to limit consumption, in this case, the consumer who has lowered the load would have been deviated on the initiative of the dispatcher
For this purpose the table also includes checkboxes for all consumers and highlighted generators. Besides, in case the consumption has increased and any generators decreased production, or vice versa, its deviated capacity will be marked in red.
So, the user will have a chance to consider deviated consumption as the dispatcher’s command by checking it or considering the generator’s deviation as its own initiative by unchecking it (Fig. 6.4).
Figure 6.3 Hourly Deviations
Above the table there is a checkbox “actual data as planning”. Checking it means considering the actual data equal to the planning one. Obviously, if DAM is calculated based on generators’ offers only, all planning volume will be covered and here we will get 0s in case of checking the mentioned checkbox. In case of considering also off-takers’ bids on DAM, here we might get residual, not contracted capacities.
After all adjustments with the initiatives are made, the table should be saved.
The calculate balancing market submenu is designed for calculating prices for deviations in the balancing market. The calculation can be done for any period of time and hourly prices will be determined based on deviation, initiative as well as ramp up/down percentages. Prices are calculated both using marginal pricing and “pay as bid” (weighted average) pricing approach.
It should be noted here, that if DAM is calculated based on marginal prices, the BM can be calculated only on marginal prices.
Ramp up/down percentages are later added to the final prices to award or fine the participant for deviating.

37
USAID | GOVERNING FOR GROWTH (G4G) IN GEORGIA PARALLEL MARKET SOFTWARE USER MANUAL
Once the period is selected by selecting start and end dates, the “Show” button should be pressed and the prices for all participants are shown (for ones that has no deviation, the price is 0). The user can see prices by using both marginal and weighted-average pricing approach (Fig. 6.5).
Figure 6.4 Calculate Balancing Market Prices

38
USAID | GOVERNING FOR GROWTH (G4G) IN GEORGIA PARALLEL MARKET SOFTWARE USER MANUAL
7. SETTLEMENT This module is accessible only for the SO (MO in future). Calculations are made for each MP that
participates in a trade and can be later viewed by that MP in the Analytics module.
Calculation of the generation price (done by calculating PP, DAM and BM) is not enough, because there are
other payments on the market, for which the input of the relevant data is also provided
Settlement menu consists of six submenus:
Guaranteed capacities;
Consumer fees;
Consumer tariffs;
Generators with PPAs;
Maximum price for consumers;
Settlement.
Additional required data input and saved in the first five submenus is used when conducting settlement.
Guaranteed Capacities
This submenu represents a table for generators where the daily fee for guaranteed capacities and N of days
used should be inputfor each month per generator (Fig. 7.1).
Figure 7.1 Guaranteed Capacities
The daily fee should be input in GEL.
Under the table there is a “Save” button which should be pressed in order to save input values.
Consumer Fees
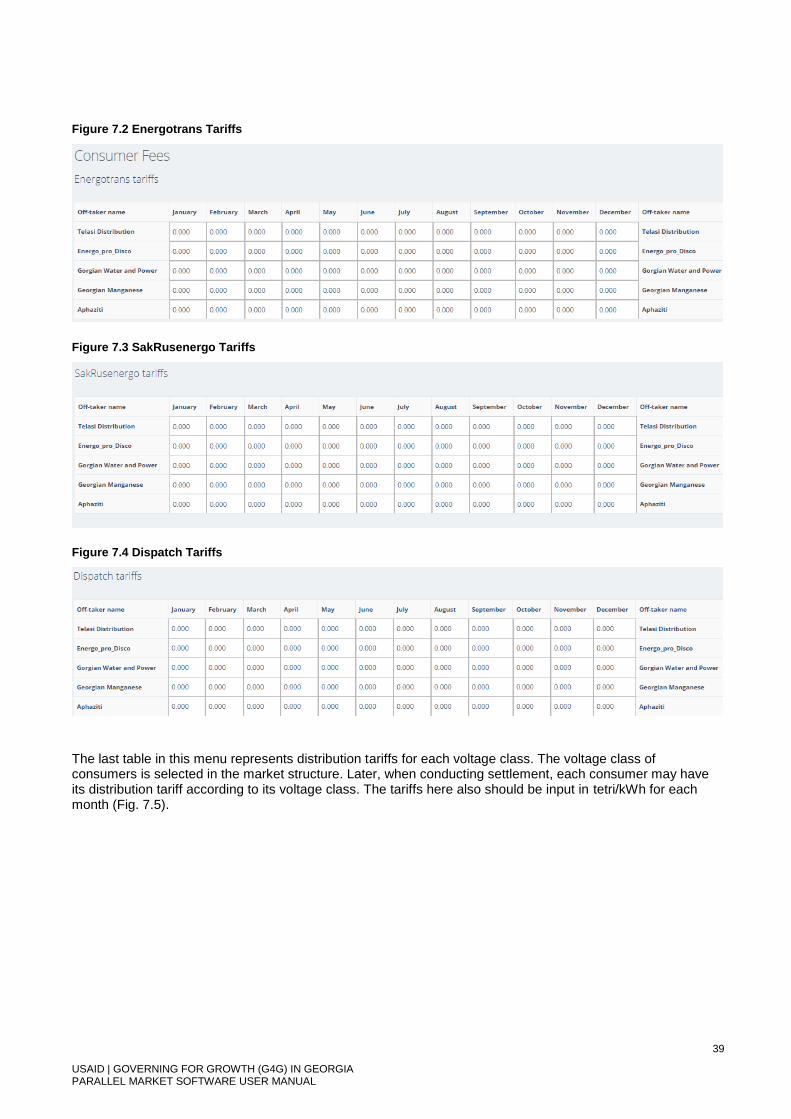
The consumer fee menu represents all the fees the consumer has to pay above the calculated price for electricity.vHere there are four tables. The first three of them represent Energotrans, SakRusenergo and Dispatch tariffs. The data should be input for each consumer monthly (Fig. 7.2-7.4). All tariffs should be input in tetri/kWh.
39
USAID | GOVERNING FOR GROWTH (G4G) IN GEORGIA PARALLEL MARKET SOFTWARE USER MANUAL
Figure 7.2 Energotrans Tariffs
Figure 7.3 SakRusenergo Tariffs
Figure 7.4 Dispatch Tariffs
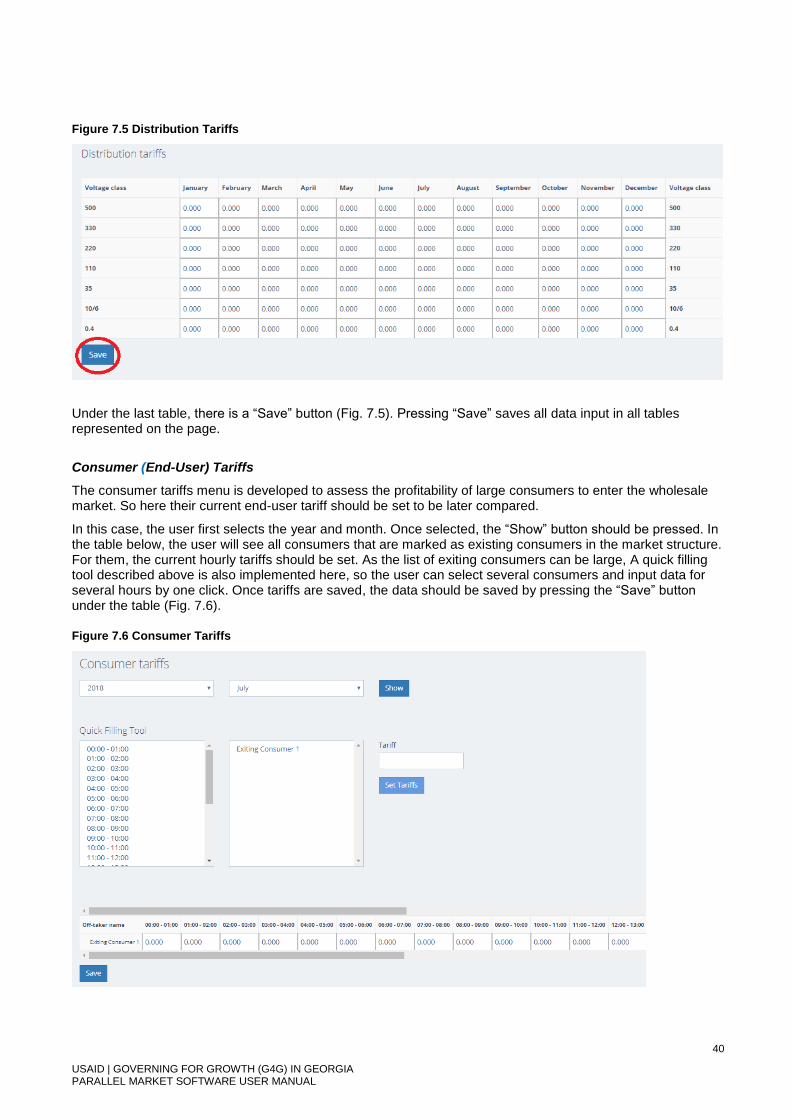
The last table in this menu represents distribution tariffs for each voltage class. The voltage class of consumers is selected in the market structure. Later, when conducting settlement, each consumer may have its distribution tariff according to its voltage class. The tariffs here also should be input in tetri/kWh for each month (Fig. 7.5).
40
USAID | GOVERNING FOR GROWTH (G4G) IN GEORGIA PARALLEL MARKET SOFTWARE USER MANUAL
Figure 7.5 Distribution Tariffs
Under the last table, there is a “Save” button (Fig. 7.5). Pressing “Save” saves all data input in all tables represented on the page.
Consumer (End-User) Tariffs
The consumer tariffs menu is developed to assess the profitability of large consumers to enter the wholesale market. So here their current end-user tariff should be set to be later compared.
In this case, the user first selects the year and month. Once selected, the “Show” button should be pressed. In the table below, the user will see all consumers that are marked as existing consumers in the market structure. For them, the current hourly tariffs should be set. As the list of exiting consumers can be large, A quick filling tool described above is also implemented here, so the user can select several consumers and input data for several hours by one click. Once tariffs are saved, the data should be saved by pressing the “Save” button under the table (Fig. 7.6).
Figure 7.6 Consumer Tariffs

41
USAID | GOVERNING FOR GROWTH (G4G) IN GEORGIA PARALLEL MARKET SOFTWARE USER MANUAL
Generators with PPAs
This menu represents the list of all generators from which the user has to select that have PPA agreements. In fact, those agreements can be for several months, so this menu also provides for checking the generators that have PPA agreements for every month. The logic behind this is that if a generator has a PPA agreement, it will get paid for its generation by the price fixed in that agreement. So the final amount to be paid for the generator will be its actual capacity multiplied by the fixed price.
In this menu checks should be set for those generators for the months written in that agreement (Fig. 7.7).
Figure 7.7 Generators with PPAs
The regulated prices of generators are fixed in the “Generation prices” submenu of the “Partial Pool” menu. So if in this menu any generator is checked for any month, the amount to be paid to such generator will be its price set in the “Generation prices” submenu of the “Partial Pool” menu times its actual generated capacity.
Once all checks are set, the “Save” button under the table should be pressed.
Maximum Price for Consumers
This menu aggregates two specifics of the Georgian Electricity Market:
Subsidy of Abkhazia flow;
Agreements with consumers (e.g. universal supplier).
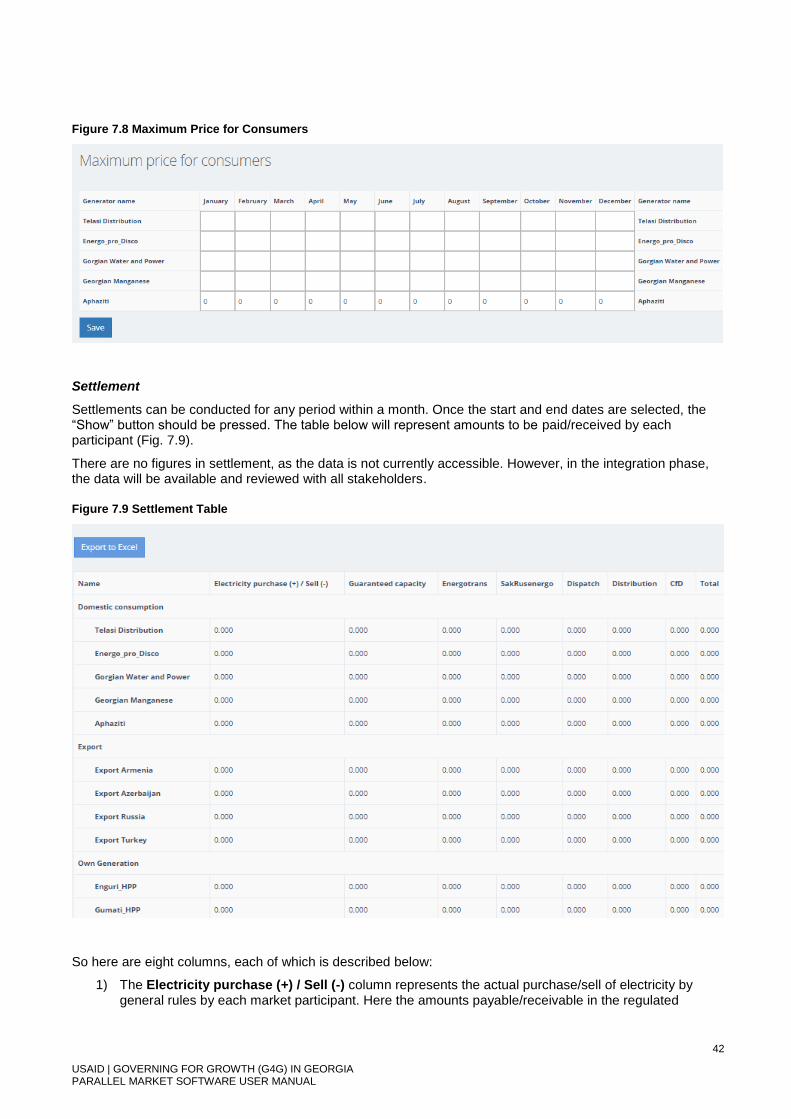
The menu represents a table where each consumer’s maximum monthly tariff can be set in tetri/kWh (Fig. 7.8). For Abkhazia it will be 0, while for other consumers it can be a number larger than 0. If such a tariff is set, the final price for settlement will not exceed the amount calculated by that tariff (it will be 0 for Abkhazia). The difference will be considered as contract for difference (CfD). If there is no need of such tariffs, the cell should be left blank. Once all tariffs are set, the “Save” button under the table should be pressed.
42
USAID | GOVERNING FOR GROWTH (G4G) IN GEORGIA PARALLEL MARKET SOFTWARE USER MANUAL
Figure 7.8 Maximum Price for Consumers
Settlement
Settlements can be conducted for any period within a month. Once the start and end dates are selected, the “Show” button should be pressed. The table below will represent amounts to be paid/received by each participant (Fig. 7.9).
There are no figures in settlement, as the data is not currently accessible. However, in the integration phase, the data will be available and reviewed with all stakeholders.
Figure 7.9 Settlement Table
So here are eight columns, each of which is described below:
1) The Electricity purchase (+) / Sell (-) column represents the actual purchase/sell of electricity by general rules by each market participant. Here the amounts payable/receivable in the regulated

43
USAID | GOVERNING FOR GROWTH (G4G) IN GEORGIA PARALLEL MARKET SOFTWARE USER MANUAL
contracting sector, DAM and BM are accumulated. As mentioned above, those numbers may differ for consumers regarding whether losses are allocated directly between them or not. To provide for this, above the table there is a checkbox “Losses bought by TSO” which is checked by default (Fig. 7.10). However in case of unchecking it, the losses will be allocated between consumers. In case the checkbox remains checked, the amount of bought losses are shown under the table.
Figure 7.110 Losses Bought by TSO
2) Guaranteed capacity represents the amount receivable for generators. The input for calculation of those amounts is taken from the submenu “Guaranteed capacities”. Daily fees are multiplied by the number of days and the proportion of it is taken for the corresponding period. The sum of these receivables for generators is allocated between all off-takers (the term is used for wholesale consumers) in proportion of their actual consumption.
3) The Energotrans column represents a fee for the consumer which is calculated by taking the tariff from the “Consumer Fee” submenu and multiplying it by the actual consumption of that consumer.
4) The SakRusenergo column represents a fee for the consumer which is calculated by taking the tariff from the “Consumer Fee” submenu and multiplying it by the actual consumption of that consumer.
5) The Dispatch column represent a fee for the consumer which is calculated by taking the tariff from the “Consumer Fee” submenu and multiplying it by the actual consumption of that consumer.
6) The Distribution column represents a fee for consumers with a particular voltage class which is calculated by taking the tariff from the “Consumer Fee” submenu of that voltage class and multiplying it by the actual consumption of that consumer.
7) The CfD column represents all the imbalances (contracts for difference) that may arise due to specifics in the Georgian Market.
PPA – As already mentioned, some generators have PPAs, so their selling (may be also buying on BM) price is fixed. For such generators, CfD will be the difference between the amount the generator should receive using the fixed price (fixed price multiplied by actual generation) and its actual receivable amount. On the other hand, the sum of those differences should somehow be allocated. As already mentioned, for PPAs there are three ways of allocation: (1) by wholesale buyers, (2) by guaranteed state trader (ESCO) or (3) PSO. The software provides for all three options and above the table there is a checkbox where the user can select which way PPAs should be considered (Fig. 7.11). If the first option is selected, then the electricity purchase price for off-takers will be changed. In case of selecting the second or third options, the amount that should be covered will be represented under the table either for the PSO or ESCO to cover.
Subsidy of Abkhazia – For Abkhazia, the maximum price in “Maximum price for off-takers” submenu should be set 0, which means that Abkhazia will not pay for its electricity flow. So CfD for Abkhazia would be the total amount it should pay in case of operating by general rules. The difference can be distributed between other off-takers or through other funds. Abkhazia, as well as other off-takers that would have CfD appear above the table can be checked to be subsidized through other off-takers (Fig. 7.12). If they are not checked, then the total amount appears at the bottom of the table representing the subsidy amount to be covered.

44
USAID | GOVERNING FOR GROWTH (G4G) IN GEORGIA PARALLEL MARKET SOFTWARE USER MANUAL
Special agreements with off-takers (consumers) – For all the other off-takers that have saved maximum price in the “Maximum price for off-takers” submenu, the final amount to be paid should not exceed the amount equal to saved max price times actual capacity bought. So CfD for those off-takers would be the difference between the latter amount and the sum of all amounts off-taker has to pay. As in the case of Abkhazia, the difference can be distributed between other off-takers or through other funds. The allocation process is the same as for Abkhazia
Figure 7.1111 Consider PPA
Figure 7.12 Off-Taker Subsidy Through other Off-Takers
8) The Total column represents the sum of all the other columns. As all specifics are already considered
in CfDs, the total amount will also provide the specifics.

45
USAID | GOVERNING FOR GROWTH (G4G) IN GEORGIA PARALLEL MARKET SOFTWARE USER MANUAL
8. ANALYTICS The analytics module is accessible for both the MP, ME and SO. The MP can view analyses of their own data, while the SO and ME can view analysis for each MP as well as for the market as a whole.
The analytics menu consist of five submenus:
1. Plan/Fact analysis;
2. Actual capacities by trade sectors;
3. Price for generators by trade sectors;
4. Purchase price for off-takers;
5. Market opening.
Plan/Fact Analysis
This submenu is aimed at improvement of planning accuracy for MPs. In this menu, the user should first select the period for which the data should be shown. To do this, the user selects the year/month and start and end dates within the selected month. After selecting, the “Show” button should be pressed (Fig. 8.1).
Figure 8.1 Plan/Fact Analysis: Select Date
Once selected, the user should click on the participant from the list provided on the left (any user sees the participants that he has permission to). The SO can also select total generation/consumption/imports/exports. After clicking, the following data appears for that period for each hour.
1) A table appears where the rows represent offers provided by the participant, the capacities in final balance, metering capacities and the differences between them (Fig. 8.2);
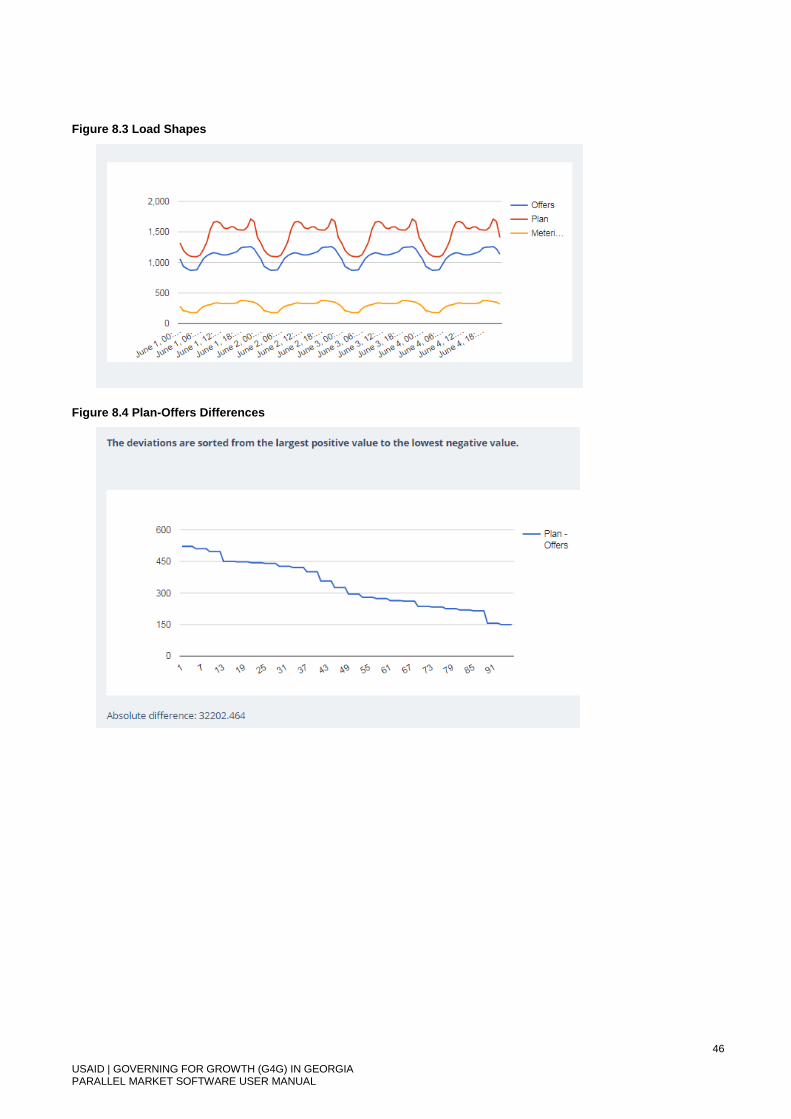
2) Under the table there are four graphs. The first of them represents hourly load shapes of offers, planned and actual (based on metering data and appropriate adjustments) balances. The next three graphs represent hourly absolute differences between them in descending order (Fig. 8.3-8.6).
Figure 8.2 Comparison Table
46
USAID | GOVERNING FOR GROWTH (G4G) IN GEORGIA PARALLEL MARKET SOFTWARE USER MANUAL
Figure 8.3 Load Shapes
Figure 8.4 Plan-Offers Differences
47
USAID | GOVERNING FOR GROWTH (G4G) IN GEORGIA PARALLEL MARKET SOFTWARE USER MANUAL
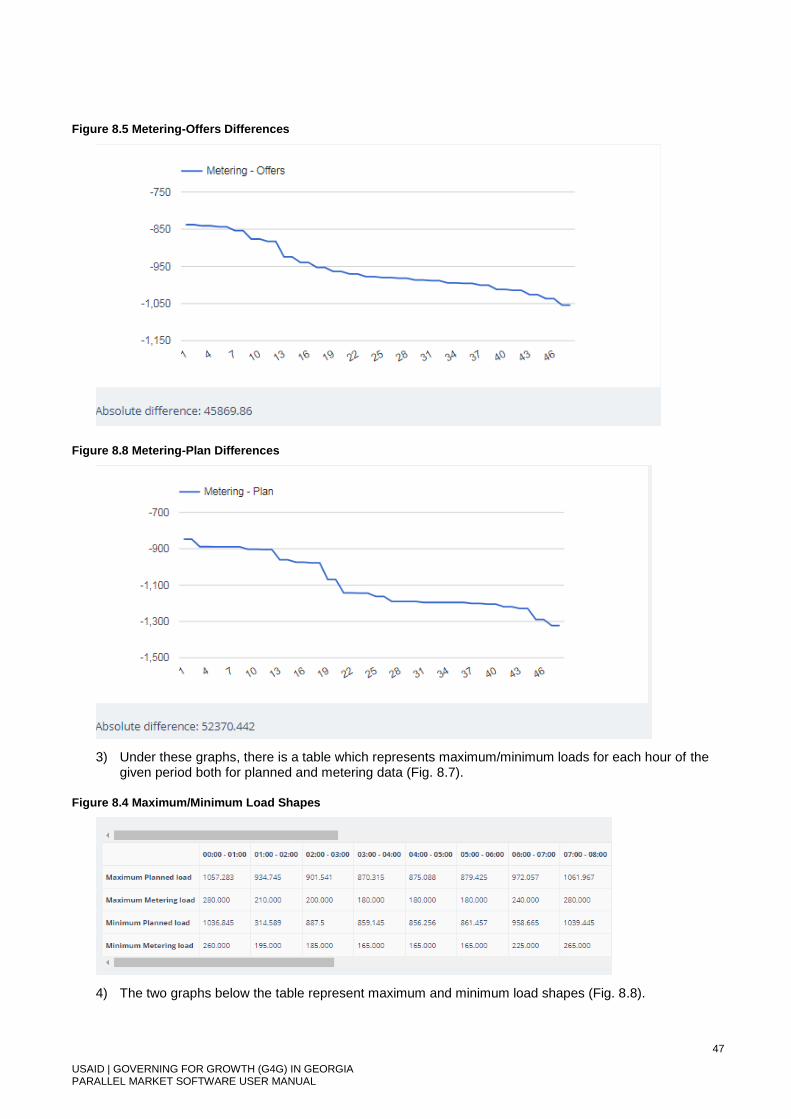
Figure 8.5 Metering-Offers Differences
Figure 8.8 Metering-Plan Differences
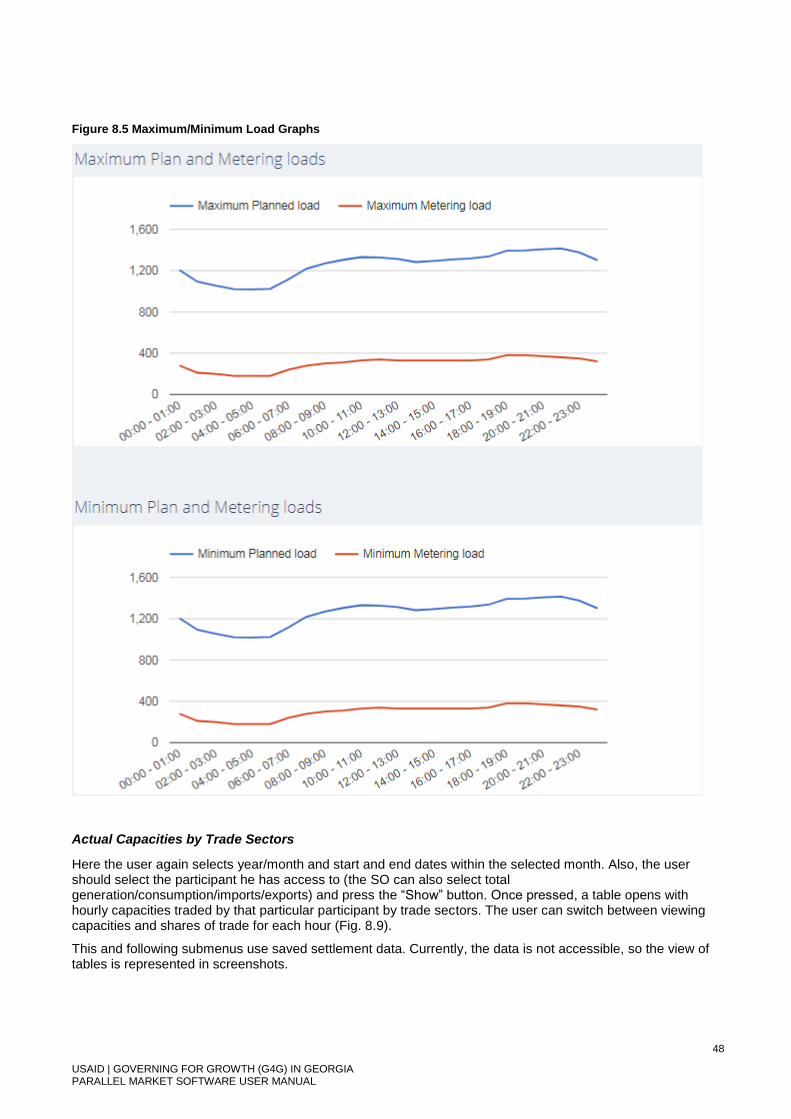
3) Under these graphs, there is a table which represents maximum/minimum loads for each hour of the given period both for planned and metering data (Fig. 8.7).
Figure 8.4 Maximum/Minimum Load Shapes
4) The two graphs below the table represent maximum and minimum load shapes (Fig. 8.8).
48
USAID | GOVERNING FOR GROWTH (G4G) IN GEORGIA PARALLEL MARKET SOFTWARE USER MANUAL
Figure 8.5 Maximum/Minimum Load Graphs
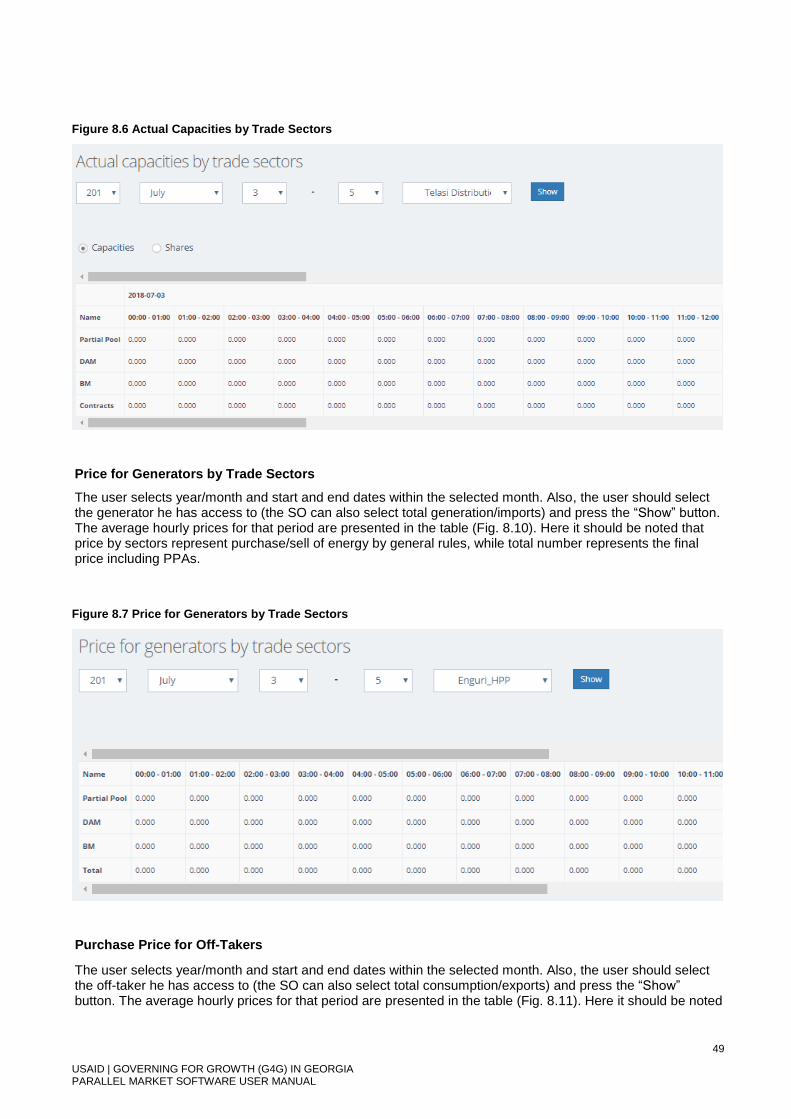
Actual Capacities by Trade Sectors
Here the user again selects year/month and start and end dates within the selected month. Also, the user should select the participant he has access to (the SO can also select total generation/consumption/imports/exports) and press the “Show” button. Once pressed, a table opens with hourly capacities traded by that particular participant by trade sectors. The user can switch between viewing capacities and shares of trade for each hour (Fig. 8.9).
This and following submenus use saved settlement data. Currently, the data is not accessible, so the view of tables is represented in screenshots.
49
USAID | GOVERNING FOR GROWTH (G4G) IN GEORGIA PARALLEL MARKET SOFTWARE USER MANUAL
Figure 8.6 Actual Capacities by Trade Sectors
Price for Generators by Trade Sectors
The user selects year/month and start and end dates within the selected month. Also, the user should select the generator he has access to (the SO can also select total generation/imports) and press the “Show” button. The average hourly prices for that period are presented in the table (Fig. 8.10). Here it should be noted that price by sectors represent purchase/sell of energy by general rules, while total number represents the final price including PPAs.
Figure 8.7 Price for Generators by Trade Sectors
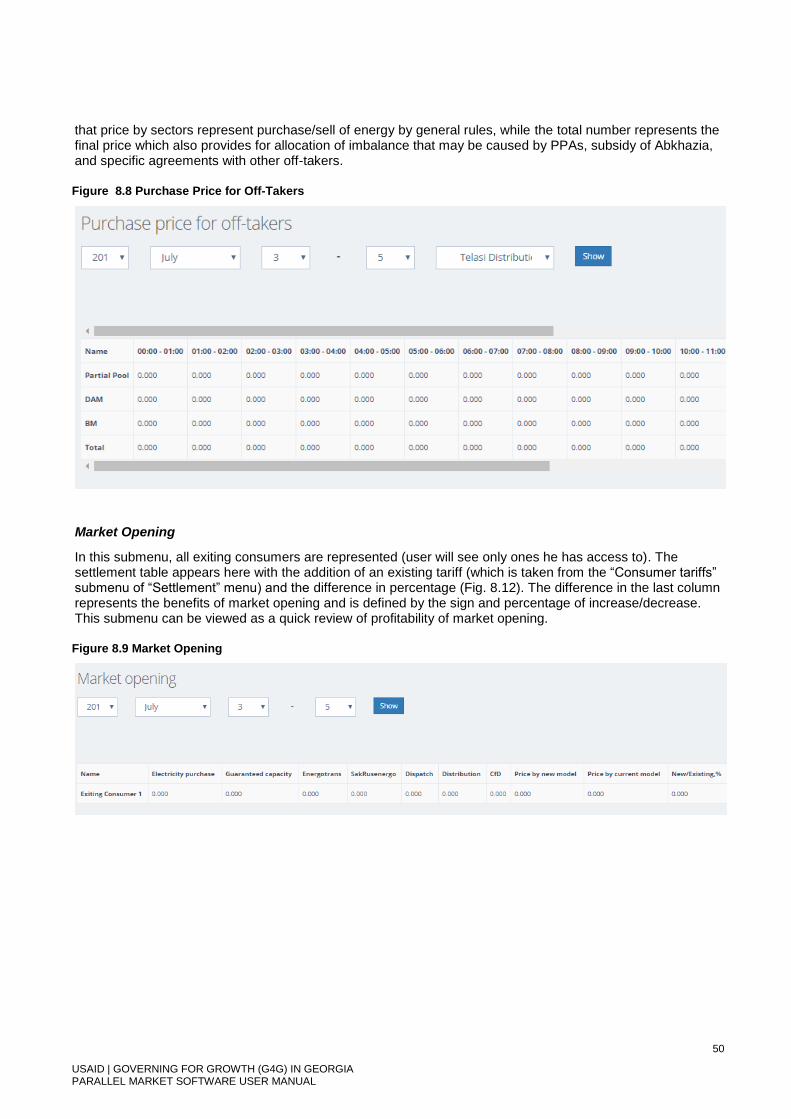
Purchase Price for Off-Takers
The user selects year/month and start and end dates within the selected month. Also, the user should select the off-taker he has access to (the SO can also select total consumption/exports) and press the “Show” button. The average hourly prices for that period are presented in the table (Fig. 8.11). Here it should be noted
50
USAID | GOVERNING FOR GROWTH (G4G) IN GEORGIA PARALLEL MARKET SOFTWARE USER MANUAL
that price by sectors represent purchase/sell of energy by general rules, while the total number represents the final price which also provides for allocation of imbalance that may be caused by PPAs, subsidy of Abkhazia, and specific agreements with other off-takers.
Figure 8.8 Purchase Price for Off-Takers
Market Opening
In this submenu, all exiting consumers are represented (user will see only ones he has access to). The settlement table appears here with the addition of an existing tariff (which is taken from the “Consumer tariffs” submenu of “Settlement” menu) and the difference in percentage (Fig. 8.12). The difference in the last column represents the benefits of market opening and is defined by the sign and percentage of increase/decrease. This submenu can be viewed as a quick review of profitability of market opening.
Figure 8.9 Market Opening

51
USAID | GOVERNING FOR GROWTH (G4G) IN GEORGIA PARALLEL MARKET SOFTWARE USER MANUAL
USAID Governing for Growth (G4G) in Georgia
Deloitte Consulting Overseas Projects LLP
Address: 5 L. Mikeladze st., 0162, Tbilisi
Phone: +995 322 240115 / 16
E-mail: [email protected]