parameter estimation in multiple contact co2 miscibility simulation with uncertain experimental core...
TRANSCRIPT
750
†To whom correspondence should be addressed.
E-mail: [email protected]
Korean J. Chem. Eng., 29(6), 750-755 (2012)DOI: 10.1007/s11814-011-0264-5
INVITED REVIEW PAPER
Parameter estimation in multiple contact CO2 miscibility simulationwith uncertain experimental core flooding data
Sunil Kwon* and Wonsuk Lee**,†
*Department of Natural Resources and Environmental Eng., Dong-A University, Busan 133-791, Korea**Korea Institute of Geoscience and Mineral Resources, Daejeon 305-350, Korea
(Received 28 July 2011 • accepted 11 October 2011)
Abstract−CO2 flooding, which is an efficient method of enhanced oil recovery, is a very complicated process involving
phase behavior. To understand the performance of CO2 flooding and provide accurate data for designing reservoir de-
velopment, a comprehensive investigation of the phase behavior of CO2 miscible flooding and an accurate composi-
tional reservoir simulation needs to be conducted. In PVT modeling, an effective and more physically reasonable equa-
tion of state model was achieved and the feasibility of CO2 miscible flooding was determined by multiple contact min-
imum miscibility pressure (MCMMP) calculation. Furthermore, compositional reservoir simulation studies for predict-
ing CO2 miscible performance were designed and constructed with core flooding data. By matching with laboratory
core flooding data, we can estimate parameters with uncertainty. The objective of this study was to find a work flow for
parameter estimation in CO2 miscible flooding process that can be used to design and optimize field CO2 miscible floods.
Key words: CO2 Injection, Miscible Flooding, Simulation, History Mmatching
INTRODUCTION
Enhanced oil recovery is a term applied to methods used for re-
covering oil from a petroleum reservoir beyond that recoverable by
primary and secondary methods. The main objective of all meth-
ods of EOR is to increase the volumetric sweep efficiency and to
enhance the displacement efficiency as compared to an ordinary
water flooding. CO2 miscible flooding as a tertiary recovery process
is a mechanism with which to recover more oil, extend the field
life and increase the profitability of the fields.
CO2 injection is receiving increasing consideration for applica-
tion to enhanced oil recovery (EOR) in both new reservoirs, and
reservoirs that have been previously depleted and/or water flooded
[1]. There is great potential for CO2 injection for improved oil re-
covery; additionally, there is environmental and economic interest
from a number of industrial sources in using CO2 injection in de-
pleted reservoirs to store CO2 in order to alleviate the effects of CO2
on global warming caused by CO2 emissions. In over 30 years’ pro-
duction practice, CO2 flooding has become the leading enhanced
oil recovery technique for light and medium oils [2,3].
Depending on the properties of the reservoir fluids at reservoir
conditions, the displacement of oil by CO2 gas injection can be clas-
sified as both a miscible and immiscible process. A miscible or multi-
ple contact miscible process occurs at pressures above the mini-
mum miscibility pressure (MMP), in which there is more interchange
of components. Immiscible displacement occurs at pressures below
the MMP, in which there is less interchange of components or mixing
zones between the injected gas and the reservoir fluid. CO2 misci-
ble flooding improves oil recovery through gas drive, swelling of
the oil, and decreasing its viscosity [4]. Miscible injection is a proven,
economically viable process that significantly increases oil recov-
ery from many different types of reservoirs [5]. Theoretically, under
CO2 miscible flooding, CO2 becomes completely miscible with the
resident oil reducing the interfacial tension between them to zero,
eliminating the capillary pressure and resulting in 0% residual oil
saturation. Many of the current CO2 EOR floods operate near the
miscibility conditions to mobilize the maximum amount of incre-
mental oil. In spite of all the advantages of the CO2 process, how-
ever, it has the disadvantage of a high mobility ratio so that the CO2
has a strong tendency to channel through the oil, bypassing much
of the oil in the reservoir. To alleviate this difficulty, the injected
CO2 is often used in combination with water, in an alternating way
(water alternating gas, WAG) in order to obtain the joint benefits
of mobilizing oil with the miscible gas while using water to sweep
mobilized oil to producing wells [6].
CO2 flooding process involves very complicated phase behavior
that depends on the PVT and fluids properties. To understand the
performance of CO2 flooding and provide accurate data for design-
ing reservoir development, a comprehensive investigation of the
phase behavior of CO2 miscible flooding and accurate compositional
reservoir simulation studies need to be conducted.
The objective of this study was to find a work flow for parame-
ter estimation in CO2 miscible flooding process that can be used to
design and optimize field CO2 miscible floods. To accomplish this,
PVT experimental data were analyzed and reservoir simulation stud-
ies were conducted based on CO2 flooding laboratory data. Through
the history matching process, the assumed relative permeability curves
with uncertainty were adjusted for model calibration.
CO2 MISCIBLE FLOODING
The injection fluid (solvent) is normally natural gas, enriched
natural gas, flue gas, nitrogen or CO2 in miscible flooding. These

Parameter estimation in multiple contact CO2 miscibility simulation with uncertain experimental core flooding data 751
Korean J. Chem. Eng.(Vol. 29, No. 6)
fluids are not the first contact with reservoir oils, but with a suffi-
ciently high reservoir pressure, they achieve dynamic miscibility
with many reservoir oils. To explain the different processes in misci-
ble flooding, ternary diagrams are widely used as shown in Fig. 1.
Since the dilution path (I2-J3) does not pass through the two-phase
region or cross the critical tie line, it forms first contact miscible
displacement. When the initial and injected compositions are on
the opposite side of the critical tie line, the displacement is either a
vaporizing gas drive (I2-J1) or a condensing gas drive (I1-J2). The
degree of miscibility between a reservoir oil and injection gas is
often expressed in terms of the minimum miscibility pressure (MMP).
The multiple contact miscibility pressure is the lowest pressure at
which the oil and gas phases resulting from a multiple contact pro-
cess, vaporizing or condensing, between reservoir oil and an injec-
tion gas are miscible [7].
The pressure required for achieving dynamic miscibility with
CO2 is usually significantly lower than the pressure required for
other gases such as natural gas, flue gas or nitrogen. The dynamic
miscibility with CO2 does not require the presence of intermediate
molecular weight hydrocarbons in the reservoir fluid. The extrac-
tion of a broad range of hydrocarbons from the reservoir oil often
causes dynamic miscibility to occur at attainable pressures, which
are lower than the miscibility pressure for a dry hydrocarbon gas.
PVT MODELING OF CRUDE OIL-CO2 SYSTEMS
The components of a fluid sample and experimental result data
like DL (differential liberation), and a swelling test from CMG [8]
are shown in Tables 1, 3, and 4, respectively. The results of the DL
test provide a means of calculating the oil formation volume factors
and gas solubility as a function of reservoir pressure. If a reservoir
is to be depleted under gas injection or a dry gas cycling scheme,
swelling tests should be performed. The purpose of this experiment
was to determine the degree to which the proposed injection gas
will dissolve in the hydrocarbon mixtures [9].
In compositional simulation, the cost and computing time can
increase significantly with the number of components in the sys-
tem. Therefore, the original components in Table 1 were reduced
to seven pseudo-components in Table 2 according to mole fraction.
Phase behavior models may predict highly erroneous results, because
the reduced pseudo-components are not fully defined. The current
approach in the industry when encountering these erroneous results
is to calibrate, or tune, an EOS model against experimental data
generated at pertinent conditions for specific field studies. In the
tuning process, the Peng Robinson (PR) equation of state (EOS)
was used, and regression variables such as critical pressure, tem-
perature, acentric factor, molecular weight, and volume shift param-
eters for the heaviest component were adjusted and tested using com-
mercial phase behavior software, WinProp of CMG. The results of
the tuned models for some properties are shown in Figs. 2, 3, 4, and
5, respectively. The results clearly demonstrate that effective and
more physically reasonable tuning was achieved.
Fig. 1. Conditions for different types of oil displacement by sol-vents [7].
Table 1. Component of oil sample
Component Mole fraction Component Mole fraction
H2S 0.0027 FC16 0.0151
CO2 0.0101 FC17 0.0134
N2 0.0018 FC18 0.0129
C1 0.1257 FC19 0.0114
C2 0.0699 FC20 0.0089
C3 0.0664 FC21 0.0075
IC4 0.0235 FC22 0.0060
NC4 0.0471 FC23 0.0055
IC5 0.0282 FC24 0.0050
NC5 0.0514 FC25 0.0049
FC6 0.0472 FC26 0.0031
FC7 0.0444 FC27 0.0029
FC8 0.0493 FC28 0.0019
FC9 0.0299 FC29 0.0011
FC10 0.0404 NC7 0.0081
FC11 0.0316 NC8 0.0314
FC12 0.0254 NC9 0.0021
FC13 0.0255 C6H6 0.0019
FC14 0.0207 CC6 0.0278
FC15 0.0186 C30+ 0.0693
*C30+: SG (0.97), MW (400)
Table 2. Seven pseudo-components of oil sample
Component Components Mole fraction
Pseudo 1 H2S, CO2 0.0128
Pseudo 2 N2, C1 0.1275
Pseudo 3 C2, C3, IC4, NC4 0.2069
Pseudo 4 IC5, NC5, FC6, FC7 0.1712
Pseudo 5 FC8, FC9, FC10, FC11, FC12 0.1766
Pseudo 6 FC13, FC14, FC15, FC16,
FC17, FC18, FC19, FC20
0.1265
Pseudo 7 FC21~FC29, NC7~NC9, C6H6,
CC6, C30+
0.1785

752 S. Kwon and W. Lee
June, 2012
Using the tuned pseudo-components, the multiple contact mini-
mum miscibility pressure (MCMMP) was calculated in the case of
100% CO2 injection. Input data such as reservoir temperature (186 oF),
pressure (2,515 psia), and swelling test data (Table 4) were used in
calculation. The MCMMP was achieved at 2,364.7 psia, which was
lower than the reservoir pressure.
MATCHING WITH EXPERIMENTAL
CORE FLOOD DATA
The reservoir simulation studies were conducted based on CO2
flooding laboratory data [8] using CMG’s GEM simulation soft-
ware. Additionally, by matching with laboratory core flood data,
we estimated parameters with uncertainty.
A CO2 flooding experiment was performed using a length of 87.36
cm and a diameter of 3.745 cm. Table 5 gives the core properties
and production conditions used for this study. An initial water satura-
tion (connate water saturation) of 20% was established using for-
mation water with a viscosity of 0.45 cp. In the core flooding test,
the pressure and temperature were set as 2,500 psig and 186 oF, re-
spectively, and the confining pressure was 5,650 psig. Water was
injected before CO2 injection at 10 cc/hr for 2.932 days, and then
CO2 was injected at 10 cc/hr for 3.030 days. Finally, chase water
was injected at 10 cc/hr for 4.906 days.
To model the experiment with a 1D compositional model, we
used 50×1×1 grid cells in each direction. At the production end, a
production well is located where the minimum bottom hole pres-
sure is set at 2,515 psi as an operating constraint. Because the rela-
Table 3. Laboratory results of DL test at 186 oF
Pressure
(psia)
Solution gas/oil
ratio (ft3/bbl)
Relative
oil volume
Incremental
gas specific
gravity
Deviation
factor
Gas formation
volume factor
(ft3/ft3)
Oil viscosity
(cp)
Calculated gas
viscosity (cp)
Oil density
(gm/cc)
740 299.3 1.219 0.65 0.742
615 270.6 1.209 0.820 0.9199 0.0275 0.68 0.0132 0.743
465 236.4 1.186 0.803 0.9393 0.0371 0.72 0.0130 0.752
315 188.1 1.175 0.883 0.9478 0.0554 0.83 0.0125 0.766
190 140.4 1.155 1.072 0.9524 0.0927 0.0116 0.795
130 106.7 1.098 1.227 0.9558 0.1366 0.89 0.0110 0.803
015 000.0 1.027 1.621 0.9916 1.2346 1.65 0.0102 0.813
Table 4. Laboratory results of swelling test at 186 oF
Solvent
mole fraction
Saturation
pressure (psia)
Oil formation volume
factor (rm3/m3)
Swelling factor
(ratio)
GOR
(m3/m3)
Density
(g/cc)
Viscosity
(cp)
0.000 0740 1.18 1.00 044 0.753 0.850
0.108 0900 1.21 1.03 067 0.739 0.832
0.297 1488 1.43 1.21 123 0.707 0.556
0.540 1985 1.82 1.54 277 0.626 0.288
0.803 2355 3.68 3.12 675 0.480 0.171
Fig. 2. Comparison of predicted saturation pressure and swellingfactor in swelling test.
Fig. 3. Comparison of predicted GOR and relative oil volume inDL test.

Parameter estimation in multiple contact CO2 miscibility simulation with uncertain experimental core flooding data 753
Korean J. Chem. Eng.(Vol. 29, No. 6)
tive permeability curves were not experimentally measured, corre-
lation equations by Stone’s second model as normalized by Aziz
and Settari [10] were used. In using correlation equations, end point
parameters were initially assumed as in Table 6. Fig. 6 compares
the experimental and simulation results for cumulative oil produc-
tion and inlet bottom pressure. As shown in the figure, discrepan-
cies between experimental and simulation results are observed. There
are numerous possible causes for the differences between the exper-
iment and simulation, some experimental and some related to our
modeling process. However, the most subtle issue may be related
to the relative permeability. Because we used correlation equations
with assumed end point parameters, we tried to match the values
measured in the laboratory by changing the curvature of the rela-
tive permeability curves, and by changing the end point saturation
parameters.
To change the curvature of the relative permeability curves, the
exponents (Nw, Now, Nog, and Ng) of krw, krow, krog, and krg were se-
Fig. 4. Comparison of predicted gas compressibility and gas for-mation volume factor in DL test.
Fig. 5. Comparison of predicted oil and gas viscosity in DL test.
Table 5. Core properties and production conditions
Pore volume (cc) 234.55 Initial water saturation 0.2
Core depth (ft) 6200 Injection rate (cc/hr) 10.0
Porosity (fraction) 0.24 Production pressure (psig) 2500
Permeability (md) 11.43 Separator condition 14.7 psia at 60 oF
Rock compressibility (1/psi) 4.00E-6
Core length (cm) 87.36
Core diameter (cm) 3.75
Table 6. Initial and optimum relative permeability parameters
Cases Nw Now Nog Ng Sgcrit Sorw Sorg krwiro krgcl
Initially assumed 2.0 2.0 2.0 2.0 0.00 0.25 0.00 0.080 0.020
1 4.0 2.0 3.0 3.0 0.03 0.27 0.05 0.085 0.015
2 4.0 2.0 3.0 3.0 0.02 0.27 0.03 0.085 0.015
3 4.0 2.0 3.0 3.0 0.05 0.27 0.03 0.085 0.020
4 4.0 2.0 3.0 3.0 0.05 0.28 0.03 0.085 0.020
5 4.0 2.0 3.0 3.0 0.05 0.28 0.05 0.085 0.015
Fig. 6. Comparison of experimental and simulation results for cu-mulative oil production and inlet bottom hole pressure us-ing assumed relative permeability parameters.
754 S. Kwon and W. Lee
June, 2012
lected as 1.5, 2.0, 3.0, 4.0, and 5.0 as presented in the following cor-
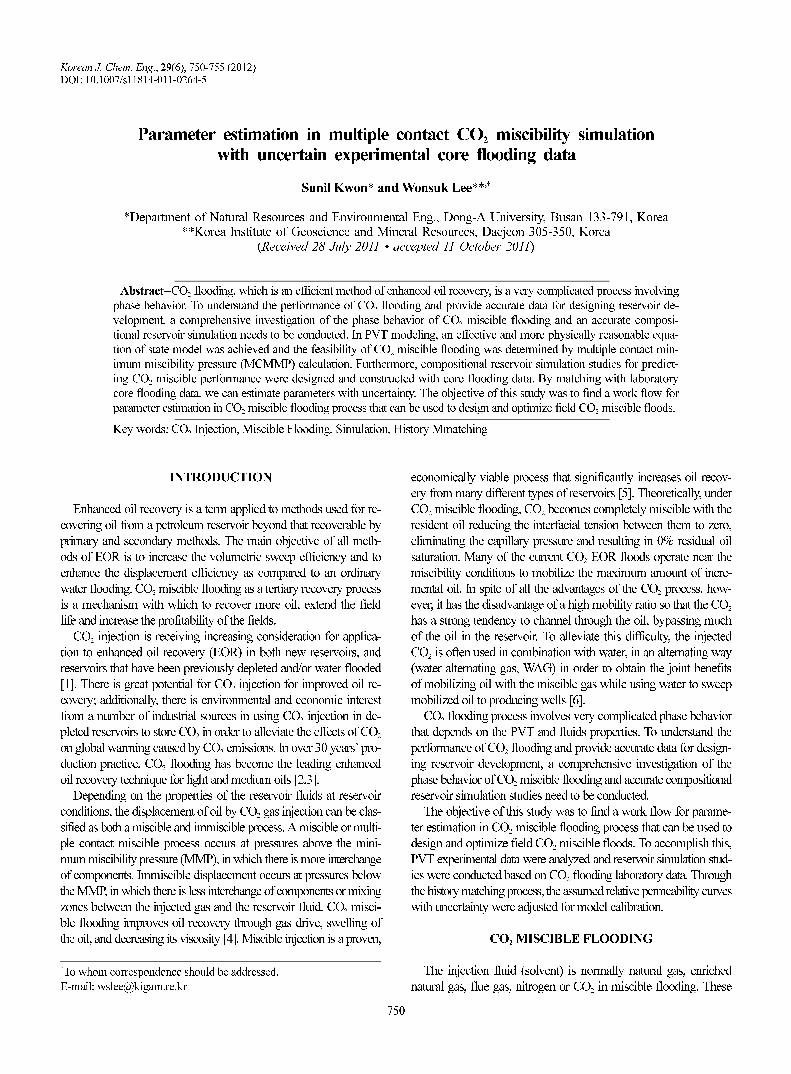
relation equations. Also, the end point saturation parameters such as
Sorw, Sgcrit, krwiro, and krgcl, which are described in Fig. 7, were changed.
(1)
(2)
(3)
(4)
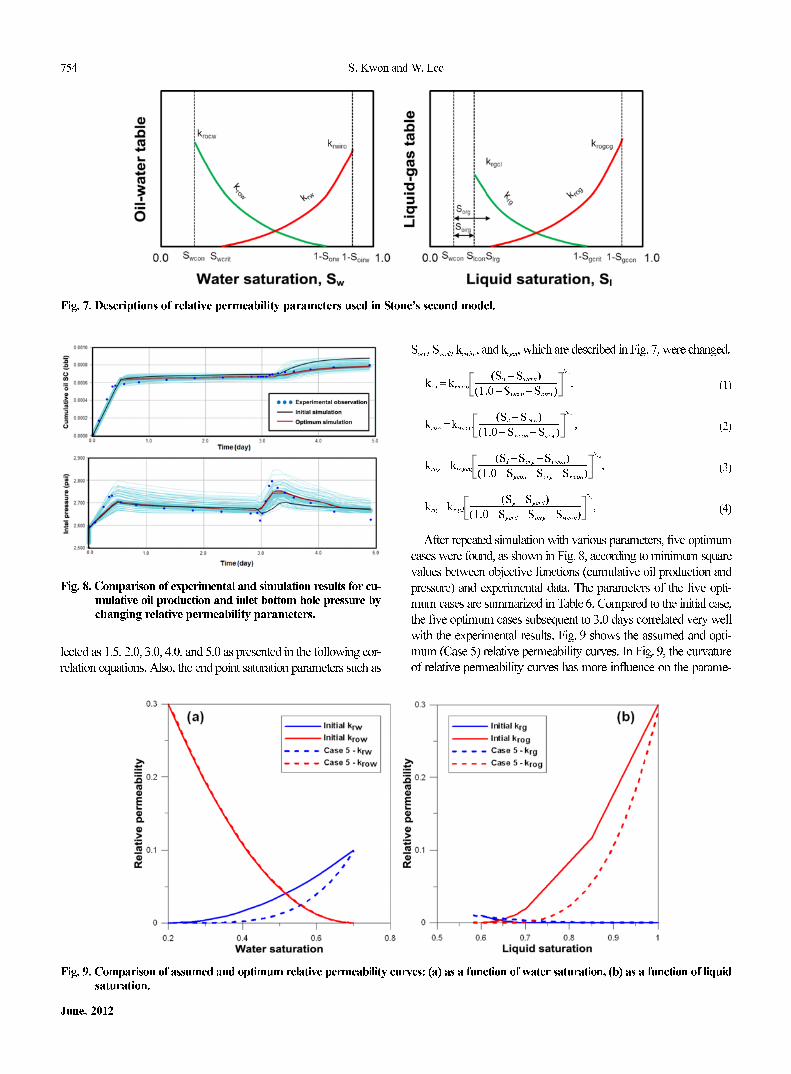
After repeated simulation with various parameters, five optimum
cases were found, as shown in Fig. 8, according to minimum square
values between objective functions (cumulative oil production and
pressure) and experimental data. The parameters of the five opti-
mum cases are summarized in Table 6. Compared to the initial case,
the five optimum cases subsequent to 3.0 days correlated very well
with the experimental results. Fig. 9 shows the assumed and opti-
mum (Case 5) relative permeability curves. In Fig. 9, the curvature
of relative permeability curves has more influence on the parame-
krw = kwriro
Sw − Swcrit( )
1.0 − Swcrit − Soirw( )-----------------------------------------
Nw
,
krow = kwocw
So − Sorw( )
1.0 − Swcon − Sorw( )----------------------------------------
Now
,
krog = krogcg
SI − Sorg − Swcon( )
1.0 − Sgcon − Sorg − Swcon( )-------------------------------------------------------
Nog
,
krg = krgcl
Sg − Sgcrit( )
1.0 − Sgcrit − Soirg − Swcon( )--------------------------------------------------------
Ng
,
Fig. 7. Descriptions of relative permeability parameters used in Stone’s second model.
Fig. 8. Comparison of experimental and simulation results for cu-mulative oil production and inlet bottom hole pressure bychanging relative permeability parameters.
Fig. 9. Comparison of assumed and optimum relative permeability curves: (a) as a function of water saturation, (b) as a function of liquidsaturation.
Parameter estimation in multiple contact CO2 miscibility simulation with uncertain experimental core flooding data 755
Korean J. Chem. Eng.(Vol. 29, No. 6)
ters than on the end point saturations.
CONCLUSIONS
We developed a work flow for uncertain parameters in CO2 misci-
ble flooding by PVT modeling and reservoir simulation studies based
on PVT and CO2 core flooding experimental data. Finally, we esti-
mated parameters with uncertainty by matching relative permeabil-
ity curves. This could be used in the design and optimization of the
CO2 miscible flooding process. The following conclusions can be
drawn from this study:
1. To decrease computing time in compositional simulation, the
component numbers of fluid sample have to be reduced to pseudo-
components. Because the reduced pseudo-components are not fully
defined, the EOS model against experimental data needs to be cali-
brated. In the tuning process, by modifying the critical pressure,
temperature, acentric factor, molecular weight, and volume shift
parameters of the heaviest component as regression parameters, a
more effective and physically reasonable EOS model was achieved.
2. For the feasibility of CO2 miscible flooding in reservoir condi-
tions, the multiple contact minimum miscibility pressure (MCMMP)
was achieved at 2,364.7 psia. Because it is lower than reservoir
pressure (2,515 psia), CO2 miscible flooding could be a reasonable
option for EOR of the reservoir.
Compositional reservoir simulation studies for predicting CO2
miscible performance have been designed and conducted. By match-
ing with laboratory core flooding data, we estimated parameters
with uncertainty. We also found that the curvature of relative per-
meability curves has more influence on parameters than on end-
point saturations.
ACKNOWLEDGEMENTS
This work was supported by the “Energy Efficiency & Resources”
of the Korea Institute of Energy Technology Evaluation and Plan-
ning (KETEP) grant funded by the Korea government Ministry of
Knowledge Economy.
NOMENCLATURE
krw : relative permeability to water in oil-water system
krow : relative permeability to oil in oil-water system
krg : relative permeability to gas in liquid-gas system
krog : relative permeability to liquid in liquid-gas system
krocw : oil relative permeability at the connate water saturation
krwiro : water relative permeability at the residual oil saturation
krgcl : gas relative permeability at the connate liquid saturation
krogcg : liquid relative permeability at the residual liquid saturation
Nw, Now, Nog, Ng : exponents on relative permeability curves
Sorw : residual oil saturation in oil-water system
Soirw : irreducible oil saturation in oil-water system
Sorg : residual oil saturation in liquid-gas system
Soirg : irreducible oil saturation in liquid-gas system
Sgcrit : critical gas saturation
Sgcon : connate gas saturation
Swcrit : critical water saturation
Swcon : connate water saturation
REFERENCES
1. DOE, DOE’s Oil Recovery R&D Program, Fossil Energy (2006).
2. M. Dong, S. Huang and R. Srivastava, JCPT, November, 53 (2000).
3. R. B. Grigg and D. S. Schechter, SPE 38849 the SPE Annual Tech-
nical Conference and Exhibition, San Antonia, US (1997).
4. J. Bon, H. K. Kalfa and A. M. Theophilos, SPE 97536 the SPE Inter-
national Improved Oil Recovery Conference in Asia Pacific, KL,
Malaysia (2005).
5. E. D. Holstein and F. I. Stalkup, SPE Petroleum engineering hand-
book Vol. 5, Richardson Texas (2007).
6. S. Ghedan, SPE 125581 the SPE/EAGE Reservoir Characteriza-
tion and Simulation Conference, Abu Dhabi, UAE (2009).
7. L. W. Lake, Enhanced oil recovery, University of Texas and Austin
(1989).
8. CMG, Enhanced oil recovery with miscible CO2 injection in IMEX
& GEM, CMG Training Course (2010).
9. T. H. Ahmed, Equations of state and PVT analysis, Gulf Publishing
Company, Houston Texas (2007).
10. K. Aziz and A. Settari, Petroleum Reservoir Simulation, Applied
Science Publishers, London (1979).