parametric studies of dust distribution - …miningst.com/longwall/design and development of an air...
TRANSCRIPT

Chapter 3
PARAMETRIC STUDIES OF DUST DISTRIBUTION
3.1 INTRODUCTION
In order to develop an effective dust control technique it was necessary to have a
thorough understanding of the airflow characteristics and respirable dust behaviour in
a longwall face. A review of the literature showed that only very limited data existed
on dust cloud characterisation at a longwall face. Furthermore, the large variations in
the dust concentration profiles at different longwall faces and the physical differences
in the longwall faces, ventilation plan and operating procedures made the data
inapplicable at Australian longwall faces. Thus a need existed for detailed and
extensive dust sampling at longwall faces in Australia, both to develop a fundamental
data set on spatial and temporal variations in dust levels and to understand respirable
dust behaviour in order to develop effective dust control techniques. In addition,
information on the size distribution of mine respirable dust was required as the
effectiveness of many dust control techniques is particle size dependent.
The generation and transportation of airborne dust is governed mainly by the velocity
and the movement pattern of the ventilating air in longwall faces. Thus, it is
important to know the air velocity distribution in the face to design a dust control
technique. The air velocity profiles may vary from mine to mine due to variations in
face geometry, dimensions, type of ventilation system used, height of seam and type
of supports used. Experimental studies can however, provide a qualitative
understanding of the average air flow conditions in a longwall face.

Chapter 3: Dust Distribution Page 59
Hence, extensive field investigations were conducted in four operating longwall faces
in the Southern district of New South Wales, Australia. The experiments were
designed to determine the influence of various parameters on respirable dust
concentration levels and behaviour of dust. Average and instantaneous respirable
dust concentration profiles along and across the longwall face were determined, as
were air velocity profiles. Data on the face layout, time study of the activities at the
face, and size distribution of respirable dust were collected for analysis of the relevant
dust behaviour with respect to various face conditions.
3.2 OBJECTIVES OF FIELD INVESTIGATIONS
Experiments were designed to obtain basic data on the concentration levels and
behaviour of respirable dust in a longwall face. The primary objectives of these
preliminary investigations were to:
(i) identify major dust sources along the longwall face;
(ii) identify the major factors affecting dust distribution profiles along the face;
(iii) determine instantaneous dust concentration profiles along and across the
longwall face for better understanding of the real-time behaviour of dust;
(iv) determine the air velocity profiles in the longwall face;
(v) determine the size distribution of respirable dust;
(vi) obtain the basic data for mathematical modelling of the dust behaviour in a
longwall face and control techniques, and
(vii) plan new approaches for dust control in the longwall face.

Chapter 3: Dust Distribution Page 60
3.3 DESIGN OF UNDERGROUND EXPERIMENTS
The determination of the transient dust profiles at a longwall face required
comprehensive planning and execution of underground experiments. Specific aspects
which were considered included the types of samples to be collected, selection of
proper instruments and detailed sampling and time study plans to correlate the dust
concentration with the different activities at the face. Interpretation of the respirable
dust survey data required face details from all the longwall faces because the
parameters and geometry of the longwall faces differed from one mine to another. To
achieve the objectives mentioned in previous section, two types of surveys were
conducted, namely time averaged gravimetric sampling surveys and instantaneous
respirable dust concentration surveys.
Gravimetric samplers are routinely used by mine operators to determine compliance
with dust standards. The gravimetric dust samples provide information on the
average airborne dust levels along the face over the entire sampling period. They
were also necessary for studying the size distribution of airborne dust in the face. The
dust samplers are normally worn by mine personnel, but during these surveys
discussed here, they were fixed at predetermined locations along the longwall face.
The instantaneous respirable airborne dust concentration profiles on a continuous
basis at a predetermined point can be used to determine the relationship between the
dust level, the location of the shearer and shearer activities under given airflow
conditions. The information is useful in characterising the temporal behaviour of the
respirable dust in relation to mining activities at the face.

Chapter 3: Dust Distribution Page 61
3.3.1 Field instrumentation
(a) Gravimetric dust survey instrumentation
The 'Du Pont P-2500' sampling instrument, commonly referred to as personal
sampler, was used for measuring the average respirable dust concentration along the
longwall face (Hewitt, 1986b; Breslin, Page and Jankowski, 1983). The instrument is
shown in Figure 3.1. The sampler consists of an air pump, a 25 mm cassella cyclone
and a filter cassette. The air flow range of the instrument is from 1 to 2.5 l/min. The
pump used to draw the air into the sampling system was battery powered, weighed
less than one kilogram, and had overall dimensions of approximately 18cm x 10cm x
5cm. The cyclone and filter assembly, commonly referred to as the 'sampling head'
was connected to the sampling pump by a 3 mm diameter tube.
Figure 3.1 Du Pont personal dust sampler, Model P-2500.

Chapter 3: Dust Distribution Page 62
The instrument is designed to be capable of sampling the dust environment a miner is
exposed to during his working shift by mounting it on the miner, but has the
flexibility of being used as a stationary instrument to obtain measurements of the
general dust environment where it is located.
The following set of auxiliary instruments were also used during the surveys:
(i) Charging unit;
(ii) Flowmeter to calibrate the instrument;
(iii) Precision weighing balance;
(iv) Dessicator - to remove moisture.
(b) Instantaneous dust survey instrumentation
A 'Hund' (TM-digital P, 1991; Hewitt and Aziz, 1993) instantaneous sampler was
used to monitor the instantaneous respirable dust concentration on a continuous basis
in the longwall face. It uses a wide angle light scattering system to measure the
respirable dust concentration in the airflow passing through its light beam. It has the
capability of measuring respirable dust concentration without the preliminary
separation of coarse particles. A light emitting display shows the respirable dust
concentration as the current value for the preceding seconds or as the specified time
weighted average. The measuring range of the instrument is from 0 to 100 mg/m3. It
is portable, battery powered, weighs 980 gm and has overall dimensions of 193mm x
102mm x 46mm (Figure 3.2). The battery of the instrument, if used continuously,
lasts for about 5 to 6 hours.
The Hund continuously records fluctuations in dust levels and calculates a running
average that is updated every second. It can be used to measure single and average
values for random measuring periods. During these field surveys, average
concentration measurements were taken every 15 seconds. The instrument was

Chapter 3: Dust Distribution Page 63
Figure 3.2(a) Hund instantaneous dust sampling instrument.
Figure 3.2(b) A schematic figure showing measuring chamber with infrared
beam opening (after TM-digital P, 1991).

Chapter 3: Dust Distribution Page 64
calibrated regularly to ensure the accuracy of the collected data. The performance of
the instrument has been evaluated both in the laboratory (Thompson et al, 1981;
Williams, 1983) and in the field (Hwang et al, 1988).
(c) Other instrumentation
A vane anemometer was used to measure the air velocity in the longwall face. A
Malvern micron size particle analyser (Malvern Instruments, 1990) was also used to
determine the dust size distribution. Cascade impactors are commonly used to obtain
the in-situ size distribution of airborne dust, but because of their susceptibility to
overloading, they are inconvenient for large scale data collection in mines.
Instruments commonly used in the laboratory for size distribution measurement of
respirable particles are Coulter Counter, Microtrac Small Particle Analyzer and
Scanning Electron Microscope. These instruments use electrical sensing, light
scattering and microscopic principles respectively for measuring size distribution
(Dumm and Hogg, 1987; Grayson and Peng, 1986).
3.3.2 Sampling procedure
(a) Average gravimetric dust survey
Sampling stations were located along the face to obtain data on time-averaged
gravimetric dust concentration levels (Figure 3.3). The first sampling station was
positioned in the intake roadway at the crib room. This was to obtain information on
intake air dust contamination in a longwall section due to dust generated at out-bye
transport roadways. Another sampling station was set up in the return airway. The
other six sampling stations were placed at an equal distance from each other between
the intake and return sampling stations.

Chapter 3: Dust Distribution Page 65
goaf goaf
coal1 2
4 5 6
Figure 3.3 Respirable dust sampling locations along the longwall face A.
100 m
7 8
1. station in intake 2. station at 25 m 3. station at 42m 4. station at 60 m 5. station at 75 m
Gravimetric and instantaneous sampling st ation locations
3
6. station at return end 7. station on shearer 8. station at srusher
The sampling instruments at the face were hung from the shield's canopy over the
spill plate/ walkway in the miners' breathing zone. The cyclone was attached to the
sampling pump to eliminate errors associated with high face velocities. The pumps
were calibrated every alternate day in the laboratory using a calibration flowmeter to
ensure the accuracy of the data. Sampling was performed over a period of 15
continuous working shifts to eliminate the effects of shift practices. As mentioned
earlier, the air velocities along the face were also measured using vane anemometers.

Chapter 3: Dust Distribution Page 66
In the laboratory, new filters, preweighed to a precision of 0.001 mg, were mounted in
the cyclones. The Du Pont pump flow was adjusted to 1.9 l/min before commencing
the experiments. On the site, the cyclones were connected to the sampling pumps by
3 mm diameter tubing. After sampling, the filters were precision weighed again on
an electronic microbalance to within 0.001 mg in the laboratory. The samples were
desiccated before being weighed to remove any moisture that might have been
absorbed. An ionising unit, called a static master, was also used to eliminate static
charges on all filters before weighing. The samples were reweighed after drying for
24 hours and the net weight of the respirable dust concentration determined.
Although the sampling time required depends strongly on the dust concentration
being measured, it should include at least 30 minutes of cutting time to obtain a
sufficient sample (Foster-Miller Associates, Inc., 1982). During these investigations,
the samplers were operated for a full shift and the weight of dust collected was
determined after the shift. The time-averaged gravimetric dust concentrations over
the entire sampling period were calculated on the basis of the mass collected on the
filters, the sampling time and the pump flow rate.
The concentration of respirable dust was calculated using the following formula:
where, x = concentration of respirable dust (mg/m3)
m1 = mass of filter before use (mg)
m2 = mass of loaded filter after use (mg)
r = air flow rate through sampling pump (l/min)
t = sampling time (min.)

Chapter 3: Dust Distribution Page 67
(b) Instantaneous dust surveys
(i) Dust profiles along the face : In the longwall mining system, the major dust
generating source, the shearer, not only moves as it cuts the coal but its movement
can be either with, or against, the direction of airflow in the face. The dust
concentration at any given point is a function of the shearer activities at that time, the
position of the sampling point, the direction of shearer movement, the air velocity and
quantity passing through the face, and other face activities. In order to correlate the
instantaneous dust concentration along the longwall face with respect to the shearer
position and face activities, two types of instantaneous dust survey methods were
used, a moving and a stationary instrument method.
In the moving instrument method, the Hund sampler was moved at a fixed distance
from the shearer as it travelled along the face. In different experiments, the position
of the moving Hund was changed to obtain dust concentration profiles at different
positions relative to the shearer. These positions included the rear operator's location,
the mid-point of the shearer, and 5 m, 10 m, and 20 m downwind of the shearer.
During the surveys, the Hund was kept on the walkway side of the face and readings
were taken at a height of 1.3 - 1.7 m, which was considered to be the most likely
inhalation position of the face crew. Averaged instantaneous dust concentration
values were read approximately every 15 seconds.
In the stationary instrument sampling method, the Hund monitor was positioned at a
fixed location at the face. Dust profiles were obtained at several fixed locations along
the face while the shearer was operating. Typically, in one experiment, the sampling
station was located near the return end of the face to determine the instantaneous dust
concentration levels at the tailgate operator's position during a complete cutting,
cleaning and sumping cycle.

Chapter 3: Dust Distribution Page 68
(ii) Dust profiles around the shearer : To determine the dust concentration profiles
around the shearer the following procedure was followed. The Hund instrument was
fixed at a location and, as the shearer approached the sampling point, both the dust
levels and distances from the shearer were recorded. Recordings were based on the
time and the shearer's tramming speed. The tram rate was calculated from taking the
shearer's passage time at 5-shield intervals, i.e. at shields 10, 15, 20, 25, etc. For
example, as the shearer approached the sampling station, dust concentration readings
were taken every 5 seconds, beginning 10 minutes prior to the shearer's arrival. At an
average tramming speed of 5 m/min, this would put the shearer approximately 50 m
upwind or downwind of the sampling station. After the shearer had passed the
sampling location, dust levels were recorded for an additional 5 minutes. Respirable
dust profiles were thus obtained for about 70 m reflecting concentrations on the
intake and return side of the shearer.
In the case of cutting with ventilation, sampling commenced when the shearer was
about 50 m upwind of the sampling station and continued until the shearer had passed
and was 20 m downwind of the sampler. In case of cutting against ventilation,
readings commenced when the shearer was 20 m downwind of the sampling position
and continued until it had passed and was 50 m upwind side of the sampler.
(iii) Miscellaneous data : Instantaneous sampling was carried out for the entire cycle
which consisted of one cutting, one sumping and one flitting operation, over about 30
to 60 minutes depending on the face conditions. Production of coal during this period
was between 300 and 800 tonnes. During all surveys, dust concentration
measurements were taken in the walkway adjacent to the shearer. To correlate the
instantaneous respirable dust concentration values with the activities of the shearer
and its location, a time study of shearer activities was conducted at the same time.
These included tailgate cutting, sumping, cutting time, travelling rate, shearer cutting

Chapter 3: Dust Distribution Page 69
direction, face stoppages, support movement and shearer location relative to each
sampling station. The information on the shearer activities during every cutting cycle
was necessary as cutting cycle times are different for different cuts /faces. Other face
details such as coal seam thickness, type of supports, air velocity, etc. were also
noted.
(iv) Support generated dust: : To measure the support generated dust, one Hund
instrument was carried at a constant distance of 3 m on the upwind side of the moving
supports and another Hund instrument was carried at a constant distance on the
downwind side of the moving supports. The distance between the moving supports
and downwind sampling instrument was kept at 1 m, 5 m, and 10 m during different
experiments. Dust concentrations were read approximately every 4 seconds. The
difference between the readings of the two instruments gives the level of dust
generated by support movement.
(iv) Dust profiles across the section of the face : The ideal procedure to obtain dust
gradients across the face is to position 10-15 instantaneous sampling instruments
across the face and to collect the readings simultaneously for 20 - 30 minutes. Owing
to resources limitation, two instruments were used and the following procedure was
adopted to obtain this data. First, the whole cross section of the face was divided into
9 - 15 arbitrary sections. The two instantaneous samplers were located approximately
1.0 to 1.5 m distant apart in one section of the face. The location of the instruments
was changed to different sections of the face in different experiments to obtain dust
gradients in parts. For example, during experiment 1, one sampler was located over
the panline while the second one was positioned in the front walkway, i.e. between
the spill plate and front legs. During the second experiment, the first sampler was
located over the spill plate while the second one was positioned in the back walkway,
i.e. in between the two rows of legs. Similarly several other experiments were

Chapter 3: Dust Distribution Page 70
conducted to collect dust gradients across all sections of the face. Data from all
sections was used to determine the dust gradient across the full section of the face.
Four longwall faces each with a poor dust compliance record were selected for the
field investigations. They are referred to as longwall faces 'A', 'B', 'C' and 'D'. The
main characteristics of the faces are listed in Table 3.1 and brief description of the
faces and the results of the field studies are provided in the following sections.
Table 3.1. Main characteristics of the longwall faces - parametric studies
Face Seam
thickness (m)
Face length
(m)
Cutting direction
Ventilation Air velocity
(m/s)
A 2.1 - 2.5 100 with ventilation homotropal 2.0 - 2.2
B 2.2 - 2.7 200 against
ventilation
antitropal 3.3 - 3.8
C 2.1 - 2.5 150 with ventilation homotropal 1.8 - 2.1
D 1.9 - 2.2 200 against
ventilation
antitropal 2.6 - 2.8
3.4 RESULTS OF INVESTIGATIONS IN LONGWALL FACE 'A'
Longwall face A was operating in the Bulli Seam in the Southern district of NSW,
Australia. The working height was between 2.1 and 2.5 m and the main properties of
the seam were as follows: thickness 2.1 - 3.2 m, moisture 1.0 - 1.1%, volatile matter
26%, Hardgrove Grindability Index 69 - 80. The longwall face length was 100 m and
the length of the panel was 1250 m. A EDW-300-L Eichoff double ended ranging
drum shearer and 2 x 460 tonnes split base two legged shields were used in this face.
The diameter and width of the cutting drums were 1.2 m and 0.9 m respectively. The
average tram speed of the shearer while cutting was approximately 7 m/min.

Chapter 3: Dust Distribution Page 71
The cutting sequence was uni-directional with cutting from tailgate to maingate in the
direction of ventilation. The roof supports were advanced on the intake side of the
shearer immediately after cutting. A homotropal ventilation system was used and the
face air velocity varied between 2.0 and 2.2 m/s. The average daily production from
the face was about 5 400 tonnes and the annual production was approximately 1.6
million tonnes.
3.4.1 Average dust concentration profiles
Average dust concentration survey results from some experiments are given in Table
3.2 showing dust levels at different stations along the longwall face. During each of
the experiments the shearer completed between 3 and 6 full cuts in each shift,
producing between 900 and 2 000 tonnes. From these, typical average dust
concentration profiles along longwall face A were determined and are shown in
Figures 3.4 and 3.5. The data shows that the concentration varies with the location of
the sampling point. The dust concentration at the beginning of the face is low
because of the homotropal ventilation system and there is a general increase in dust
concentration from intake to return. The dust level at the return end station is highest
because all the dust generated has to pass through this station, as opposed to other
sampling stations which are downwind for only some part of the cutting process.
These profiles differ from those in U.S. mines, because of the bleeder ventilation
system used.
As this face is homotropally ventilated, the dust generated at the stage loader goes
directly into the return airway. Thus, the stage loader dust did not add to longwall
face dust levels, but did overload the rock dusting requirements in the return airway.
To measure this dust generation, one sampling station was located in the return
airway on the return side of the stage loader. Therefore the results presented in the

Chapter 3: Dust Distribution Page 72
last column of

Chapter 3: Dust Distribution Page 73
Table 3.2. Average dust concentration levels along the face (in mg/m3)
Sl.No.
face intake
17th Chock
42nd Chock
65th Chock
Production (tonnes)
Shearer Boot End (crusher)
1 0.08 0.97 1.74 2.10
1400 2.93 -
2 0.17 1.30 1.63 2.07
1600 3.53 17.46
3 0.16 0.63 0.99 1.64
800 2.37 6.80
4 - 1.09 3.46 4.06
2000 2.20 12.48
5 0.38 0.37 0.75 1.33
500 0.49 3.81
6 0.19 0.80 1.68 2.55
1500 1.73 9.84
7 0.28 0.49 1.27 1.52
800 1.93 3.33
8 0.16 0.37 2.15 2.76
2000 2.43 7.65
9 0.14 0.75 2.38 3.83
2000 - 14.30
10 0.41 1.68 2.88 5.27
2600 3.95 6.90
11 0.19 0.90 1.72 2.52
1600 - 8.9
12 - 0.83 2.40 4.96
2000 3.11 -
13 - 1.07 2.95 5.60
2500 6.05 98.52
14 0.15 1.03 2.22 4.94
2200 2.99 -

Chapter 3: Dust Distribution Page 74
8060402000
2
4
6
8
Exp. 1Exp. 2Exp. 3
SUPPORT NUM B ER
Figure 3.4 Average gravimetric airborne respirable dust concentration profiles along the longwall face A for experiments 1, 2 and 3.

Chapter 3: Dust Distribution Page 75
8060402000
2
4
6
8
Exp. 4Exp. 5Exp. 6
SUPPORT NUM B ER
Figure 3.5 Average gravimetric airborne respirable dust concentration profiles along the longwall face A for experiments 4, 5 and 6.

Chapter 3: Dust Distribution Page 76
Table 3.2 relate to the return side of the stage loader and represents only the dust
generated at the stage loader and do not indicate the total longwall face dust levels.
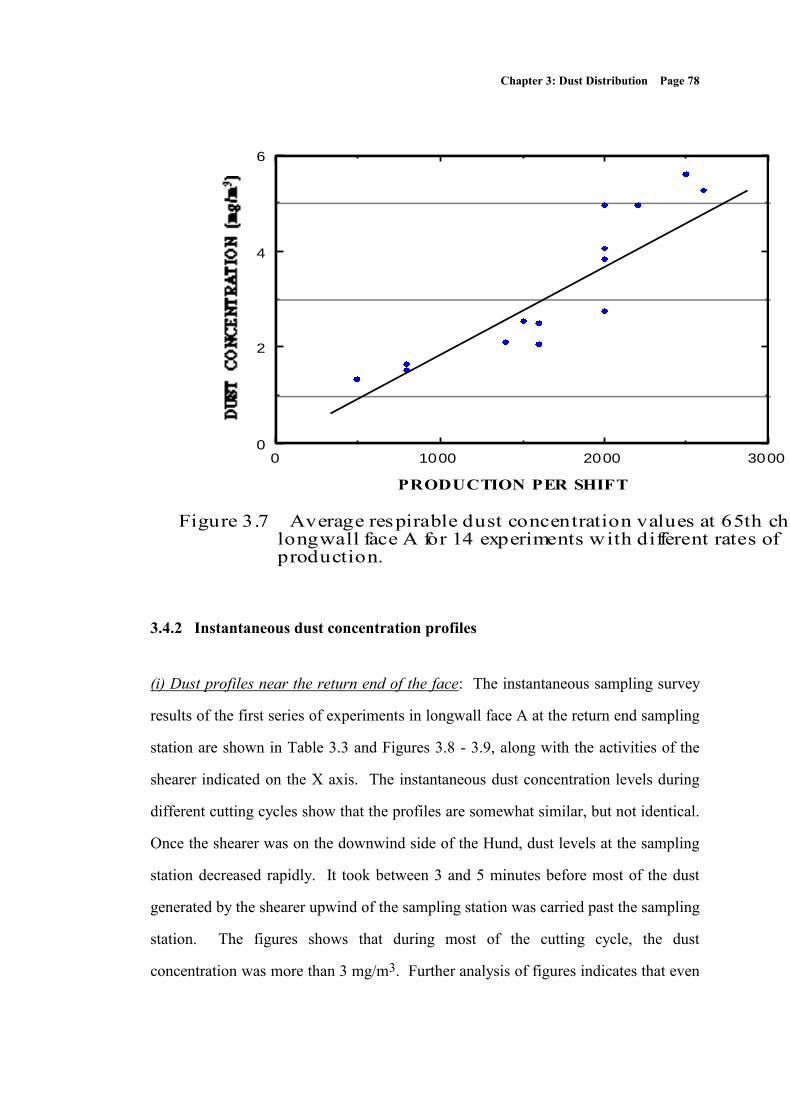
Figures 3.6 and 3.7 shows the relationship between production and dust level along
the longwall face. The figures indicate that the dust levels exceeded the statutory
limit of 3 mg/m3 when the production per shift was more than 2 000 tonnes.
Measurement of airborne dust by personal samplers is a commonly accepted means of
monitoring worker's exposure to hazardous dust in the work place. While such
routine measurements provide a direct measurement of the average exposure over a
complete shift, they do not provide information on variations of concentration in time
and space as the worker proceeds with his duties. Full shift gravimetric samplers are
usually not adequate to determine specific dust sources, and therefore, these results
cannot be used to determine the effect of different operating practices on spatial
variations in dust levels at different locations.

Chapter 3: Dust Distribution Page 77
30002000100000
2
4
6
PRODUCTION PER SHIFT
Figure 3.6 Average respirable dust concentration values at 42nd chock in longwall face A for 14 experiments with different rates of production.
Chapter 3: Dust Distribution Page 78
30002000100000
2
4
6
PRODUCTION PER SHIFT
Figure 3.7 Average respirable dust concentration values at 65th chock in longwall face A for 14 experiments with different rates of production.
3.4.2 Instantaneous dust concentration profiles
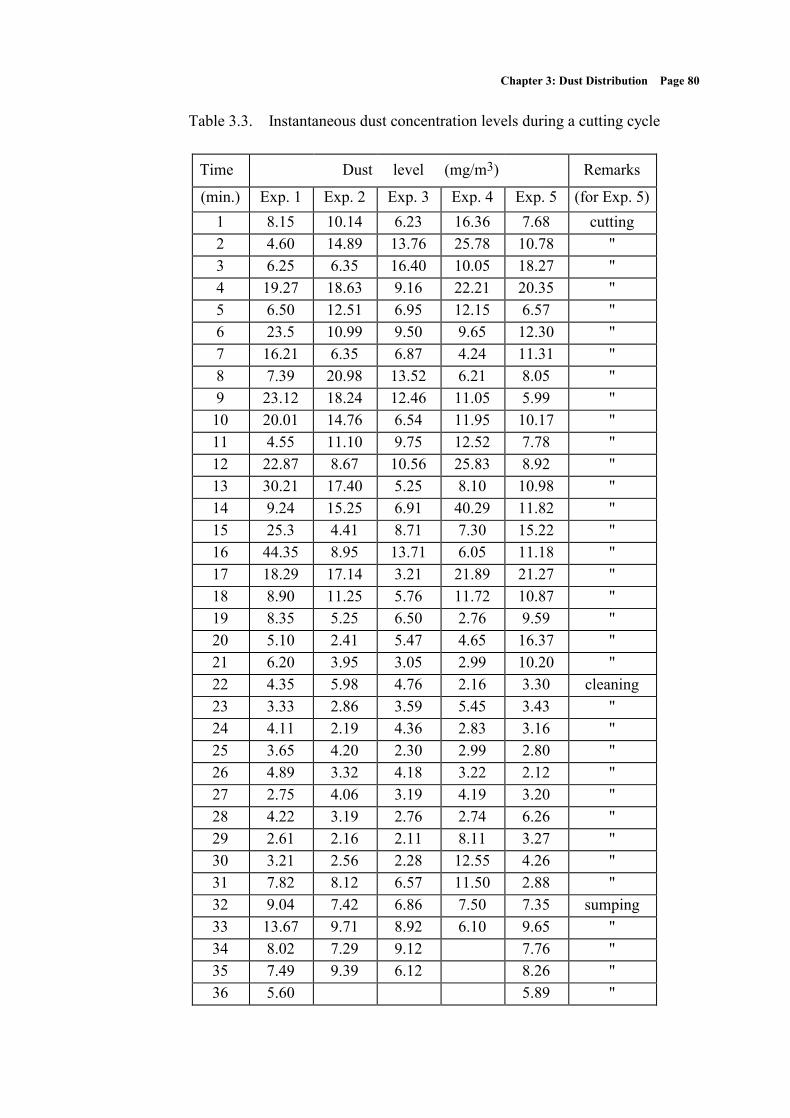
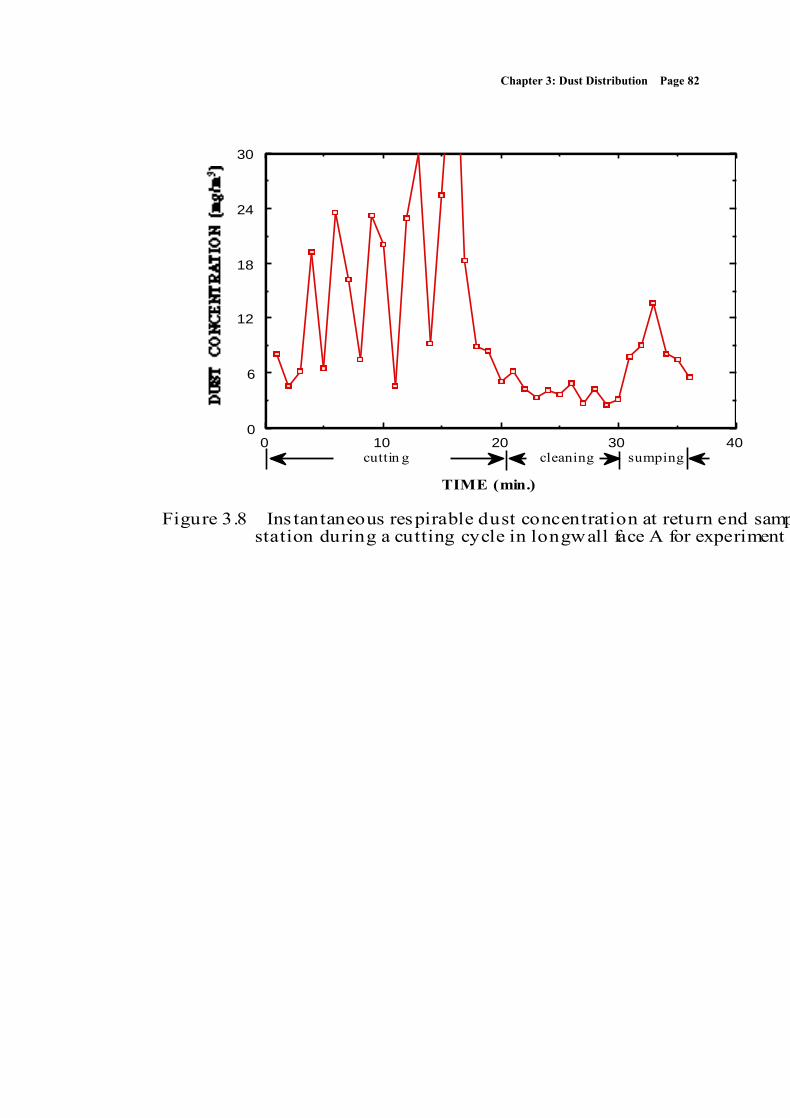
(i) Dust profiles near the return end of the face: The instantaneous sampling survey
results of the first series of experiments in longwall face A at the return end sampling
station are shown in Table 3.3 and Figures 3.8 - 3.9, along with the activities of the
shearer indicated on the X axis. The instantaneous dust concentration levels during
different cutting cycles show that the profiles are somewhat similar, but not identical.
Once the shearer was on the downwind side of the Hund, dust levels at the sampling
station decreased rapidly. It took between 3 and 5 minutes before most of the dust
generated by the shearer upwind of the sampling station was carried past the sampling
station. The figures shows that during most of the cutting cycle, the dust
concentration was more than 3 mg/m3. Further analysis of figures indicates that even

Chapter 3: Dust Distribution Page 79
during the sumping operation at the tailgate entry, the dust concentration was higher
than the allowable limit.
Chapter 3: Dust Distribution Page 80
Table 3.3. Instantaneous dust concentration levels during a cutting cycle
Time Dust level (mg/m3) Remarks
(min.) Exp. 1 Exp. 2 Exp. 3 Exp. 4 Exp. 5 (for Exp. 5)
1 8.15 10.14 6.23 16.36 7.68 cutting
2 4.60 14.89 13.76 25.78 10.78 "
3 6.25 6.35 16.40 10.05 18.27 "
4 19.27 18.63 9.16 22.21 20.35 "
5 6.50 12.51 6.95 12.15 6.57 "
6 23.5 10.99 9.50 9.65 12.30 "
7 16.21 6.35 6.87 4.24 11.31 "
8 7.39 20.98 13.52 6.21 8.05 "
9 23.12 18.24 12.46 11.05 5.99 "
10 20.01 14.76 6.54 11.95 10.17 "
11 4.55 11.10 9.75 12.52 7.78 "
12 22.87 8.67 10.56 25.83 8.92 "
13 30.21 17.40 5.25 8.10 10.98 "
14 9.24 15.25 6.91 40.29 11.82 "
15 25.3 4.41 8.71 7.30 15.22 "
16 44.35 8.95 13.71 6.05 11.18 "
17 18.29 17.14 3.21 21.89 21.27 "
18 8.90 11.25 5.76 11.72 10.87 "
19 8.35 5.25 6.50 2.76 9.59 "
20 5.10 2.41 5.47 4.65 16.37 "
21 6.20 3.95 3.05 2.99 10.20 "
22 4.35 5.98 4.76 2.16 3.30 cleaning
23 3.33 2.86 3.59 5.45 3.43 "
24 4.11 2.19 4.36 2.83 3.16 "
25 3.65 4.20 2.30 2.99 2.80 "
26 4.89 3.32 4.18 3.22 2.12 "
27 2.75 4.06 3.19 4.19 3.20 "
28 4.22 3.19 2.76 2.74 6.26 "
29 2.61 2.16 2.11 8.11 3.27 "
30 3.21 2.56 2.28 12.55 4.26 "
31 7.82 8.12 6.57 11.50 2.88 "
32 9.04 7.42 6.86 7.50 7.35 sumping
33 13.67 9.71 8.92 6.10 9.65 "
34 8.02 7.29 9.12 7.76 "
35 7.49 9.39 6.12 8.26 "
36 5.60 5.89 "

Chapter 3: Dust Distribution Page 81
37 7.82 "
Chapter 3: Dust Distribution Page 82
4030201000
6
12
18
24
30
TIME (min.)
cuttin g
Figure 3.8 Ins tantaneous respirable dust concentration at return end sampling station during a cutting cycle in longwall face A for experiment 1.
sumpingcleaning

Chapter 3: Dust Distribution Page 83
4030201000
6
12
18
24
30
TIME (min.)
cuttin g
Figure 3.9 Ins tantaneous respirable dust concentration at return end sampling station during a cutting cycle in longwall face A for experiment 2.
sumpingcleaning

Chapter 3: Dust Distribution Page 84
A plot of instantaneous respirable dust levels at the stage loader is shown in Figure
3.10. As a homotropal ventilation system was used in this face, the dust generated at
this location did not contribute to the longwall face dust concentration, but
overloaded the rock dusting requirements in the return airway. However, results
show that a large amount of respirable dust was generated at the stage loader.
Therefore, it is very important to control the dust generation at the stage loader and at
other intake dust sources in antitropally ventilated faces.
8060402000
20
40
60
80
100
SHEARER AT SUPPORT NUM B ER
Figure 3.10 Instantaneous respirable dus t concentration at crusher /stage loader during a cutting cycle in longwall face A.
(ii) Dust profiles around the shearer: Respirable dust concentration profiles around
the shearer, a major dust source, are given in Figures 3.11 and 3.12. These figures
show clearly the pattern in which the dust emanates from the shearer which is the
major dust source. A very high dust concentration zone was observed near the cutting

Chapter 3: Dust Distribution Page 85
drums but was beyond the surveyor’s reach. As the distance from the shearer
increased, the

Chapter 3: Dust Distribution Page 86
Figure 3.11 Instantaneous respirable dust concentration profile around shearer
during cutting cycle in longwall face A for experiment 1.
Figure 3.12 Instantaneous respirable dust concentration profile around shearer
during cutting cycle in longwall face A for experiment 2.

Chapter 3: Dust Distribution Page 87
airborne dust in the high concentration zone gradually dispersed into the whole
ventilation space. Analysis shows that the dust concentration decreased continuously
from the midpoint of the shearer to the downstream side and reached the lowest level
at 5 to 10 m downstream of the lead drum. After this point, the dust concentration
increased gradually until it reached its highest level, which was generally 3 to 4 times
higher than that around the leading drum operator.
Figures 3.11 and 3.12 show very high dust concentration levels at the rear/upwind
drum operator's position. To check these unusual high dust levels when cutting in the
direction of ventilation, a sampling survey with a moving instrument was conducted.
During this survey, the instrument was positioned at the upwind drum operator's
position throughout the cutting cycle. The results of this survey for one complete
cycle are given in Figure 3.13. The very high dust concentration levels obtained at
the shearer’s rear drum were due primarily to the effect of the 'boiling' over of dust
caused by misdirected water sprays at the rear of the shearer. Support movement
upwind of the rear operators was also found to be one of the contributing factors. As
indicated in Figure 3.13, the dust concentration levels around chocks 18 and 31 were
very high. An analysis of time data showed that, at these locations, the shearer was
cutting a small rock band which produced large amounts of dust.
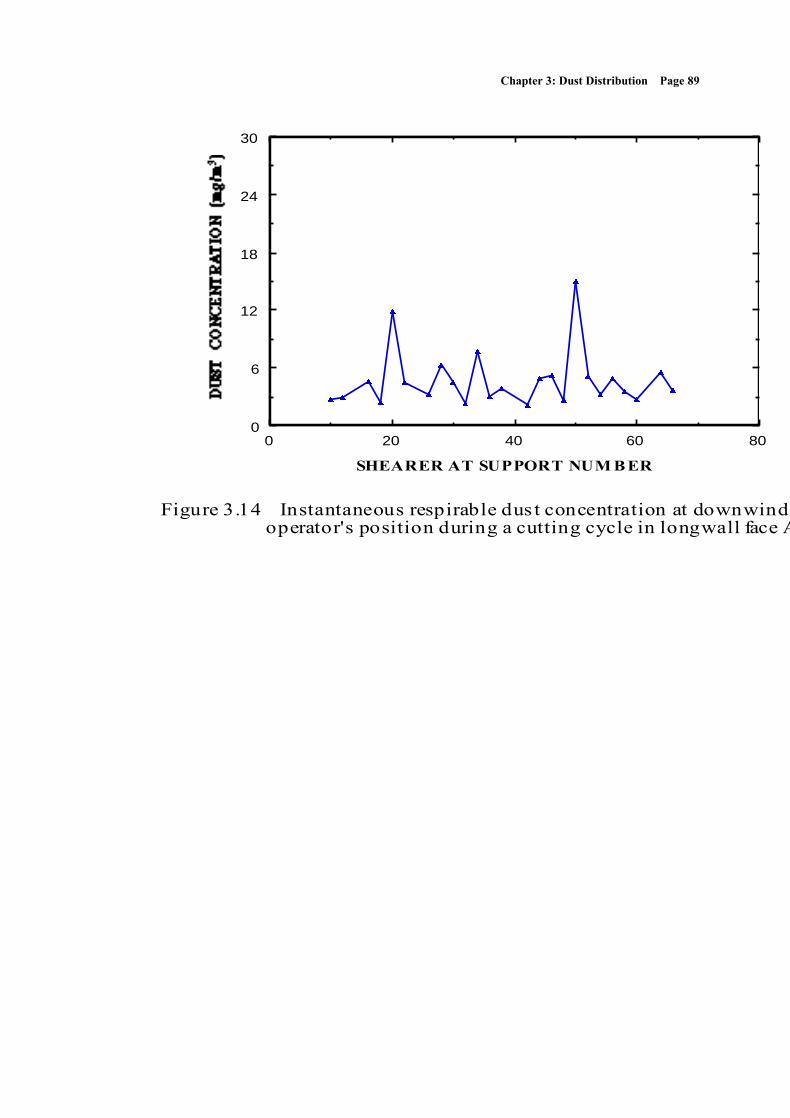
Figures 3.14 and 3.15 show the dust concentration at the lead/main drum operator's
position, and at a distance 5 m downwind of the shearer during the entire cutting
cycle. Most of the time the dust levels were within the statutory limit of 3 mg/m3.
These figures suggest that the best location for the downwind drum operator would be
4 m ahead of the shearer to reduce his dust exposure levels.

Chapter 3: Dust Distribution Page 88
8060402000
6
12
18
24
30
36
SHEARER AT SUPPORT NUM B ER
Figure 3.13 Instantaneous respirable dus t concentration at upwind cutting drum operator's position during a cutting cycle in longwall face A.
Chapter 3: Dust Distribution Page 89
8060402000
6
12
18
24
30
SHEARER AT SUPPORT NUM B ER
Figure 3.14 Instantaneous respirable dus t concentration at downwind drum operator's position during a cutting cycle in longwall face A.

Chapter 3: Dust Distribution Page 90
8060402000
6
12
18
SHEARER AT SUPPORT NUMB ER
Figure 3.15 Instantaneous respirable dust concentration at 5 m downstream of shearer during a cutting cycle in longwall face A.
(iii) Support generated dust profiles: Typical support generated dust concentration
profiles along the face at 1 m, 5 m and 10 m downwind of the support movement are
shown in Table 3.4 and Figure 3.16. The difference between the upwind and
downwind concentration levels during support movement gives the dust generated by
supports, which is shown as the shaded area in the plots. The dust generation varies
significantly along the face. For example, in figure 3.16(a), the dust concentration
downwind of the supports ranged between 38.5 and 7.5 mg/m3. The average upwind
dust concentration was 0.9 mg/m3 and the downwind dust concentration was 17.10
mg/m3, with the overall average support generated dust concentration being
16.20 mg/m3.
The dust level in walkway decreased as the distance to the moving supports
increased. The average dust concentration at 1 m downwind of the moving supports
was 17.1 mg/m3, at 5 m it was 8.8 mg/m3 and at 10 m downwind the dust level

Chapter 3: Dust Distribution Page 91
was only 3.7 mg/m3. This is because the primary ventilating airflow dilutes and
diffuses the

Chapter 3: Dust Distribution Page 92
Table 3.4. Dust generation during support movement
Support No. Dust level (mg/m3)
upwind downwind -at a
distance
of
1 m 5 m 10 m
10 0.80 10.50 7.10 3.50
12 0.65 16.8 6.50 4.30
14 0.72 28.2 6.80 2.90
16 1.10 8.50 11.30 3.80
18 1.20 15.30 14.40 5.70
20 0.69 25.40 10.50 5.20
22 0.82 16.90 12.90 2.90
24 0.83 28.50 6.50 4.30
26 0.92 20.10 7.20 3.20
28 0.85 14.30 8.50 3.10
30 1.05 9.50 10.80 2.60
32 1.18 7.20 15.20 2.80
34 0.72 16.10 12.60 4.20
36 0.88 13.50 8.20 6.30
38 0.67 12.20 11.60 3.80
40 1.19 18.50 8.60 2.50
42 0.92 11.50 4.50 3.70
44 0.99 26.50 13.10 4.00
46 1.05 22.00 7.80 4.60
48 1.21 38.50 4.30 3.20
50 1.10 30.20 8.20 6.50
52 0.97 10.50 6.30 2.80
54 0.81 7.90 7.50 2.40
56 0.75 12.50 8.00 3.10
58 0.80 18.40 11.00 2.80
60 0.86 19.20 7.10 3.50
62 0.70 7.30 5.20 2.20
64 0.50 10.30 6.30 3.43

Chapter 3: Dust Distribution Page 93
7060504030201000
6
12
18
24
30
36
upwind dust le vel
dust from support movem ent
SUPPORT NUM B ER
Figure 3.16(a) Ins tantaneous respirable dust concentration at 1 m downwind of support movement in longwall face A.
av. conc. - 1 m downwind av. conc. - upwind

Chapter 3: Dust Distribution Page 94
7060504030201000
6
12
18
24
30
36
upwind dust concentra tiondust from support movem ent
SUPPORT NUM B ER
Figure 3.16(b) Instantaneous respirable dust concentration at 5 m downwind of support movement in longwall face A.
av. conc. - 5 m downwind

Chapter 3: Dust Distribution Page 95
7060504030201000
6
12
18
24
30
36
upwind dust concentra tion
dust from support movem ent
SUPPORT NUM B ER
Figure 3.16(c) Ins tantaneous respirable dust concentration at 10 m downwind of support movement in longwall face A.
av. conc. - 10 m downwind
dust generated by supports towards the face side. It can be inferred from these results
that the contribution of support generated dust to the shearer operator's dust exposure
varied depending on the distance between the shearer and support movement.
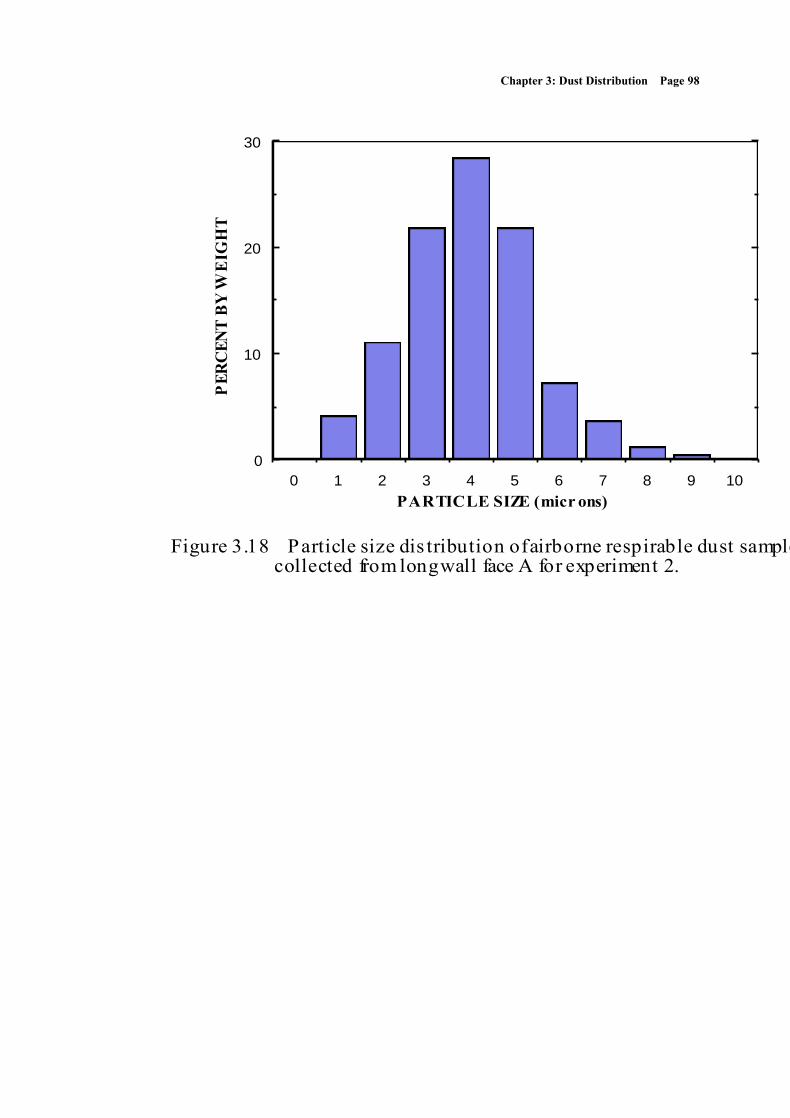
3.4.3 Respirable dust size distribution
The size distribution of respirable dust samples from longwall face 'A' was measured
using a laser particle analyser. The results are shown in Figures 3.17 and 3.18 as
histograms of weight percentage frequency against particle size. In these graphs the
total percentage represents 100% and integration of the data results in the cumulative
percentage curves. A plot of the cumulative percent of undersize by weight versus
particle diameter in microns produced a typical S-type curve as shown in Figure 3.19.
The median is readily observed from figure 3.19 as occuring at approximately 3.8
microns diameter. The size data for experiment 1, plotted on a log-normal scale, is

Chapter 3: Dust Distribution Page 96
shown in Figure 3.20. The size distribution of respirable dust found in this study are
in general agreement with other studies (Ramani, Qin and Jankowski, 1992).

Chapter 3: Dust Distribution Page 97
0 1 2 3 4 5 6 7 8 9 10
0
10
20
30
PARTICLE SIZE (micr ons)
PE
RC
EN
T B
Y W
EIG
HT
Figure 3.17 Particle size dis tribution of airborne respirable dust samples collected from longwall face A for experiment 1.
Chapter 3: Dust Distribution Page 98
0 1 2 3 4 5 6 7 8 9 10
0
10
20
30
PARTICLE SIZE (micr ons)
PE
RC
EN
T B
Y W
EIG
HT
Figure 3.18 Particle size dis tribution of airborne respirable dust samples collected from longwall face A for experiment 2.

Chapter 3: Dust Distribution Page 99
1210864200
20
40
60
80
100
PARTICLE SIZE (micr ons)
CU
MU
LA
TIV
E %
BY
WE
IGH
T F
INE
R
Figure 3.19 Typical cumulative particle size dist ribution of respirable dust samples collected from longwall face A.

Chapter 3: Dust Distribution Page 100
99.9
99
9590
70
30
10
5
1
0.1
50
0.1 0.5 1 2 5 10 200.2
PARTICLE SIZE (mic rons)
CU
MU
LA
TIV
E %
B
Y
WE
IGH
T F
INE
R
(Pro
ba
bilit
y S
cale
)
Figure 3.20 Typical cumulative particle size dis tribution of respirable dust samples collected from longwall face A on log-probability scale.
Chapter 3: Dust Distribution Page 101
3.5 RESULTS OF INVESTIGATIONS IN LONGWALL FACE 'B'
Longwall face B was operating in the Bulli seam in the Southern district of NSW,
Australia. The working height was between 2.2 and 2.7 m, the longwall face length
200 m and the length of the panel 1900 m. Anderson AM-500 double ended ranging
drum shearer and Gullick 4 x 1000 tonnes four legged chock shields were used in this
face. The diameter and width of the cutting drums were 1.8 m and 0.8 m
respectively. The average tram speed of the shearer while cutting was approximately
7 m/min.
The cutting sequence was uni-directional with cutting from tailgate to maingate
against the direction of ventilation. The roof supports were advanced on the return
side of the shearer immediately after cutting. The ventilation system was antitropal
and the face air velocity varied between 3.5 and 4.3 m/s. The daily production from
the face was about 6 800 tonnes and the annual production was approximately 1.9
million tonnes.
3.5.1 Instantaneous dust concentration profiles
(i) Dust profiles near the return end of the face: The instantaneous sampling survey
results of the experiments in longwall face B for one complete cutting cycle are
shown in Figures 3.21 - 3.23. The activities of the shearer are indicated on the X axis.
In figure 3.23 dust concentration profiles at two cutting speeds are presented. The
average dust concentration was 9.7 mg/m3 at 14 m/min cutting speed and 4.3 mg/m3
at 7 m/min cutting speed. Results show that at high cutting speed dust levels are 2 to
2.5 times higher during both the cutting and cleaning phases of the cut cycle.

Chapter 3: Dust Distribution Page 102
504030201000
6
12
18
TIME (min.)
cuttin g cleaning
Figure 3.21 Instantaneous respirable dust concentration at return end sampling s tation during a cutting cycle in longwall face B for experiment 1.

Chapter 3: Dust Distribution Page 103
504030201000
6
12
18
TIME (min.)
cuttin g cleaning
Figure 3.22 Instantaneous respirable dust concentration at return end sampling s tation during a cutting cycle in longwall face B for experiment 2.

Chapter 3: Dust Distribution Page 104
504030201000
6
12
18
24
slow spee d cutting, 7 m /m inhigh speed c utting, 14 m /m in
TIME FOR ONE CUTTING CYCLE (min.)
Figure 3.23 Instantaneous respirable dust concentration at return end sampling s tation during a cutting cycle in longwall face B with two cutting speeds.
(ii) Dust profiles at other sampling stations along the face: Dust concentration data
at different locations along the face are shown in Figure 3.24. The dust peaks
sampled near the maingate have short widths because these stations were upwind of
the shearer most of the time. Towards the return end sampling station, however, the
peaks of dust levels become wider. The average dust concentration levels at the 30th,
60th, 90th and 120th chock positions were 1.8, 3.2, 4.2 and 5.6 mg/m3 respectively.

Chapter 3: Dust Distribution Page 105
40302010000
2
4
6
8
10
12
TIME (min.)
Figure 3.24(a) Ins tantaneous respirable dust concentration at 30th chock sampling s tation during a cut cycle in longwall face B (when cutting against ventilation).
cleaning sump cuttin g
average dust concentra tion

Chapter 3: Dust Distribution Page 106
40302010000
2
4
6
8
10
12
TIME (min.)
Figure 3.24(b) Instantaneous respirable dus t concentration at 60th chock sampling station during a cut cycle in longwall face B (when cutting agains t ventilation).
cleaning sump cuttin g
average dust concentra tion

Chapter 3: Dust Distribution Page 107
40302010000
2
4
6
8
10
12
TIME (min.)
Figure 3.24(c) Ins tantaneous respirable dust concentration at 90th chock samplingstation during a cut cycle in longwall face B (when cutting agains t ventilation).
cleaning sump cuttin g
average dust concentra tion
40302010000
2
4
6
8
10
12
TIME (min.)
Figure 3.24(d) Instantaneous respirable dust concentration at 120th chock sampling station during a cut cycle in longwall face B (when cutting against ventilation).
cleaning sump cuttin g
average dust concentra tion

Chapter 3: Dust Distribution Page 108
(iii) Dust profiles around the shearer: Typical respirable dust concentration profiles
around the shearer are given in Figures 3.25 and 3.26. It can be seen that the pattern
of dust profiles differ from those of in longwall face A, particularly in the vicinity of
the shearer. Dust produced by the upstream lead drum quickly dispersed into the
walkway over the shearer. The dust levels around the shearer increased rapidly from
about 1.0 m on the return side of the shearer upstream/lead drum exposing both the
operators to high dust concentration. This can be attributed to the cutting sequence
which, in this case, was against the ventilation.
Figure 3.25 Instantaneous respirable dust concentration profile around shearer
during cutting cycle in longwall face B for experiment 1.

Chapter 3: Dust Distribution Page 109
Figure 3.26 Instantaneous respirable dust concentration profile around shearer
during cutting cycle in longwall face B for experiment 2.
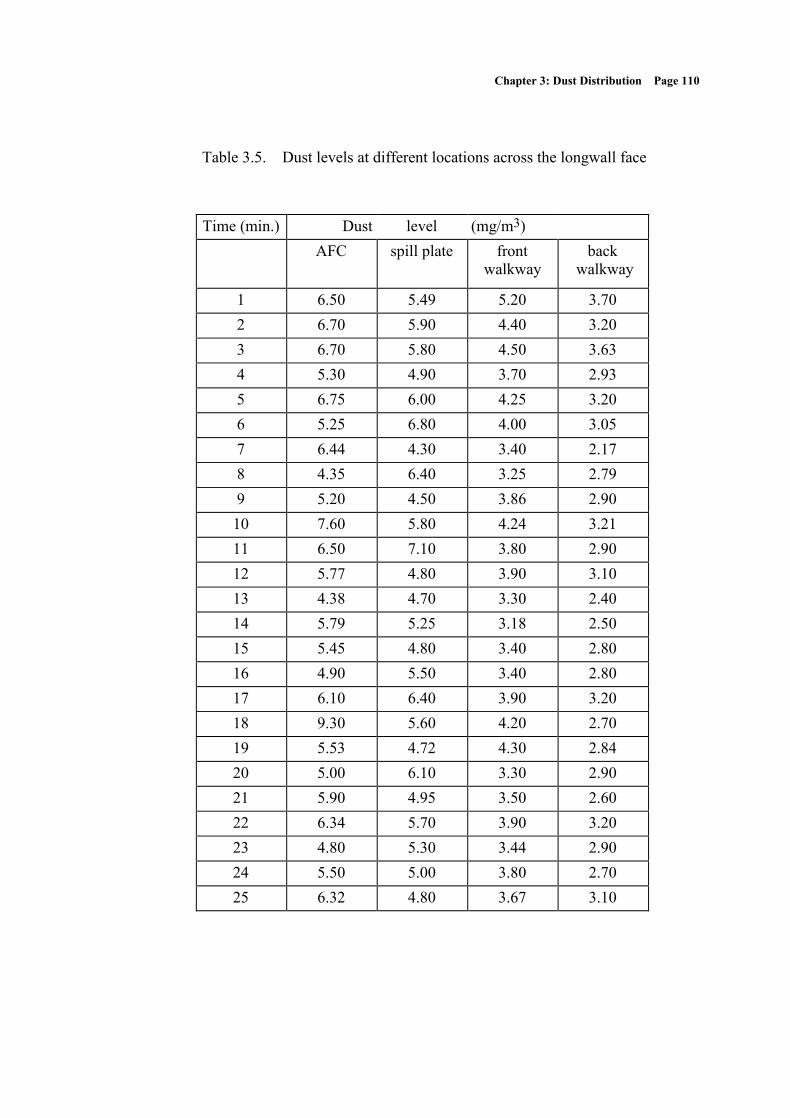
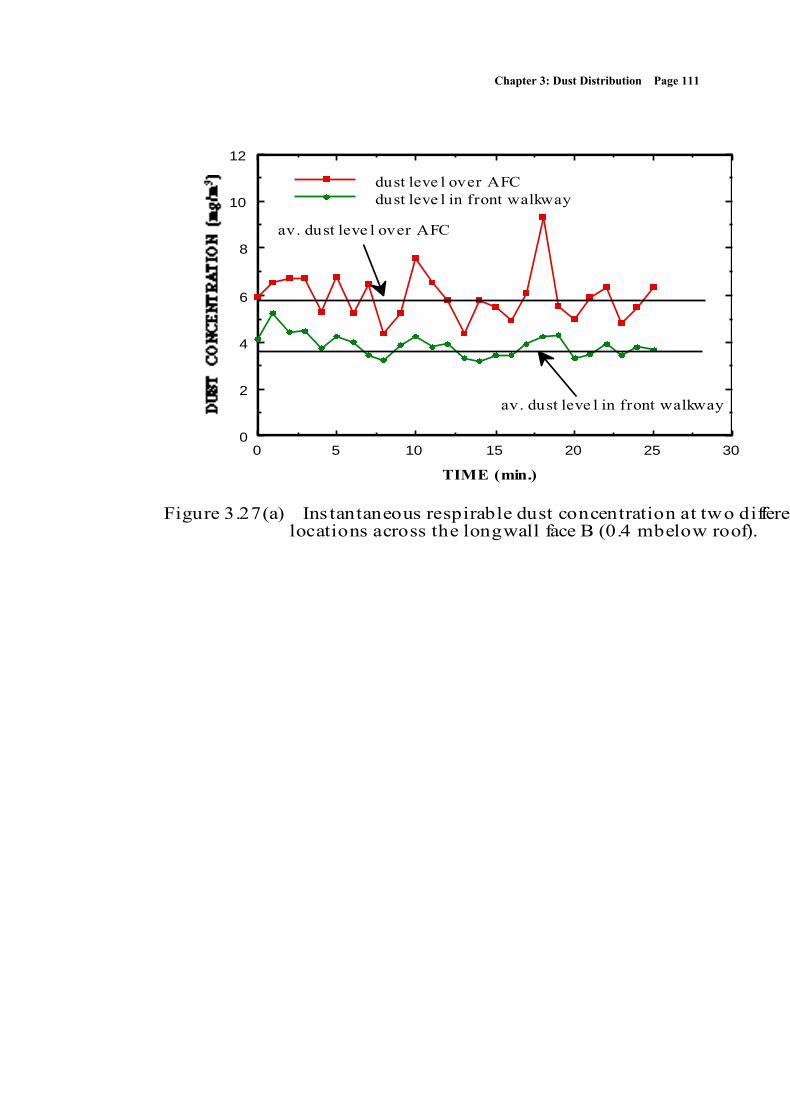
(iv) Dust profiles across the section of the face: Table 3.5 and Figure 3.27 shows a
comparison of instantaneous dust concentration profiles at four different locations
across the section of the face. The average concentrations were 5.9 mg/m3 over the
panline, 3.7 mg/m3 in the front walkway, 5.4 mg/m3 over the spill plate and 2.8
mg/m3 in the back walkway. Perhaps the most surprising aspect is that these
differences exist even after 50 m downwind of the shearer. A typical average dust
concentration gradient across the section of the longwall face at the miner's breathing
height (0.4 m below roof) is given in Figure 3.28. These figures demonstrate that
large dust gradients exist, not only around the shearer, but also across the section of
the longwall face. The dust profiles show that correct siting of sampling stations is
crucial to the successful evaluation of dust control techniques.
Chapter 3: Dust Distribution Page 110
Table 3.5. Dust levels at different locations across the longwall face
Time (min.) Dust level (mg/m3)
AFC spill plate front
walkway
back
walkway
1 6.50 5.49 5.20 3.70
2 6.70 5.90 4.40 3.20
3 6.70 5.80 4.50 3.63
4 5.30 4.90 3.70 2.93
5 6.75 6.00 4.25 3.20
6 5.25 6.80 4.00 3.05
7 6.44 4.30 3.40 2.17
8 4.35 6.40 3.25 2.79
9 5.20 4.50 3.86 2.90
10 7.60 5.80 4.24 3.21
11 6.50 7.10 3.80 2.90
12 5.77 4.80 3.90 3.10
13 4.38 4.70 3.30 2.40
14 5.79 5.25 3.18 2.50
15 5.45 4.80 3.40 2.80
16 4.90 5.50 3.40 2.80
17 6.10 6.40 3.90 3.20
18 9.30 5.60 4.20 2.70
19 5.53 4.72 4.30 2.84
20 5.00 6.10 3.30 2.90
21 5.90 4.95 3.50 2.60
22 6.34 5.70 3.90 3.20
23 4.80 5.30 3.44 2.90
24 5.50 5.00 3.80 2.70
25 6.32 4.80 3.67 3.10
Chapter 3: Dust Distribution Page 111
3025201510500
2
4
6
8
10
12
dust leve l over AFC
dust leve l in front walkway
TIME (min.)
Figure 3.27(a) Ins tantaneous respirable dust concentration at two different locations across the longwall face B (0.4 m below roof).
av. dust leve l over AFC
av. dust leve l in front walkway

Chapter 3: Dust Distribution Page 112
3025201510500
2
4
6
8
10
12
dust leve l in bac k wa lkwa y
dust leve l over spill plate
TIME (min.)
Figure 3.27(b) Instantaneous respirable dus t concentration at two different locations across the longwall face B (0.4 m below roof).
av. dust leve l over spill plate
av. dust leve l in bac k wa lkwa y

Chapter 3: Dust Distribution Page 113
5432100
2
4
6
8
DISTANCE ACROSS THE FACE (m)
Figure 3.28 Typical respirable dus t concentration profile across the longwall face B at miner's breathing height (0.4 m below the roof).
face
sid
e
spil
l pl
ate
fron
t le
gs
goaf
sid
e
3.5.2 Respirable dust size distribution
The particle size distribution of respirable dust samples from longwall face B is
shown in Figures 3.29 - 3.30. A comparison of particle size distribution between dust
samples from faces B and A is shown in Tables 3.6 - 3.7. It can be seen that the size
distribution of dust from face B is quite different from that of face A. There are more
fines in the dust sample from face B than that of face A. The cutting sequence, which
is against the ventilation in this face, is one of the contributing factors to the high
percentage of fines in the respirable dust. The median dust particle diameter of the
respirable dust was approximately 3.45 microns. Figure 3.31 is a plot of the particle
size against the cumulative weight percentage of particles smaller than that size on a
log-normal scale.

Chapter 3: Dust Distribution Page 114
0 1 2 3 4 5 6 7 8 9 10
0
10
20
30
PARTICLE SIZE (micr ons)
PE
RC
EN
T B
Y W
EIG
HT
Figure 3.29 Particle size distribution of airborne respirable dust samples collected from longwall face B for experiment 1.

Chapter 3: Dust Distribution Page 115
0 1 2 3 4 5 6 7 8 9 10
0
10
20
30
PARTICLE SIZE (micr ons)
PE
RC
EN
T B
Y W
EIG
HT
Figure 3.30 Particle size distribution of airborne respirable dust samples collected from longwall face B for experiment 2.

Chapter 3: Dust Distribution Page 116
Table 3.6. Respirable dust size distribution
particle size
(microns) Face B Face A
Exp. 1 Exp. 2 Exp. 1 Exp. 2
1 6.70 5.40 4.50 4.20
2 15.30 16.30 12.30 11.00
3 29.80 29.40 22.10 21.80
4 24.50 23.90 27.80 28.50
5 14.90 16.10 19.20 21.80
6 5.80 6.20 8.50 7.30
7 2.00 2.10 3.30 3.70
8 0.80 0.60 1.40 1.20
9 0.00 0.00 0.60 0.50
10 0.00 0.00 0.00 0.00
Table 3.7. Respirable dust particle cumulative size distribution
particle size
(microns) Face B Face A
Exp. 1 Exp. 2 Exp. 1 Exp. 2
1.22 3.00 2.50 2.80 2.30
1.88 8.80 8.20 8.30 7.50
2.18 11.96 10.97 11.90 10.70
2.71 25.30 24.51 19.40 17.50
3.13 39.80 38.45 30.40 28.60
3.62 55.50 54.50 42.60 40.80
4.19 69.90 67.85 59.90 57.50
4.84 80.30 78.50 70.80 69.90
5.21 84.60 84.50 78.50 80.70
6.02 93.67 94.10 89.30 90.20
6.97 98.90 98.90 96.70 96.50
7.49 99.20 99.40 98.00 98.30
8.05 99.60 99.70 99.10 99.30
10.00 100 100 100 100

Chapter 3: Dust Distribution Page 117
99.9
99
9590
70
30
10
5
1
0.1
50
0.1 0.5 1 2 5 10 200.2
Figure 3.31 Typical cumulative particle size distribution of respirable dus t samples collected from longwall face B on log-probability scale.
PARTICLE SIZE (mic rons)
CU
MU
LA
TIV
E %
B
Y
WE
IGH
T F
INE
R
(Pro
ba
bilit
y S
cale
)
3.6 RESULTS OF INVESTIGATIONS IN LONGWALL FACE 'C'
Longwall face C was operating in the Bulli seam in the Southern district of NSW,
Australia. The working height was between 2.1 and 2.5 m, the longwall face length
150 m and the length of the panel 1300 m. Anderson AM 500 double ended ranging
drum shearer and 4 x 600 tonnes Meco four legged chocks were used in this face.
The diameter and width of the cutting drums were 1.6 m and 0.9 m respectively. The
average tram speed of the shearer, while cutting, was approximately 6.5 m/min. The
cutting sequence was uni-directional with cutting from tailgate to maingate in the
direction of ventilation. The roof supports were advanced on the intake side of the
shearer immediately after cutting. A homotropal ventilation system was used and the
face air velocity varied between 1.9 and 2.1 m/s. The daily production from the face
was about 4,500 tonnes and the annual production was approximately 1.6 million
tonnes.

Chapter 3: Dust Distribution Page 118
3.6.1 Instantaneous dust concentration profiles
(i) Dust profiles near the return end of the face: Instantaneous dust concentration
profiles at the return end sampling station at the face over one complete cutting cycle
are shown in Figures 3.32 and 3.33. The results show that the rate of dust generation
by the shearer was variable, reflected in the varying heights of the peaks. A large
number of smaller peaks represents secondary dust sources such as support advance,
face spalling, rock cutting and roof collapse in the goaf. More specifically, in figure
3.32 there is a peak at the 23rd minute, which a time study attributes to the shearer
cutting a fallen rock boulder and generating large amounts of dust. This figure also
reinforces the fact that dust generated during the sumping phase contributes
significantly to the miners' dust exposure.
504030201000
10
20
30
40
TIME (min.)
cutting
Figure 3.32 Instantaneous respirable dust concentration at return end sampling s tation during a cutting cycle in longwall face C for experiment 1.
sumpingcleaning

Chapter 3: Dust Distribution Page 119
504030201000
10
20
30
40
TIME (min.)
cutting
Figure 3.33 Instantaneous respirable dus t concentration at return end sampling s tation during a cutting cycle in longwall face C for experiment 2.
sumpingcleaning
(ii) Dust profiles at other sampling stations along the face: Dust concentration data
at different sampled locations along the face are shown in Figure 3.34. The dust
peaks near the maingate are narrow, indicating that they are of short duration, because
the sampling stations were upwind of the shearer most of the time. Towards the
tailgate, however, the peaks become progressively wider. In the last sampling station,
which is near the tailgate and is downwind of the shearer for most of the time, the
observed dust peaks are the widest, indicating longer dust exposure.

Chapter 3: Dust Distribution Page 120
40302010000
3
6
9
12
15
18
TIME (min.)
Figure 3.34(a) Ins tantaneous respirable dust concentration at 25th chock sampling station during a cut cycle in longwall face C (when cutting with ventilation).
cleaningsump cuttin g
average dust concentra tion

Chapter 3: Dust Distribution Page 121
40302010000
3
6
9
12
15
18
TIME (min.)
Figure 3.34(b) Instantaneous respirable dust concentration at 50th chock sampling station during a cut cycle in longwall face C (when cutting with ventilation).
cleaningsump cuttin g
average dust concentra tion

Chapter 3: Dust Distribution Page 122
40302010000
3
6
9
12
15
18
TIME (min.)
Figure 3.34(c) Ins tantaneous respirable dust concentration at 75th chock sampling station during a cut cycle in longwall face C (when cutting with ventilation).
cleaningsump cuttin g
average dust concentra tion

Chapter 3: Dust Distribution Page 123
40302010000
3
6
9
12
15
18
TIME (min.)
Figure 3.34(d) Instantaneous respirable dust concentration at 100th chock sampling station during a cut cycle in longwall face C (when cutting with ventilation).
cleaningsump cuttin g
average dust concentra tion

Chapter 3: Dust Distribution Page 124
(iii) Dust profiles around the shearer: Respirable dust concentration profiles around
the shearer are given in Figures 3.35 and 3.36. Analysis of the figures show that they
differ from those of in longwall faces A and B, especially in the vicinity of the
shearer. The dust concentration level was lowest between 5 and 8 m downwind of
the shearer's lead drum position and increased from there onwards towards the return
end of the face. However, the dust concentration around the trailing upwind drum
operator's position was higher than expected. This can be attributed to poor
installation of water sprays on the shearer and the upwind support movement.
Figure 3.35 Instantaneous respirable dust concentration profile around shearer
during cutting cycle in longwall face C for experiment 1.

Chapter 3: Dust Distribution Page 125
Figure 3.36 Instantaneous respirable dust concentration profile around shearer
during cutting cycle in longwall face C for experiment 2.
(iv) Support generated dust profiles: Dust generated by support movement along the
face is profiled in Figure 3.37. The average dust concentration at 1 m downwind of
the moving supports was 7.6 mg/m3 and at 5 m it was 3.5 mg/m3. These figures
show that although support generated dust was less as a component of overall shearer
operator's dust exposure than in face A, it still represented a significant proportion of
total dust exposure.

Chapter 3: Dust Distribution Page 126
80604020000
6
12
18upwind dust concentra tiondust from support movem ent
SUPPORT NUM B ER
Figure 3.37(a) Ins tantaneous respirable dust concentration at 1 m downwind of support movement in longwall face C.
av. conc. - 1 m downwind

Chapter 3: Dust Distribution Page 127
80604020000
6
12
18
upwind dust concentra tiondust from support movem ent
SUPPORT NUM B ER
Figure 3.37(b) Instantaneous respirable dus t concentration at 5 m downwind of support movement in longwall face C.
av. conc. - 5 m downwind

Chapter 3: Dust Distribution Page 128
(v) Dust profiles across the section of the face: Two typical instantaneous dust
concentration profiles at two different locations across the face are shown in Figure
3.38(a). The average concentration, over approximately 15 min, were 10.5 mg/m3
over the panline and 6.1 mg/m3 in the walkway. Overall, the two profiles appear to
be different; for example, at the 8th minute on the x-axis, when the panline
concentrations were 24.4 mg/m3, no measurement exceeded 8 mg/m3 in the walkway.
Dust profiles at different locations across the section of the face, given in Figure
3.38(b), show that the average dust level over the spill plate was 9.3 mg/m3 and 4.3
mg/m3 in the back walkway. Figure 3.39 shows the average dust gradient, across the
section of the face, at a height of 1.5 m and demonstrates that there are high dust
gradients across the section of the longwall face.
3025201510500
4
8
12
16
20
24
dust leve l over AFC
dust leve l in front walkway
TIME (min.)
Figure 3.38(a) Ins tantaneous respirable dust concentration at two different locations across the longwall face C (0.4 m below roof).
av. dust leve l over AFC
av. dust leve l in front walkway

Chapter 3: Dust Distribution Page 129
3025201510500
4
8
12
16
20
24
dust leve l in bac k wa lkwa ydust leve l over spill plate
TIME (min.)
Figure 3.38(b) Instantaneous respirable dus t concentration at two different locations across the longwall face C (0.4 m below roof).
av. dust leve l over spill plate
av. dust leve l in bac k wa lkwa y

Chapter 3: Dust Distribution Page 130
5432100
3
6
9
12
DISTANCE ACROSS THE FACE (m)
Figure 3.39 Typical respirable concentration profile across the longwall face C at miner's breathing height (0.4 m below the roof).
face
sid
e
spil
l pl
ate
fron
t le
gs
goaf
sid
e

Chapter 3: Dust Distribution Page 131
3.6.2 Air velocity patterns
Air velocities measured with an anemometer along the face are presented in Figure
3.40. The decreased air velocity at the second station is the result of air from the
tailgate entry being pushed into the back of the supports and settling down after some
distance. Overall, there was not much variation along the face. There was no bleeder
entry in this face, and therefore air leakage into the goaf was negligible. It is the air
leakage component which made these air velocity profiles different from those of the
Qin (1992) for U.S. longwall faces using a bleeder entry ventilation system. Air
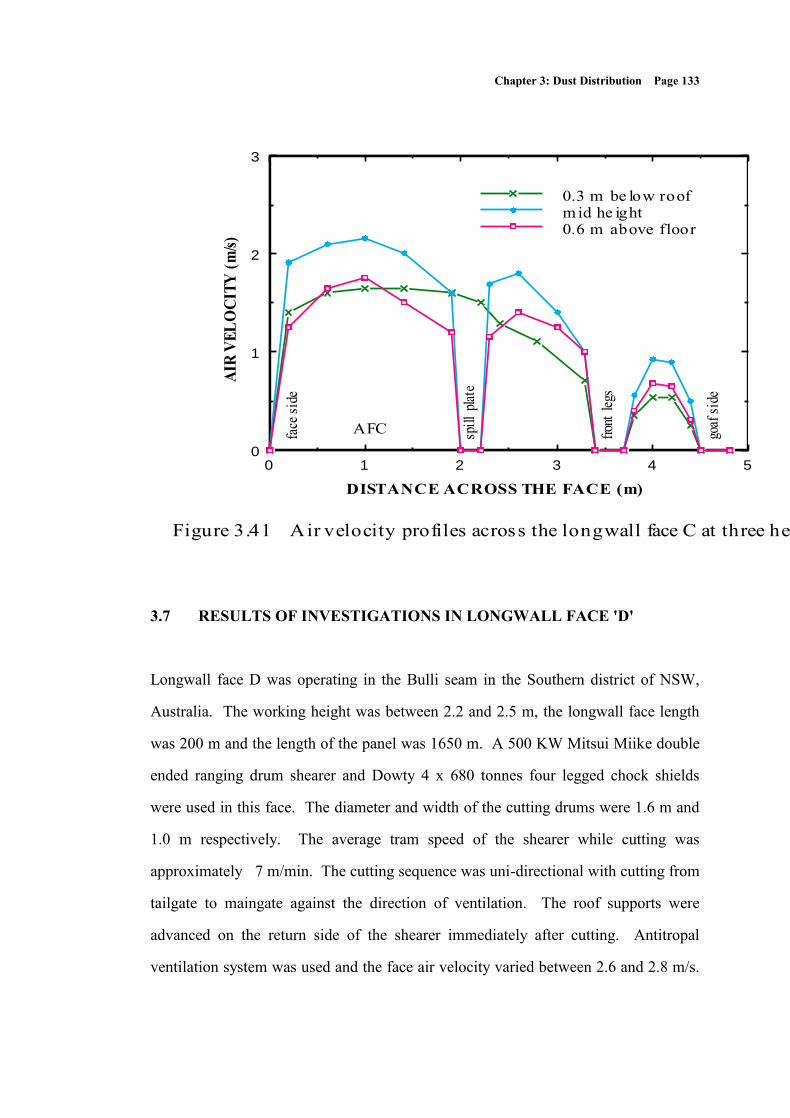
velocity measurements across the face, at different heights, are shown in Figure 3.41,
which shows that air velocity was not uniform across the face. It was highest over the
AFC area and lowest in the walkway, where it is half of that in the AFC area. This
variation must be taken into account during the development of a dust control
technique, as it affects the respirable dust behaviour and dispersion.

Chapter 3: Dust Distribution Page 132
1008060402001.0
1.4
1.8
2.2
2.6
SUPPORT NUM B ER
AIR
VE
LO
CIT
Y (
m/s
)
Figure 3.40 Air velocity over AFC along the longwall face C.
Chapter 3: Dust Distribution Page 133
5432100
1
2
3
0.3 m be low roofmid he ight0.6 m above floor
DISTANCE ACROSS THE FACE (m)
AIR
VE
LO
CIT
Y (
m/s
)
Figure 3.41 Air velocity profiles across the longwall face C at three heights .
face
sid
e
spil
l pl
ate
fron
t le
gs
goaf
sid
e
AFC
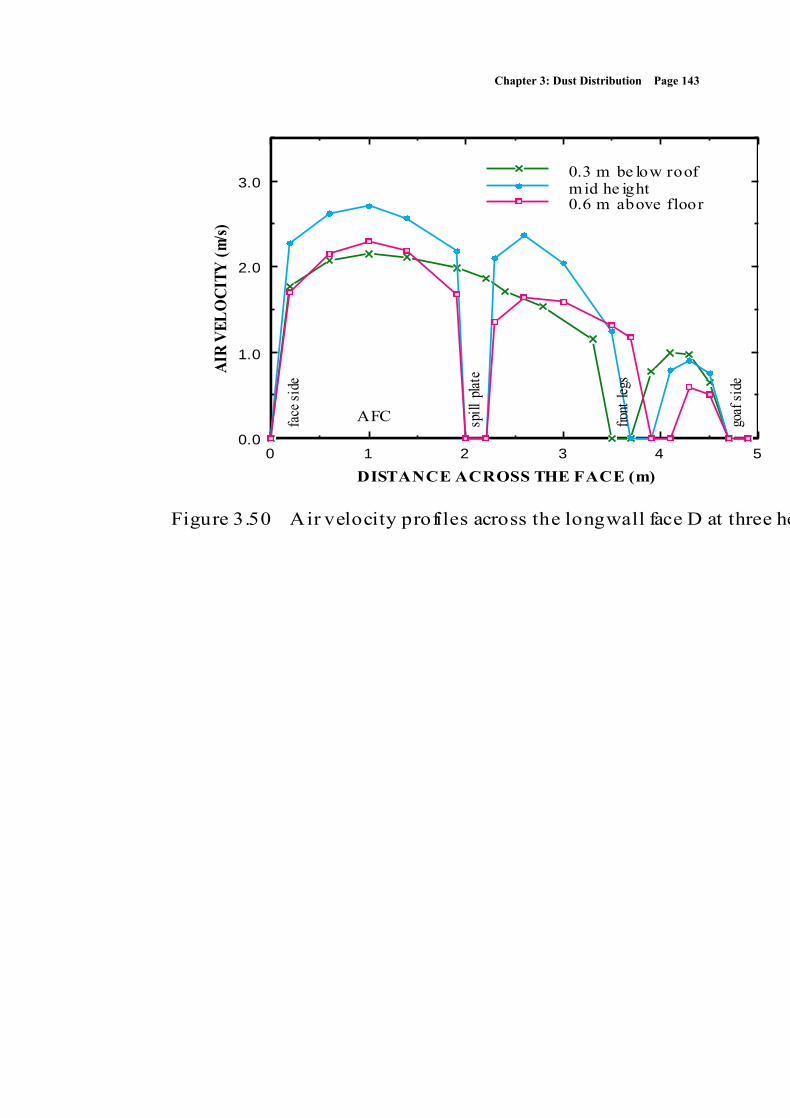
3.7 RESULTS OF INVESTIGATIONS IN LONGWALL FACE 'D'
Longwall face D was operating in the Bulli seam in the Southern district of NSW,
Australia. The working height was between 2.2 and 2.5 m, the longwall face length
was 200 m and the length of the panel was 1650 m. A 500 KW Mitsui Miike double
ended ranging drum shearer and Dowty 4 x 680 tonnes four legged chock shields
were used in this face. The diameter and width of the cutting drums were 1.6 m and
1.0 m respectively. The average tram speed of the shearer while cutting was
approximately 7 m/min. The cutting sequence was uni-directional with cutting from
tailgate to maingate against the direction of ventilation. The roof supports were
advanced on the return side of the shearer immediately after cutting. Antitropal
ventilation system was used and the face air velocity varied between 2.6 and 2.8 m/s.

Chapter 3: Dust Distribution Page 134
The daily production from the face was about 7200 tonnes and the annual production
was approximately 2.1 million tonnes.

Chapter 3: Dust Distribution Page 135
3.7.1 Instantaneous dust concentration profiles
(i) Dust profiles near the return end of the face: The results of the instantaneous
sampling surveys for one complete cutting cycle are shown in Figures 3.42 and 3.43.
The shearer activities are indicated on the X axis. Each point shown is the average of
four readings. These figures show the dust exposure during each phase of the mining
cycle and indicate that the dust level during the cutting phase was always above the
statutory limit of 3 mg/m3. It is also evident that the return end operators were only
exposed to dust during the cutting and cleaning phases of the cycle. Dust produced
during the sumping phase went directly into the return airway because the ventilation
system is antitropal and cutting was against the airflow.
4030201000
6
12
18
TIME (min.)
cuttin g cleaning
Figure 3.42 Instantaneous respirable dus t concentration at return end sampling s tation during a cutting cycle in longwall face D for experiment 1.

Chapter 3: Dust Distribution Page 136
4030201000
6
12
18
24
30
TIME (min.)
cuttin g cleaning
Figure 3.43 Instantaneous respirable dust concentration at return end sampling s tation during a cutting cycle in longwall face D for experiment 2.
(ii) Dust profiles around the shearer: Respirable dust concentration profiles around
the shearer are given in Figures 3.44 to 3.45. It can be seen that in face 'D', where
cutting was against the ventilation, dust produced by the upstream lead drum quickly
dispersed into the walkway over the shearer, thereby exposing both operators to high
dust concentration levels. The pattern of these dust profiles is different from those of
in longwall faces A and C.

Chapter 3: Dust Distribution Page 137
Figure 3.44 Instantaneous respirable dust concentration profile around shearer
during cutting cycle in longwall face D for experiment 1.
Figure 3.45 Instantaneous respirable dust concentration profile around shearer
during cutting cycle in longwall face D for experiment 2.

Chapter 3: Dust Distribution Page 138
3.7.2 Respirable dust size distribution
The size distribution of respirable dust samples in longwall face 'D' is shown in
Figures 3.46 and 3.47. It can be seen that the size distribution of respirable dust from
face D was similar to that in face B. The median diameters for experiments 1 & 2 in
face D are 3.6 and 3.45 respectively. Figure 3.48 is a plot of the log of the particle
size against the cumulative weight /mass percent of particles smaller than that size.
3.7.3 Air velocity patterns
Air velocities along the face, measured with an anemometer, are presented in Figure
3.49. Although in this face the air velocity was slightly high, the general pattern of
air velocity along the face was the same as that in face 'C'. Analysis of results shows
that air velocity did not vary much along the face and indicates that there was
negligible air leakage into the goaf. Air velocity measurements across the face, at
different heights, are shown in Figure 3.50. These results also confirm the fact that
the velocity was not uniform across the section of the face.

Chapter 3: Dust Distribution Page 139
0 1 2 3 4 5 6 7 8 9 10
0
10
20
30
PARTICLE SIZE (micr ons)
PE
RC
EN
T B
Y W
EIG
HT
Figure 3.46 Particle size dis tribution of airborne respirable dust samples collected from longwall face D for experiment 1.

Chapter 3: Dust Distribution Page 140
0 1 2 3 4 5 6 7 8 9 10
0
10
20
30
PARTICLE SIZE (micr ons)
PE
RC
EN
T B
Y W
EIG
HT
Figure 3.47 Particle size distribution of airborne respirable dust samples collected from longwall face D for experiment 2.

Chapter 3: Dust Distribution Page 141
99.9
99
9590
70
30
10
5
1
0.1
50
0.1 0.5 1 2 5 10 200.2
Figure 3.48 Typical cumulative particle size distribution of respirable dus t samples collected from longwall face D on log-probability scale.
PARTICLE SIZE (mic rons)
CU
MU
LA
TIV
E %
B
Y
WE
IGH
T F
INE
R
(Pro
ba
bilit
y S
cale
)

Chapter 3: Dust Distribution Page 142
1201008060402001.6
2.0
2.4
2.8
3.2
SUPPORT NUM B ER
AIR
VE
LO
CIT
Y (
m/s
)
Figure 3.49 Air velocity over AFC along the longwall face D.
Chapter 3: Dust Distribution Page 143
5432100.0
1.0
2.0
3.00.3 m be low roofmid he ight0.6 m above floor
DISTANCE ACROSS THE FACE (m)
AIR
VE
LO
CIT
Y (
m/s
)
Figure 3.50 Air velocity profiles across the longwall face D at three heights.
face
sid
e
spil
l pl
ate
fron
t le
gs
goaf
sid
e
AFC

Chapter 3: Dust Distribution Page 144
3.8 COMPARISON AND SUMMARY
High respirable airborne dust levels at the working face is a difficult problem
associated with longwall mining. There is only very limited fundamental data
available to characterise the respirable dust behaviour at longwall faces. To augment
this data, and to obtain data from Australian longwall faces in this research, field
experiments were performed in four longwall faces in the Southern district of New
South Wales. The shift average gravimetric dust data shows that respirable dust
concentration increased with distance to the return end of the longwall face.
However, the large variations in the dust gradients, measured over a period of 14
consecutive shifts in the same longwall face, indicates that the relationship between
the dust level and the distance from the intake end was complex and not easily
generalised owing to the large number of factors involved. In addition, as the average
dust concentration levels could not be correlated with face activities, it was decided to
conduct instantaneous dust sampling surveys in subsequent experiments to give a
clearer picture of respirable dust conditions at the face.
The instantaneous dust concentration profiles show that the dust distribution patterns
were different during different cutting operations in a cycle e.g. the cutting, cleaning
and sumping. Badly positioned water sprays on the shearer were found to increase
dust concentration at the rear drum operator's position. A comparison of dust data
showed that respirable dust concentration levels and patterns were variable from one
face to another. For example in face 'A', the dust level was around 11 mg/m3 and in
longwall face 'B' it was around 5 mg/m3. Studies in face 'B' confirmed that higher
cutting speed resulted in higher dust levels all along the longwall face. Respirable
dust profiles around the shearer showed that cutting against the ventilation system
dispersed more dust into the shearer operator's position than when cutting with
ventilation.

Chapter 3: Dust Distribution Page 145
However, when cutting at the maingate with the ventilation during which the drum
makes a number of partial sumping cuts, produced a significant proportion of the total
respirable dust.
It should be noted that the instantaneous dust concentration plots did not indicate the
average shift dust concentration as they were set up to operate only during the cutting
process. Therefore the high, but short, peaks of concentration should not be
interpreted as the worst dust conditions, but their duration should be included in the
interpretation of results. An increase in the width, hence duration, of the peaks
signifies an increase in average dust concentration. Studies in faces 'A' and 'C'
showed support movement significantly contributed to miners' dust exposure at the
longwall faces.
Air velocity and quantity data showed that there was no significant air leakage into
the goaf. A comparison of air velocity, quantity and respirable dust levels in the faces
showed that low air velocity /quantity was associated with high dust concentration
levels in faces A & C. Air velocity profiles across the face showed that air velocity
was not uniform across the face; it was highest over the AFC area and lowest in the
walkway. A comparison of air velocity with dust levels across the face indicated that
the dispersion and distribution of respirable dust depended largely on the airflow
patterns. Therefore, the variation in air velocity across the face should be taken into
account during the development of a dust control technique, as it affects the respirable
dust behaviour and dispersion. The size distribution of airborne respirable dust
samples was found to be quite different from mine to mine.
These studies also showed that there are high dust level gradients around the shearer
and across the section of the longwall face and indicated that the correct siting of
sampling stations is crucial in successful evaluation of dust control techniques. These

Chapter 3: Dust Distribution Page 146
experimental studies have been useful in identifying some of the important parameters
affecting dust transport and in characterizing dust cloud behaviour at longwall faces.
The studies have also provided a data base for the development of dust control
techniques to minimise the miners' exposure to dust. The knowledge of dust
behaviour under numerous conditions, obtained during this study, formed the basis of
the development of the multi-scrubber dust control system discussed in chapter 4.