pareto-optimal formulations for cost versus colorimetric...
TRANSCRIPT
Pareto-Optimal Formulations for Cost versus ColorimetricAccuracy Trade-Offs in Printer Color Management
D. J. LITTLEWOODUniversity of ColoradoP. A. DRAKOPOULOSIBM CorporationandG. SUBBARAYANUniversity of Colorado
Color management for the printing of digital images is a challenging task, due primarily to nonlinear ink-mixing behavior andthe presence of redundant solutions for print devices with more than three inks. Algorithms for the conversion of image data toprinter-specific format are typically designed to achieve a single predetermined rendering intent, such as colorimetric accuracy.In the present paper we present two CIELAB to CMYK color conversion schemes based on a general Pareto-optimal formulationfor printer color management. The schemes operate using a 149-color characterization data set selected to efficiently capturethe entire CMYK gamut. The first scheme uses artificial neural networks as transfer functions between the CIELAB and CMYKspaces. The second scheme is based on a reformulation of tetrahedral interpolation as an optimization problem. Characterizationdata are divided into tetrahedra for the interpolation-based approach using the program Qhull, which removes the commonrestriction that characterization data be well organized. Both schemes offer user control over trade-off problems such as costversus reproduction accuracy, allowing for user-specified print objectives and the use of constraints such as maximum allowableink and maximum allowable 1E∗ab. A formulation for minimization of ink is shown to be particularly favorable, integrating bothclipping and gamut compression features into a single methodology. Codes developed as applications of these schemes were usedto convert several CIELAB Tiff images to CMYK format, providing both qualitative and quantitative verification of the Pareto-optimal approach. Prints of the MacBeth ColorCheckertm chart were accurate within approximately to 31E∗ab for in-gamut colors.Modifications to this approach are presented that offer user control over grey component replacement and provide additionaloptions for rendering intent.
Categories and Subject Descriptors: I.4.0 [Image Processing and Computer Vision]: General—Image processing software
General Terms: Algorithms, Theory, Performance, Experimentation
Additional Key Words and Phrases: Artificial Neural Networks, Color Conversion, Color Fidelity, Color Management, ColorMatching, CMYK, Color Printing, Color Space Transformation, Optimization, Pareto-optimization, Tetrahedral Interpolation
This work was funded by IBM through the IBM University Partnership Project and by the National Science Foundation undercontract number ECS 9734349.Authors’ addresses: David J. Littlewood, University of Colorado, Campus Box 427, Boulder, CO 80309-0427; e-mail:[email protected]; Paul A. Drakopoulos, IBM Software Group, 590 Madison Avenue, 14th floor, New York, NY,10022; e-mail: [email protected]; Ganesh Subbarayan, University of Colorado, Campus Box 427, Boulder, CO 80309-0427;e-mail: [email protected] to make digital/hard copy of part or all of this work for personal or classroom use is granted without fee providedthat the copies are not made or distributed for profit or commercial advantage, the copyright notice, the title of the publication,and its date appear, and notice is given that copying is by permission of the ACM, Inc. To copy otherwise, to republish, to post onservers, or to redistribute to lists, requires prior specific permission and/or a fee.c© 2002 ACM 0730-0301/02/0400-0132 $5.00
ACM Transactions on Graphics, Vol. 21, No. 2, April 2002, Pages 132–175.
Pareto-Optimal Formulations for Cost versus Colorimetric Accuracy Trade-Offs in Printer Color Management • 133
1. INTRODUCTION
A prevalent color conversion requirement is the transfer of an image displayed on a monitor to CMYKformat for printing on a four-color print device. This conversion is commonly achieved through theuse of a third, device-independent, color space. Typically, RGB values are transformed into a device-independent color space from which conversion into a device-dependent CMYK color space is performed[Stone et al. 1988]. This strategy is the basis for international standards for device specification, namelythe International Color Consortium (ICC) profile [ICC 1998; Wallner 1998]. The choice of a device-independent color space for this study was based primarily on the need to quantify color differences. Adevice-independent color space well suited for this purpose is the CIE 1976 (L∗a∗b∗) color space [CIE1986; Hunter and Harold 1987; Kasson and Plouffe 1992; Xu and Holub 1992]. The CIE 1976 (L∗a∗b∗)color space, abbreviated CIELAB, aims towards perceptual uniformity, the condition where equal dis-tances in a color space correspond to approximately equal perceptual differences as seen by the humaneye [Wyszecki and Stiles 1982]. The use of CIELAB is widespread, and CIELAB is included as a stan-dard color space in ICC profiles [ICC 1998; Wallner 1998]. The difference between two color stimulirepresented by points in the CIELAB color space is quantified by the Euclidean distance between thetwo points, 1E∗ab [CIE 1986].
The characterization of displays in terms of tristimulus values has been well studied (see, for ex-ample, Kasson and Plouffe [1992], Widdel and Post [1992], Cowan [1983; 1987], or Berns [1996]), andthe calculation of CIELAB values from tristimulus values is simply a matter of applying colorimetricformulae [CIE 1986; Wyszecki and Stiles 1982; Hunt 1991]. The CIELAB to CMYK conversion of amonitor image, however, is nontrivial for several reasons. One difficultly arises from the fact that colorgamuts of both monitors and print devices are restricted by the physical nature of the systems. Printergamuts generally do not match monitor gamuts, leading to monitor images that cannot be accuratelyreproduced by a printer [Gordon et al. 1987; Stone et al. 1988; Gentile et al. 1990]. This problem isaddressed by gamut mapping, the process by which the range of colors produced by a given monitoris projected onto a printer gamut [Gentile et al. 1990]. A second challenge is mathematical in origin,CIELAB to CMYK conversion is a 3-space to 4-space transformation having multiple solutions in gen-eral, and thus requires an additional constraint. This constraint is typically formulated in terms of greycomponent replacement [Yule 1967; Sayanagi 1987; SWOP 1988].
Transformation into a CMYK color space from CIELAB is commonly performed using a look-up table(LUT) and interpolation. Generally, interpolation inside a LUT is well suited for implementation due toits speed, but error prone due to its inability to model the nonlinearity of ink mixing. Interpolation errorsdecrease as the number of points in the LUT increases, thus LUTs are commonly built from a largecharacterization data set [Kang 1995b; Johnson 1996]. Construction of a LUT entails printing a set ofcolor patches and obtaining colorimetric data by physical measurement of the device output [Johnson1996]. These data are arranged in a nxnxn matrix, where n typically falls between 6 and 16. Fordetailed information regarding interpolation inside a look-up table (LUT), and the errors associatedwith it, the reader is referred to Nin et al. [1992], Hung [1993], Jennings et al. [1994], Kasson [1994],Kasson et al. [1995], Kang [1995a], or Kanamori [1999]. Due to its efficiency and accuracy relative toother interpolation schemes, tetrahedral interpolation is considered best suited for interpolation insidea LUT [Kasson et al. 1995].
Various formulae have also been used for conversion into printer color spaces, including regressionmodels and models based on optics and ink mixing [Kang 1995b]. Models based on optics and ink mixinginclude the Neugebauer equations, the Yule-Nielsen model, the Clapper-Yule model, the Kubelka-Munktheory, and the Beer-Bouguer law [Neugebauer 1937; Yule and Neilsen 1951; Clapper and Yule 1953;1955; Kubelka and Munk 1931; Kubelka 1948; Bouguer 1729; Beer 1852; Wyszecki and Stiles 1982].
ACM Transactions on Graphics, Vol. 21, No. 2, April 2002.
134 • D. Littlewood et al.
A number of studies had applied these theories to modern printing devices [Heuberger et al. 1992; Kang1993; Rolleston and Balasubramanian 1993; Kang 1994; Kim et al. 1997; Praefcke 1999]. In general,ink-mixing theory is insufficient to predict the complex interactions of ink and paper in four-color print-ing [Kang 1995b]. Regression models typically involve finding model parameters (such as polynomialcoefficients) which minimize the difference between a numerical model and a set of characterizationdata [Vachon 1988; Mongeon 1996]. Of particular relevance to this study are nonlinear regression mod-els based on artificial neural networks [Kang 1992; Marcu and Iwata 1993; Abe and Marcu 1994; Araiet al. 1993; Tominaga 1993, 1996; Drakopoulos 1997a; Tominaga 1998a, 1998b].
The effectiveness of color conversions can be measured in several ways. The cost of reproducing agiven image and the colorimetric accuracy with which it is reproduced provide quantitative measures ofquality. Judgments regarding out-of-gamut color conversion and the preservation of gradients must bemade considering the overall appearance of the image. This must be done, at least in part, qualitatively,and not based simply on the accuracy with which individual tones are reproduced by the print device[Gentile et al. 1990]. At the present time, systematic approaches to characterizing printers and therebyconverting images with arbitrary, user-defined rendering intents are largely missing in the literature.
In this paper we present an approach based on a Pareto-optimal formulation of the color conversionproblem to achieve arbitrary, user-defined rendering intents [Littlewood 2001]. An important aspectof the proposed approach is a small set of input characterization data, together with carefully builtartificial neural network models. The smallness of the data set is expected to enable efficient calibra-tion. The remainder of Section 1 contains background material relating to grey component replacementand tetrahedral interpolation. Section 2 presents the mathematical foundation of the Pareto-optimalapproach. Section 2 also introduces the artificial neural network and interpolation transfer functionsused in this study to convert between the CIELAB and CMYK color spaces. Implementation detailsare covered in Section 3, including the selection of a characterization data set and development of thecolor management systems NeuralColor and OptInterpol. NeuralColor is based on the use of artificialneural networks as global models of the relationship between CMYK and CIELAB. OptInterpol op-erates on a generalized Pareto-optimal formulation of tetrahedral interpolation, and utilizes the codeQhull [Barber and Huhdanpaa 1998] as a means to construct tetrahedra from any arbitrary set of char-acterization data. Evaluation methodology and results are presented in Sections 4 and 5. Colorimetricdata was acquired by printing the MacBeth ColorCheckertm color rendition chart [McCamy et al. 1976].Additional images were printed to allow for qualitative evaluation. Finally, a discussion of the resultsand conclusions drawn from this study are presented in Section 6. Section 6 includes a discussion ofcreating ICC profiles with the color management systems developed in this study, a practice which al-lows for real-time image conversion and integration of the Pareto-optimal approach with commerciallyavailable software packages on standard operating systems.
1.1 The Black Printer and Grey Component Replacement
The use of black ink in addition to chromatic inks is favorable in several respects [SWOP 1988; Yule1967; Johnson 1996; Jung 1984; Holub et al. 1989; Birkenshaw et al. 1986]:
—To reduce overall colorant deposition.—To substitute a relatively inexpensive black ink for a part of the more costly colored inks.—To expand the printer gamut.—To make the grey balance of the cyan, magenta, and yellow inks less critical.—To produce denser blacks and better shadow detail than cyan, magenta, and yellow inks alone can
produce.ACM Transactions on Graphics, Vol. 21, No. 2, April 2002.
Pareto-Optimal Formulations for Cost versus Colorimetric Accuracy Trade-Offs in Printer Color Management • 135
These benefits have led to the commonality of four-color printing in the image reproduction industry.The output of a four-color printer, expressed in terms of CIELAB values, is a function of 4 variables.
L∗ = L∗(C, M , Y , K )a∗ = a∗(C, M , Y , K ) (1)b∗ = b∗(C, M , Y , K )
Equation (1) illustrates that four-color printing is an indeterminate problem of three equations withfour unknowns. For any printed color with a grey component, that is, for any color that lies within theouter boundary of the printer gamut, infinite combinations of cyan, magenta, yellow, and black exist assolutions to Equation 1 [Yule 1967; Holub et al. 1989; Schwartz et al. 1985; Holub and Kearsley 1989].The constraint required to determine a unique combination of the four inks is commonly expressed interms of grey component replacement (GCR) [SWOP 1988; Holub et al. 1989; Holub and Kearsley 1989;Field 1986].
GCR can be well described in terms of three components, the black printer, under color removal(UCR), and under color addition (UCA) [Sayanagi 1987]. The black printer is simply the amount ofblack ink added to a CMY image. UCR refers to the reduction of cyan, magenta, and yellow inks (or anychromatic ink in general) in compensation for black ink added to the image [Yule 1967]. UCA refers tothe addition of chromatic inks to a CMYK image to counteract undesirable consequences of UCR, suchas the loss of density in dark regions of the print [SWOP 1988].
It should be noted that the above terminology implies that any CMYK image can be produced bycombinations of cyan, yellow, and magenta inks. This is not strictly true, as the use of black in additionto cyan, magenta, and yellow increases the printer gamut [Holub et al. 1989; Birkenshaw et al. 1986].Thus, the practice of starting with a CMY image and subsequently adding black while maintainingcolorimetric consistency does not allow for realization of the full CMYK gamut.
1.2 Tetrahedral Interpolation
The implementation of a LUT requires an interpolation scheme to approximate the transfer functionbetween the input space and the output space. A desirable interpolation method is both accurate andcomputationally inexpensive. Tetrahedral interpolation meets both of these criteria [Kasson and Plouffe1992; Hung 1992; Kanamori and Kotera 1992].
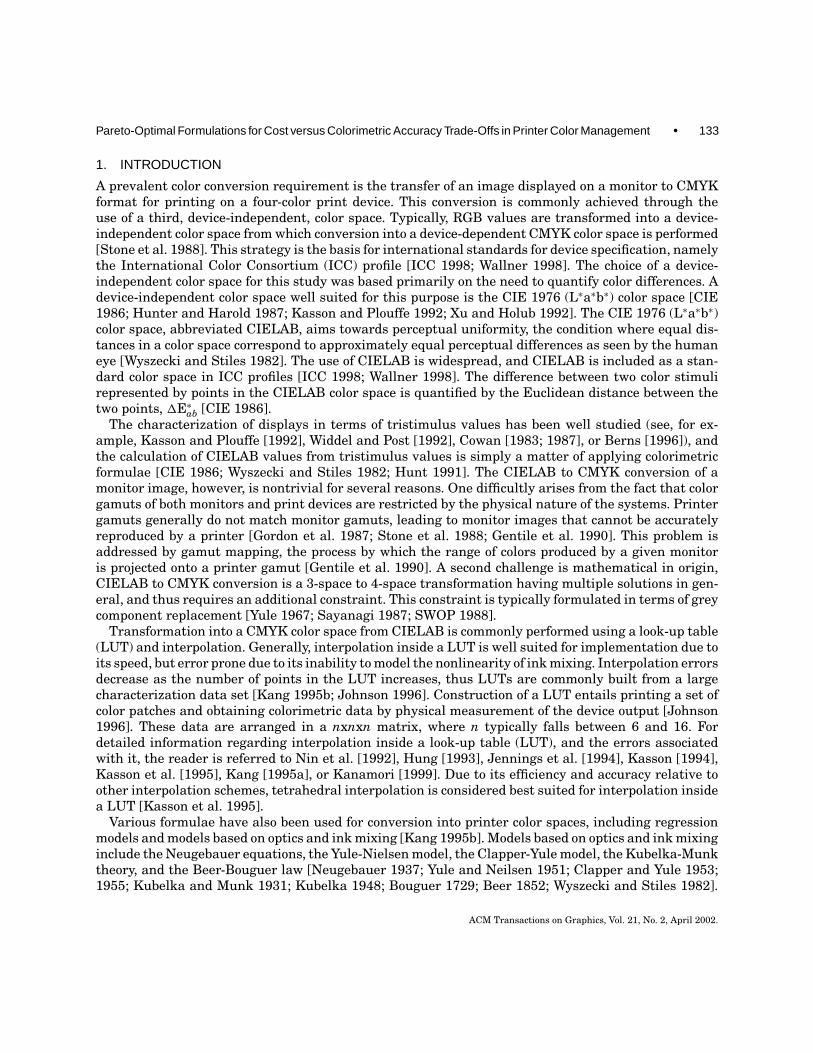
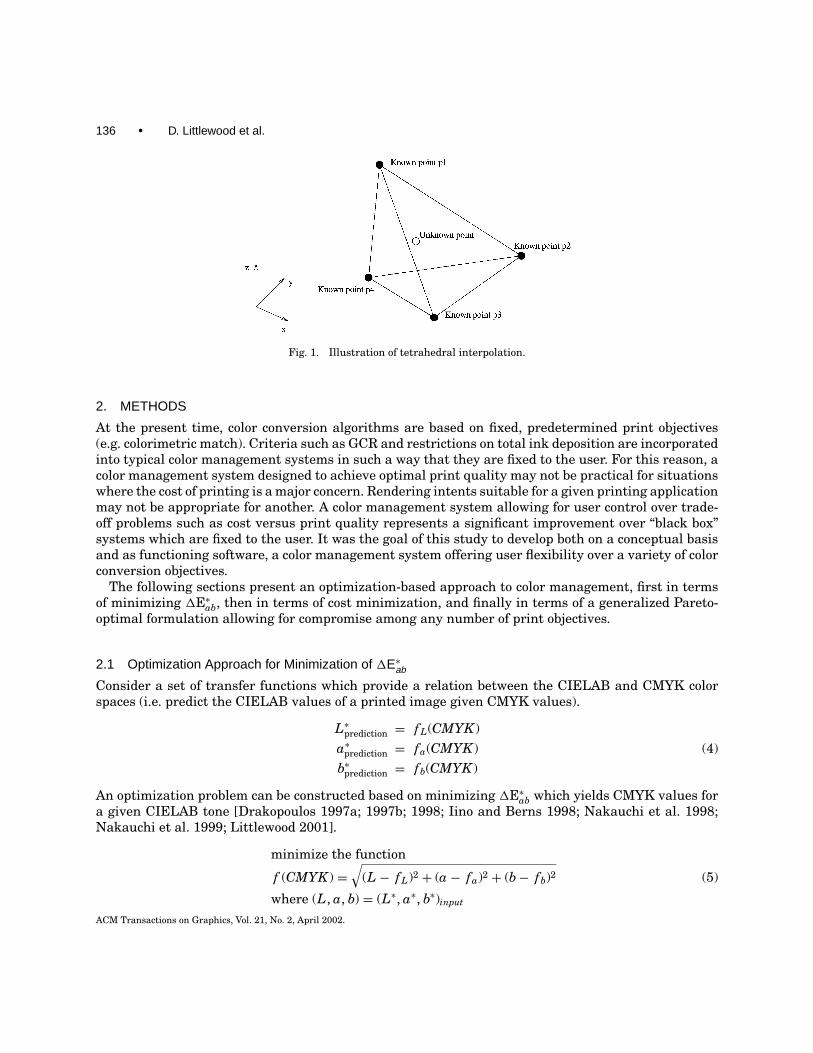
A transformation function F (x, y , z) can be approximated through tetrahedral interpolation usingfour neighboring points which surround a given input point. Figure 1 shows an input point fallinginside a tetrahedron of arbitrary geometry. The transformation function F (x, y , z) is approximated bythe well known interpolation formula [Kasson and Plouffe 1992]
F (x, y , z) = N1 F1 + N2 F2 + N3 F3 + N4 F4 (2)
where Fi are the known function values for vertices Pi, and Ni are volume coordinates which specifythe unknown point’s location in the tetrahedron. Formulae for the volume coordinates Ni for a givenpoint are found as the solution of Equation Set (3).
x = N1x1 + N2x2 + N3x3 + N4x4
y = N1 y1 + N2 y2 + N3 y3 + N4 y4(3)
z = N1z1 + N2z2 + N3z3 + N4z4
1 = N1 + N2 + N3 + N4
ACM Transactions on Graphics, Vol. 21, No. 2, April 2002.
136 • D. Littlewood et al.
Fig. 1. Illustration of tetrahedral interpolation.
2. METHODS
At the present time, color conversion algorithms are based on fixed, predetermined print objectives(e.g. colorimetric match). Criteria such as GCR and restrictions on total ink deposition are incorporatedinto typical color management systems in such a way that they are fixed to the user. For this reason, acolor management system designed to achieve optimal print quality may not be practical for situationswhere the cost of printing is a major concern. Rendering intents suitable for a given printing applicationmay not be appropriate for another. A color management system allowing for user control over trade-off problems such as cost versus print quality represents a significant improvement over “black box”systems which are fixed to the user. It was the goal of this study to develop both on a conceptual basisand as functioning software, a color management system offering user flexibility over a variety of colorconversion objectives.
The following sections present an optimization-based approach to color management, first in termsof minimizing 1E∗ab, then in terms of cost minimization, and finally in terms of a generalized Pareto-optimal formulation allowing for compromise among any number of print objectives.
2.1 Optimization Approach for Minimization of 1E∗ab
Consider a set of transfer functions which provide a relation between the CIELAB and CMYK colorspaces (i.e. predict the CIELAB values of a printed image given CMYK values).
L∗prediction = f L(CMYK )a∗prediction = fa(CMYK ) (4)b∗prediction = fb(CMYK )
An optimization problem can be constructed based on minimizing 1E∗ab which yields CMYK values fora given CIELAB tone [Drakopoulos 1997a; 1997b; 1998; Iino and Berns 1998; Nakauchi et al. 1998;Nakauchi et al. 1999; Littlewood 2001].
minimize the function
f (CMYK ) =√
(L − f L)2 + (a − fa)2 + (b− fb)2 (5)
where (L, a, b) = (L∗, a∗, b∗)input
ACM Transactions on Graphics, Vol. 21, No. 2, April 2002.

Pareto-Optimal Formulations for Cost versus Colorimetric Accuracy Trade-Offs in Printer Color Management • 137
In this formulation, f (CMYK ) is simply the distance (Euclidean norm) in the CIELAB space separatingthe given (input) color from the predicted (output) color,1E∗ab. The solution f (CMYK ) = 0 is found whenthe predicted output CIELAB values match exactly the input CIELAB values, which is possible for anyin-gamut color. The optimization-based solution for any out-of-gamut color is simply the closest in-gamut color, found by minimizing the objective function f (CMYK ). The conversion of out-of-gamutcolors to the closest in-gamut color is commonly termed clipping, and has been shown to be a preferabletechnique for gamut mapping [Gentile et al. 1990].
The formulation of color conversion as an optimization problem is the foundation of the Pareto-optimal approach to color conversion. This formulation allows for the conversion of both out-of-gamutand in-gamut colors, and can be expanded with the specification of alternative conversion objectives.
2.2 Optimization Approach for Cost Minimization
While the approach described in Section 2.1 allows for color conversion based on the minimization of1E∗ab, the general approach is much broader and can be modified in accordance with alternative objec-tives such as the minimization of cost. The minimization of cost can be achieved either by minimizingtotal ink or by maximizing black ink, as the maximization of black ink typically reduces chromatic inkdeposition (as in GCR). In the case of total ink minimization, a color in the CIELAB space is convertedinto a CMYK space using as little ink as possible while maintaining a prescribed accuracy 1E∗ab max.
1
The optimization problem takes the form
minimize the functionf (CMYK ) = C + M + Y + K
subject to the constraint(6)
h(CMYK ) = 1E∗ab max −1E∗ab ≥ 0where 1E∗ab is found as
1E∗ab =√
(L − f L)2 + (a − fa)2 + (b− fb)2
This approach is practical in cases where cost is a key factor. Users of this approach can specify themaximum allowable 1E∗ab between the original and converted image, and then minimize cost based onthat chosen maximum 1E∗ab.
The minimization of ink approach can be interpreted as gamut compression where input CIELABvalues are mapped a distance 1E∗ab max towards the point of least cost. In addition to savings in cost,this mapping provides protection against the loss of gradients at the gamut edge. In-gamut colors andcolors lying a distance less than 1E∗ab max from the gamut surface yield an in-gamut solution, whilecolors lying a distance greater than 1E∗ab max from the gamut boundary are clipped to the boundarysurface. Thus the minimization of ink formulation unifies gamut compression and clipping schemesinto a single methodology.
An alternative approach for lowering the cost of color printing is to maximize the amount of blackink in the image. This approach is analogous to GCR implementations which seek to lower the usageof chromatic inks by increasing the percentage of black ink. Maximization of black ink for a prescribed
1Due to gamut mismatch, prescribed accuracies may not be achievable for out-of-gamut colors. This is an important considerationwhen implementing Equation (6). Throughout this study, optimization routines were provided with a clause allowing for thereplacement of Equation (6) with Equation (5) (i.e. a clipping algorithm) for cases where the prescribed 1E∗ab constraint couldnot be met.
ACM Transactions on Graphics, Vol. 21, No. 2, April 2002.
138 • D. Littlewood et al.
maximum allowable 1E∗ab leads to a problem of the form
minimize the functionf (CMYK ) = −K
(7)subject to the constraint
h(CMYK ) = 1E∗ab max −1E∗ab ≥ 0
2.3 Generalized Pareto-optimal Formulation
In general, the cost and accuracy measures discussed in Sections 2.1 and 2.2 are competing objectives. Inother words, a general color management problem involves trade-offs between competing quantities ofcost, accuracy, and perhaps other user specified objectives (e.g. a rendering intent that prefers saturatedcolors). Optimization theory provides a very natural framework for decision making in the presenceof competing objectives through multi-objective optimization or Pareto-optimization [Stadler 1988]. APareto-optimal problem in general is a mapping problem which possesses a vector of objectives expressedas a function of the unknown variables
f (x) : Rn→ Rm (8)
It is easy to show [Stadler 1988] that this vector-objective problem is equivalent to minimizing a scalarobjective of the form
cT f (x) (9)c = (c1, c2, . . . , cm)
for each combination of the constraints ci in the range [0,1]. Furthermore, an objective equation may bedivided by any one of the parameters ci resulting in the removal of a degree of freedom and an objectivefunction with parameters in the range [0,∞]. The family of Pareto-optimal solutions therefore repre-sents a m-1 dimensional hyper-surface for a m dimensional objective. Thus, the problem formulationsdiscussed in Sections 2.1 and 2.2 may be combined in the unified Pareto-optimal problem
minimize the functionf (CMYK ) = c11E∗ab(CMYK )+ c2 I (CMYK )− c3K + c4 R(CMYK )
subject to the constraintsh1(CMYK ) = 1E∗ab max −1E∗ab ≥ 0h2(CMYK ) = Imax − I ≥ 0h3(CMYK ) ≥ 0
(10)where
I (CMYK ) = C + M + Y + KR(CMYK ) is any arbitrary user defined print objectiveh3(CMYK ) is any arbitrary user specified restriction to color conversionand ci are user defined coefficients specifying the overall print objective
Any solution in the Pareto-optimal family is “non-dominated” since, at any solution, it is not possible tofurther reduce all of the functions simultaneously. Preferred solutions may be based on a single termin the Pareto-optimal formulation or on a compromise between any number of them. Proper selectionof the parameters ci and the bounds enforced by the constraint equations are sufficient to achieveACM Transactions on Graphics, Vol. 21, No. 2, April 2002.
Pareto-Optimal Formulations for Cost versus Colorimetric Accuracy Trade-Offs in Printer Color Management • 139
any preferred solution. The following list provides examples of possible conversion objectives and thecorresponding parameter values:
—Reproduce the image as accurately as possible (c1 = 1, c2 = c3 = 0, 1E∗ab max = Imax = ∞).—Minimize total ink with a restriction on allowable error (c2 = 1, c1 = c3 = 0, 1E∗ab max = prescribed
value, Imax = ∞).—Minimize error with a restriction on total ink (c1 = 1, c2 = c3 = 0, 1E∗ab max = ∞, Imax = prescribed
value).—Maximize black ink with a restriction on allowable error (c3 = 1, c1 = c2 = 0, 1E∗ab max = prescribed
value, Imax = ∞).—Combined objective function: minimize error while reducing total ink (c1 = prescribed value, c2 =
prescribed value, c3 = 0, 1E∗ab max = Imax = ∞).—Any arbitrary combination of objectives and constraints.
Problem (10) could be easily modified to incorporate alternative conversion objectives, such as theminimization of perceptual difference as studied by Nakauchi et al. [1999; 1998]. Stollnitz et al. [1998]and Power et al. [1996] also demonstrate the versatility of optimization in color management by findingoptimal ink selections for printing. The constraint equation set can also be modified for inclusion ofalternative mapping strategies. Constant hue angle, for example, can be enforced using the constraintequation
h(CMYK ) = atan(
ba
)− atan
(fb
fa
)= 0 (11)
A wide variety of user requirements related to GCR can be also be met using the Pareto-optimalapproach. A powerful expansion of the Pareto-optimal approach allowing for GCR control was developedin conjunction with this study and is the subject of current work as described in Section 6.5 of this paper.
2.4 Artificial Neural Networks as Transfer Functions
The success of the Pareto-optimal approach to color conversion is dependent on the choice oftransfer functions presented in Equation Set (4). As was described in Section 1, LUT-based con-versions use interpolation to define a relation between CIELAB and CMYK. Interpolation formulaerequire a relatively dense LUT to accurately capture the behavior of four-color printers, resultingin a large number of required characterization measurements [Johnson 1996; Kanamori 1999]. Analternative to interpolation-based transformations is found in artificial neural networks (ANNs) [Kangand Anderson 1992; Marcu and Iwata 1993; Arai et al. 1993; Abe and Marcu 1994; Tominaga 1993;1996; 1998a; Drakopoulos 1997a; 1997b; 1998; Tominaga 1998a; 1998b; Littlewood 2001]. ANNs arecapable of modeling any arbitrary function [Hornik et al. 1989; Leshno et al. 1993], and thus pro-vide a means of capturing the nonlinearity of ink mixing, a significant source of error in interpolationschemes [Kanamori and Kotera 1992; Kanamori 1999]. In addition to their general ability to modelnonlinear processes, ANNs are distinct from LUT-based schemes in that they provide a global model ofthe process, as opposed to combining many local basis functions.
Consider the transfer functions
f L = f̃ L(C, M , Y , K ), fa = f̃ a(C, M , Y , K ), fb = f̃ b(C, M , Y , K ) (12)
where f̃ L, f̃ a, and f̃ b are ANNs trained using a characterization data set (a characterization dataset is constructed by printing a set of CMYK combinations and measuring the CIELAB values of theoutput).
ACM Transactions on Graphics, Vol. 21, No. 2, April 2002.
140 • D. Littlewood et al.
By utilizing ANNs, the creation of a LUT is circumvented, as characterization data are required onlyfor the training of the ANNs. The size of the characterization set required for equivalent accuracy issubstantially smaller than the size of a LUT [Drakopoulos 1997a; 1997b; 1998]. A properly selectedcharacterization set spans the entire printer gamut and reflects its nonlinearity, yielding ANNs whichalso possess these qualities.
2.5 Formulation of Tetrahedral Interpolation as an Optimization Problem
As described earlier, the formulation of color space conversion as a Pareto-optimal problem enablesconsiderable generality in terms of specifying the conversion objectives and constraints. This generalityis not easily achieved with classical tetrahedral interpolation. However, it is shown here that the volumecoordinates Ni found explicitly using the tetrahedral interpolation formulae can also be found throughthe solution of an optimization problem. This allows a generalization of tetrahedral interpolation toinclude arbitrary, user-specified objectives.
Consider a point inside a tetrahedron in the CIELAB space, where the vertices of the tetrahedronare calibrated points as in standard interpolation. If the point’s location is specified by the volumecoordinates Ni, then the following relations can be established.
Lp = N1L1 + N2L2 + N3L3 + N4L4
ap = N1a1 + N2a2 + N3a3 + N4a4
bp = N1b1 + N2b2 + N3b3 + N4b4
Cp = N1C1 + N2C2 + N3C3 + N4C4 (13)M p = N1M1 + N2M2 + N3M3 + N4M4
Y p = N1Y1 + N2Y2 + N3Y3 + N4Y4
K p = N1K1 + N2K2 + N3K3 + N4K4
4∑i=1
Ni = 1
The subscript p refers to the point specified by Ni, and the numeric subscripts refer to the tetrahe-dron’s vertices. The Ni and CMYK values can be determined for in-gamut colors as described earlier(Equations (2) and (3)). However, this interpolation fails for out-of-gamut colors.
An equivalent, but more general optimization problem can then be constructed as follows: treat thevolume coordinates Ni as variables and solve the problem
minimize the functionf (Ni) = c11E∗ab(Ni)+ c2 I (Ni)− c3K (Ni)+ c4 R(Ni) (14)
subject to the constraints
h1(Ni) =4∑
i=1
Ni − 1 = 0
h2(Ni) = 1E∗ab max −1E∗ab ≥ 0h3(Ni) = Imax − I ≥ 0h4(Ni) ≥ 0
ACM Transactions on Graphics, Vol. 21, No. 2, April 2002.
Pareto-Optimal Formulations for Cost versus Colorimetric Accuracy Trade-Offs in Printer Color Management • 141
where
I (Ni) =4∑
i=1
(Ci Ni + Mi Ni + Yi Ni + Ki Ni)
K (Ni) =4∑
i=1
Ki Ni
R(Ni) is any arbitrary user defined print objectiveh4(CMYK ) is any arbitrary user specified restriction to color conversionand ci are user defined coefficients specifing the overall print objective
This approach differs from the general Pareto-optimal approach in that the independent variables arethe intermediate variables Ni and not the CMYK values themselves.
Equation (14) is equivalent to tetrahedral interpolation for the case where c1 = 1, c2 = c3 = 0, andall constraints other than h1 in Equation 14 are removed. The solution is found when the first ordernecessary conditions for minimum are satisfied. For an in-gamut color with no restriction on ink usage(Imax = 4) this occurs when:
Lp = L = N1L1 + N2L2 + N3L3 + N4L4
ap = a = N1a1 + N2a2 + N3a3 + N4a4 (15)bp = b = N1b1 + N2b2 + N3b3 + N4b4
and N1 + N2 + N3 + N4 = 1
which is identical to Equation set (3), the equations from which the standard tetrahedral interpolationformulae are derived.
Unlike standard tetrahedral interpolation, however, the Pareto-optimal formulation is not limited tocases where the input point lies inside a tetrahedron. For cases when the input CIELAB values falloutside the print device gamut, no tetrahedron exists that encompasses the input point.2 As with thegeneral Pareto-optimal problem, the Pareto-optimal formulation of tetrahedral interpolation yields asolution for out-of-gamut colors which is simply the closest in-gamut color. Hence, the Pareto-optimalformulation of tetrahedral interpolation is equivalent to a clipping algorithm for out-of-gamut colors.
For the purpose of implementation, it is important to note that in general the Pareto-optimal problemmust be solved for all tetrahedra filling the printer gamut. The repeated solving of the Pareto-optimalproblem for each tetrahedron can be avoided for the case where c1 = 1, c2 = c3 = 0, and all constraintsother than h1 in Equation 14 are removed (i.e. the case where the Pareto-optimal problem reducesto standard tetrahedral interpolation). In this case, Ni can be solved for directly in each tetrahedronusing the standard formulae for calculating volume coordinates. The tetrahedron encompassing theinput point is identified when 0 ≤ Ni ≤ 1. If no tetrahedron is found to encompass the input point, thecorresponding color is necessarily out-of-gamut and the optimization-based scheme can be applied togenerate a clipping gamut mapping.
The reformulation of tetrahedral interpolation as a Pareto-optimal problem may be extended toinclude interpolation between any given number of known points as
minimize the functionf (Ni) = c11E∗ab(Ni)+ c2 I (Ni)− c3K (Ni)+ c4 R(Ni)
2This assumes all characterization points were created by measuring printed patches and not artificially created for the purposeof gamut mapping.
ACM Transactions on Graphics, Vol. 21, No. 2, April 2002.

142 • D. Littlewood et al.
subject to the constraints
h1(Ni) =n∑
i=1
Ni − 1 = 0
h2(Ni) = 1E∗ab max −1E∗ab ≥ 0h3(Ni) = Imax − I ≥ 0h4(Ni) ≥ 0 (16)
where n is the number of points over which the interpolation is made. In this way, interpolation inarbitrarily shaped polyhedra can be expressed as a Pareto-optimal problem. The n points used in thePareto-optimal problem need not form a polyhedron about the input point, however. Any number ofknown points in any arbitrary configuration is suitable for use in the Pareto-optimal problem. Theentire characterization set, in fact, may be used as the set of n points. This removes the restriction thatthe characterization set be subdivided, and allows for interpolation over the entire characterizationset. This type of interpolation procedure is analogous to the “meshless methods” of the finite elementmethod [Belytschko et al. 1996], just as tetrahedral interpolation for color conversion is analogous tothe standard tetrahedral finite element method [Zienkiewicz and Taylor 1989]. Increasing the numberof points n over which the Pareto-optimal formulation of interpolation is applied is not without cost.As the number of points n is increased, the optimization routine must manipulate a greater number ofindependent variables Ni, which results in greater computational expense.
3. IMPLEMENTATION
The ANN- and tetrahedral-interpolation-based schemes presented in Sections 2.4 and 2.5 were im-plemented in the programs NeuralColor and OptInterpol, respectively. The codes were evaluated bothquantitatively and qualitatively through the conversion of several Tiff images. All image conversionswere carried out on a Dell personal computer with a 400 MHz Pentium processor and 128 MB of RAMrunning Windows NT 4.0. The converted Tiff images and the characterization data set were printed ona Tektronix Phaser 740 printer. Colorimetric data were measured using a X-Rite Digital Swatchbookspectrophotometer with D65 illuminant and 2 degree standard observer. Consistent paper stock andambient light were maintained throughout the project.
Key issues related to the implementation of the Pareto-optimal approach, as well as the basic architec-tures of the codes NeuralColor and OptInterpol, are presented in the following sections. In particular,Sections 3.1 and 3.2 cover the construction of the characterization data set and the selection of anoptimization routine, two issues strongly affecting the performance of NeuralColor and OptInterpol.
3.1 The Characterization Data Set
A 149-color characterization data set was developed by the authors to efficiently and accurately capturethe nonlinearity of color mixing while spanning the entire gamut of the print device. The data set wasused for the training of NeuralColor’s ANNs and for the tetrahedral interpolation of OptInterpol. Thedata were selected based on ANN training requirements, as well as knowledge of ink mixing as studiedby Drakopoulos [1997a, 1997b, 1998]. The practice of calculating CMYK values from CMY values wasstrictly avoided, as this practice neglects dark areas of the gamut which can only be produced usingCMYK.
To evaluate the nonlinearity of a printer gamut quantitatively, Drakopoulos trained the ANNs f̃ L,f̃ a, and f̃ b using the basic ANSI IT8.7/3 data set [ANSI 1993] printed on an IBM Network Color Printer.A 46 full factorial design was then used to test the accuracy of the ANNs as a function of the amountACM Transactions on Graphics, Vol. 21, No. 2, April 2002.
Pareto-Optimal Formulations for Cost versus Colorimetric Accuracy Trade-Offs in Printer Color Management • 143
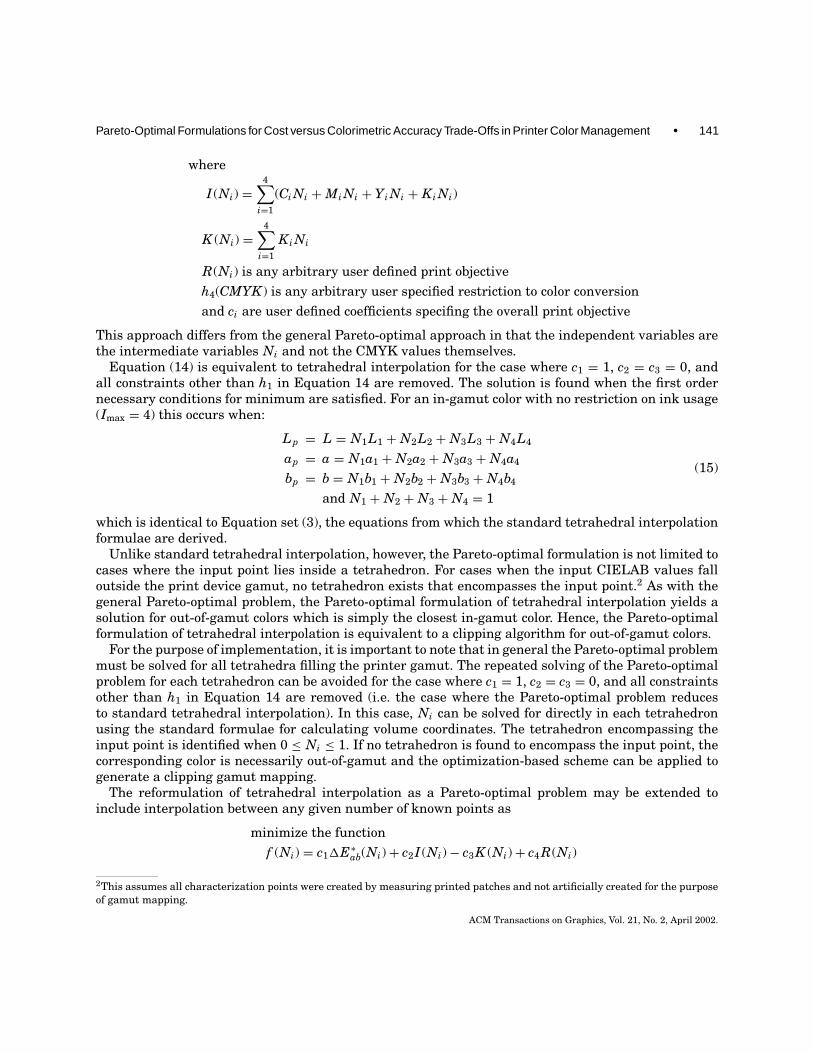
Fig. 2. 1E∗ab histogram illustrating the relationship between 1E∗ab and black ink.
of black ink in the printed tone. The results of this experiment are presented in Figure 2, which showsthat the error is greatest in the region where the dot fraction for black ink equals .4. The K values forthe colors in the characterization data set are based on this knowledge. The six chromatic primaries3
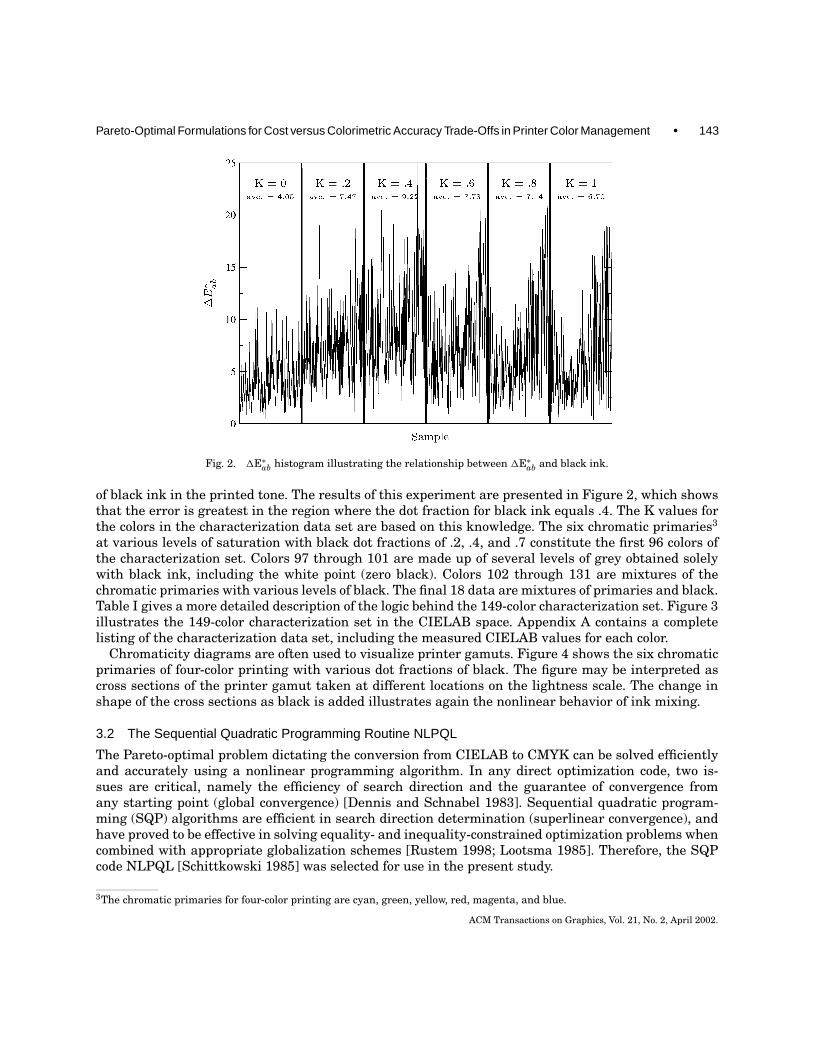
at various levels of saturation with black dot fractions of .2, .4, and .7 constitute the first 96 colors ofthe characterization set. Colors 97 through 101 are made up of several levels of grey obtained solelywith black ink, including the white point (zero black). Colors 102 through 131 are mixtures of thechromatic primaries with various levels of black. The final 18 data are mixtures of primaries and black.Table I gives a more detailed description of the logic behind the 149-color characterization set. Figure 3illustrates the 149-color characterization set in the CIELAB space. Appendix A contains a completelisting of the characterization data set, including the measured CIELAB values for each color.
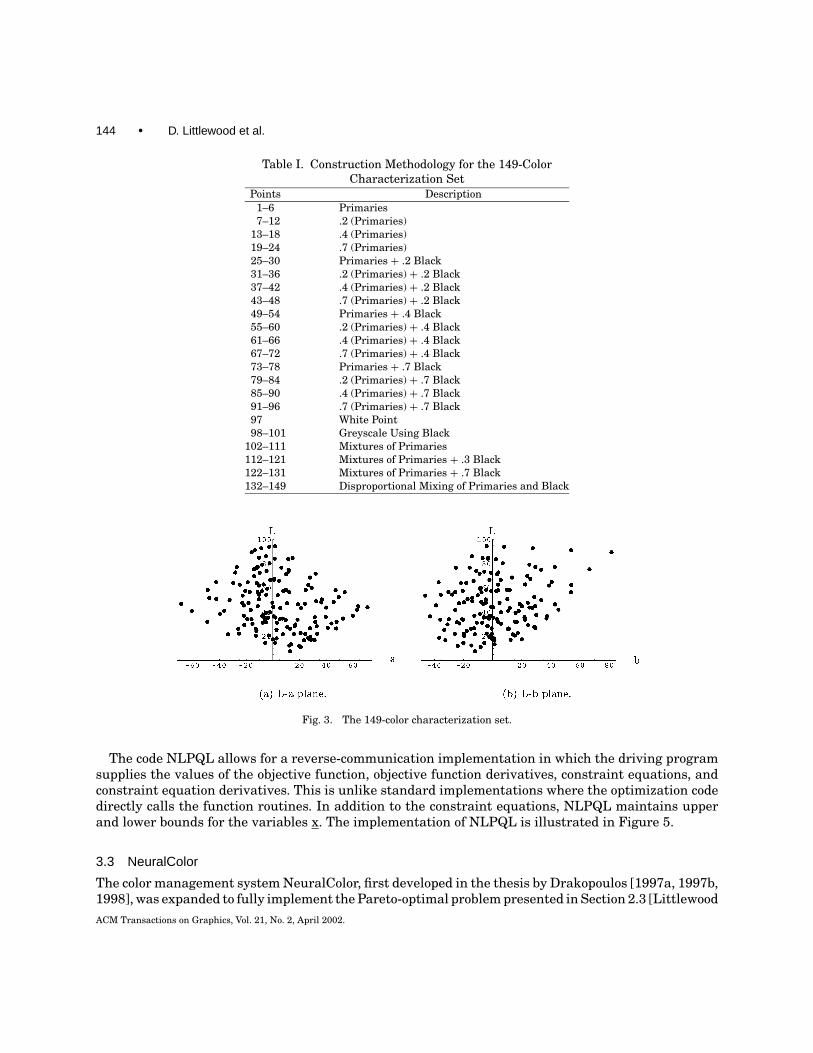
Chromaticity diagrams are often used to visualize printer gamuts. Figure 4 shows the six chromaticprimaries of four-color printing with various dot fractions of black. The figure may be interpreted ascross sections of the printer gamut taken at different locations on the lightness scale. The change inshape of the cross sections as black is added illustrates again the nonlinear behavior of ink mixing.
3.2 The Sequential Quadratic Programming Routine NLPQL
The Pareto-optimal problem dictating the conversion from CIELAB to CMYK can be solved efficientlyand accurately using a nonlinear programming algorithm. In any direct optimization code, two is-sues are critical, namely the efficiency of search direction and the guarantee of convergence fromany starting point (global convergence) [Dennis and Schnabel 1983]. Sequential quadratic program-ming (SQP) algorithms are efficient in search direction determination (superlinear convergence), andhave proved to be effective in solving equality- and inequality-constrained optimization problems whencombined with appropriate globalization schemes [Rustem 1998; Lootsma 1985]. Therefore, the SQPcode NLPQL [Schittkowski 1985] was selected for use in the present study.
3The chromatic primaries for four-color printing are cyan, green, yellow, red, magenta, and blue.
ACM Transactions on Graphics, Vol. 21, No. 2, April 2002.
144 • D. Littlewood et al.
Table I. Construction Methodology for the 149-ColorCharacterization Set
Points Description1–6 Primaries7–12 .2 (Primaries)
13–18 .4 (Primaries)19–24 .7 (Primaries)25–30 Primaries + .2 Black31–36 .2 (Primaries) + .2 Black37–42 .4 (Primaries) + .2 Black43–48 .7 (Primaries) + .2 Black49–54 Primaries + .4 Black55–60 .2 (Primaries) + .4 Black61–66 .4 (Primaries) + .4 Black67–72 .7 (Primaries) + .4 Black73–78 Primaries + .7 Black79–84 .2 (Primaries) + .7 Black85–90 .4 (Primaries) + .7 Black91–96 .7 (Primaries) + .7 Black97 White Point98–101 Greyscale Using Black
102–111 Mixtures of Primaries112–121 Mixtures of Primaries + .3 Black122–131 Mixtures of Primaries + .7 Black132–149 Disproportional Mixing of Primaries and Black
Fig. 3. The 149-color characterization set.
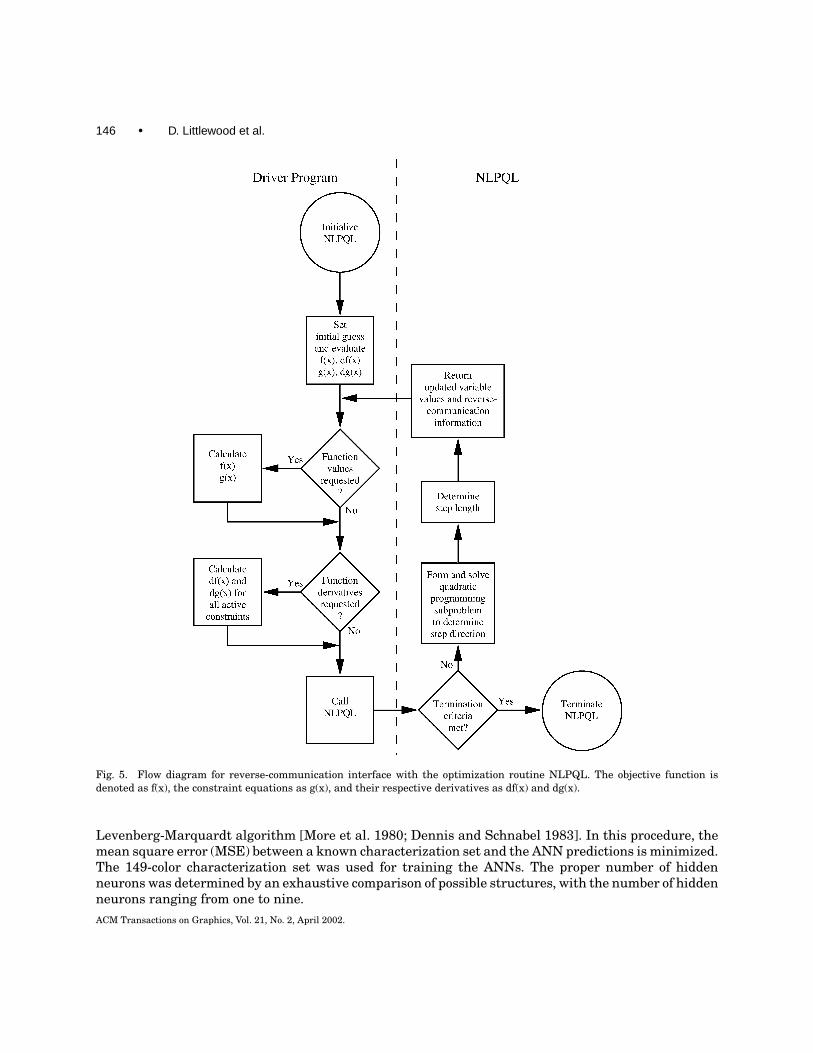
The code NLPQL allows for a reverse-communication implementation in which the driving programsupplies the values of the objective function, objective function derivatives, constraint equations, andconstraint equation derivatives. This is unlike standard implementations where the optimization codedirectly calls the function routines. In addition to the constraint equations, NLPQL maintains upperand lower bounds for the variables x. The implementation of NLPQL is illustrated in Figure 5.
3.3 NeuralColor
The color management system NeuralColor, first developed in the thesis by Drakopoulos [1997a, 1997b,1998], was expanded to fully implement the Pareto-optimal problem presented in Section 2.3 [LittlewoodACM Transactions on Graphics, Vol. 21, No. 2, April 2002.
Pareto-Optimal Formulations for Cost versus Colorimetric Accuracy Trade-Offs in Printer Color Management • 145
Fig. 4. Primaries with various amounts of black added.
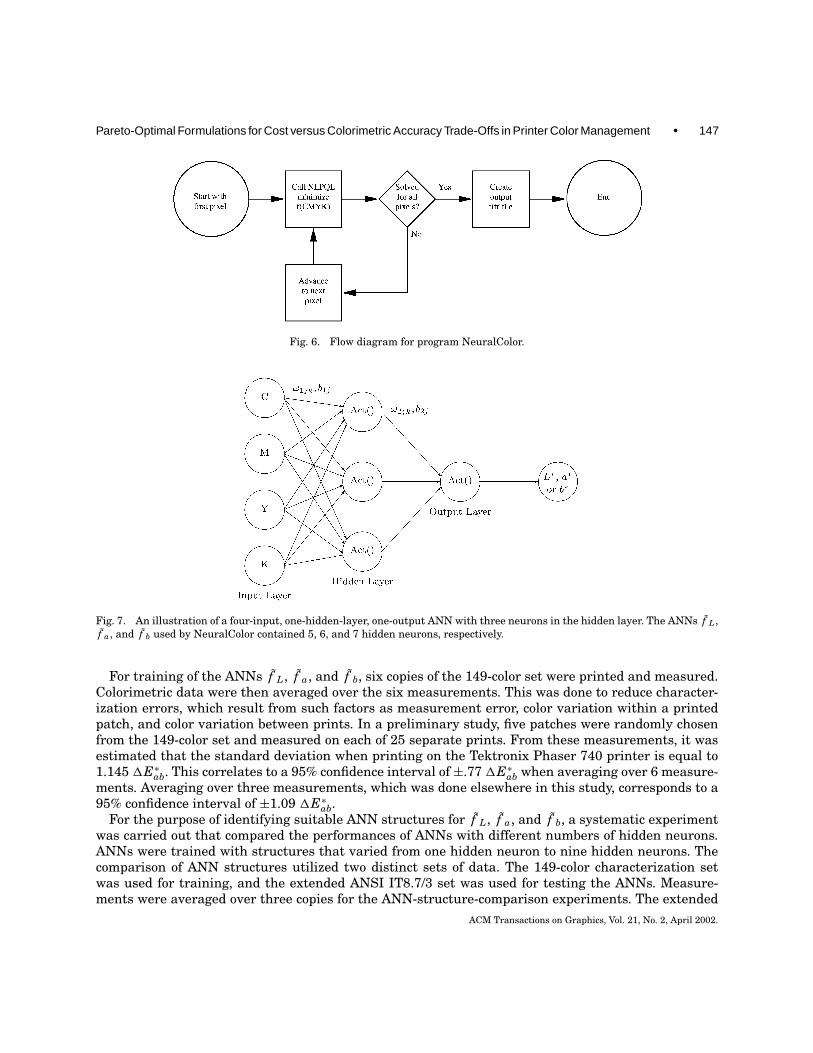
2001]. As described in previous sections, NeuralColor operates by minimizing the objective function foreach pixel using the NLPQL routine, yielding a set of CMYK values. A flow chart for NeuralColor ispresented in Figure 6.
A crucial detail in the development of NeuralColor is the creation of the ANNs f̃ L, f̃ a, and f̃ b.The ANNs used in the program NeuralColor are regression models that predict either L∗, a∗, or b∗
as a function of CMYK. Specifically, one-hidden-layer feedforward ANNs were trained by backpropa-gation [Haykin 1999] to model the relationship between CMYK and CIELAB. ANNs are well suitedfor capturing the nonlinear behavior of color mixing. It has been proven that ANNs are universal ap-proximators, and that in particular a standard multilayer feedforward network with a locally-boundedpiecewise-continuous activation function can approximate any continuous function to any degree ofaccuracy if and only if the network’s activation function is not a polynomial [Hornik et al. 1989; Leshnoet al. 1993]. This property guarantees that ANNs are capable of capturing the nonlinearity of the CMYKto CIELAB conversion.
Figure 7 illustrates the general structure of the ANN models. The ANNs are comprised of an inputlayer, a hidden layer, and an output layer. Each input neuron feeds each hidden-layer neuron. As datatravels from input neuron j to a hidden-layer neuron k, it is multiplied by the weight ω1 j k and summedwith bias b1 j . At each hidden neuron, the activation function Act() is called and the resulting value issent to the output layer. As data travels to the output layer from hidden-layer neuron j , it is multipliedby weight ω2 j 1 and summed with bias b2 j . The activation function Act() is again called by the outputneuron, and the resulting value is output by the network. Sigmoid functions are the most common formof activation function [Haykin 1999]. In this study, hyperbolic tangent was used as the ANN-activationfunction. Hyperbolic tangent is a monotonically increasing, non-polynomial function with upper andlower bounds of 1 and −1, respectively.
The values for ωi j k and bij were determined by a backpropagation procedure. Backpropagation wasachieved by implementing the LMDIF1 subroutine, which solves the least squares problem with the
ACM Transactions on Graphics, Vol. 21, No. 2, April 2002.
146 • D. Littlewood et al.
Fig. 5. Flow diagram for reverse-communication interface with the optimization routine NLPQL. The objective function isdenoted as f(x), the constraint equations as g(x), and their respective derivatives as df(x) and dg(x).
Levenberg-Marquardt algorithm [More et al. 1980; Dennis and Schnabel 1983]. In this procedure, themean square error (MSE) between a known characterization set and the ANN predictions is minimized.The 149-color characterization set was used for training the ANNs. The proper number of hiddenneurons was determined by an exhaustive comparison of possible structures, with the number of hiddenneurons ranging from one to nine.ACM Transactions on Graphics, Vol. 21, No. 2, April 2002.
Pareto-Optimal Formulations for Cost versus Colorimetric Accuracy Trade-Offs in Printer Color Management • 147
Fig. 6. Flow diagram for program NeuralColor.
Fig. 7. An illustration of a four-input, one-hidden-layer, one-output ANN with three neurons in the hidden layer. The ANNs f̃ L,f̃ a, and f̃ b used by NeuralColor contained 5, 6, and 7 hidden neurons, respectively.
For training of the ANNs f̃ L, f̃ a, and f̃ b, six copies of the 149-color set were printed and measured.Colorimetric data were then averaged over the six measurements. This was done to reduce character-ization errors, which result from such factors as measurement error, color variation within a printedpatch, and color variation between prints. In a preliminary study, five patches were randomly chosenfrom the 149-color set and measured on each of 25 separate prints. From these measurements, it wasestimated that the standard deviation when printing on the Tektronix Phaser 740 printer is equal to1.145 1E∗ab. This correlates to a 95% confidence interval of ±.77 1E∗ab when averaging over 6 measure-ments. Averaging over three measurements, which was done elsewhere in this study, corresponds to a95% confidence interval of ±1.09 1E∗ab.
For the purpose of identifying suitable ANN structures for f̃ L, f̃ a, and f̃ b, a systematic experimentwas carried out that compared the performances of ANNs with different numbers of hidden neurons.ANNs were trained with structures that varied from one hidden neuron to nine hidden neurons. Thecomparison of ANN structures utilized two distinct sets of data. The 149-color characterization setwas used for training, and the extended ANSI IT8.7/3 set was used for testing the ANNs. Measure-ments were averaged over three copies for the ANN-structure-comparison experiments. The extended
ACM Transactions on Graphics, Vol. 21, No. 2, April 2002.
148 • D. Littlewood et al.
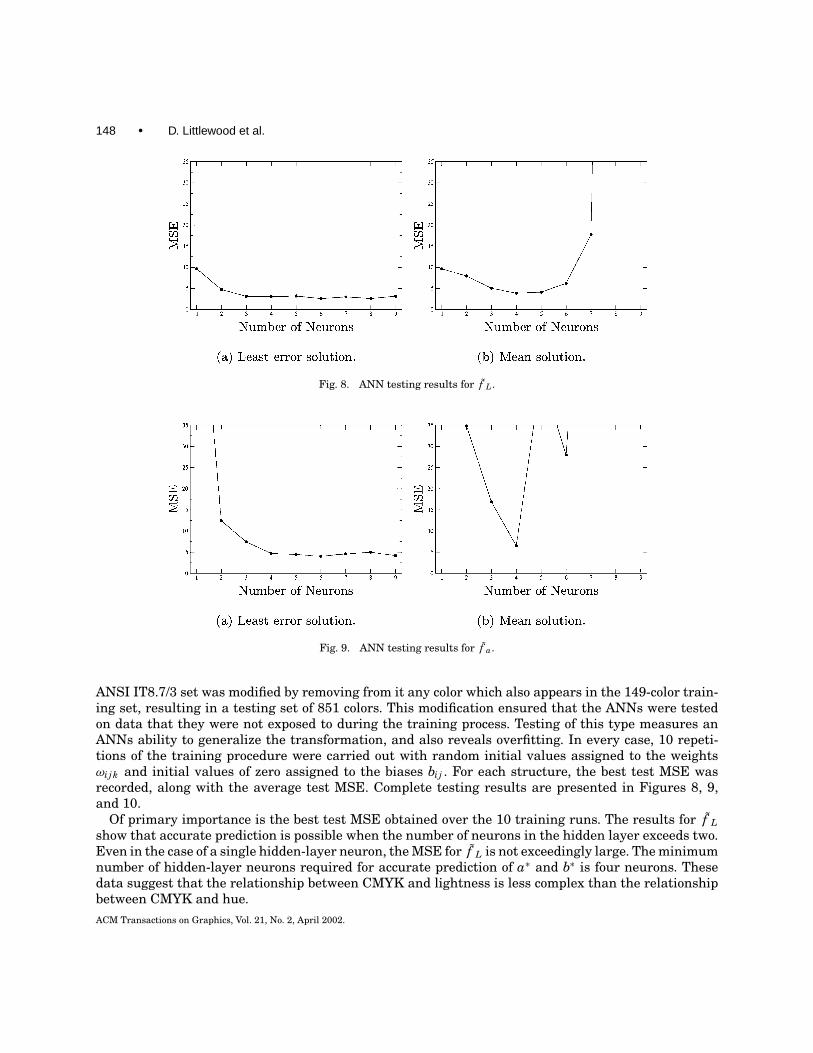
Fig. 8. ANN testing results for f̃ L.
Fig. 9. ANN testing results for f̃ a.
ANSI IT8.7/3 set was modified by removing from it any color which also appears in the 149-color train-ing set, resulting in a testing set of 851 colors. This modification ensured that the ANNs were testedon data that they were not exposed to during the training process. Testing of this type measures anANNs ability to generalize the transformation, and also reveals overfitting. In every case, 10 repeti-tions of the training procedure were carried out with random initial values assigned to the weightsωi j k and initial values of zero assigned to the biases bij . For each structure, the best test MSE wasrecorded, along with the average test MSE. Complete testing results are presented in Figures 8, 9,and 10.
Of primary importance is the best test MSE obtained over the 10 training runs. The results for f̃ Lshow that accurate prediction is possible when the number of neurons in the hidden layer exceeds two.Even in the case of a single hidden-layer neuron, the MSE for f̃ L is not exceedingly large. The minimumnumber of hidden-layer neurons required for accurate prediction of a∗ and b∗ is four neurons. Thesedata suggest that the relationship between CMYK and lightness is less complex than the relationshipbetween CMYK and hue.ACM Transactions on Graphics, Vol. 21, No. 2, April 2002.
Pareto-Optimal Formulations for Cost versus Colorimetric Accuracy Trade-Offs in Printer Color Management • 149
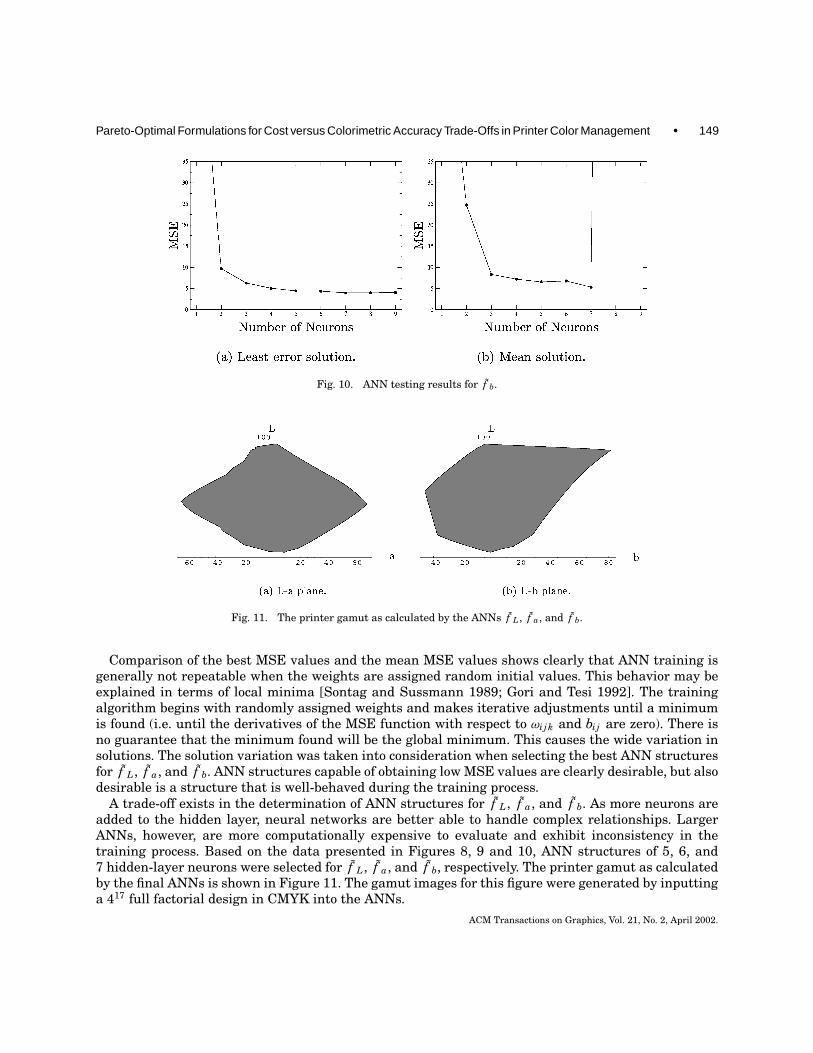
Fig. 10. ANN testing results for f̃ b.
Fig. 11. The printer gamut as calculated by the ANNs f̃ L, f̃ a, and f̃ b.
Comparison of the best MSE values and the mean MSE values shows clearly that ANN training isgenerally not repeatable when the weights are assigned random initial values. This behavior may beexplained in terms of local minima [Sontag and Sussmann 1989; Gori and Tesi 1992]. The trainingalgorithm begins with randomly assigned weights and makes iterative adjustments until a minimumis found (i.e. until the derivatives of the MSE function with respect to ωi j k and bij are zero). There isno guarantee that the minimum found will be the global minimum. This causes the wide variation insolutions. The solution variation was taken into consideration when selecting the best ANN structuresfor f̃ L, f̃ a, and f̃ b. ANN structures capable of obtaining low MSE values are clearly desirable, but alsodesirable is a structure that is well-behaved during the training process.
A trade-off exists in the determination of ANN structures for f̃ L, f̃ a, and f̃ b. As more neurons areadded to the hidden layer, neural networks are better able to handle complex relationships. LargerANNs, however, are more computationally expensive to evaluate and exhibit inconsistency in thetraining process. Based on the data presented in Figures 8, 9 and 10, ANN structures of 5, 6, and7 hidden-layer neurons were selected for f̃ L, f̃ a, and f̃ b, respectively. The printer gamut as calculatedby the final ANNs is shown in Figure 11. The gamut images for this figure were generated by inputtinga 417 full factorial design in CMYK into the ANNs.
ACM Transactions on Graphics, Vol. 21, No. 2, April 2002.
150 • D. Littlewood et al.
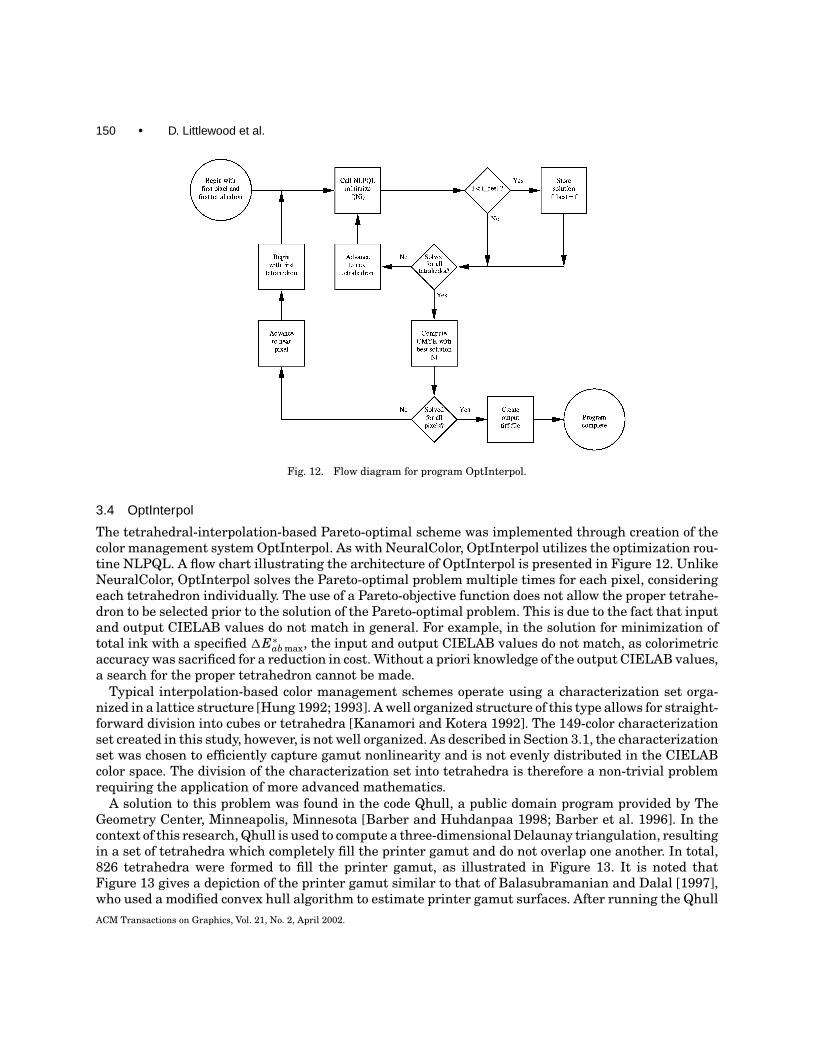
Fig. 12. Flow diagram for program OptInterpol.
3.4 OptInterpol
The tetrahedral-interpolation-based Pareto-optimal scheme was implemented through creation of thecolor management system OptInterpol. As with NeuralColor, OptInterpol utilizes the optimization rou-tine NLPQL. A flow chart illustrating the architecture of OptInterpol is presented in Figure 12. UnlikeNeuralColor, OptInterpol solves the Pareto-optimal problem multiple times for each pixel, consideringeach tetrahedron individually. The use of a Pareto-objective function does not allow the proper tetrahe-dron to be selected prior to the solution of the Pareto-optimal problem. This is due to the fact that inputand output CIELAB values do not match in general. For example, in the solution for minimization oftotal ink with a specified 1E∗ab max, the input and output CIELAB values do not match, as colorimetricaccuracy was sacrificed for a reduction in cost. Without a priori knowledge of the output CIELAB values,a search for the proper tetrahedron cannot be made.
Typical interpolation-based color management schemes operate using a characterization set orga-nized in a lattice structure [Hung 1992; 1993]. A well organized structure of this type allows for straight-forward division into cubes or tetrahedra [Kanamori and Kotera 1992]. The 149-color characterizationset created in this study, however, is not well organized. As described in Section 3.1, the characterizationset was chosen to efficiently capture gamut nonlinearity and is not evenly distributed in the CIELABcolor space. The division of the characterization set into tetrahedra is therefore a non-trivial problemrequiring the application of more advanced mathematics.
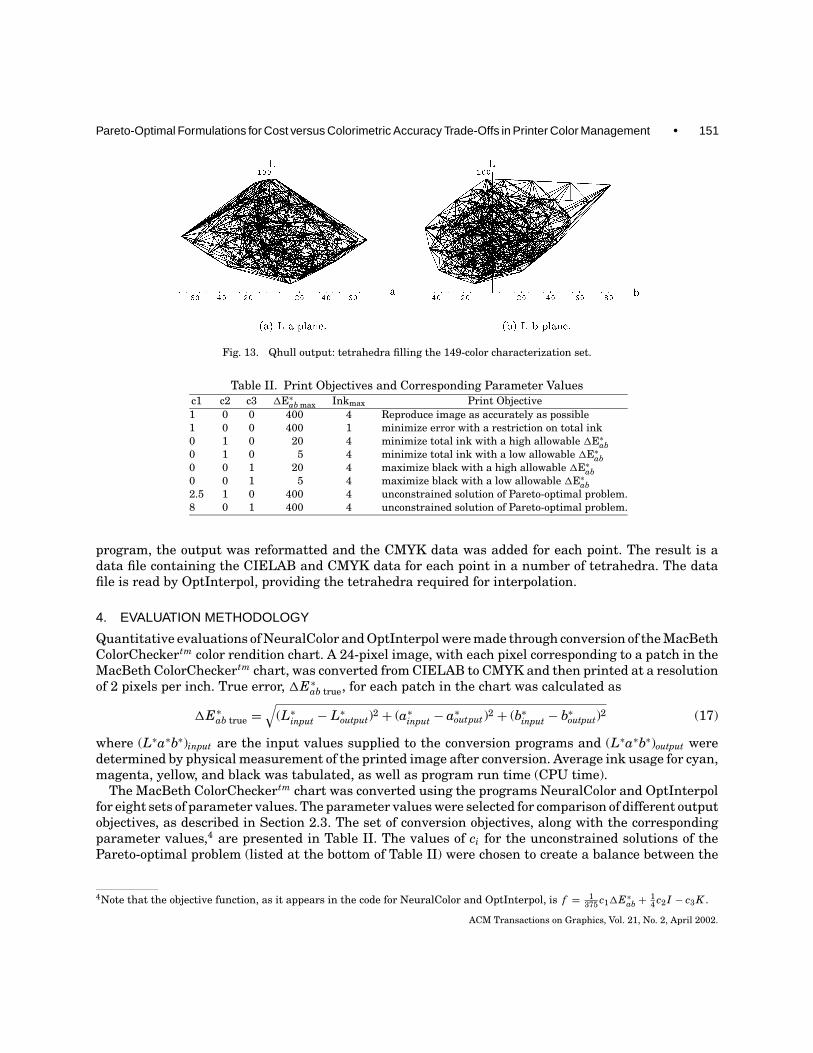
A solution to this problem was found in the code Qhull, a public domain program provided by TheGeometry Center, Minneapolis, Minnesota [Barber and Huhdanpaa 1998; Barber et al. 1996]. In thecontext of this research, Qhull is used to compute a three-dimensional Delaunay triangulation, resultingin a set of tetrahedra which completely fill the printer gamut and do not overlap one another. In total,826 tetrahedra were formed to fill the printer gamut, as illustrated in Figure 13. It is noted thatFigure 13 gives a depiction of the printer gamut similar to that of Balasubramanian and Dalal [1997],who used a modified convex hull algorithm to estimate printer gamut surfaces. After running the QhullACM Transactions on Graphics, Vol. 21, No. 2, April 2002.
Pareto-Optimal Formulations for Cost versus Colorimetric Accuracy Trade-Offs in Printer Color Management • 151
Fig. 13. Qhull output: tetrahedra filling the 149-color characterization set.
Table II. Print Objectives and Corresponding Parameter Valuesc1 c2 c3 1E∗ab max Inkmax Print Objective1 0 0 400 4 Reproduce image as accurately as possible1 0 0 400 1 minimize error with a restriction on total ink0 1 0 20 4 minimize total ink with a high allowable 1E∗ab0 1 0 5 4 minimize total ink with a low allowable 1E∗ab0 0 1 20 4 maximize black with a high allowable 1E∗ab0 0 1 5 4 maximize black with a low allowable 1E∗ab2.5 1 0 400 4 unconstrained solution of Pareto-optimal problem.8 0 1 400 4 unconstrained solution of Pareto-optimal problem.
program, the output was reformatted and the CMYK data was added for each point. The result is adata file containing the CIELAB and CMYK data for each point in a number of tetrahedra. The datafile is read by OptInterpol, providing the tetrahedra required for interpolation.
4. EVALUATION METHODOLOGY
Quantitative evaluations of NeuralColor and OptInterpol were made through conversion of the MacBethColorCheckertm color rendition chart. A 24-pixel image, with each pixel corresponding to a patch in theMacBeth ColorCheckertm chart, was converted from CIELAB to CMYK and then printed at a resolutionof 2 pixels per inch. True error, 1E∗ab true, for each patch in the chart was calculated as
1E∗ab true =√
(L∗input − L∗output)2 + (a∗input − a∗output)2 + (b∗input − b∗output)2 (17)
where (L∗a∗b∗)input are the input values supplied to the conversion programs and (L∗a∗b∗)output weredetermined by physical measurement of the printed image after conversion. Average ink usage for cyan,magenta, yellow, and black was tabulated, as well as program run time (CPU time).
The MacBeth ColorCheckertm chart was converted using the programs NeuralColor and OptInterpolfor eight sets of parameter values. The parameter values were selected for comparison of different outputobjectives, as described in Section 2.3. The set of conversion objectives, along with the correspondingparameter values,4 are presented in Table II. The values of ci for the unconstrained solutions of thePareto-optimal problem (listed at the bottom of Table II) were chosen to create a balance between the
4Note that the objective function, as it appears in the code for NeuralColor and OptInterpol, is f = 1375 c11E∗ab + 1
4 c2 I − c3 K .
ACM Transactions on Graphics, Vol. 21, No. 2, April 2002.

152 • D. Littlewood et al.
Table III. Ink Usage and CPU Time for Conversion of the MacBeth ColorCheckertm
Chart (24 Pixels) using NeuralColorc1 c2 c3 1E∗ab max Inkmax C M Y K Total Ink CPU Time (sec)
1 0 0 400 4 0.31 0.37 0.46 0.10 1.24 0.121 0 0 400 1 0.17 0.24 0.32 0.17 0.90 0.110 1 0 20 4 0.11 0.19 0.23 0.13 0.66 0.090 1 0 5 4 0.19 0.26 0.33 0.18 0.96 0.290 0 1 20 4 0.16 0.24 0.37 0.48 1.25 0.110 0 1 5 4 0.20 0.27 0.36 0.26 1.09 0.272.5 1 0 400 4 0.14 0.22 0.27 0.19 0.83 0.098 0 1 400 4 0.15 0.26 0.40 0.54 1.35 0.08
competing conversion objectives. Typical solution values for ink usage were in the neighborhood of 30%of the maximum possible ink usage (Imax possible = 4, Itypical ≈ 1.2, Kmax possible = 1, K typical ≈ .3). Typicalsolution values for 1E∗ab, however, were in the neighborhood of 5% of the maximum possible 1E∗ab (themaximum possible value for 1E∗ab is based on the ranges of L∗, a∗, and b∗ used in ICC profiles [ICC1998], 1E∗ab max possible =
√2562 + 2562 + 1002 ≈ 375, 1E∗ab typical ≈ 20). Due to the nature of these
solution values, careful selection of ci is required to avoid dominance of a single term in the objectivefunction. Note that setting 1E∗ab max equal to 400 and Inkmax equal to 4 is equivalent to removing theconstraints.
In addition to the parameter values listed in TableII, the MacBeth ColorCheckertm chart was con-verted with the objective of minimizing total ink with the constraint on 1E∗ab ranging from 0 to 20, andalso for the maximization of black ink with the constraint on 1E∗ab ranging from 0 to 20. These conver-sions were used to analyze ink usage as a function of the constraint on 1E∗ab and were not analyzed forcolorimetric accuracy, as is discussed in Section 5.2.
In addition to the quantitative data obtained through conversion of the MacBeth ColorCheckertm
chart, several Tiff images were converted for the purpose of subjectively evaluating the conversionschemes. Four images, each with its dominant tones falling in different regions of the printer gamut,were converted using both NeuralColor and OptInterpol. These results provide a qualitative feelfor the effects of different conversion objectives, something which is not provided by the numericalresults.
5. RESULTS
The programs NeuralColor and OptInterpol were successful in converting the MacBeth ColorCheckertm
color rendition chart with different sets of conversion parameters as described in the preceding section.Quantitative data from these conversions are included in Section 5.1. The colorimetric data presentedin Section 5.1 were averaged over three prints. Ink usage as a function of the constraint on 1E∗ab forthe minimization of total ink and the maximization of black ink is presented in Section 5.2. Section 5.3describes the image conversions used to evaluate the Pareto-optimal approaches qualitatively.
5.1 Quantitative Evaluations
The code NeuralColor was used to convert the MacBeth ColorCheckertm chart for each of the eightprescribed parameter sets. Quantitative results for these conversions are presented in Tables III andIV. Ink usage (CMYK) was tabulated in terms of average dot fraction (0 ≤ CMYK ≤ 1). To determinewhich of the colors in the MacBeth ColorCheckertm chart are in-gamut, NeuralColor was used to convertthe image for minimization of1E∗ab with the constraint that1E∗ab be equal to zero. For any case in whichACM Transactions on Graphics, Vol. 21, No. 2, April 2002.
Pareto-Optimal Formulations for Cost versus Colorimetric Accuracy Trade-Offs in Printer Color Management • 153
Table IV. Colorimetric Accuracy of the Results Obtained with the ProgramNeuralColor
Overall In-gamut (14) Out-of-gamut (10)c1 c2 c3 1E∗ab max Inkmax 1E∗ab true 1E∗ab true 1E∗ab true
1 0 0 400 4 5.3 2.8 8.81 0 0 400 1 10.8 8.3 14.20 1 0 20 4 19.3 19.1 19.70 1 0 5 4 6.5 4.8 8.90 0 1 20 4 20.8 20.3 21.50 0 1 5 4 7.5 6.3 9.22.5 1 0 400 4 10.5 8.3 13.68 0 1 400 4 22.0 20.0 24.7
Table V. Ink Usage and CPU Time for Conversion of the MacBeth ColorCheckertm
Chart (24 Pixels) using OptInterpolc1 c2 c3 1E∗ab max Inkmax C M Y K Total Ink CPU Time (sec)
1 0 0 400 4 0.26 0.31 0.39 0.17 1.13 23.031 0 0 400 1 0.20 0.23 0.28 0.16 0.87 21.760 1 0 20 4 0.13 0.19 0.20 0.13 0.64 57.130 1 0 5 4 0.21 0.26 0.32 0.18 0.98 15.860 0 1 20 4 0.17 0.25 0.38 0.47 1.27 62.380 0 1 5 4 0.23 0.28 0.36 0.25 1.12 78.982.5 1 0 400 4 0.16 0.20 0.26 0.17 0.80 17.548 0 1 400 4 0.19 0.23 0.35 0.34 1.11 15.72
Table VI. Colorimetric Accuracy of the Results Obtained using the Program OptInterpolOverall In-gamut (15) Out-of-gamut (9)
c1 c2 c3 1E∗ab max Inkmax 1E∗ab true 1E∗ab true 1E∗ab true1 0 0 400 4 5.7 2.7 10.71 0 0 400 1 12.1 9.1 17.10 1 0 20 4 21.6 21.0 22.60 1 0 5 4 7.0 5.2 10.10 0 1 20 4 20.9 20.3 21.80 0 1 5 4 7.9 6.5 10.32.5 1 0 400 4 13.8 12.7 15.58 0 1 400 4 11.4 8.5 17.0
NeuralColor returned no solution, the color was determined to be out-of-gamut. Ten of the twenty-fourcolors were found to be out-of-gamut. Colorimetric error is listed separately for in-gamut and out-of-gamut colors in Table IV.
Results for the conversions of the MacBeth ColorCheckertm chart using each of the eight parame-ter sets are presented in Tables V and VI for OptInterpol. To determine which colors are in-gamut,OptInterpol was also used to convert the image for minimization of 1E∗ab with the constraint that1E∗ab be equal to zero. Using OptInterpol in this way, nine colors were found to be out-of-gamut. Thisresult differs from the result obtain using NeuralColor by one color, and illustrates that, in practice,the color-management system affects the obtainable gamut of a printing system. It is again worthnoting that the first conversion in Tables V and VI is equivalent to standard tetrahedral interpola-tion over an unevenly distributed data set in conjunction with a clipping algorithm for out-of-gamutcolors.
ACM Transactions on Graphics, Vol. 21, No. 2, April 2002.
154 • D. Littlewood et al.
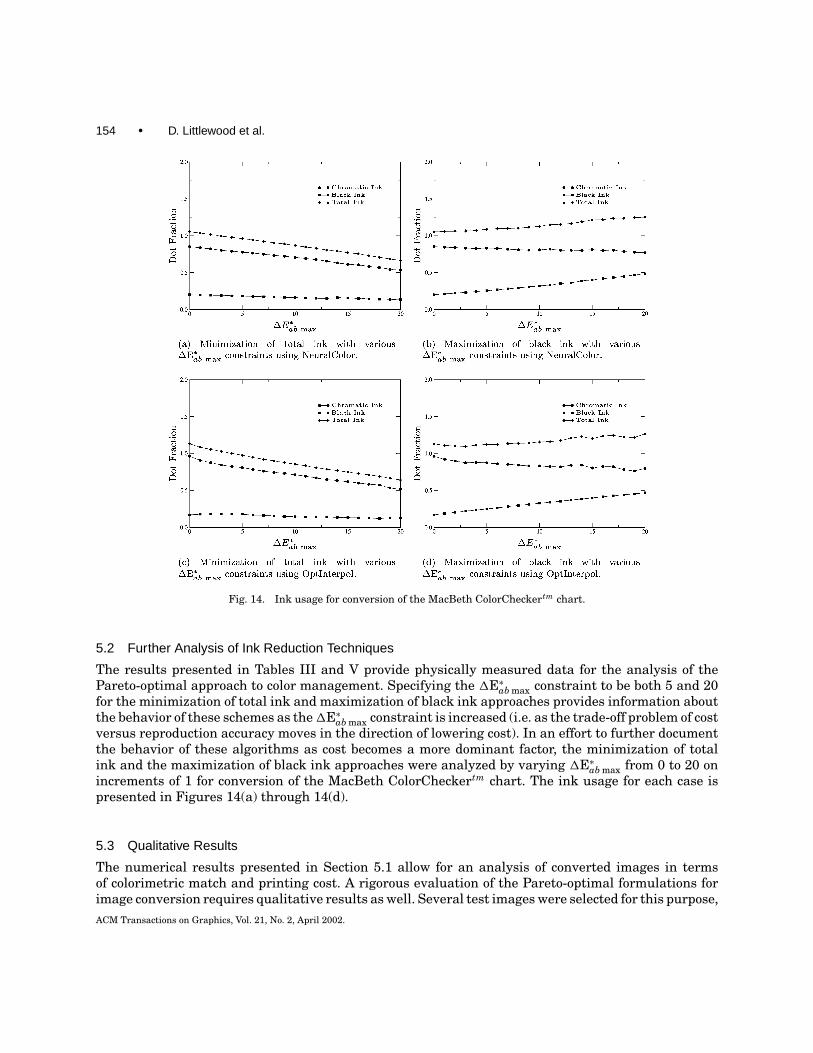
Fig. 14. Ink usage for conversion of the MacBeth ColorCheckertm chart.
5.2 Further Analysis of Ink Reduction Techniques
The results presented in Tables III and V provide physically measured data for the analysis of thePareto-optimal approach to color management. Specifying the 1E∗ab max constraint to be both 5 and 20for the minimization of total ink and maximization of black ink approaches provides information aboutthe behavior of these schemes as the1E∗ab max constraint is increased (i.e. as the trade-off problem of costversus reproduction accuracy moves in the direction of lowering cost). In an effort to further documentthe behavior of these algorithms as cost becomes a more dominant factor, the minimization of totalink and the maximization of black ink approaches were analyzed by varying 1E∗ab max from 0 to 20 onincrements of 1 for conversion of the MacBeth ColorCheckertm chart. The ink usage for each case ispresented in Figures 14(a) through 14(d).
5.3 Qualitative Results
The numerical results presented in Section 5.1 allow for an analysis of converted images in termsof colorimetric match and printing cost. A rigorous evaluation of the Pareto-optimal formulations forimage conversion requires qualitative results as well. Several test images were selected for this purpose,ACM Transactions on Graphics, Vol. 21, No. 2, April 2002.
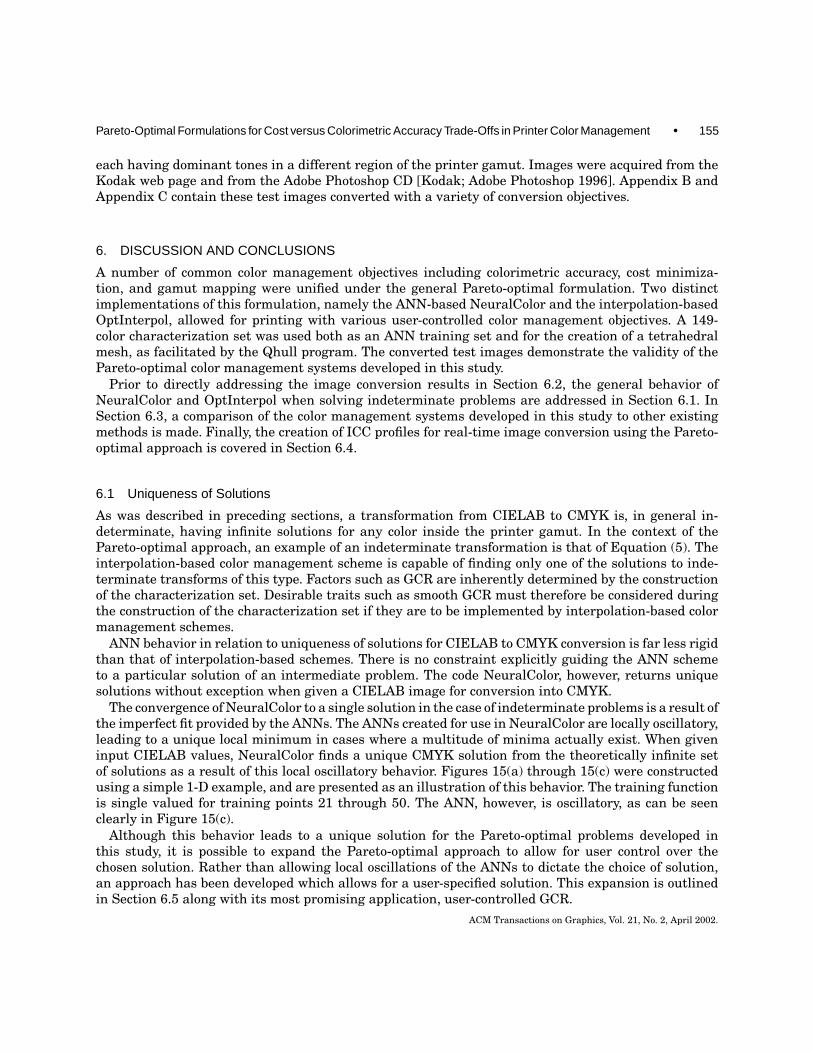
Pareto-Optimal Formulations for Cost versus Colorimetric Accuracy Trade-Offs in Printer Color Management • 155
each having dominant tones in a different region of the printer gamut. Images were acquired from theKodak web page and from the Adobe Photoshop CD [Kodak; Adobe Photoshop 1996]. Appendix B andAppendix C contain these test images converted with a variety of conversion objectives.
6. DISCUSSION AND CONCLUSIONS
A number of common color management objectives including colorimetric accuracy, cost minimiza-tion, and gamut mapping were unified under the general Pareto-optimal formulation. Two distinctimplementations of this formulation, namely the ANN-based NeuralColor and the interpolation-basedOptInterpol, allowed for printing with various user-controlled color management objectives. A 149-color characterization set was used both as an ANN training set and for the creation of a tetrahedralmesh, as facilitated by the Qhull program. The converted test images demonstrate the validity of thePareto-optimal color management systems developed in this study.
Prior to directly addressing the image conversion results in Section 6.2, the general behavior ofNeuralColor and OptInterpol when solving indeterminate problems are addressed in Section 6.1. InSection 6.3, a comparison of the color management systems developed in this study to other existingmethods is made. Finally, the creation of ICC profiles for real-time image conversion using the Pareto-optimal approach is covered in Section 6.4.
6.1 Uniqueness of Solutions
As was described in preceding sections, a transformation from CIELAB to CMYK is, in general in-determinate, having infinite solutions for any color inside the printer gamut. In the context of thePareto-optimal approach, an example of an indeterminate transformation is that of Equation (5). Theinterpolation-based color management scheme is capable of finding only one of the solutions to inde-terminate transforms of this type. Factors such as GCR are inherently determined by the constructionof the characterization set. Desirable traits such as smooth GCR must therefore be considered duringthe construction of the characterization set if they are to be implemented by interpolation-based colormanagement schemes.
ANN behavior in relation to uniqueness of solutions for CIELAB to CMYK conversion is far less rigidthan that of interpolation-based schemes. There is no constraint explicitly guiding the ANN schemeto a particular solution of an intermediate problem. The code NeuralColor, however, returns uniquesolutions without exception when given a CIELAB image for conversion into CMYK.
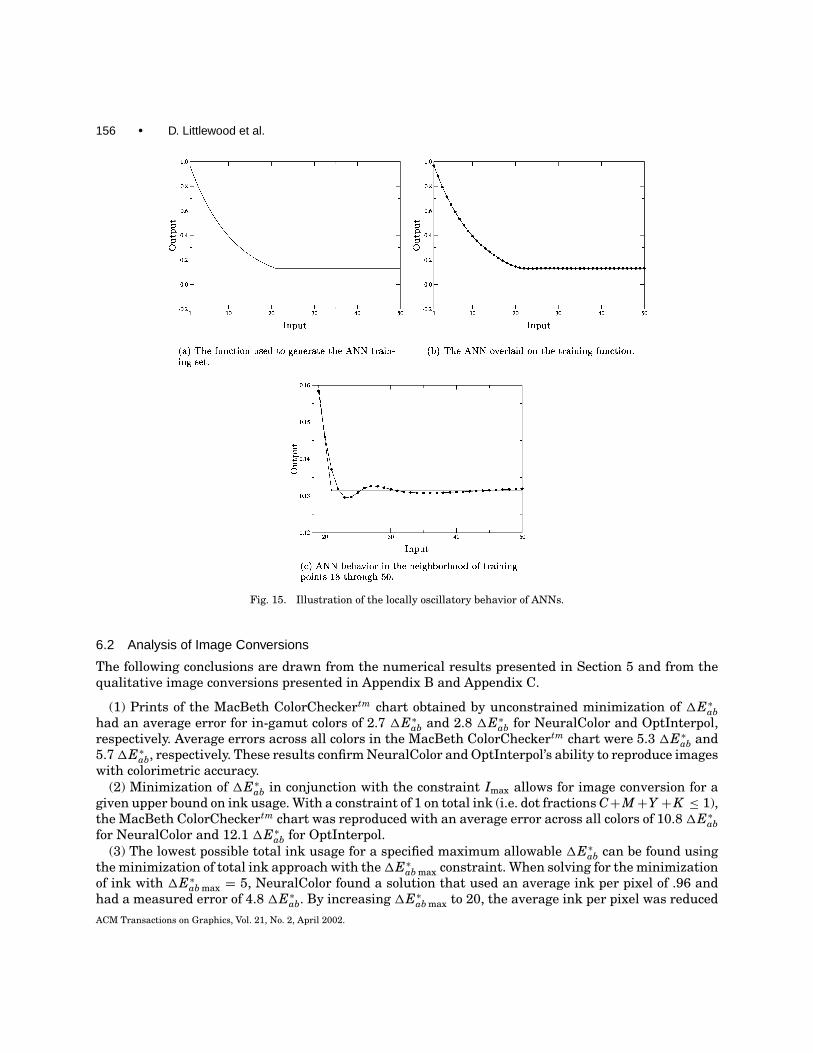
The convergence of NeuralColor to a single solution in the case of indeterminate problems is a result ofthe imperfect fit provided by the ANNs. The ANNs created for use in NeuralColor are locally oscillatory,leading to a unique local minimum in cases where a multitude of minima actually exist. When giveninput CIELAB values, NeuralColor finds a unique CMYK solution from the theoretically infinite setof solutions as a result of this local oscillatory behavior. Figures 15(a) through 15(c) were constructedusing a simple 1-D example, and are presented as an illustration of this behavior. The training functionis single valued for training points 21 through 50. The ANN, however, is oscillatory, as can be seenclearly in Figure 15(c).
Although this behavior leads to a unique solution for the Pareto-optimal problems developed inthis study, it is possible to expand the Pareto-optimal approach to allow for user control over thechosen solution. Rather than allowing local oscillations of the ANNs to dictate the choice of solution,an approach has been developed which allows for a user-specified solution. This expansion is outlinedin Section 6.5 along with its most promising application, user-controlled GCR.
ACM Transactions on Graphics, Vol. 21, No. 2, April 2002.
156 • D. Littlewood et al.
Fig. 15. Illustration of the locally oscillatory behavior of ANNs.
6.2 Analysis of Image Conversions
The following conclusions are drawn from the numerical results presented in Section 5 and from thequalitative image conversions presented in Appendix B and Appendix C.
(1) Prints of the MacBeth ColorCheckertm chart obtained by unconstrained minimization of 1E∗abhad an average error for in-gamut colors of 2.7 1E∗ab and 2.8 1E∗ab for NeuralColor and OptInterpol,respectively. Average errors across all colors in the MacBeth ColorCheckertm chart were 5.3 1E∗ab and5.71E∗ab, respectively. These results confirm NeuralColor and OptInterpol’s ability to reproduce imageswith colorimetric accuracy.
(2) Minimization of 1E∗ab in conjunction with the constraint Imax allows for image conversion for agiven upper bound on ink usage. With a constraint of 1 on total ink (i.e. dot fractions C+M+Y +K ≤ 1),the MacBeth ColorCheckertm chart was reproduced with an average error across all colors of 10.81E∗abfor NeuralColor and 12.1 1E∗ab for OptInterpol.
(3) The lowest possible total ink usage for a specified maximum allowable 1E∗ab can be found usingthe minimization of total ink approach with the1E∗ab max constraint. When solving for the minimizationof ink with 1E∗ab max = 5, NeuralColor found a solution that used an average ink per pixel of .96 andhad a measured error of 4.8 1E∗ab. By increasing 1E∗ab max to 20, the average ink per pixel was reducedACM Transactions on Graphics, Vol. 21, No. 2, April 2002.
Pareto-Optimal Formulations for Cost versus Colorimetric Accuracy Trade-Offs in Printer Color Management • 157
to .66 with an average measured error of 19.1 1E∗ab. Similar results were found with OptInterpol, asshown in Tables V and VI.
(4) Solutions for the minimization of total ink effectively lower the cost of printing by reducing totalink deposition. The savings in cost is off-set by an increase in 1E∗ab. The inverse relationship betweencost and colorimetric accuracy for the ink minimization approach is evidenced in Figures 14(a) and14(c).
(5) The maximization of black ink approach in conjunction with the constraint1E∗ab max is not effectivein reducing cost. As illustrated in Figures 14(a) and 14(d), the total ink deposition is not reduced as1E∗ab max is increased. This behavior is explained by the fact that the maximum GCR solution was foundwhen the 1E∗ab max constraint was set to zero. Increasing 1E∗ab max did not have the effect of increasingGCR, because the maximum GCR level had already been reached. Instead, increasing 1E∗ab max simplyresulted in the increased deposition of black. This both degraded the image and increased total inkdeposition (cost).
(6) Tighter constraints (e.g. lower 1E∗ab max or Imax) increase computational time.(7) The use of a mixed objective function balancing the minimization of1E∗ab and the minimization of
ink allows for compromise between the objectives of colorimetric accuracy and cost, without the intro-duction of constraints into the Pareto-optimal problem. The exclusion of constraints from the problemreduces computational time, but does not allow for strict upper bounds such as Imax. The parametersci governing these conversions must be chosen carefully to avoid dominance of a single term in thePareto-optimal solution.
(8) The tetrahedral-interpolation-based code OptInterpol requires extensive computational time incomparison to the ANN-based code NeuralColor. This is a result of OptInterpol’s repeated solving ofthe optimization problem for each tetrahedron in the characterization set.
(9) The results obtained using OptInterpol are comparable to the results obtained by NeuralColor,indicating that the 149-color characterization set is well selected for capturing the nonlinear natureof color printing. The characterization data are densely arranged in areas of high nonlinearity, andsparsely arranged in more linear regions, allowing the local linear models of interpolation to giveresults comparable to the global nonlinear ANN model despite the small overall size of the charac-terization set.
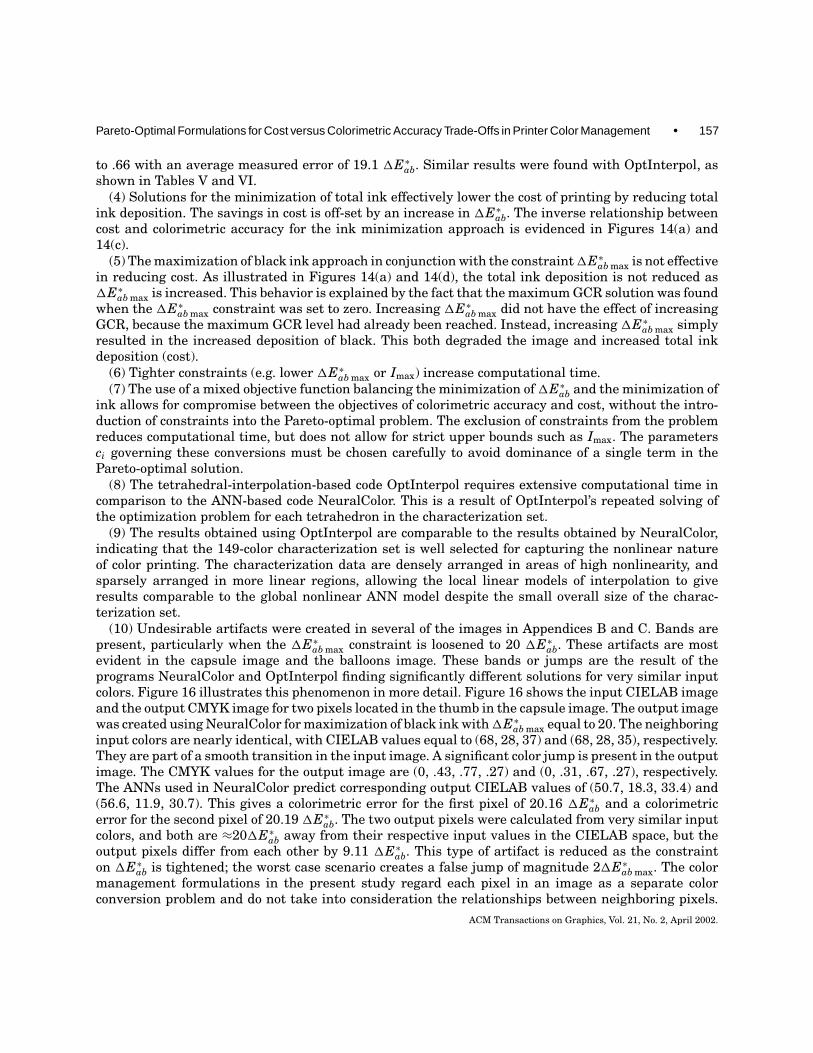
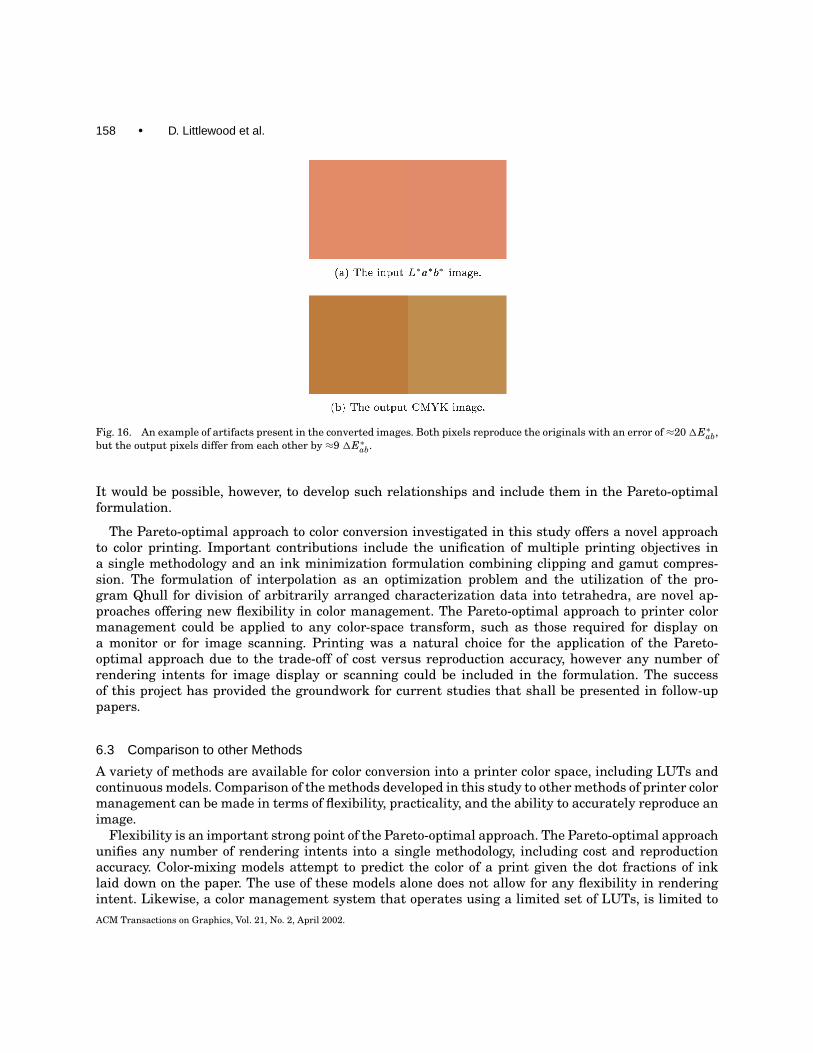
(10) Undesirable artifacts were created in several of the images in Appendices B and C. Bands arepresent, particularly when the 1E∗ab max constraint is loosened to 20 1E∗ab. These artifacts are mostevident in the capsule image and the balloons image. These bands or jumps are the result of theprograms NeuralColor and OptInterpol finding significantly different solutions for very similar inputcolors. Figure 16 illustrates this phenomenon in more detail. Figure 16 shows the input CIELAB imageand the output CMYK image for two pixels located in the thumb in the capsule image. The output imagewas created using NeuralColor for maximization of black ink with1E∗ab max equal to 20. The neighboringinput colors are nearly identical, with CIELAB values equal to (68, 28, 37) and (68, 28, 35), respectively.They are part of a smooth transition in the input image. A significant color jump is present in the outputimage. The CMYK values for the output image are (0, .43, .77, .27) and (0, .31, .67, .27), respectively.The ANNs used in NeuralColor predict corresponding output CIELAB values of (50.7, 18.3, 33.4) and(56.6, 11.9, 30.7). This gives a colorimetric error for the first pixel of 20.16 1E∗ab and a colorimetricerror for the second pixel of 20.19 1E∗ab. The two output pixels were calculated from very similar inputcolors, and both are ≈201E∗ab away from their respective input values in the CIELAB space, but theoutput pixels differ from each other by 9.11 1E∗ab. This type of artifact is reduced as the constrainton 1E∗ab is tightened; the worst case scenario creates a false jump of magnitude 21E∗ab max. The colormanagement formulations in the present study regard each pixel in an image as a separate colorconversion problem and do not take into consideration the relationships between neighboring pixels.
ACM Transactions on Graphics, Vol. 21, No. 2, April 2002.
158 • D. Littlewood et al.
Fig. 16. An example of artifacts present in the converted images. Both pixels reproduce the originals with an error of ≈201E∗ab,but the output pixels differ from each other by ≈9 1E∗ab.
It would be possible, however, to develop such relationships and include them in the Pareto-optimalformulation.
The Pareto-optimal approach to color conversion investigated in this study offers a novel approachto color printing. Important contributions include the unification of multiple printing objectives ina single methodology and an ink minimization formulation combining clipping and gamut compres-sion. The formulation of interpolation as an optimization problem and the utilization of the pro-gram Qhull for division of arbitrarily arranged characterization data into tetrahedra, are novel ap-proaches offering new flexibility in color management. The Pareto-optimal approach to printer colormanagement could be applied to any color-space transform, such as those required for display ona monitor or for image scanning. Printing was a natural choice for the application of the Pareto-optimal approach due to the trade-off of cost versus reproduction accuracy, however any number ofrendering intents for image display or scanning could be included in the formulation. The successof this project has provided the groundwork for current studies that shall be presented in follow-uppapers.
6.3 Comparison to other Methods
A variety of methods are available for color conversion into a printer color space, including LUTs andcontinuous models. Comparison of the methods developed in this study to other methods of printer colormanagement can be made in terms of flexibility, practicality, and the ability to accurately reproduce animage.
Flexibility is an important strong point of the Pareto-optimal approach. The Pareto-optimal approachunifies any number of rendering intents into a single methodology, including cost and reproductionaccuracy. Color-mixing models attempt to predict the color of a print given the dot fractions of inklaid down on the paper. The use of these models alone does not allow for any flexibility in renderingintent. Likewise, a color management system that operates using a limited set of LUTs, is limited toACM Transactions on Graphics, Vol. 21, No. 2, April 2002.
Pareto-Optimal Formulations for Cost versus Colorimetric Accuracy Trade-Offs in Printer Color Management • 159
the conversions defined in those LUTs. The ability to print with arbitrary rendering intent, sets thePareto-optimal approach apart from other existing methods.
A shortcoming of NeuralColor and OptInterpol is the extensive computational time required for print-ing. The Pareto-optimal approach requires the solution of a general equality- and inequality-constrainednonlinear optimization problem. This type of optimization problem must be solved iteratively, requir-ing extensive computation in comparison to simply evaluating an equation or performing interpolationinside a LUT. The program WriteICC was developed for the creation of ICC profiles in order to facilitatereal-time image conversion using the Pareto-optimal approach. Section 6.4 covers the creation of ICCprofiles with arbitrary rendering intent using the Pareto-optimal approach. For any given renderingintent, an ICC profile can be created and stored in a library for later use. The computational time forcreating an ICC profile is equivalent to the time required for conversion of an equivalently-sized image,but once the profile is created it can be used for real-time conversion of any image and is suitable foruse in a variety of commercial image processing codes.
To evaluate the ability of the color management systems developed in this study to accurately repro-duce an image, a number of studies have been selected from the literature for comparison. Comparisonsare best made with studies in which results were presented for measured print data, as opposed to printsimulations or comparison to other mathematical models of the printing process. The literature citedfor comparison presents data for image conversion with the intent of colorimetric match. This intentwas implemented in the present study through the unconstrained minimization of 1E∗ab, for whichNeuralColor and OptInterpol had average errors of 2.8 1E∗ab and 2.7 1E∗ab for in-gamut colors in theMacBeth ColorCheckertm chart, and errors of 5.3 1E∗ab and 5.7 1E∗ab across all colors in the MacBethColorCheckertm chart. The data cited in the following paragraphs show that the ability of the colormanagement systems developed in this study is comparable to, and often exceeds, that of other existingmethods.
Kang [1994] presented an extensive evaluation of various color mixing models including the Neuge-bauer equations, the Yule-Nielsen model, the Clapper-Yule model, the Beer-Bouguer law, the Kubelka-Monk model, and several hybrid approaches. A range of values was used in the model parameters ineach case, for a total of 52 cases. Modal parameters were determined using 10-level color wedges foreach primary. A Canon Color Laser Copier 500 (CLC-500) was used for printing in the study. The bestresults for modeling CMY printing over 64 test patches was 5.01 1E∗ab for a single-constant Kubelka-Munk equation with a halftone correction factor. The same model had an average error of 7.15 1E∗abwhen applied to CMYK printing and tested over 58 patches. Iino and Berns [1998] evaluated theaccuracy of the Murry-Davies-Yule-Nielsen and the Omatsu models. Model parameters were calcu-lated using data from 57 print samples. Average testing errors over an independent data set were 4.2and 3.9 1E∗ab for the Murray-Davies-Yule-Nielsen and the Omatsu models, respectively. Rolleston andBalasubramanian [1993] evaluated the accuracy of various types of Neugebauer models using a Xerox5775 color printer. Results were obtained by printing 1000 random samples; average errors rangedfrom 2.600 1E∗ab for cellular Yule-Nielsen modified Neugebauer Equations, to 7.414 1E∗ab for the basic(unmodified) Neugebauer equations. The various Neugebauer equations required 16 characterizationmeasurements. Mongeon [1996] presented results for image transformations using 4th-order polyno-mial regression models. A Xerox 5760 printer was modeled using a 360-color test print, and test resultswere presented for the Kodak Q60 print (236 colors). Average error over the entire test print was3.56 1E∗ab, and the average error for in-gamut colors was reported to be 2.47 1E∗ab. Nin, Kasson, andPlouffe [1992] evaluated a tri-linear interpolation scheme for conversion from CIELAB to CMY. Aninterpolation table was constructed for a DuPont 4Cast using colors at constant hue angles of 30, 90,150, 210, 270, and 330 degrees, with squares 5 units apart in luminance and chroma. The MacBethColorCheckertm Chart was then reproduced with an average error of 2.8 1E∗ab across all colors.
ACM Transactions on Graphics, Vol. 21, No. 2, April 2002.
160 • D. Littlewood et al.
Results from other studies that used ANNs to create printer models are highly relevant to the presentstudy. A study by Kang and Anderson [1992] investigated the use of ANNs for scanner and printercalibration. To examine the use of ANNs as printer models, a Kodak Q60-C print (236 colors) was usedto train an ANN for a Canon Color Laser Copier-500 (CLC-500). A number of the data were removedfrom the training set and used as testing data, with average errors of about 6 1E∗ab. Arai, Nakano, andIga [1993] used a neural network for modeling the transformation from CIELAB to CMY. A sampleset of 9261 colors was measured, and a neural network was then trained repeatedly, using randomlyselected subsets of between 8 and 125 colors until the 9261-color set was exhausted. Final testingusing 125 colors chosen at random from the 9261-color set gave an average error of 2.91 1E∗ab for themost accurate of the ANNs. Tominaga [1993, 1996, 1998a] has authored several papers on the use ofANNs for modeling color conversion into a printer color space. In one case, Tominaga trained an ANNusing 216 pairs of RGB and XYZ data to model a Shinko Electric model CHC-S443 dye sublimationprinter [Tominaga 1993]. The ANN model was then tested over 125 colors with an average error of2.61 1E∗ab. Tominaga [1996] also conducted a study using a thermal transfer-dye sublimation printer.An ANN was trained with 4096 samples, and results showed a mean error of 2.5 1E∗ab over 150 testcolors. In a later study, Tominaga [1998a] conducted experiments with a dye sublimation printer andan ink jet printer. An ANN was trained using a 6561-color data set, and then tested using 148 colorpatches. The resulting RMS 1E∗ab was 2.24.
For a comparison of our method to readily available methods, the MacBeth Chart was printed usingthe Tektronix Phaser 740 ICC profile (Tkph7401.icm) with relative colorimetric rendering intent fromAdobe Photoshop 4.0.1. The average error was 11.4 1E∗ab. This relatively poor result is presumed tobe due largely to the fact that the ICC profile is intended to capture some average performance of theTektronix Phaser 740 under various printing conditions, with various paper stock, and so on. The colormanagement systems developed in the present study were calibrated using identical paper stock andsimilar environmental conditions to those present during testing and thus have a distinct advantageover the use of the ICC profile provided by Tektronix.
6.4 ICC Profile Generation
A shortcoming of the color management systems developed in this study is the extensive computationaltime required for image conversion. This issue was overcome through the development of the programWriteICC, which creates ICC profiles for use with a wide variety of commercial software. WriteICC wasdeveloped using guidelines set by the ICC, and was based largely on code provided by D. Wallner [ICC1998; Wallner 1998].
By inputting a regular grid in the CIELAB space into NeuralColor or OptInterpol, LUTs for CIELABto CMYK conversion were created. Likewise, a regular grid in CMYK was used for the creation ofLUTs for CMYK to CIELAB conversion. The Pareto-optimal formulation was not used in the case ofcreating LUTs for CMYK to CIELAB conversion; the functions f L(CMYK ), fa(CMYK ), and fb(CMYK )were simply used to predict CMYK given CIELAB. In the case of NeuralColor, the ANNs were used topredict CIELAB values given a set of CMYK values. In the case of OptInterpol, CIELAB values werepredicted using interpolation inside a 4-D LUT constructed using the 149-color characterization set.
By using the Pareto-optimal approach in conjunction with the program WriteICC, any number ofLUTs can be created with arbitrary rendering intent. These LUTs can then be stored in a customlibrary for later use. The computational effort required to create an ICC profile is equivalent to thatof directly reproducing an image using NeuralColor or OptInterpol, but once an ICC profile has beencreated, image conversion may be achieved in real time. The accuracy lost in the creation of an ICCprofile is a function of the profile size. As the density of the profile is increased, interpolation errorACM Transactions on Graphics, Vol. 21, No. 2, April 2002.
Pareto-Optimal Formulations for Cost versus Colorimetric Accuracy Trade-Offs in Printer Color Management • 161
decreases. Large profiles, however, require a significant amount of memory for storage, thus usersmust make a decision regarding the trade-off of accuracy versus memory usage.
The creation of ICC profiles using the Pareto-optimal approach allows for real-time image conversionwith arbitrary rendering intent and allows for integration with a variety of commercial software. Theloss of accuracy associated with building ICC profiles can be made negligible by creating a profile that issignificantly dense. ICC profile generation successfully removes the computational restrictions inherentin the Pareto-optimal approach to printer color management.
6.5 Current Work
A shortcoming of the ANN-based color management scheme is convergence to a single solution forindeterminate problems based on the local behavior of the ANNs. This behavior reduces control of GCRand can lead to inconsistent GCR across the image. An expansion of the Pareto-optimal approach hasbeen developed that allows for user control over GCR.
Indeterminate problems (e.g. Equation (5)) have a set of solutions for any in-gamut color. The solutionswithin this set are uniquely described in terms of GCR, that is to say the solutions differ only by thedot fraction of black ink. The solution for 0% GCR can be found using NeuralColor by minimizing Kwith 1E∗ab max = 0. Likewise, the solution for 100% GCR can be found by maximizing K with with1E∗ab max = 0. Maximizing or minimizing total ink with 1E∗ab max = 0 also yields the 0%-GCR and100%-GCR solutions, respectively. Once the 0%- and 100%-GCR solutions have been obtained for agiven color, any arbitrary GCR solution may be found by setting a constraint on black ink that forcesthe dot fraction of black ink to fall at some prescribed location between the dot fractions of black inkfor the 0%-GCR and 100%-GCR solutions. For example, if a 0%-GCR solution is found for a given colorin which the black dot fraction is equal to 0, and a 100%-GCR solution is found in which the black dotfraction is equal to .7, then a 50%-GCR solution may be found by minimizing 1E∗ab with the constraintthat K = .35. Alternatively, this methodology may be applied to the smallest chromatic dot fraction(i.e. a constraint may be placed on MIN(CMY).
The method of specifying the dot fraction of black or MIN(CMY) based on the 0%- and 100%-GCRsolutions overrides NeuralColor’s tendency to converge to a solution based on local ANN behaviorand allows for arbitrary, used-specified GCR. Users may specify GCR as a constant value, resultingin consistent GCR across an image, or users may supply a “GCR map,” which specifies GCR on apixel by pixel basis. An example application of the “GCR map” is the assignment of 100% GCR to textwithin an image. The expanded Pareto-optimal approach for user-controlled GCR has been verifiedusing a modified version of NeuralColor and is the subject of current research. Image conversions withconsistent GCR across the image have been free of the gradient jumps that are present in many of theprints obtained in the current study.
A second promising aspect of the ANN-based Pareto-optimal approach is its ability to model a CIELABto CMYK conversion based on a relatively small number of characterization measurements. This traitlends itself to the field of print device calibration. The remeasurement of the characterization set andretraining of the ANNs would yield a recalibrated printing system with significant savings in cost incomparison to remeasuring a typical LUT. ANNs may also be recalibrated by adding several heavilyweighted recalibration points to the training set followed by a retraining of the ANNs. A set of recali-bration points might be comprised of Neugebauer’s [1937] primaries: red, green, blue, cyan, magenta,yellow, black, and white. A third recalibration scheme is that of modeling printer drift directly, using anew set of ANNs. The original characterization set, or any LUT in general, could be modified using therecalibration ANNs to compensate for printer drift. ANN-based approaches to printer calibration areresearch topics currently under investigation.
ACM Transactions on Graphics, Vol. 21, No. 2, April 2002.
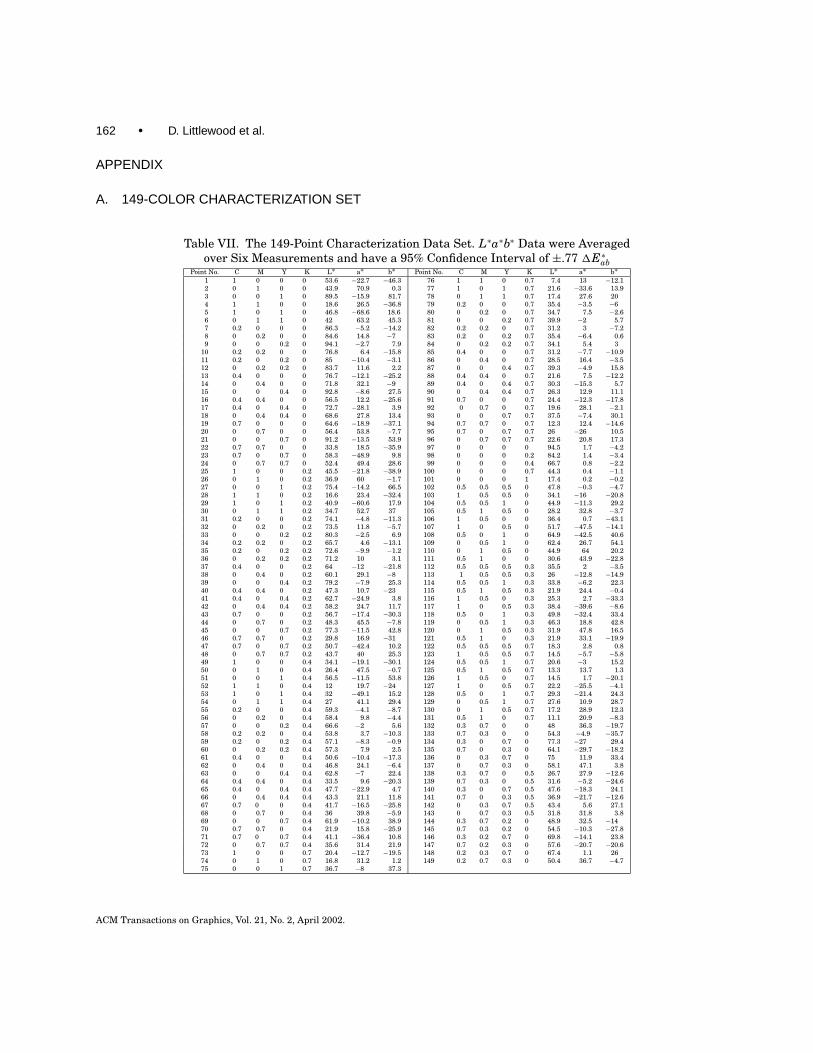
162 • D. Littlewood et al.
APPENDIX
A. 149-COLOR CHARACTERIZATION SET
Table VII. The 149-Point Characterization Data Set. L∗a∗b∗ Data were Averagedover Six Measurements and have a 95% Confidence Interval of ±.77 1E∗ab
Point No. C M Y K L∗ a∗ b∗ Point No. C M Y K L∗ a∗ b∗1 1 0 0 0 53.6 −22.7 −46.3 76 1 1 0 0.7 7.4 13 −12.12 0 1 0 0 43.9 70.9 0.3 77 1 0 1 0.7 21.6 −33.6 13.93 0 0 1 0 89.5 −15.9 81.7 78 0 1 1 0.7 17.4 27.6 204 1 1 0 0 18.6 26.5 −36.8 79 0.2 0 0 0.7 35.4 −3.5 −65 1 0 1 0 46.8 −68.6 18.6 80 0 0.2 0 0.7 34.7 7.5 −2.66 0 1 1 0 42 63.2 45.3 81 0 0 0.2 0.7 39.9 −2 5.77 0.2 0 0 0 86.3 −5.2 −14.2 82 0.2 0.2 0 0.7 31.2 3 −7.28 0 0.2 0 0 84.6 14.8 −7 83 0.2 0 0.2 0.7 35.4 −6.4 0.69 0 0 0.2 0 94.1 −2.7 7.9 84 0 0.2 0.2 0.7 34.1 5.4 3
10 0.2 0.2 0 0 76.8 6.4 −15.8 85 0.4 0 0 0.7 31.2 −7.7 −10.911 0.2 0 0.2 0 85 −10.4 −3.1 86 0 0.4 0 0.7 28.5 16.4 −3.512 0 0.2 0.2 0 83.7 11.6 2.2 87 0 0 0.4 0.7 39.3 −4.9 15.813 0.4 0 0 0 76.7 −12.1 −25.2 88 0.4 0.4 0 0.7 21.6 7.5 −12.214 0 0.4 0 0 71.8 32.1 −9 89 0.4 0 0.4 0.7 30.3 −15.3 5.715 0 0 0.4 0 92.8 −8.6 27.5 90 0 0.4 0.4 0.7 26.3 12.9 11.116 0.4 0.4 0 0 56.5 12.2 −25.6 91 0.7 0 0 0.7 24.4 −12.3 −17.817 0.4 0 0.4 0 72.7 −28.1 3.9 92 0 0.7 0 0.7 19.6 28.1 −2.118 0 0.4 0.4 0 68.6 27.8 13.4 93 0 0 0.7 0.7 37.5 −7.4 30.119 0.7 0 0 0 64.6 −18.9 −37.1 94 0.7 0.7 0 0.7 12.3 12.4 −14.620 0 0.7 0 0 56.4 53.8 −7.7 95 0.7 0 0.7 0.7 26 −26 10.521 0 0 0.7 0 91.2 −13.5 53.9 96 0 0.7 0.7 0.7 22.6 20.8 17.322 0.7 0.7 0 0 33.8 18.5 −35.9 97 0 0 0 0 94.5 1.7 −4.223 0.7 0 0.7 0 58.3 −48.9 9.8 98 0 0 0 0.2 84.2 1.4 −3.424 0 0.7 0.7 0 52.4 49.4 28.6 99 0 0 0 0.4 66.7 0.8 −2.225 1 0 0 0.2 45.5 −21.8 −38.9 100 0 0 0 0.7 44.3 0.4 −1.126 0 1 0 0.2 36.9 60 −1.7 101 0 0 0 1 17.4 0.2 −0.227 0 0 1 0.2 75.4 −14.2 66.5 102 0.5 0.5 0.5 0 47.8 −0.3 −4.728 1 1 0 0.2 16.6 23.4 −32.4 103 1 0.5 0.5 0 34.1 −16 −20.829 1 0 1 0.2 40.9 −60.6 17.9 104 0.5 0.5 1 0 44.9 −11.3 29.230 0 1 1 0.2 34.7 52.7 37 105 0.5 1 0.5 0 28.2 32.8 −3.731 0.2 0 0 0.2 74.1 −4.8 −11.3 106 1 0.5 0 0 36.4 0.7 −43.132 0 0.2 0 0.2 73.5 11.8 −5.7 107 1 0 0.5 0 51.7 −47.5 −14.133 0 0 0.2 0.2 80.3 −2.5 6.9 108 0.5 0 1 0 64.9 −42.5 40.634 0.2 0.2 0 0.2 65.7 4.6 −13.1 109 0 0.5 1 0 62.4 26.7 54.135 0.2 0 0.2 0.2 72.6 −9.9 −1.2 110 0 1 0.5 0 44.9 64 20.236 0 0.2 0.2 0.2 71.2 10 3.1 111 0.5 1 0 0 30.6 43.9 −22.837 0.4 0 0 0.2 64 −12 −21.8 112 0.5 0.5 0.5 0.3 35.5 2 −3.538 0 0.4 0 0.2 60.1 29.1 −8 113 1 0.5 0.5 0.3 26 −12.8 −14.939 0 0 0.4 0.2 79.2 −7.9 25.3 114 0.5 0.5 1 0.3 33.8 −6.2 22.340 0.4 0.4 0 0.2 47.3 10.7 −23 115 0.5 1 0.5 0.3 21.9 24.4 −0.441 0.4 0 0.4 0.2 62.7 −24.9 3.8 116 1 0.5 0 0.3 25.3 2.7 −33.342 0 0.4 0.4 0.2 58.2 24.7 11.7 117 1 0 0.5 0.3 38.4 −39.6 −8.643 0.7 0 0 0.2 56.7 −17.4 −30.3 118 0.5 0 1 0.3 49.8 −32.4 33.444 0 0.7 0 0.2 48.3 45.5 −7.8 119 0 0.5 1 0.3 46.3 18.8 42.845 0 0 0.7 0.2 77.3 −11.5 42.8 120 0 1 0.5 0.3 31.9 47.8 16.546 0.7 0.7 0 0.2 29.8 16.9 −31 121 0.5 1 0 0.3 21.9 33.1 −19.947 0.7 0 0.7 0.2 50.7 −42.4 10.2 122 0.5 0.5 0.5 0.7 18.3 2.8 0.848 0 0.7 0.7 0.2 43.7 40 25.3 123 1 0.5 0.5 0.7 14.5 −5.7 −5.849 1 0 0 0.4 34.1 −19.1 −30.1 124 0.5 0.5 1 0.7 20.6 −3 15.250 0 1 0 0.4 26.4 47.5 −0.7 125 0.5 1 0.5 0.7 13.3 13.7 1.351 0 0 1 0.4 56.5 −11.5 53.8 126 1 0.5 0 0.7 14.5 1.7 −20.152 1 1 0 0.4 12 19.7 −24 127 1 0 0.5 0.7 22.2 −25.5 −4.153 1 0 1 0.4 32 −49.1 15.2 128 0.5 0 1 0.7 29.3 −21.4 24.354 0 1 1 0.4 27 41.1 29.4 129 0 0.5 1 0.7 27.6 10.9 28.755 0.2 0 0 0.4 59.3 −4.1 −8.7 130 0 1 0.5 0.7 17.2 28.9 12.356 0 0.2 0 0.4 58.4 9.8 −4.4 131 0.5 1 0 0.7 11.1 20.9 −8.357 0 0 0.2 0.4 66.6 −2 5.6 132 0.3 0.7 0 0 48 36.3 −19.758 0.2 0.2 0 0.4 53.8 3.7 −10.3 133 0.7 0.3 0 0 54.3 −4.9 −35.759 0.2 0 0.2 0.4 57.1 −8.3 −0.9 134 0.3 0 0.7 0 77.3 −27 29.460 0 0.2 0.2 0.4 57.3 7.9 2.5 135 0.7 0 0.3 0 64.1 −29.7 −18.261 0.4 0 0 0.4 50.6 −10.4 −17.3 136 0 0.3 0.7 0 75 11.9 33.462 0 0.4 0 0.4 46.8 24.1 −6.4 137 0 0.7 0.3 0 58.1 47.1 3.863 0 0 0.4 0.4 62.8 −7 22.4 138 0.3 0.7 0 0.5 26.7 27.9 −12.664 0.4 0.4 0 0.4 33.5 9.6 −20.3 139 0.7 0.3 0 0.5 31.6 −5.2 −24.665 0.4 0 0.4 0.4 47.7 −22.9 4.7 140 0.3 0 0.7 0.5 47.6 −18.3 24.166 0 0.4 0.4 0.4 43.3 21.1 11.8 141 0.7 0 0.3 0.5 36.9 −21.7 −12.667 0.7 0 0 0.4 41.7 −16.5 −25.8 142 0 0.3 0.7 0.5 43.4 5.6 27.168 0 0.7 0 0.4 36 39.8 −5.9 143 0 0.7 0.3 0.5 31.8 31.8 3.869 0 0 0.7 0.4 61.9 −10.2 38.9 144 0.3 0.7 0.2 0 48.9 32.5 −1470 0.7 0.7 0 0.4 21.9 15.8 −25.9 145 0.7 0.3 0.2 0 54.5 −10.3 −27.871 0.7 0 0.7 0.4 41.1 −36.4 10.8 146 0.3 0.2 0.7 0 69.8 −14.1 23.872 0 0.7 0.7 0.4 35.6 31.4 21.9 147 0.7 0.2 0.3 0 57.6 −20.7 −20.673 1 0 0 0.7 20.4 −12.7 −19.5 148 0.2 0.3 0.7 0 67.4 1.1 2674 0 1 0 0.7 16.8 31.2 1.2 149 0.2 0.7 0.3 0 50.4 36.7 −4.775 0 0 1 0.7 36.7 −8 37.3
ACM Transactions on Graphics, Vol. 21, No. 2, April 2002.
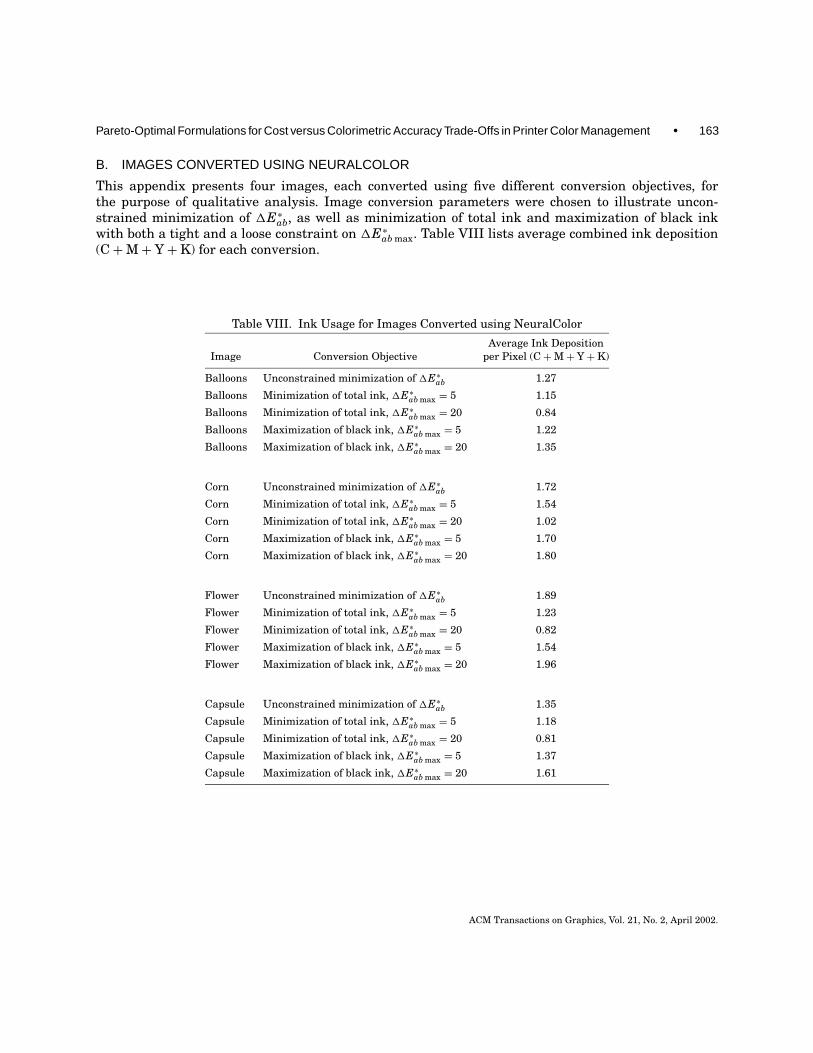
Pareto-Optimal Formulations for Cost versus Colorimetric Accuracy Trade-Offs in Printer Color Management • 163
B. IMAGES CONVERTED USING NEURALCOLOR
This appendix presents four images, each converted using five different conversion objectives, forthe purpose of qualitative analysis. Image conversion parameters were chosen to illustrate uncon-strained minimization of 1E∗ab, as well as minimization of total ink and maximization of black inkwith both a tight and a loose constraint on 1E∗ab max. Table VIII lists average combined ink deposition(C+M+ Y+K) for each conversion.
Table VIII. Ink Usage for Images Converted using NeuralColor
Average Ink DepositionImage Conversion Objective per Pixel (C+M+ Y+K)
Balloons Unconstrained minimization of 1E∗ab 1.27
Balloons Minimization of total ink, 1E∗ab max = 5 1.15
Balloons Minimization of total ink, 1E∗ab max = 20 0.84
Balloons Maximization of black ink, 1E∗ab max = 5 1.22
Balloons Maximization of black ink, 1E∗ab max = 20 1.35
Corn Unconstrained minimization of 1E∗ab 1.72
Corn Minimization of total ink, 1E∗ab max = 5 1.54
Corn Minimization of total ink, 1E∗ab max = 20 1.02
Corn Maximization of black ink, 1E∗ab max = 5 1.70
Corn Maximization of black ink, 1E∗ab max = 20 1.80
Flower Unconstrained minimization of 1E∗ab 1.89
Flower Minimization of total ink, 1E∗ab max = 5 1.23
Flower Minimization of total ink, 1E∗ab max = 20 0.82
Flower Maximization of black ink, 1E∗ab max = 5 1.54
Flower Maximization of black ink, 1E∗ab max = 20 1.96
Capsule Unconstrained minimization of 1E∗ab 1.35
Capsule Minimization of total ink, 1E∗ab max = 5 1.18
Capsule Minimization of total ink, 1E∗ab max = 20 0.81
Capsule Maximization of black ink, 1E∗ab max = 5 1.37
Capsule Maximization of black ink, 1E∗ab max = 20 1.61
ACM Transactions on Graphics, Vol. 21, No. 2, April 2002.
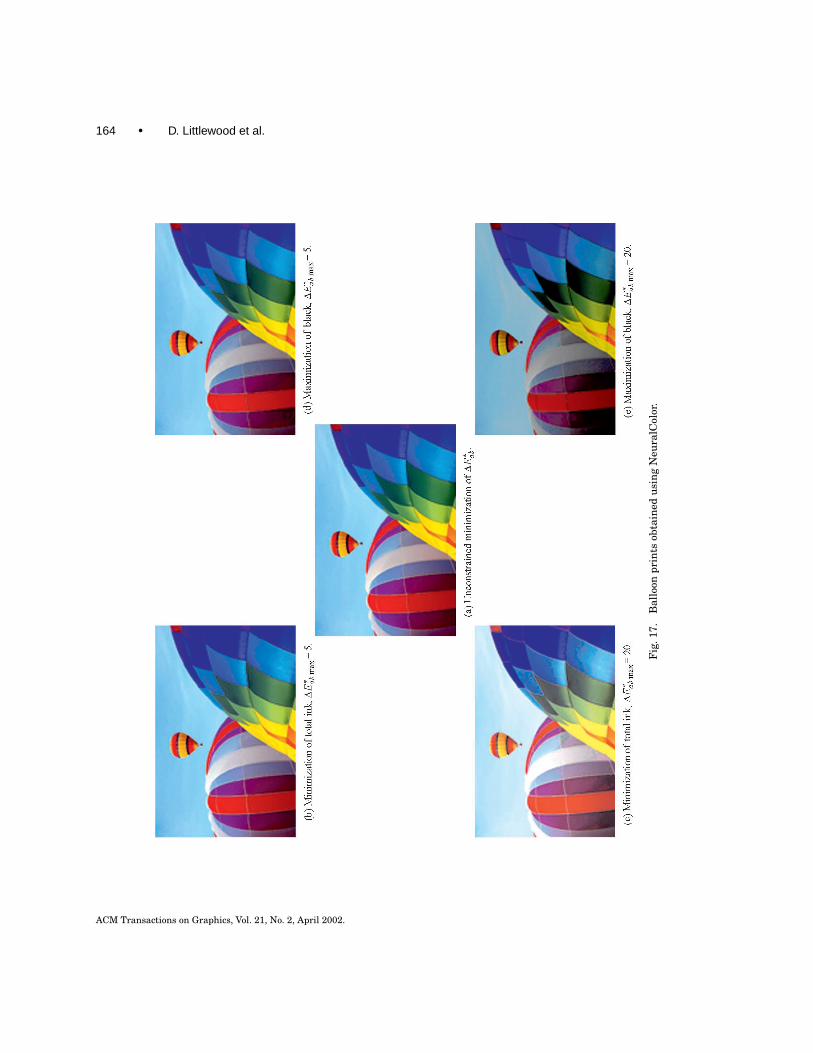
164 • D. Littlewood et al.
Fig
.17.
Bal
loon
prin
tsob
tain
edu
sin
gN
eura
lCol
or.
ACM Transactions on Graphics, Vol. 21, No. 2, April 2002.

Pareto-Optimal Formulations for Cost versus Colorimetric Accuracy Trade-Offs in Printer Color Management • 165
Fig
.18.
Cor
npr
ints
obta
ined
usi
ng
Neu
ralC
olor
.
ACM Transactions on Graphics, Vol. 21, No. 2, April 2002.
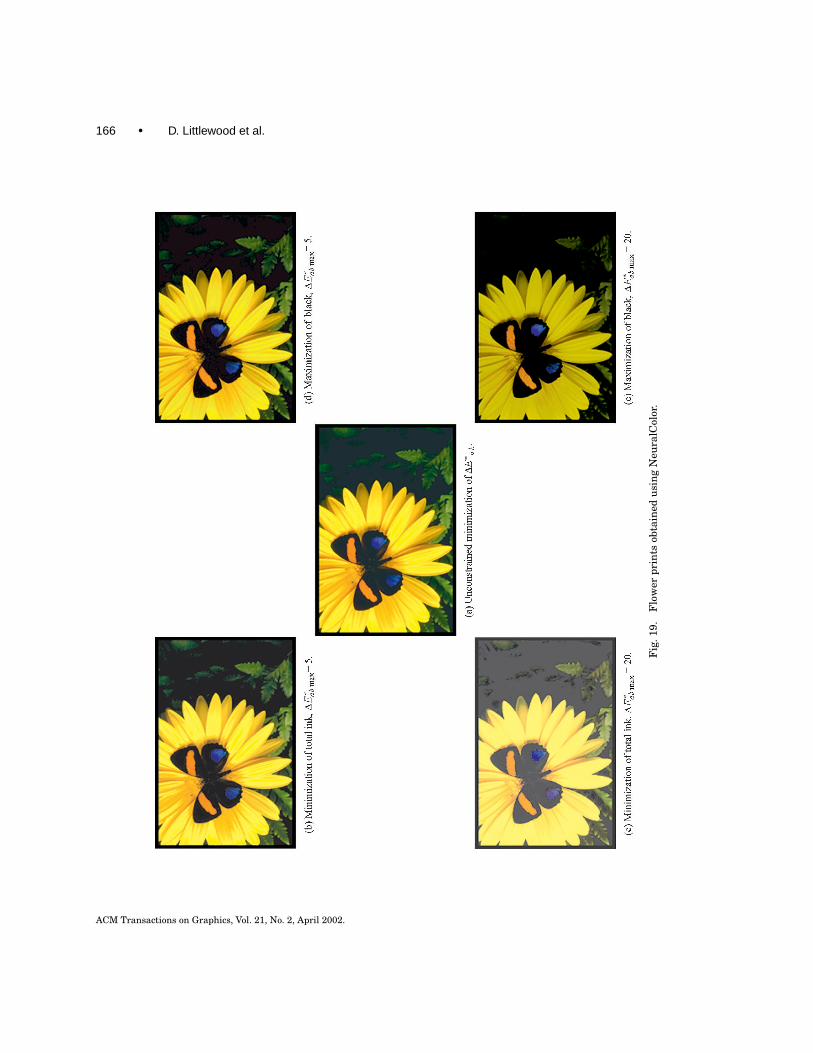
166 • D. Littlewood et al.
Fig
.19.
Flo
wer
prin
tsob
tain
edu
sin
gN
eura
lCol
or.
ACM Transactions on Graphics, Vol. 21, No. 2, April 2002.
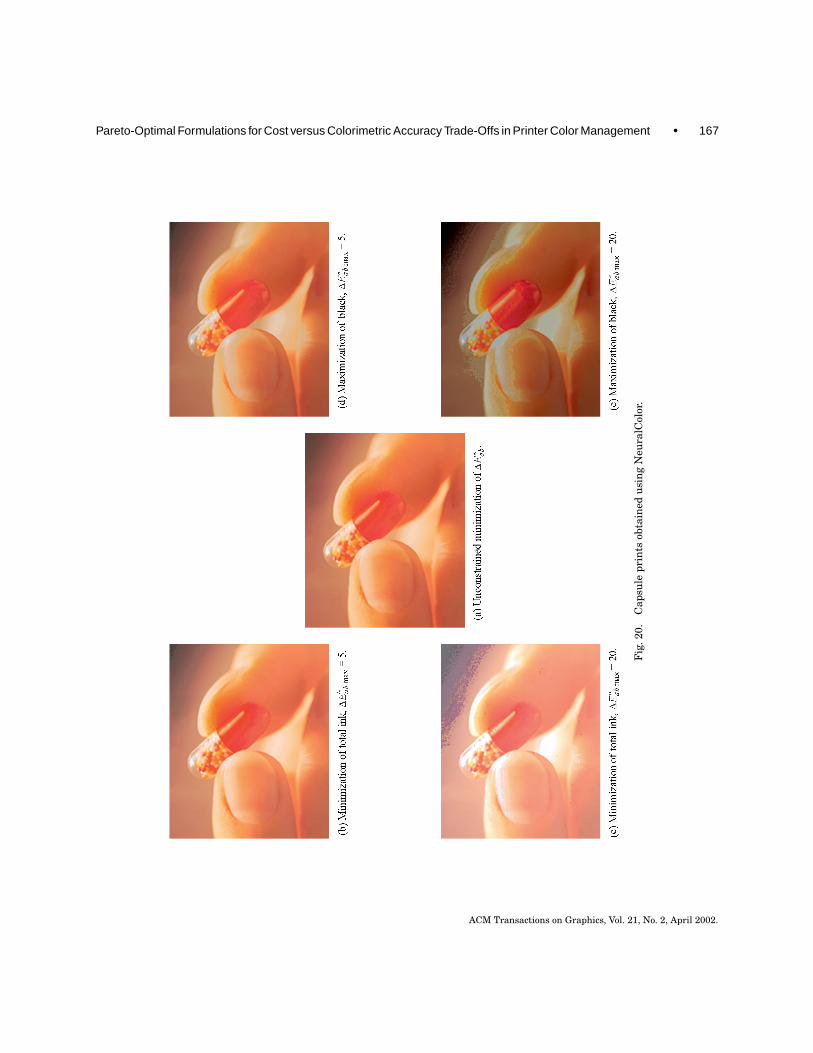
Pareto-Optimal Formulations for Cost versus Colorimetric Accuracy Trade-Offs in Printer Color Management • 167
Fig
.20.
Cap
sule
prin
tsob
tain
edu
sin
gN
eura
lCol
or.
ACM Transactions on Graphics, Vol. 21, No. 2, April 2002.
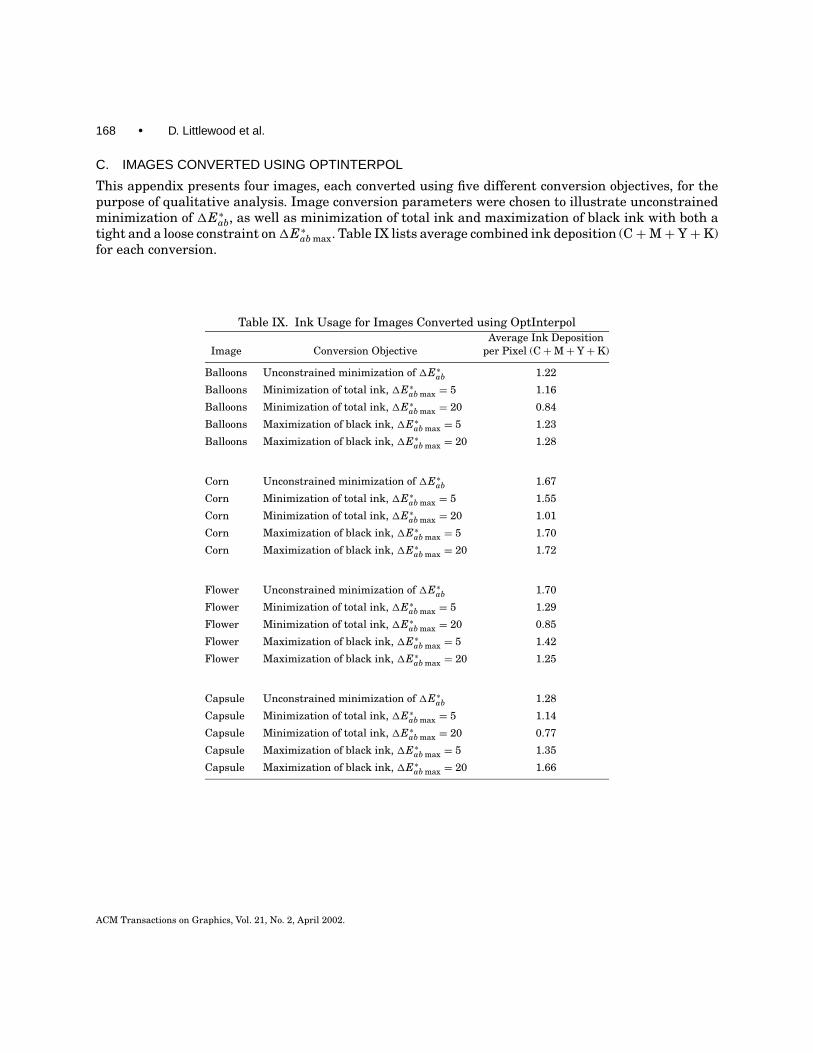
168 • D. Littlewood et al.
C. IMAGES CONVERTED USING OPTINTERPOL
This appendix presents four images, each converted using five different conversion objectives, for thepurpose of qualitative analysis. Image conversion parameters were chosen to illustrate unconstrainedminimization of 1E∗ab, as well as minimization of total ink and maximization of black ink with both atight and a loose constraint on1E∗ab max. Table IX lists average combined ink deposition (C+M+ Y+K)for each conversion.
Table IX. Ink Usage for Images Converted using OptInterpolAverage Ink Deposition
Image Conversion Objective per Pixel (C+M+ Y+K)
Balloons Unconstrained minimization of 1E∗ab 1.22
Balloons Minimization of total ink, 1E∗ab max = 5 1.16
Balloons Minimization of total ink, 1E∗ab max = 20 0.84
Balloons Maximization of black ink, 1E∗ab max = 5 1.23
Balloons Maximization of black ink, 1E∗ab max = 20 1.28
Corn Unconstrained minimization of 1E∗ab 1.67
Corn Minimization of total ink, 1E∗ab max = 5 1.55
Corn Minimization of total ink, 1E∗ab max = 20 1.01
Corn Maximization of black ink, 1E∗ab max = 5 1.70
Corn Maximization of black ink, 1E∗ab max = 20 1.72
Flower Unconstrained minimization of 1E∗ab 1.70
Flower Minimization of total ink, 1E∗ab max = 5 1.29
Flower Minimization of total ink, 1E∗ab max = 20 0.85
Flower Maximization of black ink, 1E∗ab max = 5 1.42
Flower Maximization of black ink, 1E∗ab max = 20 1.25
Capsule Unconstrained minimization of 1E∗ab 1.28
Capsule Minimization of total ink, 1E∗ab max = 5 1.14
Capsule Minimization of total ink, 1E∗ab max = 20 0.77
Capsule Maximization of black ink, 1E∗ab max = 5 1.35
Capsule Maximization of black ink, 1E∗ab max = 20 1.66
ACM Transactions on Graphics, Vol. 21, No. 2, April 2002.
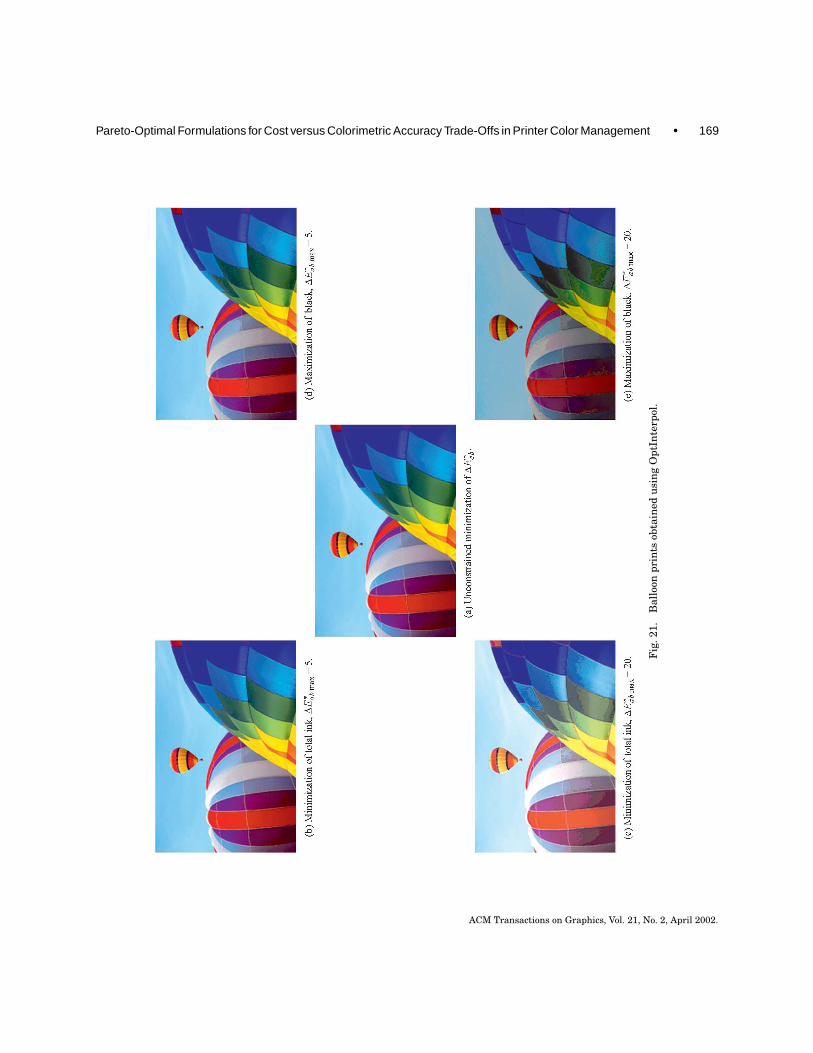
Pareto-Optimal Formulations for Cost versus Colorimetric Accuracy Trade-Offs in Printer Color Management • 169
Fig
.21.
Bal
loon
prin
tsob
tain
edu
sin
gO
ptIn
terp
ol.
ACM Transactions on Graphics, Vol. 21, No. 2, April 2002.

170 • D. Littlewood et al.
Fig
.22.
Cor
npr
ints
obta
ined
usi
ng
Opt
Inte
rpol
.
ACM Transactions on Graphics, Vol. 21, No. 2, April 2002.
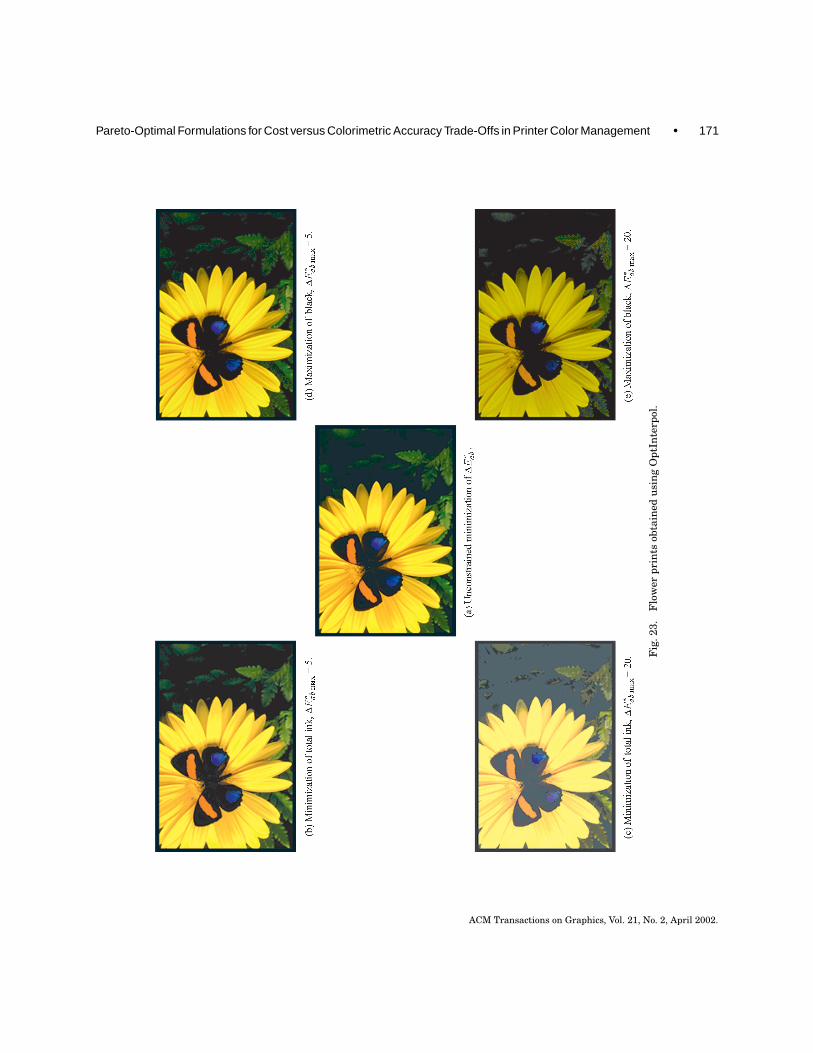
Pareto-Optimal Formulations for Cost versus Colorimetric Accuracy Trade-Offs in Printer Color Management • 171
Fig
.23.
Flo
wer
prin
tsob
tain
edu
sin
gO
ptIn
terp
ol.
ACM Transactions on Graphics, Vol. 21, No. 2, April 2002.

172 • D. Littlewood et al.
Fig
.24.
Cap
sule
prin
tsob
tain
edu
sin
gO
ptIn
terp
ol.
ACM Transactions on Graphics, Vol. 21, No. 2, April 2002.
Pareto-Optimal Formulations for Cost versus Colorimetric Accuracy Trade-Offs in Printer Color Management • 173
ACKNOWLEDGMENTS
Professor J. L. Zable, Mr. W. C. Decker Jr., and Dr. H. C. Lee are gratefully acknowledged for theirsupport throughout this study.
REFERENCES
ABE, S. AND MARCU, G. 1994. A neural network approach for RGB to YMCK color conversion. In Proceedings of IEEE Region10’s Ninth Annual International Conference: Frontiers of Computer Technology. IEEE, 6–9.
Adobe Photoshop 1996. Photoshop 4.0 application cd.ANSI. 1993. Graphic technology—input data for characterization of 4-color process printing. ANSI IT8.7/3-1993.ARAI, Y., NAKANO, Y., AND IGA, T. 1993. A method of transformation from CIELAB to CMY value by a three-layered neural
network. In IST and SID’s Color Imaging Conference: Transforms and Transportability of Color, 41–44.BALASUBRAMANIAN, R. AND DALAL, E. 1997. A method for quantifying the color gamut of an output device. In Color Imaging:
Device-Independent Color, Color Hard Copy, and Graphic Arts II. Vol. 3018. SPIE, 110–116.BARBER, C., DOBKIN, D., AND HUHDANPAA, H. 1996. The quickhull algorithm for convex hulls. ACM Trans. Math. Softw. 22, 4
(Dec.).BARBER, C. AND HUHDANPAA, H. 1998. Qhull version 2.5. For access to the program and documentation the following URL is
provided: http://www.geom.umn.edu/software/qhull/.BEER, A. 1852. Bestimmung der absorption des rothen lichts in farbigen flussigkeiten. Ann. Phys. Chem. 86, 2.BELYTSCHKO, T., KRONGAUZ, Y., ORGAN, D., FLEMING, M., AND KRYSL, P. 1996. Meshless methods: An overview and recent develop-
ments. Comput. Meth. Appl. Mech. Eng. 139, 1–47.BERNS, R. 1996. Methods for characterizing CRT displays. Displays 16, 4, 173–182.BIRKENSHAW, J., SCOTT-TAGGART, M., AND TRITTON, K. 1986. The black printer. Proc. Tech. Assoc. Graph. Arts 38, 403–429.BOUGUER, P. 1729. Essai d’optique sur la gradation de la lumiere. Claude Tombert, Paris.CIE. 1986. Colorimetry, second edition. Vienna, Austria. Publication CIE No. 15.2.CLAPPER, F. AND YULE, J. 1953. The effect of multiple internal reflections of the densities of half-tone prints on paper. J. Optical
Soc. Am. 43, 7 (July), 600–603.CLAPPER, F. AND YULE, J. 1955. Reproduction of color with halftone images. In Proc. Tech. Assoc. Graph. Arts. TAGA, 1–14.COWAN, W. 1983. An inexpensive scheme for calibration of a colour monitor in terms of CIE standard coordinates. Comput.
Graph. 17, 3 (July), 315–321.COWAN, W. 1987. CIE calibration of video monitors. Tech. rep., Division of Physics, National Research Council of Canada,
Ottawa, Ontario.DENNIS, J. J. AND SCHNABEL, R. 1983. Numerical Methods for Unconstrained Optimization and Nonlinear Equations. Prentice-
Hall, Inc., Englewood Cliffs, New Jersey.DRAKOPOULOS, P. 1997a. Color printer characterization using optimization theory and artificial neural networks. M.S. disser-
tation, University of Colorado Department of Mechanical Engineering, Boulder, Colorado.DRAKOPOULOS, P. 1997b. Color printer characterization using optimization theory and neural networks. Provisional U.S. Patent
60/066844.DRAKOPOULOS, P. 1998. Color printer characterization using optimization theory and neural networks. U.S. Patent 09/199626.FIELD, G. 1986. Color variability associated with printing GCR color separations. Proceedings Tech. Assoc. Graph. Arts 38,
145–157.GENTILE, R., WALOWIT, E., AND ALLEBACH, J. 1990. A comparison of techniques for color gamut mismatch compensation. J. Imag.
Tech. 16, 5 (Oct.), 176–181.GORDON, J., HOLUB, R., AND POE, R. 1987. On the rendition of unprintable colors. Proceedings of the Tech. Assoc. Graph. Arts 39,
186–195.GORI, M. AND TESI, A. 1992. On the problem of local minima in backpropagation. IEEE Trans. Pattern Anal. Mach. Intell. 14, 1
(Jan.), 76–86.HAYKIN, S. 1999. Neural Networks A Comprehensive Foundation. Prentice Hall, Upper Saddle River, NJ.HEUBERGER, K., JING, Z., AND PERSIEV, S. 1992. Color transformations and lookup tables. In Proc. Tech. Assoc. Graph. Arts.
TAGA, 863–881.HOLUB, R. AND KEARSLEY, W. 1989. Color to colorant conversions in a colorimetric separation system. In Neugebauer Memorial
Seminar on Color Reproduction. Vol. 1184. SPIE, 24–35.
ACM Transactions on Graphics, Vol. 21, No. 2, April 2002.

174 • D. Littlewood et al.
HOLUB, R., PEARSON, C., AND KEARSLEY, W. 1989. The black printer. J. Imag. Tech. 15, 4 (Aug.), 149–158.HORNIK, K., STINCHCOMBE, M., AND WHITE, H. 1989. Multilayer feedforward networks are universal approximators. Neural
Networks 2, 183–192.HUNG, P. 1992. Tetrahedral division technique applied to colorimetric calibration for imaging media. Proc. Soc. Imag. Sci.
Tech., 419–422.HUNG, P. 1993. Colorimetric calibration in electronic imaging devices using a look-up-table model and interpolations. J. Elect.
Imaging 2, 1 (Jan.), 53–61.HUNT, R. 1991. Measuring Colour, Second Edition. Ellis Horwood Limited, West Sussex, England.HUNTER, R. AND HAROLD, R. 1987. The Measurement of Appearance, Second Edition. John Wiley and Sons, New York, NY.ICC. 1998. Specification ICC.1:1998-09 file format for color profiles. http://www.color.org/.IINO, K. AND BERNS, R. 1998. Building color management modules using linear optimization I. desktop color system. J. Imaging
Sci. Tech. 42, 1 (January/February), 79–94.JENNINGS, E., HOLLAND, R., AND LEE, C. 1994. Error analysis of lookup table implementations in device-independent color
imaging systems. In Device-independent color imaging. Vol. 2170. SPIE, 98–107.JOHNSON, A. 1996. Methods for characterizing colour printers. Displays 16, 4, 193–202.JUNG, E. 1984. Programmed and complementary color reduction. Proc. Tech. Assoc. Graph. Arts 36, 135–150.KANAMORI, K. 1999. A study on interpolation errors and ripple artifacts of 3D lookup table method for nonlinear color conver-
sions. In Color Imaging: Device-Independent Color, Color Hardcopy, and Graphic Arts IV. Vol. 3648. SPIE, 167–178.KANAMORI, K. AND KOTERA, H. 1992. Color correction technique for hard copies by 4-neighbors interpolation method. J. Imaging
Sci. Tech. 36, 1, 73–80.KANG, H. AND ANDERSON, P. 1992. Neural network applications to the color scanner and printer calibrations. J. Elect. Imag-
ing 1, 2 (Apr.), 125–135.KANG, H. 1993. Comparisons of color mixing theories for use in electronic printing. In Color Imaging Conference: Transforms
& Trasportability of Color. IS&T/SID, 78–82.KANG, H. 1994. Applications of color mixing models to electronic printing. J. Elect. Imaging 3, 3 (July), 276–287.KANG, H. 1995a. Comparisons of three-dimensional interpolation techniques by simulations. In Device-independent color
imaging II, E. Walowit, Ed. Vol. 2414. SPIE, 104–114.KANG, H. 1995b. Printer-related color processing techniques. In Color Hard copy and Graphic Arts IV. Vol. 2413. SPIE,
410–419.KASSON, J. 1994. Tetrahedral interpolation algorithm accuracy. In Device-independent color imaging. Vol. 2170. SPIE,
24–35.KASSON, J., NIN, S., PLOUFFE, W., AND HAFNER, J. 1995. Performing color space conversions with three-dimensional linear
interpolation. J. Elect. Imaging 4, 3 (July), 226–250.KASSON, J. AND PLOUFFE, W. 1992. An analysis of selected computer interchange color spaces. ACM Trans. Graph. 11, 4 (Oct.),
373–405.KIM, C., KWEON, I., AND SEO, Y. 1997. Color and printer models for color halftoning. In Selected Papers on Digital Halftoning,
J. Allebach, Ed. Vol. MS 154. SPIE, 710–724.Kodak. Kodak. http://www.Kodak.com/.KUBELKA, P. 1948. New contributions to the optics of intensely light-scattering materials. part I. J. Opt. Soc. Am. 38, 448–457.KUBELKA, P. AND MUNK, F. 1931. Ein beitrag zur optik der farbanstriche. Z. Techn. Physik 12, 593.LESHNO, M., LIN, V., PINKUS, A., AND SCHOCKEN, S. 1993. Multilayer feedforward networks with a nonpolynomial activation
function can approximate any function. Neural Networks 6, 861–867.LITTLEWOOD, D. 2001. Printer color management using Pareto-optimization and efficient calibration techniques. Ph.D. disser-
tation, University of Colorado Department of Mechanical Engineering, Boulder, Colorado.LOOTSMA, F. A. 1985. Comparative performance evaluation, experimental design and generation of test problems in nonlinear
optimization. In Computational Math Programming, K. Schittkowski, Ed. Springer-Verlag.MARCU, G. AND IWATA, K. 1993. RGB-YMCK color conversion by application of the neural networks. In Color Imaging Conference:
Transforms & Trasportability of Color. IS&T/SID, 27–32.MCCAMY, C., MARCUS, H., AND DAVIDSON, J. 1976. A color-rendition chart. J. App. Photog. Eng. 2, 3 (summer), 95–99.MONGEON, M. 1996. Image transformation into device dependent color printer description using 4th-order polynomial regres-
sion and object oriented programming development of image processing modules. In Color Imaging: Device-independent Color,Color Hard Copy, and Graphic Arts. SPIE, 341–352.
MORE, J., GARBOW, B., AND HILLSTROM, K. 1980. User guide for minpack-1. Argonne National Laboratory Report ANL-80-74.
ACM Transactions on Graphics, Vol. 21, No. 2, April 2002.
Pareto-Optimal Formulations for Cost versus Colorimetric Accuracy Trade-Offs in Printer Color Management • 175
NAKAUCHI, S., HATANAKA, S., AND USUI, S. 1999. Color gamut mapping based on a perceptual image difference measure. ColorResearch and Application 24, 4 (Aug.), 280–291.
NAKAUCHI, S., IMAMURA, M., AND USUI, S. 1998. Color gamut mapping by minimizing perceptual differences between images.Systems and Computers in Japan 29, 10, 46–55.
NEUGEBAUER, H. 1937. Die theoretischen grundlagen des mehrfarbenbuchdrucks. Zeitschrift fur wissenschaftliche Photogra-phie Photophysik und Photochemie 36, 4 (Apr.), 73–89.
NIN, S., KASSON, J., AND PLOUFFE, W. 1992. Printing CIELAB images on a CMYK printer using tri-linear interpolation. In ColorHard Copy and Graphic Arts, J. Bares, Ed. Vol. 1670. SPIE, 316–324.
POWER, J., WEST, B., STOLLNITZ, E., AND SALESIN, D. 1996. Reproducing color images as duotones. In Proceedings of SIGGRAPH96, in Computer Graphics Proceedings, Annual Conference Series, 237–248.
PRAEFCKE, W. 1999. Robust and fast numerical color separation for mathematical printer models. In IS&T/SPIE Conferenceon Color Imaging: Device-independent Color, Color Hardcopy, and Graphic Arts IV. Vol. 3648. SPIE, 2–10.
ROLLESTON, R. AND BALASUBRAMANIAN, R. 1993. Accuracy of various types of neugebauer model. In Color Imaging Conference:Transforms & Trasportability of Color. IS&T/SID, 32–37.
RUSTEM, B. 1998. Algorithms for Nonlinear Programming and Multiple-objective Decisions. John Wiley and Sons, New York,NY.
SAYANAGI, K. 1987. Black printer, UCR and UCA—gray component replacement—. Proceedings of the Technical Associationof the Graphic Arts 39, 711–724.
SCHITTKOWSKI, K. 1985. NLPQL: A FORTRAN subroutine solving constrained nonlinear programming problems. Ann. Oper.Res. 5, 485–500.
SCHWARTZ, M., HOLUB, R., AND GILBERT, J. 1985. Measurements of gray component reduction in neutrals and saturated colors.Proc. Tech. Assoc. Graph. Arts 37, 16–27.
SONTAG, E. AND SUSSMANN, H. 1989. Backprogagation can give rise to spurious local minima even for networks without hiddenlayers. Complex Systems 3, 1 (Feb.), 91–106.
STADLER, W. 1988. Multi Criteria Optimization in Engineering and the Sciences. Plenum Press.STOLLNITZ, E., OSTROMOUKHOV, V., AND SALESIN, D. 1998. Reproducing color images using custom inks. In Proceedings of
SIGGRAPH 98, in Computer Graphics Proceedings, Annual Conference Series.STONE, M., COWAN, W., AND BEATTY, J. 1988. Color gamut mapping and the printing of digital color images. ACM Trans.
Graph. 7, 4 (Oct.), 249–292.SWOP. 1988. Recommended specifications web offset publications.TOMINAGA, S. 1993. A neural network approach to color reproduction in color printers. In IST and SID’s Color Imaging
Conference: Transforms and Transportability of Color, 173–177.TOMINAGA, S. 1996. Color control using neural networks and its application. In Color Imaging: Device-Independent Color,
Color Hardcopy, and Graphic Arts. Vol. 2658. SPIE, 253–260.TOMINAGA, S. 1998a. Color conversion using neural networks. In Color Imaging: Device-Independent Color, Color Hardcopy,
and Graphic Arts III. Vol. 3300. SPIE, 66–75.TOMINAGA, S. 1998b. Color scheme for printers using more than three color inks. In Electronic Imaging: Processing, Printing,
and Publishing in Color. Vol. 3409. SPIE, 286–293.VACHON, G. 1988. Modeling the mixing behavior of inks with polynomials. Color Research and Application 13, 1 (Feb.), 46–49.WALLNER, D. 1998. Building ICC profiles—the mechanics and engineering. This document is available for downloading at
www.color.org, the web site for the International Color Consortium.WIDDEL, H. AND POST, D., Eds. 1992. Color in Electronic Displays. Plenum Press, New York, NY.WYSZECKI, G. AND STILES, W. 1982. Color Science: Concepts and Methods, Quantitative Data and Formula. John Wiley and
Sons, New York, NY.XU, L. AND HOLUB, R. 1992. Color spaces for image representation and image processing. Proc. Tech. Assoc. Graph. Arts 45, 1,
114–137.YULE, J. 1967. Principles of Color Reproduction. John Wiley and Sons, New York, NY.YULE, J. AND NEILSEN, W. 1951. The penetration of light into paper and its effect on halftone reproduction. In Proc. Tech. Assoc.
Graph. Arts. TAGA, 65–76.ZIENKIEWICZ, O. AND TAYLOR, R. 1989. The Finite Element Method. McGraw-Hill, New York, NY.
Received January 2000; revised August 2001; accepted November 2001
ACM Transactions on Graphics, Vol. 21, No. 2, April 2002.