parks master plan city of san diego pmp survey results…in the spring of 2018, the pmp administered...
TRANSCRIPT

In the spring of 2018, the PMP administered a statistically valid survey to gather resident feedback on levels of satisfaction, needs, and priorities for the parks and recreation system.
Approximately 15,000 households received a survey with 1,898 responding. Results can assist in identifying priorities for park, facility, and programming investments.
The top investment priorities were similar across all City Council Districts.
Top Capital ActionsRespondents were more in favor of updating current parks and facilities than acquiring or developing new amenities.
City of San Diego PMP Survey Results
Very Important Somewhat Important Not Important
Satisfaction with Facilities & Programs
PARKS MASTER PLAN
Just over two-thirds (67%) of residents were satisfied or very satisfied with the City’s Parks and Recreation
Facilities/Programs
High Priority Investments In Recreation Facilities: 1. Beaches And Shoreline Parks2. Small Pocket Or Neighborhood Parks3. Open Space/Trails4. Off-leash Dog Parks5. Aquatic Complexes (Swimming Pools)
High Priority Investments In Recreation Programming: 1. Fitness And Wellness Programs2. Senior Adult Programs3. Ranger Led Hikes/Nature Programs4. Seasonal Special Park Events5. Adult Sports Programs
Other Findings:
• Residents strongly agreed that parks improve physical health and fitness and preserve open space and the environment
• Use of Regional Parks operated by the City is very high (92%)
• Residents emphasized the upgrading of existing parks and recreation facilities
• Residents selected security lighting and improved maintenance as the top actions to make parks feel more secure
• Priorities for smaller neighborhood parks, open space and trails, off-leash dog parks, fitness and wellness, senior programs, and nature programs were similar to meeting and online input
61% 31%Upgrade Security of Parks 8%
76% 20%Upgrade Existing Public Restrooms 4%
66% 29%Upgrade Existing Regional Parks 6%
66% 30%Upgrade Existing Public Parks 5%
64% 31%Upgrade Existing Beaches and Shoreline Parks 6%
Neutral25%
Dissatisfied6%
Very Dissatisfied
2%
Satisfied/Very Satisfied
67%

PMP Survey Results - Council District 9
High Priority Investments In Recreation Facilities: 1. Small Pocket or Neighborhood Parks2. Beaches and Shoreline Parks3. Open Space/Trails 4. Off-leash Dog Parks
Very Important Somewhat Important Not Important
District 9 Residents:
• Have a lower rate of participation in recreation programs (18.1%) than the City overall
• Show lower levels of satisfaction with programs and facilities than most residents (58.7%)
• Are likelier than any other District to cite security as a barrier to greater use of parks and facilities
High Priority Investments In Recreation Programming: 1. Fitness and Wellness2. Ranger Led Hikes/Nature Programs3. Seasonal Special Park Events4. Senior Adult Programs5. Art Programs6. Water Fitness Programs7. Learn to Swim Programs8. Adult Art, Dance, Performing Arts9. Adult Sports Programs
59% of District 9 residents are satisfied or very satisfied with Parks & Recreation Department facilities
and programs
Satisfaction with Facilities & Programs
PARKS MASTER PLAN
Top Capital Actions District 9 residents prioritize upgradesto existing parks and recreationfacilities
Survey results indicate that residents in District 9 have lower levels of satisfaction and rates of participation in programs than the City overall. Findings highlight a high number of important
but unmet recreation programming needs, including nature programs, special park events, senior adult programs, and water fitness. Residents also place more emphasize on acquiring
and developing additional parkland, open space, and trails than any other District.
Neutral32%
Dissatisfied6%
Very Dissatisfied
3%
78.1%
67.6%
69.3%
73.0%
51.1%
19.8%
29.7%
27.5%
22.2%
42.5%
2.1%
2.7%
3.2%
4.8%
6.4%
Upgrade Existing Public Restrooms
Upgrade Existing Beaches and Shoreline Parks
Upgrade Existing Public Parks
Upgrade Existing Regional Parks
Upgrade Existing Trails
Satisfied/Very Satisfied
59%

PMP Survey Results - Council District 8
High Priority Investments In Recreation Facilities:
1. Beaches and Shoreline Parks2. Off Leash Dog Parks3. Small Pocket or Neighborhood Parks4. Open Space/Trails5. Walking Tracks6. Aquatic Complexes7. Outdoor Exercise Equipment8. Recreation Centers9. Large Community Parks10. Bays and Lakes
Very Important Somewhat Important Not Important
District 8 Residents:
• Have a higher rate of participation in City recreation programs (23.6%) than residents overall
• Are likelier to respond that class/program full, security, maintenance, and distance from residence are barriers to participation
• Are less likely to use private fitness/health clubs
High Priority Investments In Recreation Programming: 1. Fitness and Wellness2. Learn to Swim3. Senior Adult4. Water Fitness5. Art6. Adult Sports7. After-School Youth8. Therapeutic Recreation9. Ranger Led Hikes/Nature Programs10. Seasonal Special Park Events
58% of District 8 residents are satisfied or very satisfied with Parks & Recreation Department facilities
and programs
Satisfaction with Facilities & Programs
PARKS MASTER PLAN
Top Capital Actions District 8 residents are likelier to choose upgrading of security as a top action to improve the park system than residents overall
66.1% 28.2% 5.7% Upgrade Existing Regional Parks
87.5% 9.8% 2.7% Upgrade Existing Public Restrooms
76.9% 19.2% 3.8% Upgrade Existing Public Parks
76.3% 21.5% 2.3% Upgrade Security of Parks
68.8% 28.3% 2.9% Upgrade Existing Beaches and Shoreline Parks
Neutral30%
Dissatisfied8%
Very Dissatisfied
4%
Survey results indicate that residents in Council District 8 have higher rates of participation in City programs but are likelier to cite barriers to participation due to security, maintenance, and program space. Residents identified a high number of important but unmet recreation program needs, including off-leash dog parks, learn to swim programs, water fitness, and
after-school youth programs.
Satisfied/Very Satisfied
58%

PMP Survey Results - Council District 7
High Priority Investments In Recreation Facilities:
1. Beaches and Shoreline Parks2. Small Pocket or Neighborhood Parks3. Off-leash Dog Parks4. Open Space/Trails 5. Recreation Centers6. Walking Tracks7. Aquatic Complexes (Swimming Pools)
Very Important Somewhat Important Not Important
District 7 Residents:
• Have a higher rate of participation in recreation programs (24.8%) than the City overall
• Show higher levels of satisfaction with programs and facilities than most residents (69.2%)
• Place more emphasis on upgrades to Recreation Centers than other Districts
High Priority Investments In Recreation Programming: 1. Fitness and Wellness2. Seasonal Special Park Events3. Senior Adult Programs4. Therapeutic Recreation Programs5. Ranger Led Hikes/Nature Programs6. Adult Sports Programs7. Art Programs8. Water Fitness Programs9. Adult Art, Dance, Performing Arts10. Learn to Swim Programs11. After-school Youth Programs
69% of District 7 residents are satisfied or very satisfied with Parks & Recreation Department facilities
and programs
Satisfaction with Facilities & Programs
PARKS MASTER PLAN
Top Capital Actions District 7 residents prioritize upgradesto existing parks and recreationfacilities
Survey results indicate that residents in District 7 have a higher level of satisfaction with facilities and programs and a higher rate of participation than the City overall. Residents identified more important but unmet recreation program needs than any other Council District. Needs include special park events, adult programs, and therapeutic recreation.
Neutral23%
Dissatisfied6%
Very Dissatisfied
2%
62.1%
63.7%
69.7%
62.8%
55.9%
33.9%
31.3%
24.9%
31.1%
37.9%
4.0%
5.0%
5.4%
6.1%
6.2%
Upgrade Existing Public Parks
Upgrade Existing Regional Parks
Upgrade Existing Public Restrooms
Upgrade Existing Beaches and Shoreline Parks
Upgrade Security of Parks
Satisfied/Very Satisfied
69%

PMP Survey Results - Council District 6
High Priority Investments In Recreation Facilities:
1. Beaches and Shoreline Parks2. Small Pocket or Neighborhood Parks 3. Recreation Centers4. Open Space/Trails5. Aquatic Complexes (Swimming Pools)6. Large Community Parks7. Bays and Lakes
Very Important Somewhat Important Not Important
District 6 Residents:
• Have a lower rate of participation in recreation programs (15.2%) than the City overall
• Show higher levels of satisfaction with programs and facilities than most residents (69.2%)
• Are likelier than all other Districts to cite lack of awareness as a barrier to participation
High Priority Investments In Recreation Programming: 1. Fitness and Wellness2. Ranger Led Hikes/Nature Programs3. Senior Adult Programs4. Seasonal Special Park Events5. Water Fitness Programs6. Art Programs7. Learn to Swim Programs8. Adult Sports Programs9. Adult Art, Dance, Performing Arts10. After-school Youth Programs
69% of District 6 residents are satisfied or very satisfied with Parks & Recreation Department facilities
and programs
Satisfaction with Facilities & Programs
PARKS MASTER PLAN
Top Capital Actions District 6 residents prioritize upgradesto existing parks and recreationfacilities
Survey results indicate that residents in District 6 have a higher level of satisfaction with facilities and programs but a lower rate of participation than the City overall. Findings show
interest in small neighborhood parks, upgraded Recreation Centers, senior adult programming, and aquatics, such as learning to swim and water fitness.
Neutral25%
Dissatisfied4%
Very Dissatisfied
2%
78.2%
65.8%
61.2%
63.4%
63.2%
19.2%
30.5%
34.0%
30.4%
30.5%
2.6%
3.7%
4.8%
6.2%
6.3%
Upgrade Existing Public Restrooms
Upgrade Existing Public Parks
Upgrade Security of Parks
Upgrade Existing Beaches and Shoreline Parks
Upgrade Existing Regional Parks
Satisfied/Very Satisfied
69%

PMP Survey Results - Council District 5
High Priority Investments In Recreation Facilities:
1. Beaches and Shoreline Parks2. Open Space/Trails3. Walking Tracks4. Small Pocket or Neighborhood Parks 5. Off-leash Dog Parks6. Aquatic Complexes (Swimming Pools)
Very Important Somewhat Important Not Important
District 5 Residents:
• Have a lower rate of participation in recreation programs (16.9%) than the City overall
• Show higher levels of satisfaction with programs and facilities than most residents (70.6%)
• Place more emphasis on open space and walking tracks than most residents
High Priority Investments In Recreation Programming: 1. Fitness and Wellness2. Senior Adult Programs3. Ranger Led Hikes/Nature Programs4. Adult Sports Programs
71% of District 5 residents are satisfied or very satisfied with Parks & Recreation Department facilities
and programs
Satisfaction with Facilities & Programs
PARKS MASTER PLAN
Top Capital Actions District 5 residents prioritize upgradesto existing facilities and parks with more emphasis on beaches andshoreline parks
Survey results indicate that residents in District 5 have a higher level of satisfaction with facilities and programs but a lower rate of participation than the City overall. Findings show
interest in more open space/trails, walking tracks, nature programs, and adult sports programs.
Neutral25%
Dissatisfied4%
Very Dissatisfied
0%
56.2%
73.6%
58.1%
59.9%
54.5%
38.5%
20.7%
35.5%
33.1%
36.4%
5.3%
5.7%
6.4%
7.0%
9.1%
Upgrade Existing Beaches and Shoreline Parks
Upgrade Existing Public Restrooms
Upgrade Existing Public Parks
Upgrade Existing Regional Parks
Upgrade Security of Parks
Satisfied/Very Satisfied
71%

PMP Survey Results - Council District 4
High Priority Investments In Recreation Facilities:
1. Beaches and Shoreline Parks2. Open Space/Trails3. Small Pocket or Neighborhood Parks 4. Bays and Lakes5. Large Community Parks 6. Walking Tracks7. Recretion Centers8. Aquatic Complexes (Swimming Pools)9. Outdoor Exercise Equipment10. Off-leash Dog Parks11. Nature Centers
Very Important Somewhat Important Not Important
District 4 Residents:
• Have the highest rate of participation in recreation programs (25.6%) among Districts
• Place more emphasis on adding large community parks and improving access to existing parks than residents overall
• Are likelier to cite security as a barrier to higher use of parks and faciliites
High Priority Investments In Recreation Programming: 1. Fitness and Wellness2. Senior Adult Programs3. Adult Sports Programs4. Martial Arts and Self Defense5. Adult Art, Dance, Performing Arts6. Learn to Swim Programs7. Art Programs8. Therapeutic Recreation Programs9. City-wide Special Park Events10. Water Fitness Programs
57% of District 4 residents are satisfied or very satisfied with Parks & Recreation Department facilities
and programs
Satisfaction with Facilities & Programs
PARKS MASTER PLAN
Top Capital Actions District 4 residents prioritize upgradesto existing facilities and parks with more emphasis on Recreation Centersand Sports Fields
Survey results indicate that residents in District 4 have the City’s highest level of participation in programs but show levels of satisfaction below the City overall. Residents identified more important, unmet recreation facility needs than any other District. Findings show interest in
more open space/trails, large community parks, and adult recreation programming.
Neutral28%Dissatisfied
11%
Very Dissatisfied
4%
73.5%
61.0%
79.8%
70.1%
62.2%
23.8%
35.2%
15.8%
25.4%
32.2%
2.7%
3.8%
4.4%
4.5%
5.6%
Upgrade Existing Public Parks
Upgrade Existing Regional Parks
Upgrade Existing Public Restrooms
Upgrade Security of Parks
Upgrade Existing Beaches and Shoreline Parks
Satisfied/Very Satisfied
57%

PMP Survey Results - Council District 3
High Priority Investments In Recreation Facilities:
1. Small Pocket or Neighborhood Parks2. Beaches and Shoreline Parks3. Open Space/Trails
Very Important Somewhat Important Not Important
District 3 Residents:
• Have the lowest rate of participation in recreation programs (13.8%) among Districts
• Are likelier to cite lack of awareness of programs as a barrier to higher participation (58.9%)
• Cite walking as a way to get to parks more than any other Council District
High Priority Investments In Recreation Programming: 1. Fitness and Wellness2. Ranger Led Hikes/Nature Programs3. Seasonal Special Park Events4. Art Programs5. Adult Sports Programs6. Adult Art, Dance, Performing Arts
68% of District 3 residents are satisfied or very satisfied with Parks & Recreation Department facilities
and programs
Satisfaction with Facilities & Programs
PARKS MASTER PLAN
Top Capital Actions District 3 residents prioritize upgradesto existing facilities and parks
Survey results indicate that residents in Council District 3 show levels of satisfaction with facilities and programs similar to the City overall but participate less in programs than other residents. Findings highlight important unmet needs for small pocket or neighborhood parks
and ranger led hikes and nature programs. Residents also emphasize the importance of acquiring additional parkland and open space more than residents overall.
Neutral23%
Dissatisfied7%
Very Dissatisfied
2%
75.1%
62.7%
69.3%
62.4%
57.0%
20.6%
31.6%
25.0%
30.5%
33.2%
4.3%
5.7%
5.7%
7.1%
9.8%
Upgrade Existing Public Restrooms
Upgrade Existing Public Parks
Upgrade Existing Regional Parks
Upgrade Existing Beaches and Shoreline Parks
Upgrade Security of Parks
Satisfied/Very Satisfied
68%
PMP Survey Results - Council District 2
High Priority Investments In Recreation Facilities:
1. Beaches and Shoreline Parks2. Off-leash Dog Parks3. Small Pocket or Neighborhood Parks
Very Important Somewhat Important Not Important
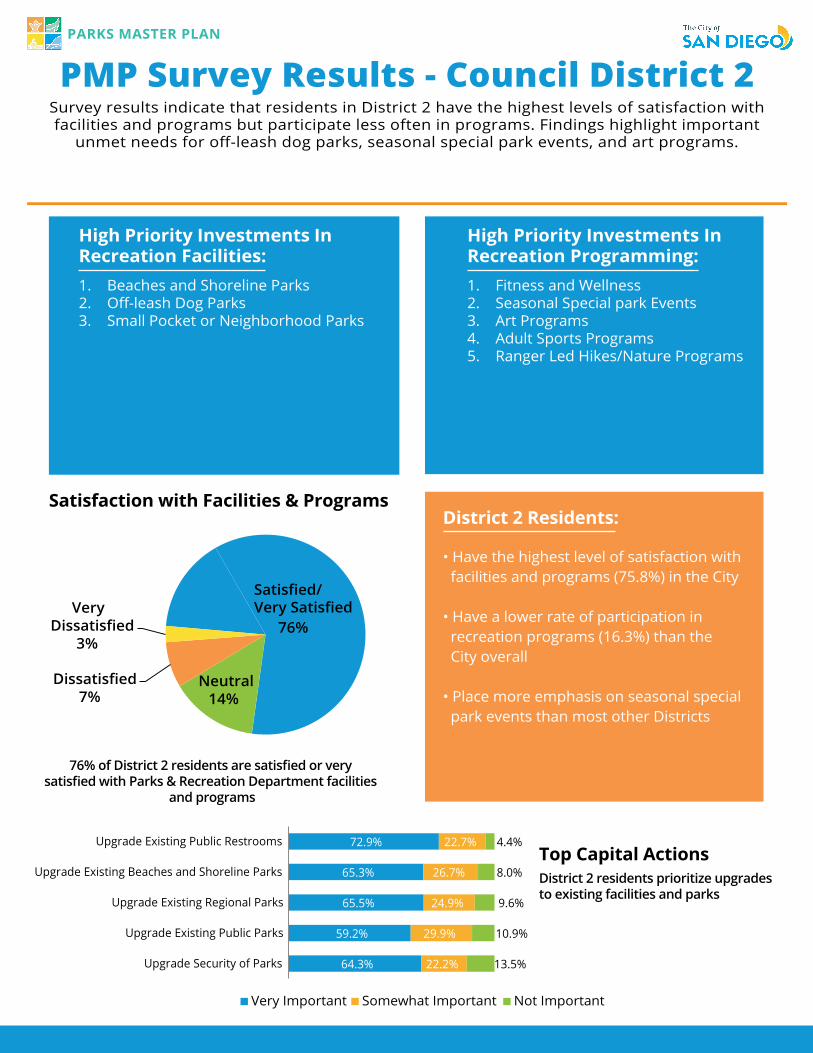
District 2 Residents:
• Have the highest level of satisfaction with facilities and programs (75.8%) in the City
• Have a lower rate of participation in recreation programs (16.3%) than the City overall
• Place more emphasis on seasonal special park events than most other Districts
High Priority Investments In Recreation Programming: 1. Fitness and Wellness2. Seasonal Special park Events3. Art Programs4. Adult Sports Programs5. Ranger Led Hikes/Nature Programs
76% of District 2 residents are satisfied or very satisfied with Parks & Recreation Department facilities
and programs
Satisfaction with Facilities & Programs
PARKS MASTER PLAN
Top Capital Actions District 2 residents prioritize upgradesto existing facilities and parks
Neutral14%
Dissatisfied7%
Very Dissatisfied
3%
72.9%
65.3%
65.5%
59.2%
64.3%
22.7%
26.7%
24.9%
29.9%
22.2%
4.4%
8.0%
9.6%
10.9%
13.5%
Upgrade Existing Public Restrooms
Upgrade Existing Beaches and Shoreline Parks
Upgrade Existing Regional Parks
Upgrade Existing Public Parks
Upgrade Security of Parks
Survey results indicate that residents in District 2 have the highest levels of satisfaction with facilities and programs but participate less often in programs. Findings highlight important
unmet needs for off-leash dog parks, seasonal special park events, and art programs.
Satisfied/Very Satisfied
76%

PMP Survey Results - Council District 1
High Priority Investments In Recreation Facilities:
1. Open Space/Trails 2. Off-leash Dog Parks3. Beaches and Shoreline Parks4. Small Pocket or Neighborhood Parks5. Aquatic Complexes (Swimming Pools)6. Walking Tracks
Very Important Somewhat Important Not Important
District 1 Residents:
• Have a higher level of satisfaction with facilities and programs (72.4%) than residents overall
• Have a higher rate of participation in recreation programs (24.8%) than the City overall
• Place more emphasis on open space and trails than any other Council District
High Priority Investments In Recreation Programming: 1. Fitness and Wellness2. Senior Adult Programs3. Ranger Led hikes/Nature Programs4. Seasonal Special Park Events5. Adult Art, Dance, Performing Arts3. Art Programs4. Adult Sports Programs
72% of District 1 residents are satisfied or very satisfied with Parks & Recreation Department facilities
and programs
Satisfaction with Facilities & Programs
PARKS MASTER PLAN
Top Capital Actions District 1 residents prioritize upgradesto existing parks, especially regional parks
Survey results indicate that residents in District 1 have one of the City's highest rates of participation in recreation programs and show high levels of satisfaction with facilities and
programs. Findings highlight important unmet needs for open space and trails, off-leash dog parks, and senior adult programs.
Satisfied/Very Satisfied
72%
Neutral23%
Dissatisfied4%
Very Dissatisfied
1%
72.8%
67.5%
62.8%
66.1%
47.3%
25.1%
29.4%
33.5%
28.1%
40.1%
2.1%
3.1%
3.7%
5.8%
12.6%
Upgrade Existing Public Restrooms
Upgrade Existing Regional Parks
Upgrade Existing Public Parks
Upgrade Existing Beaches and Shoreline Parks
Upgrade Security of Parks