part 2 local plan for corby: financial viability assessment p2lp viability... · strategy –...
TRANSCRIPT

Part 2 Local Plan for Corby: Financial Viability Assessment
Prepared for
Corby Borough Council
July 2019

2
Contents 1 Introduction 3 2 Methodology and appraisal inputs 9 3 Appraisal assumptions 13 4 Appraisal outputs 19 5 Appraisal results 20 6 Conclusions and recommendations 24
Appendices Appendix 1 - Sites details Appendix 2 - Sample appraisal
Anthony Lee MRTPI MRICS Senior Director – Development Consulting BNP Paribas Real Estate 5 Aldermanbury Square London EC2V 7BP 020 7338 4061 [email protected] realestate.bnpparibas.com
3
1 Introduction 1.1 The Council has commissioned this study to test the viability of the requirements set out in its
emerging Part 2 Local Plan (‘P2LP’) alongside the policy requirements in the adopted North Northamptonshire Joint Core Strategy 2016 (‘JCS’). The study assesses at high level the viability of development typologies representing the types of sites that are expected to come forward over the plan period, or to test policy requirements envisaged for specific sites. The study tests the cumulative impact of the requirements in the emerging P2LP and the planning policies in the adopted JCS.
1.2 This report should be read in conjunction with our reports ‘North Northamptonshire Draft Joint Core Strategy – Viability Study, June 2014’, ‘Pre-submission JCS Viability Study Update, January 2015’ and ‘Addendum to JCS Viability Study, July 2015’. Our viability testing of the policies in the emerging P2LP adopts the same broad methodology as deployed in the JCS viability studies. This includes adopting standard residual valuation approaches to test the impact of policies on development typologies. The emerging policies in the emerging P2LP have been incorporated alongside the requirements of the adopted JCS.
Local Policy context
1.3 There are numerous policy requirements that are now embedded in base build costs for schemes in Corby addressing JCS requirements (i.e. designing sustainable places; sustainable buildings, rural exception approaches, renewable energy, housing requirements and strategic opportunities, and housing mix and tenure). Therefore, it is unnecessary to establish the cost of all these pre-existing policy requirements.
1.4 It is therefore considered prudent to assume that developments can absorb the pre-existing requirements in the adopted policies. The affordable housing policy is tested despite reflecting the existing policy, as it has a significant bearing on the viability of developments, even though it has been in place for some time. The affordable housing requirement is applied on a ‘subject to viability’ basis so that sites are not prevented from coming forward when there are exceptional circumstances preventing the delivery of the full affordable housing requirement.
P2LP policies
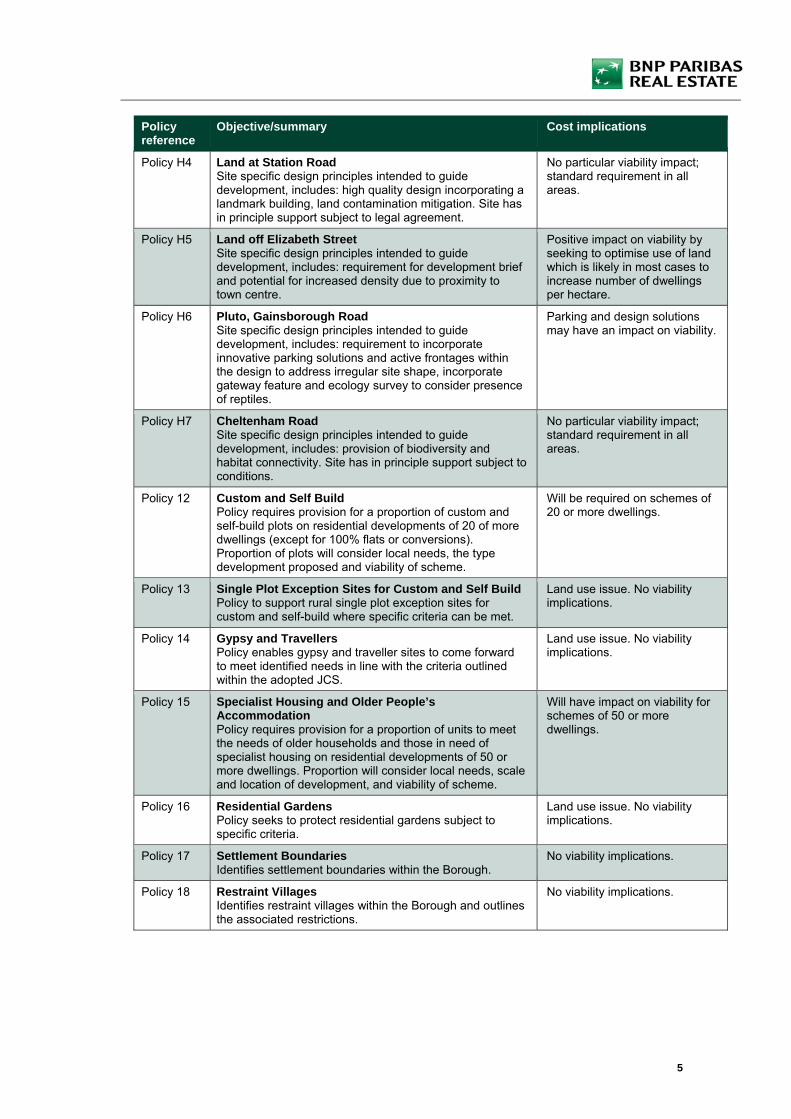
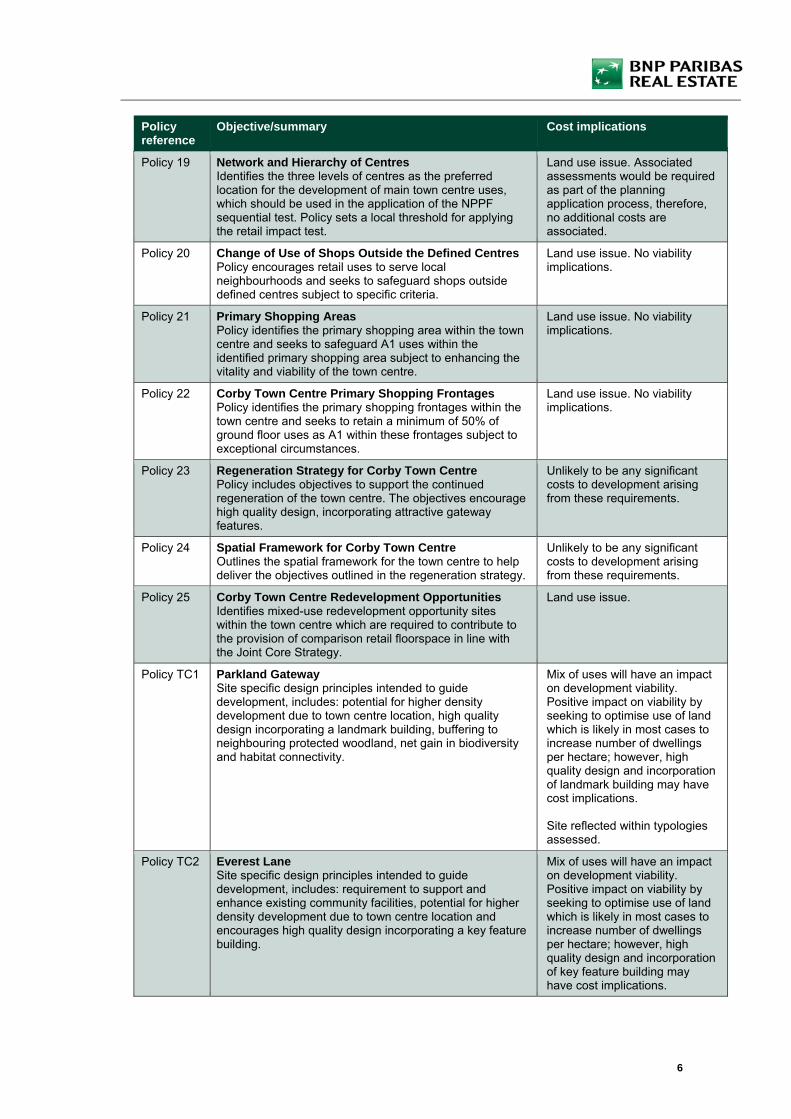
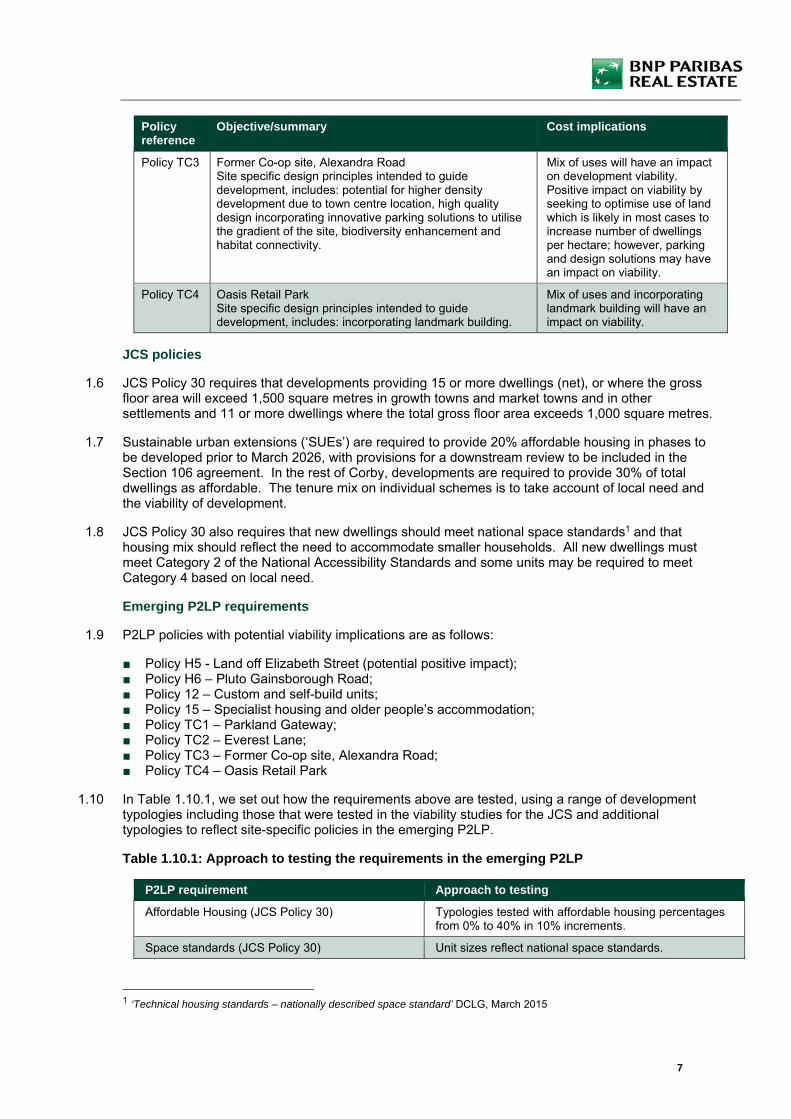
1.5 A brief summary of the P2LP policies is provided in Table 1.5.1. The Council has reviewed the policies to identify where they consider cost implications may emerge for developments. We comment further on these potential costs in Section 4.
Table 1.5.1: Emerging P2LP policies
Policy reference
Objective/summary Cost implications
Policy 1 Open Space, Sport and RecreationPolicy to protect and where possible enhance open spaces, allotments, sports and recreational facilities. Developments of 10 or more dwellings or 0.3 ha will be required to provide new or improved facilities, which should be linked to the wider Green Infrastructure (‘GI’) network.
Land use issue. Developments will need to make contributions where there are deficiencies. On-site provision will be required on larger sites which generate their own need.
Policy 2 Health and WellbeingOverarching health and wellbeing policy that encourages development proposals to promote, support and enhance health and wellbeing, through provision of green infrastructure, biodiversity and nature conservation assets and community services and facilities. Policy requires negative impacts to be mitigated.
De-minimis cost.

4
Policy reference
Objective/summary Cost implications
Policy 3 Secondary School Opportunity SiteIdentifies potential secondary school site subject to establishing need and assessment as part of the planning application process.
Land use issue. No viability implications.
Policy 4 Electronic CommunicationsPolicy encourages location of electronic communications infrastructure on existing sites and minimal impact of this infrastructure on new sites along with meeting the required standards.
No viability issues.
Policy 5 “Bad Neighbour” UsesSeeks to control development within 400m of water recycling centres and intensive livestock uses.
No viability issues.
Policy 6 Green Infrastructure CorridorsSeeks to protect and enhance identified green infrastructure corridors.
Mitigation and/or compensation measures may be required if unavoidable harm to GI network arises, which would have associated cost implications. Unlikely to apply in most cases.
Policy 7 Local Green Space Policy to protect designated Local Green Spaces.
Land use issue. No viability implications.
Policy 8 Employment Land ProvisionIdentifies non-strategic employment allocations and long-term reserve sites for employment use. Flood Risk Assessment may be required to accompany proposals for some sites.
Land use issue. Associated technical studies would be required as part of the planning application process, therefore, no additional costs are associated.
Policy 9 Employment Uses in Established Industrial EstatesPolicy seeks to retain employment uses within established industrial estates.
Land use issue. No viability implications.
Policy 10 Non Employment Uses (non-B) in Established Industrial Estates Outlines criteria for accepting non-employment uses within established industrial estates.
Land use issue. No viability implications.
Policy 11 Delivering Housing Identifies non-strategic residential allocations and mixed-use allocations including residential.
Land use issue.
Policy H1 Builders Yard, Rockingham RoadSite specific design principles intended to guide development, includes: retaining landscaping, providing net gain in biodiversity and incorporating habitat connectivity.
No particular viability impact; standard requirement in all areas.
Policy H2 Maple House, Canada SquareSite specific design principles intended to guide development, includes: traffic calming measures, incorporation of SuDS, and provision of biodiversity and habitat connectivity.
No particular viability impact; standard requirement in all areas.
Policy H3 Former Our Lady and Pope John School, Tower Hill Road Site specific design principles intended to guide development, includes: retention of trees, enhanced connectivity and potential land contamination remediation. Site has planning permission.
No particular viability impact; standard requirement in all areas.
5
Policy reference
Objective/summary Cost implications
Policy H4 Land at Station RoadSite specific design principles intended to guide development, includes: high quality design incorporating a landmark building, land contamination mitigation. Site has in principle support subject to legal agreement.
No particular viability impact; standard requirement in all areas.
Policy H5 Land off Elizabeth StreetSite specific design principles intended to guide development, includes: requirement for development brief and potential for increased density due to proximity to town centre.
Positive impact on viability by seeking to optimise use of land which is likely in most cases to increase number of dwellings per hectare.
Policy H6 Pluto, Gainsborough RoadSite specific design principles intended to guide development, includes: requirement to incorporate innovative parking solutions and active frontages within the design to address irregular site shape, incorporate gateway feature and ecology survey to consider presence of reptiles.
Parking and design solutions may have an impact on viability.
Policy H7 Cheltenham Road Site specific design principles intended to guide development, includes: provision of biodiversity and habitat connectivity. Site has in principle support subject to conditions.
No particular viability impact; standard requirement in all areas.
Policy 12 Custom and Self BuildPolicy requires provision for a proportion of custom and self-build plots on residential developments of 20 of more dwellings (except for 100% flats or conversions). Proportion of plots will consider local needs, the type development proposed and viability of scheme.
Will be required on schemes of 20 or more dwellings.
Policy 13 Single Plot Exception Sites for Custom and Self BuildPolicy to support rural single plot exception sites for custom and self-build where specific criteria can be met.
Land use issue. No viability implications.
Policy 14 Gypsy and TravellersPolicy enables gypsy and traveller sites to come forward to meet identified needs in line with the criteria outlined within the adopted JCS.
Land use issue. No viability implications.
Policy 15 Specialist Housing and Older People’s Accommodation Policy requires provision for a proportion of units to meet the needs of older households and those in need of specialist housing on residential developments of 50 or more dwellings. Proportion will consider local needs, scale and location of development, and viability of scheme.
Will have impact on viability for schemes of 50 or more dwellings.
Policy 16 Residential GardensPolicy seeks to protect residential gardens subject to specific criteria.
Land use issue. No viability implications.
Policy 17 Settlement BoundariesIdentifies settlement boundaries within the Borough.
No viability implications.
Policy 18 Restraint Villages Identifies restraint villages within the Borough and outlines the associated restrictions.
No viability implications.
6
Policy reference
Objective/summary Cost implications
Policy 19 Network and Hierarchy of CentresIdentifies the three levels of centres as the preferred location for the development of main town centre uses, which should be used in the application of the NPPF sequential test. Policy sets a local threshold for applying the retail impact test.
Land use issue. Associated assessments would be required as part of the planning application process, therefore, no additional costs are associated.
Policy 20 Change of Use of Shops Outside the Defined CentresPolicy encourages retail uses to serve local neighbourhoods and seeks to safeguard shops outside defined centres subject to specific criteria.
Land use issue. No viability implications.
Policy 21 Primary Shopping AreasPolicy identifies the primary shopping area within the town centre and seeks to safeguard A1 uses within the identified primary shopping area subject to enhancing the vitality and viability of the town centre.
Land use issue. No viability implications.
Policy 22 Corby Town Centre Primary Shopping FrontagesPolicy identifies the primary shopping frontages within the town centre and seeks to retain a minimum of 50% of ground floor uses as A1 within these frontages subject to exceptional circumstances.
Land use issue. No viability implications.
Policy 23 Regeneration Strategy for Corby Town CentrePolicy includes objectives to support the continued regeneration of the town centre. The objectives encourage high quality design, incorporating attractive gateway features.
Unlikely to be any significant costs to development arising from these requirements.
Policy 24 Spatial Framework for Corby Town CentreOutlines the spatial framework for the town centre to help deliver the objectives outlined in the regeneration strategy.
Unlikely to be any significant costs to development arising from these requirements.
Policy 25 Corby Town Centre Redevelopment OpportunitiesIdentifies mixed-use redevelopment opportunity sites within the town centre which are required to contribute to the provision of comparison retail floorspace in line with the Joint Core Strategy.
Land use issue.
Policy TC1 Parkland Gateway Site specific design principles intended to guide development, includes: potential for higher density development due to town centre location, high quality design incorporating a landmark building, buffering to neighbouring protected woodland, net gain in biodiversity and habitat connectivity.
Mix of uses will have an impact on development viability. Positive impact on viability by seeking to optimise use of land which is likely in most cases to increase number of dwellings per hectare; however, high quality design and incorporation of landmark building may have cost implications. Site reflected within typologies assessed.
Policy TC2 Everest Lane Site specific design principles intended to guide development, includes: requirement to support and enhance existing community facilities, potential for higher density development due to town centre location and encourages high quality design incorporating a key feature building.
Mix of uses will have an impact on development viability. Positive impact on viability by seeking to optimise use of land which is likely in most cases to increase number of dwellings per hectare; however, high quality design and incorporation of key feature building may have cost implications.
7
Policy reference
Objective/summary Cost implications
Policy TC3 Former Co-op site, Alexandra Road Site specific design principles intended to guide development, includes: potential for higher density development due to town centre location, high quality design incorporating innovative parking solutions to utilise the gradient of the site, biodiversity enhancement and habitat connectivity.
Mix of uses will have an impact on development viability. Positive impact on viability by seeking to optimise use of land which is likely in most cases to increase number of dwellings per hectare; however, parking and design solutions may have an impact on viability.
Policy TC4 Oasis Retail Park Site specific design principles intended to guide development, includes: incorporating landmark building.
Mix of uses and incorporating landmark building will have an impact on viability.
JCS policies
1.6 JCS Policy 30 requires that developments providing 15 or more dwellings (net), or where the gross floor area will exceed 1,500 square metres in growth towns and market towns and in other settlements and 11 or more dwellings where the total gross floor area exceeds 1,000 square metres.
1.7 Sustainable urban extensions (‘SUEs’) are required to provide 20% affordable housing in phases to be developed prior to March 2026, with provisions for a downstream review to be included in the Section 106 agreement. In the rest of Corby, developments are required to provide 30% of total dwellings as affordable. The tenure mix on individual schemes is to take account of local need and the viability of development.
1.8 JCS Policy 30 also requires that new dwellings should meet national space standards1 and that housing mix should reflect the need to accommodate smaller households. All new dwellings must meet Category 2 of the National Accessibility Standards and some units may be required to meet Category 4 based on local need.
Emerging P2LP requirements
1.9 P2LP policies with potential viability implications are as follows:
■ Policy H5 - Land off Elizabeth Street (potential positive impact); ■ Policy H6 – Pluto Gainsborough Road; ■ Policy 12 – Custom and self-build units; ■ Policy 15 – Specialist housing and older people’s accommodation; ■ Policy TC1 – Parkland Gateway; ■ Policy TC2 – Everest Lane; ■ Policy TC3 – Former Co-op site, Alexandra Road; ■ Policy TC4 – Oasis Retail Park
1.10 In Table 1.10.1, we set out how the requirements above are tested, using a range of development typologies including those that were tested in the viability studies for the JCS and additional typologies to reflect site-specific policies in the emerging P2LP.
Table 1.10.1: Approach to testing the requirements in the emerging P2LP
P2LP requirement Approach to testing
Affordable Housing (JCS Policy 30) Typologies tested with affordable housing percentages from 0% to 40% in 10% increments.
Space standards (JCS Policy 30) Unit sizes reflect national space standards.
1 ‘Technical housing standards – nationally described space standard’ DCLG, March 2015

8
P2LP requirement Approach to testing
Housing mix (JCS Policy 30) Housing mix in the JCS viability studies applied.
Policy H5 – site specific policies for Land off Elizabeth Street
Scheme typology tested at ‘standard’ and higher density to test the impact on viability of the policy requirement for optimising use of the site.
Policy H6 – site specific policies for Pluto, Gainsborough Road
Extra-over cost included for innovative parking solutions and design requirements.
Policy 12 - Custom and self-build units Typologies modelled with and without self-build requirement. Where self-build units included, we have assumed the developer will be providing site servicing and disposing of serviced plots to individual self-builders.
Policy 15 – specialist housing and older people’s accommodation
Specialist housing tested as a typology to determine whether it is self-sustaining without the need for cross-subsidy from other forms of development.
Policy TC1 – site specific policies for Parkland Gateway
Scheme typology tested at ‘standard’ and higher density to test the impact on viability of the policy requirement for optimising use of the site. A landmark building is required – this is reflected by applying a higher build cost reflecting additional building height.
Policy TC2 – site specific policies for Everest Lane Scheme typology tested at ‘standard’ and higher density to test the impact on viability of the policy requirement for optimising use of the site. A landmark building is required – this is reflected by applying a higher build cost reflecting additional building height.
Policy TC3 – site specific policies for Former Co-op site, Alexandra Road
Scheme typology tested at ‘standard’ and higher density to test the impact on viability of the policy requirement for optimising use of the site. Parking solution required for which an extra-over cost is included.
Policy TC4 – site specific policies for Oasis Retail Park
Requirement for a landmark building reflected through a higher build cost due to building height.
9
2 Methodology and appraisal inputs 2.1 Our methodology follows standard development appraisal conventions, using locally-based sites and
assumptions that reflect local market and planning policy circumstances. The study is therefore specific to Corby and reflects the Council’s existing and emerging planning policy requirements.
Approach to testing development viability
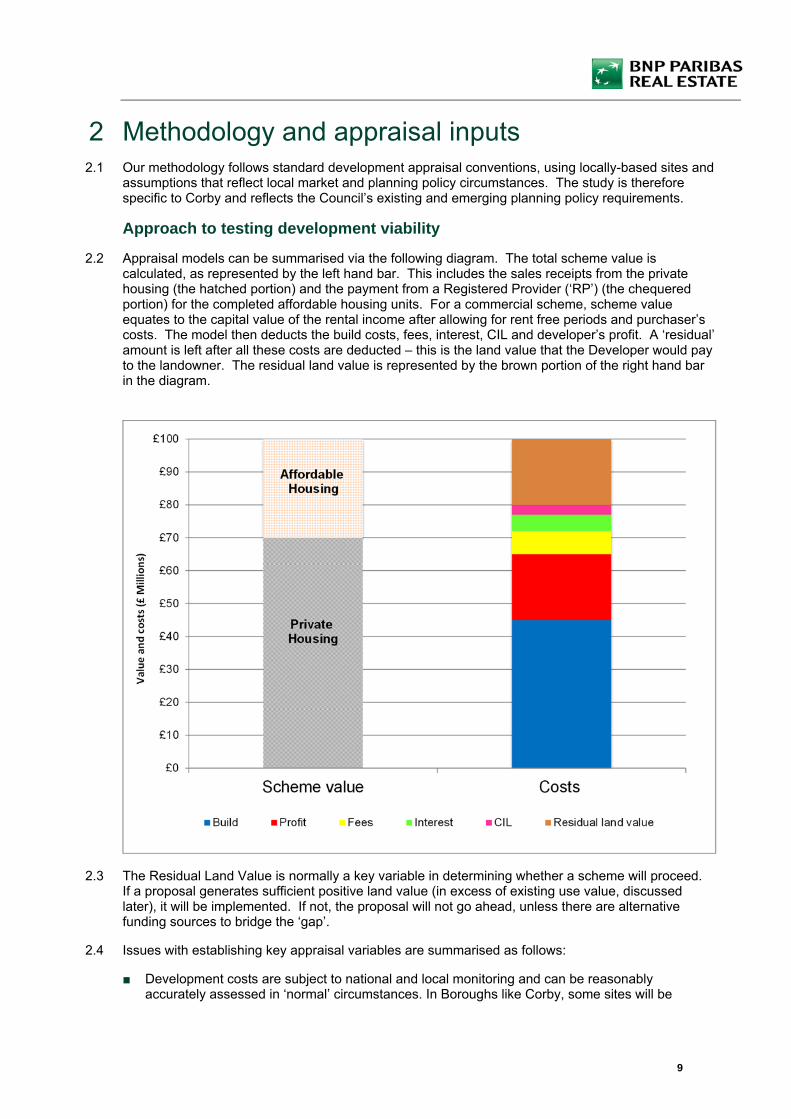
2.2 Appraisal models can be summarised via the following diagram. The total scheme value is calculated, as represented by the left hand bar. This includes the sales receipts from the private housing (the hatched portion) and the payment from a Registered Provider (‘RP’) (the chequered portion) for the completed affordable housing units. For a commercial scheme, scheme value equates to the capital value of the rental income after allowing for rent free periods and purchaser’s costs. The model then deducts the build costs, fees, interest, CIL and developer’s profit. A ‘residual’ amount is left after all these costs are deducted – this is the land value that the Developer would pay to the landowner. The residual land value is represented by the brown portion of the right hand bar in the diagram.
2.3 The Residual Land Value is normally a key variable in determining whether a scheme will proceed. If a proposal generates sufficient positive land value (in excess of existing use value, discussed later), it will be implemented. If not, the proposal will not go ahead, unless there are alternative funding sources to bridge the ‘gap’.
2.4 Issues with establishing key appraisal variables are summarised as follows:
■ Development costs are subject to national and local monitoring and can be reasonably accurately assessed in ‘normal’ circumstances. In Boroughs like Corby, some sites will be

10
previously developed. These sites can sometimes encounter ‘exceptional’ costs such as decontamination. Such costs can be very difficult to anticipate before detailed site surveys are undertaken;
■ Assumptions about development phasing, phasing of Section 106 contributions and infrastructure required to facilitate each phase of the development will affect residual values. Where the delivery of the obligations is deferred, the lower the real cost to the applicant (and the greater the scope for increased affordable housing and other planning obligations). This is because the interest cost is reduced if the costs are incurred later in the development cashflow; and
■ While Developer’s Profit has to be assumed in any appraisal, its level is closely correlated with risk. The greater the risk, the higher the profit level required by lenders. Typically developers and banks are targeting around 17-20% profit on value of the private housing element.
2.5 Ultimately, the landowner will make a decision on implementing a project on the basis of return and the potential for market change, and whether alternative developments might yield a higher value. The landowner’s ‘bottom line’ will be achieving a residual land value that sufficiently exceeds ‘existing use value2’ or another appropriate benchmark to make development worthwhile. The margin above existing use value may be considerably different on individual sites, where there might be particular reasons why the premium to the landowner should be lower or higher than other sites.
2.6 Clearly, however, landowners have expectations of the value of their land which often exceed the value of the current use. Ultimately, if landowners’ reasonable expectations are not met, they will not voluntarily sell their land and (unless a Local Authority is prepared to use its compulsory purchase powers) some may simply hold on to their sites, in the hope that policy may change at some future point with reduced requirements. However, the communities in which development takes place also have reasonable expectations that development will mitigate its impact, in terms of provision of community infrastructure, which will reduce land values. It is within the scope of those expectations that developers have to formulate their offers for sites. The task of formulating an offer for a site is complicated further still during buoyant land markets, where developers have to compete with other developers to secure a site, often speculating on increases in value.
Viability benchmark
2.7 The NPPF is not prescriptive on the type of methodology local planning authorities should use when assessing viability. The National Planning Practice Guidance indicates that the benchmark land value will need to allow for an incentive for the land owner to sell; “a benchmark land value should be established on the basis of the existing use value (EUV) of the land, plus a premium for the landowner. The premium should reflect the minimum return at which it is considered a reasonable landowner would be willing to sell their land. The premium should provide a reasonable incentive, in comparison to other options available, for the landowner to sell land for development while allowing a sufficient contribution to fully comply with policy requirements” (paragraph 013; reference ID 10-013-20190509).
2.8 The Local Housing Delivery Group published guidance3 in June 2012 which provides guidance on testing viability of Local Plan policies. The guidance notes that “consideration of an appropriate Threshold Land Value [or viability benchmark] needs to take account of the fact that future plan policy requirements will have an impact on land values and landowner expectations. Therefore, using a market value approach as the starting point carries the risk of building-in assumptions of current policy costs rather than helping to inform the potential for future policy”.
2.9 In light of the weaknesses in the market value approach, the Local Housing Delivery Group guidance recommends that benchmark land value “is based on a premium over current use values” with the “precise figure that should be used as an appropriate premium above current use value [being]
2 For the purposes of this report, existing use value is defined as the value of the site in its existing use, assuming that it remains in that use. We are not referring to the RICS Valuation Standards definition of ‘Existing Use Value’. 3 Viability Testing Local Plans: Advice for planning practitioners, Local Housing Delivery Group, Chaired by Sir John Harman, June 2012

11
determined locally”. The guidance considers that this approach “is in line with reference in the NPPF to take account of a “competitive return” to a willing land owner”. This is echoed by the PPG which states that market evidence “should not be used in place of benchmark land value [as] there may be a divergence between benchmark land values and market evidence; and plan makers should be aware that this could be due to different assumptions and methodologies used by individual developers, site promoters and landowners”.
2.10 The examination on the Mayor of London’s first CIL charging schedule considered the issue of an appropriate land value benchmark. The Mayor had adopted existing use value, while certain objectors suggested that ‘Market Value’ was a more appropriate benchmark. The Examiner concluded that:
“The market value approach…. while offering certainty on the price paid for a development site, suffers from being based on prices agreed in an historic policy context.” (paragraph 8) and that “I don’t believe that the EUV approach can be accurately described as fundamentally flawed or that this examination should be adjourned to allow work based on the market approach to be done” (paragraph 9).
2.11 In his concluding remark, the Examiner points out that “the price paid for development land may be reduced [so that CIL may be accommodated]. As with profit levels there may be cries that this is unrealistic, but a reduction in development land value is an inherent part of the CIL concept. It may be argued that such a reduction may be all very well in the medium to long term but it is impossible in the short term because of the price already paid/agreed for development land. The difficulty with that argument is that if accepted the prospect of raising funds for infrastructure would be forever receding into the future. In any event in some instances it may be possible for contracts and options to be re-negotiated in the light of the changed circumstances arising from the imposition of CIL charges. (paragraph 32 – emphasis added).
2.12 It is important to stress, therefore, that there is no single threshold land value at which land will come forward for development. The decision to bring land forward will depend on the type of owner and, in particular, whether the owner occupies the site or holds it as an asset; the strength of demand for the site’s current use in comparison to others; how offers received compare to the owner’s perception of the value of the site, which in turn is influenced by prices achieved by other sites. Given the lack of a single threshold land value, it is difficult for policy makers to determine the minimum land value that sites should achieve. This will ultimately be a matter of judgement for each planning authority.
2.13 Respondents to consultations on planning policy documents in other authorities have made various references to the RICS Guidance on ‘Viability in Planning’ and have suggested that councils should run their analysis on market values. This would be an extremely misleading measure against which to test viability, as market values should reflect existing policies already in place, and would consequently tell us nothing as to how future (as yet un-adopted) policies might impact on viability. It has been widely accepted elsewhere that market values are inappropriate for testing planning policy requirements. The most recent update to the Planning Practice Guidance makes this very clear, stating in various paragraphs that “the price paid for land is not a relevant justification for failing to accord with relevant policies in the plan” (paras 002, 006, 011, 014 and 018). It also notes that “market evidence can also be used as a cross-check of benchmark land value but should not be used in place of benchmark land value” and that “there may be a divergence between benchmark land values and market evidence; and plan makers should be aware that this could be due to different assumptions and methodologies adopted by individual developers, site promoters and landowners” (para 014).
2.14 Relying upon historic transactions is a fundamentally flawed approach, as offers for these sites will have been framed in the context of current planning policy requirements, so an exercise using these transactions as a benchmark would tell the Council nothing about the potential for sites to absorb as yet unadopted policies. Various Local Plan inspectors and CIL examiners have accepted the key point that Local Plan policies and CIL will ultimately result in a reduction in land values, so benchmarks must consider a reasonable minimum threshold which landowners will accept. For local
12
authority areas such as Corby, where the vast majority of sites are previously developed, the ‘bottom line’ in terms of land value will be the value of the site in its existing use. This fundamental point is recognised by the RICS at paragraph 3.4.4 of their Guidance Note on ‘Financial Viability in Planning”:
“For a development to be financially viable, any uplift from current use value to residual land value that arises when planning permission is granted should be able to meet the cost of planning obligations while ensuring an appropriate Site Value for the landowner and a market risk adjusted return to the developer in delivering that project (the NPPF refers to this as ‘competitive returns’ respectively). The return to the landowner will be in the form of a land value in excess of current use value”.
2.15 The Guidance goes on to state that “it would be inappropriate to assume an uplift based on set percentages … given the diversity of individual development sites”.
2.16 Commentators also make reference to ‘market testing’ of benchmark land values. This is another variant of the benchmarking advocated by respondents outlined at paragraph 3.13. These respondents advocate using benchmarks that are based on the prices that sites have been bought and sold for. There are significant weaknesses in this approach which none of the respondents who advocate this have addressed. In brief, prices paid for sites are a highly unreliable indicator of their actual value, due to the following reasons:
■ Transactions are often based on bids that ‘take a view’ on squeezing planning policy requirements below target levels. This results in prices paid being too high to allow for policy targets to be met. If these transactions are used to ‘market test’ CIL rates, the outcome would be unreliable and potentially highly misleading.
■ Historic transactions of housing sites are often based on the receipt of grant funding, which is no longer available.
■ There would be a need to determine whether the developer who built out the comparator sites actually achieved a profit at the equivalent level to the profit adopted in the viability testing. If the developer achieved a sub-optimal level of profit, then any benchmarking using these transactions would produce unreliable and misleading results.
■ Developers often build assumptions of growth in sales values into their appraisals, which provides a higher gross development value than would actually be achieved today. Given that our appraisals are based on current values, using prices paid would result in an inconsistent comparison (i.e. current values against the developer’s assumed future values). Using these transactions would produce unreliable and misleading results.
2.17 These issues are evident from a recent BNP Paribas Real Estate review of evidence submitted in viability assessments where the differences between the value ascribed to developments by applicants and the amounts the sites were purchased for by the same parties. The prices paid exceeded the value of the consented schemes by between 52% and 1,300%.
2.18 For the reasons set out above, the approach of using current use values is a more reliable indicator of viability than using market values or prices paid for sites, as advocated by certain observers. Our assessment follows this approach, as set out in Section 4.
13
3 Appraisal assumptions 3.1 For the purposes of testing the cumulative impact of the requirements in the P2LP, we have
appraised 20 development typologies on sites across the borough to represent the types of sites that the Council expects to come forward over the plan period. These include the sites identified in Table 1.10.1 that have site-specific policies in P2LP. The development typologies are identified in Table 3.1.1 overleaf. Floor areas for commercial uses are gross internal areas and are indicative estimates only without the benefit of detailed design.
Residential sales values
3.2 Residential values in Corby reflect national trends in recent years but do of course vary somewhat between different sub-markets. According to the Land Registry House Price Index, average prices in Corby have increased from £125,854 in January 2014 to £186,898 in April 2019, an increase of 48.5%, compared to an increase across the whole of England of 30%.
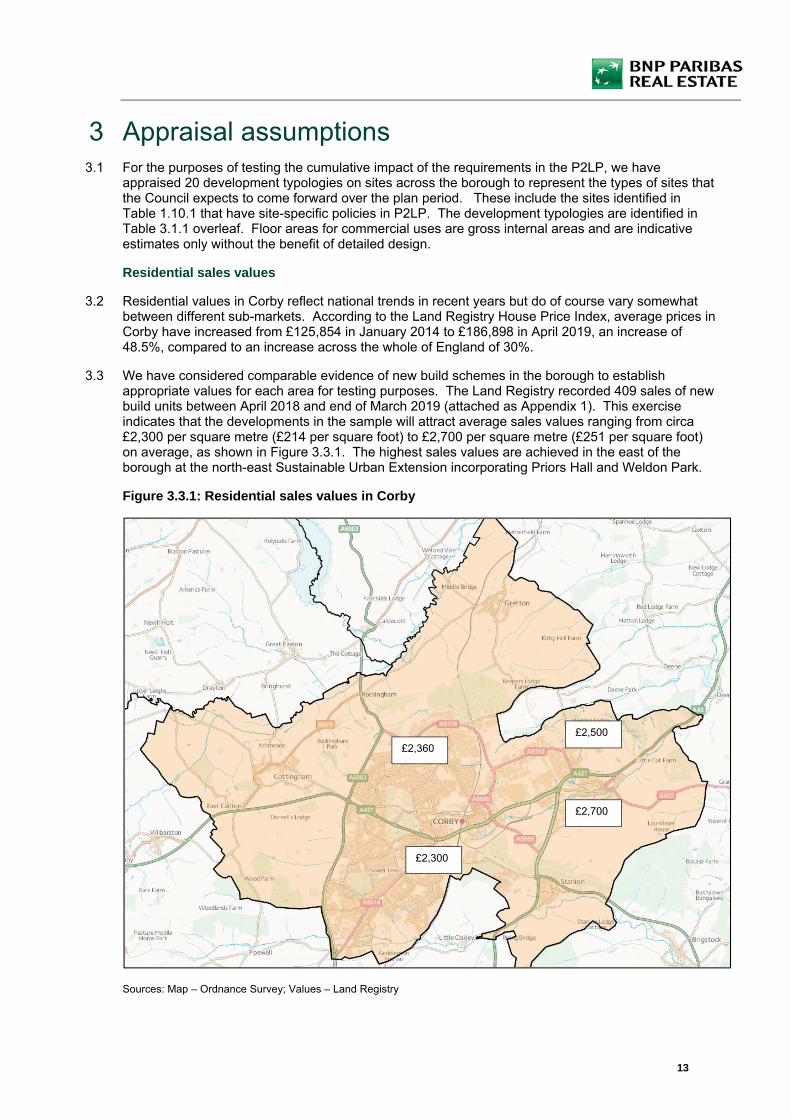
3.3 We have considered comparable evidence of new build schemes in the borough to establish appropriate values for each area for testing purposes. The Land Registry recorded 409 sales of new build units between April 2018 and end of March 2019 (attached as Appendix 1). This exercise indicates that the developments in the sample will attract average sales values ranging from circa £2,300 per square metre (£214 per square foot) to £2,700 per square metre (£251 per square foot) on average, as shown in Figure 3.3.1. The highest sales values are achieved in the east of the borough at the north-east Sustainable Urban Extension incorporating Priors Hall and Weldon Park.
Figure 3.3.1: Residential sales values in Corby
Sources: Map – Ordnance Survey; Values – Land Registry
£2,700
£2,500
£2,360
£2,300
14
3.4 The future trajectory of house prices is currently uncertain, although Savills’ Housing Market Update June 2019 prediction is that is that values are expected to increase over the next five years. Medium term predictions are that properties in East Midlands markets will grow over the period between 2019 and 2023. Savills predict that values in East Midlands markets will increase by 3% in 2019, 5% in 2020, 3.5% in 2021, 3% in 2022 and 3.5% in 2023. This equates to cumulative growth of 19.3% between 2019 and 2023 inclusive, against a UK prediction of 14.8%.
Affordable housing tenure and values
3.5 JCS Policy 30 requires 30% affordable housing. The Council typically seeks a tenure mix of 70% rented housing and 30% intermediate, typically provided as shared ownership.
3.6 Our appraisals assume that the rented housing is let at rents that do not exceed Local Housing Allowance levels, as shown in Table 3.6.1.
Table 3.6.1: Affordable housing rents (per week)
Rent type
1 bed 2 bed 3 bed 4 bed
Affordable Rent (based on LHA in Northants Central Broad Rental Market Area)
£87.42 £112.39 £131.11 £169.73
3.7 RPs are permitted to increase rents by CPI plus 1% per annum. We have applied this assumption to our appraisals.
3.8 Based on the rents above, our modelling indicates that RPs would pay an average of £1,639 per square metre (£152 per square foot) to acquire completed Affordable Rented units.
3.9 The CLG/HCA ‘Shared Ownership and Affordable Homes Programme 2016-2021: Prospectus’ document clearly states that Registered Providers will not receive grant funding for any affordable housing provided through planning obligations on developer-led developments. Consequently, all our appraisals assume nil grant. Clearly if grant funding does become available over the plan period, it should facilitate an increase in the provision of affordable housing when developments come forward.
3.10 For shared ownership units, we have assumed that Registered Providers will sell 50% initial equity stakes and charge 2.75% on the retained equity. The rent on retained equity is capitalised using a yield of 5%. These assumptions generate a capital value of circa 75% of market value.
Rents and yields for commercial development
3.11 Our assumptions on rents and yields for the retail and office floorspace are summarised in Table 3.11.1. These assumptions are informed by lettings of similar floorspace in the area over the past year. Our appraisals assume a 12-month rent-free period for both retail and office floorspace.
Table 3.11.1: Commercial rents (£s per square metre) and yields
Commercial floorspace Rent per square metre
Investment yield Rent free period (months)
Retail £269 7.00% 12
Retail supermarket £250 5.00% 12
Offices £140 8.00% 12

15
Table 3.1.1: Development typologies tested in the study (all areas are square metre gross internal areas)
Residential Non-residential
Site Description Site area HA
Houses Flats Ave GIA sqm per unit
Residential floorspace
Retail floorspace
Super-market
B1 Gross floorspace
1 Land off Elizabeth Street (standard density) 0.83 50 40 91 8,174 - - - 8,174
2 Land off Elizabeth Street (higher density) 0.83 75 40 92 10,539 - - - 10,359
3 Parkland Gateway (standard density) 0.98 - 80 86 6,889 4,000 - 2,000 12,889
4 Parkland Gateway (higher density) 0.98 - 100 86 8,612 4,000 - 2,000 14,612
5 Everest Lane (standard density) 0.89 20 50 89 6,198 3,500 - - 9,698
6 Everest Lane (higher density) 0.89 40 50 90 8,089 3,500 - - 11,589
7 Alexandra Road (standard density) 0.84 40 70 89 9,812 3,500 - - 13,312
8 Alexandra Road (higher density) 0.84 80 70 91 13,595 3,500 - - 17,095
9 Pluto, Gainsborough Road 0.39 30 - 95 2,838 - - - 2,838
10 Oasis Retail Park 1.15 - 50 86 4,306 7,000 3,000 - 14,306
11 Specialist older person's scheme - flatted 0.30 - 60 86 5,167 - - - 5,167
12 Specialist older person's scheme - houses 0.60 30 - 95 2,838 - - - 2,838
13 50 houses 1.00 50 - 95 4,729 - - - 4,729
14 100 houses 1.80 100 - 95 9,459 - - - 9,459
15 125 houses 2.30 125 - 95 11,824 - - - 11,824
16 150 houses 3.00 150 - 95 14,188 - - - 14,188
17 250 houses 7.00 250 - 95 23,647 - - - 23,647
18 300 houses 9.00 300 - 95 28,376 - - - 28,376
19 275 houses/25 self build plots 9.00 300 - 95 28,376 - - - 28,376
20 250 houses/50 self build plots 9.00 300 - 95 28,376 - - - 28,376
16
Build costs
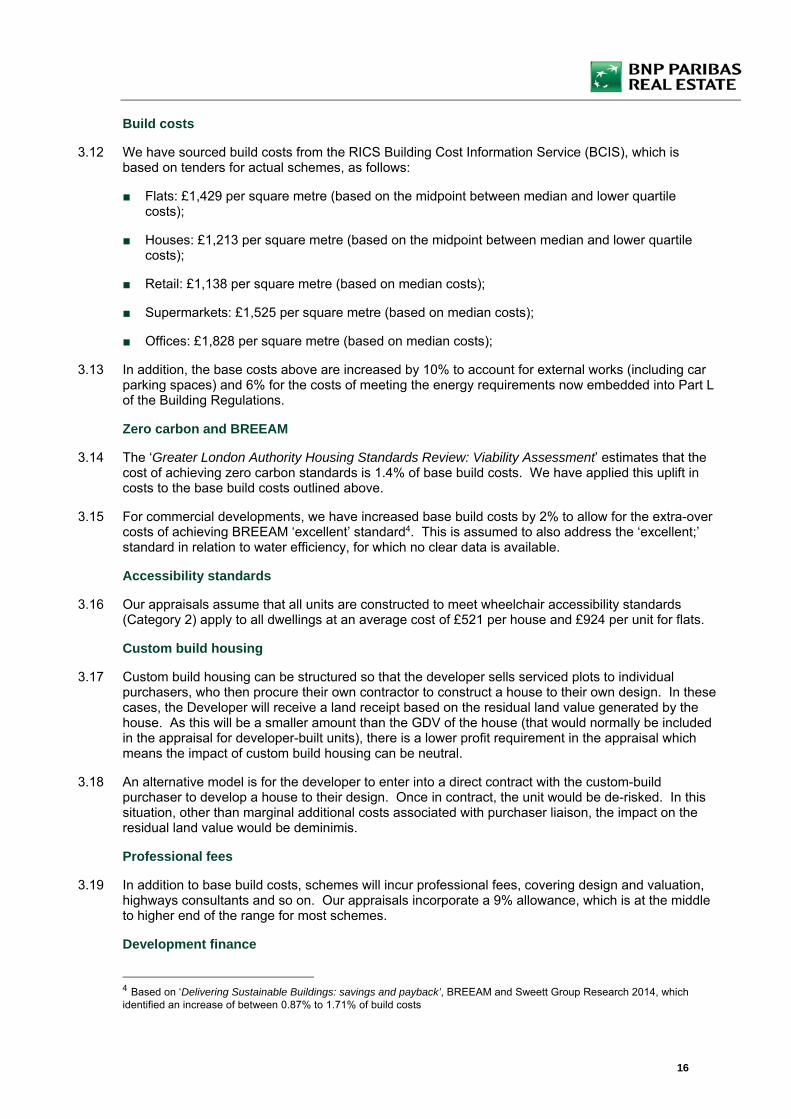
3.12 We have sourced build costs from the RICS Building Cost Information Service (BCIS), which is based on tenders for actual schemes, as follows:
■ Flats: £1,429 per square metre (based on the midpoint between median and lower quartile costs);
■ Houses: £1,213 per square metre (based on the midpoint between median and lower quartile costs);
■ Retail: £1,138 per square metre (based on median costs);
■ Supermarkets: £1,525 per square metre (based on median costs);
■ Offices: £1,828 per square metre (based on median costs);
3.13 In addition, the base costs above are increased by 10% to account for external works (including car parking spaces) and 6% for the costs of meeting the energy requirements now embedded into Part L of the Building Regulations.
Zero carbon and BREEAM
3.14 The ‘Greater London Authority Housing Standards Review: Viability Assessment’ estimates that the cost of achieving zero carbon standards is 1.4% of base build costs. We have applied this uplift in costs to the base build costs outlined above.
3.15 For commercial developments, we have increased base build costs by 2% to allow for the extra-over costs of achieving BREEAM ‘excellent’ standard4. This is assumed to also address the ‘excellent;’ standard in relation to water efficiency, for which no clear data is available.
Accessibility standards
3.16 Our appraisals assume that all units are constructed to meet wheelchair accessibility standards (Category 2) apply to all dwellings at an average cost of £521 per house and £924 per unit for flats.
Custom build housing
3.17 Custom build housing can be structured so that the developer sells serviced plots to individual purchasers, who then procure their own contractor to construct a house to their own design. In these cases, the Developer will receive a land receipt based on the residual land value generated by the house. As this will be a smaller amount than the GDV of the house (that would normally be included in the appraisal for developer-built units), there is a lower profit requirement in the appraisal which means the impact of custom build housing can be neutral.
3.18 An alternative model is for the developer to enter into a direct contract with the custom-build purchaser to develop a house to their design. Once in contract, the unit would be de-risked. In this situation, other than marginal additional costs associated with purchaser liaison, the impact on the residual land value would be deminimis.
Professional fees
3.19 In addition to base build costs, schemes will incur professional fees, covering design and valuation, highways consultants and so on. Our appraisals incorporate a 9% allowance, which is at the middle to higher end of the range for most schemes.
Development finance
4 Based on ‘Delivering Sustainable Buildings: savings and payback’, BREEAM and Sweett Group Research 2014, which identified an increase of between 0.87% to 1.71% of build costs

17
3.20 Our appraisals assume that development finance can be secured at a rate of 6%, inclusive of arrangement and exit fees, reflective of current funding conditions. Marketing costs
3.21 Our appraisals incorporate an allowance of 3% for marketing costs, which includes show homes and agents’ fees, plus 0.5% for sales legal fees.
CIL
3.22 The Council has not adopted a CIL charging schedule at the current time.
Section 106 costs
3.23 To address site-specific Section 106 requirements, we have included an additional allowance of £20 per square metre for non-residential development and £5,000 per unit for residential development, the latter reflecting amounts agreed on sites which share the most characteristics with the site typologies tested in the study.
Development and sales periods
3.24 Development and sales periods vary between type of scheme. However, our sales periods are based on an assumption of a sales rate of 6 units per month, with an element of off-plan sales reflected in the timing of receipts. This is reflective of current market conditions, whereas in improved markets, a sales rate of up to 8 units per month might be expected.
Developer’s profit
3.25 Developer’s profit is closely correlated with the perceived risk of residential development. The greater the risk, the greater the required profit level, which helps to mitigate against the risk, but also to ensure that the potential rewards are sufficiently attractive for a bank and other equity providers to fund a scheme. It is important to emphasise that the level of minimum profit is not necessarily determined by developers (although they will have their own view and the Boards of the major housebuilders will set targets for minimum profit).
3.26 The views of the banks which fund development are more important; if the banks decline an application by a developer to borrow to fund a development, it is very unlikely to proceed, as developers rarely carry sufficient cash to fund it themselves. Consequently, future movements in profit levels will largely be determined by the attitudes of the banks towards development proposals.
3.27 The near collapse of the global banking system in the final quarter of 2008 is resulting in a much tighter regulatory system, with UK banks having to take a much more cautious approach to all lending. In this context, and against the backdrop of the current sovereign debt crisis in the Eurozone, the banks were for a time reluctant to allow profit levels to decrease. However, perceived risk in the UK housing market is receding, albeit there is a degree of caution as a consequence of the outcome of the referendum on the UK’s membership of the EU. We have therefore adopted a profit margin of 17% of private GDV for testing purposes, although individual schemes may require lower or higher profits, depending on site specific circumstances. For commercial development, we have adopted a profit of 15% of GDV, reflecting normal market levels.
3.28 Our assumed return on the affordable housing GDV is 6%. A lower return on the affordable housing is appropriate as there is very limited sales risk on these units for the developer; there is often a pre-sale of the units to an RP prior to commencement. Any risk associated with take up of intermediate housing is borne by the acquiring RP, not by the developer.
Exceptional costs
3.29 Exceptional costs can be an issue for development viability on previously developed land. These costs relate to works that are ‘atypical’, such as remediation of sites in former industrial use and that are over and above standard build costs. However, in the absence of details site investigations, it is
18
not possible to provide a reliable estimate of what exceptional costs might be. Our analysis therefore excludes exceptional costs, as to apply a blanket allowance would generate misleading results. An ‘average’ level of costs for abnormal ground conditions and some other ‘abnormal’ costs is already reflected in BCIS data, as such costs are frequently encountered on sites that form the basis of the BCIS data sample.
Benchmark land value
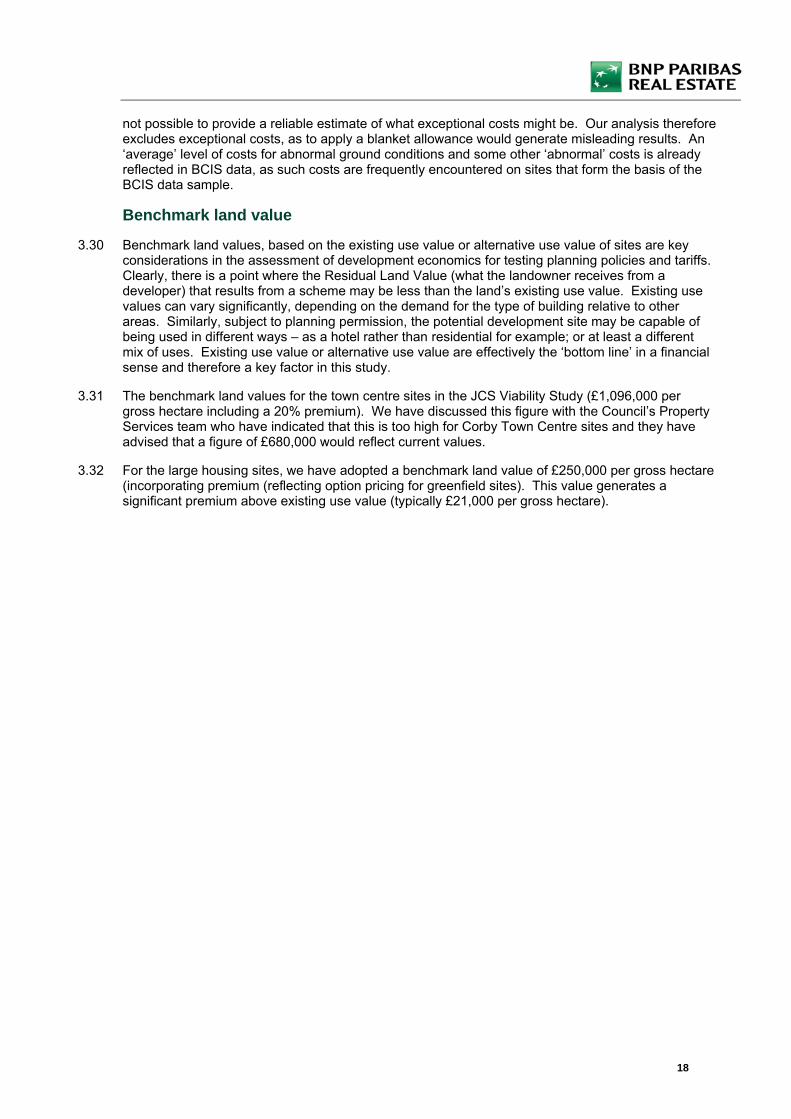
3.30 Benchmark land values, based on the existing use value or alternative use value of sites are key considerations in the assessment of development economics for testing planning policies and tariffs. Clearly, there is a point where the Residual Land Value (what the landowner receives from a developer) that results from a scheme may be less than the land’s existing use value. Existing use values can vary significantly, depending on the demand for the type of building relative to other areas. Similarly, subject to planning permission, the potential development site may be capable of being used in different ways – as a hotel rather than residential for example; or at least a different mix of uses. Existing use value or alternative use value are effectively the ‘bottom line’ in a financial sense and therefore a key factor in this study.
3.31 The benchmark land values for the town centre sites in the JCS Viability Study (£1,096,000 per gross hectare including a 20% premium). We have discussed this figure with the Council’s Property Services team who have indicated that this is too high for Corby Town Centre sites and they have advised that a figure of £680,000 would reflect current values.
3.32 For the large housing sites, we have adopted a benchmark land value of £250,000 per gross hectare (incorporating premium (reflecting option pricing for greenfield sites). This value generates a significant premium above existing use value (typically £21,000 per gross hectare).
19
4 Appraisal outputs 4.1 The outputs from our appraisals of the various development typologies are set out in Section 5. We
have appraised 20 development typologies, reflecting different densities and types of development across the borough including town centre mixed-use schemes.
4.2 Each appraisal incorporates affordable housing at various levels between 0% and 40% of units, with a tenure mix of 70% rent and 30% intermediate.
4.3 For the town centre sites with specific P2LP policies, we have run a ‘base’ position reflecting normal cost levels and a second appraisal with a cost enhancement to reflect the policy requirement for landmark buildings etc.
4.4 The town centre typologies are tested using sales values of £2,300, reflecting current sales values in this area and a second appraisal applying a value of £2,400 per square metre. The greenfield site typologies are all tested using a range of values from £2,300 to £2,700 per square metre, reflecting the spread of values on greenfield sites across the borough.
4.5 Where the residual land value of a typology exceeds the benchmark land value, we show the result shaded green, indicating that the scheme is viable with the policy requirements incorporated. If residual land value is lower than the benchmark land value, the cell is shaded red to indicate that it is unviable.
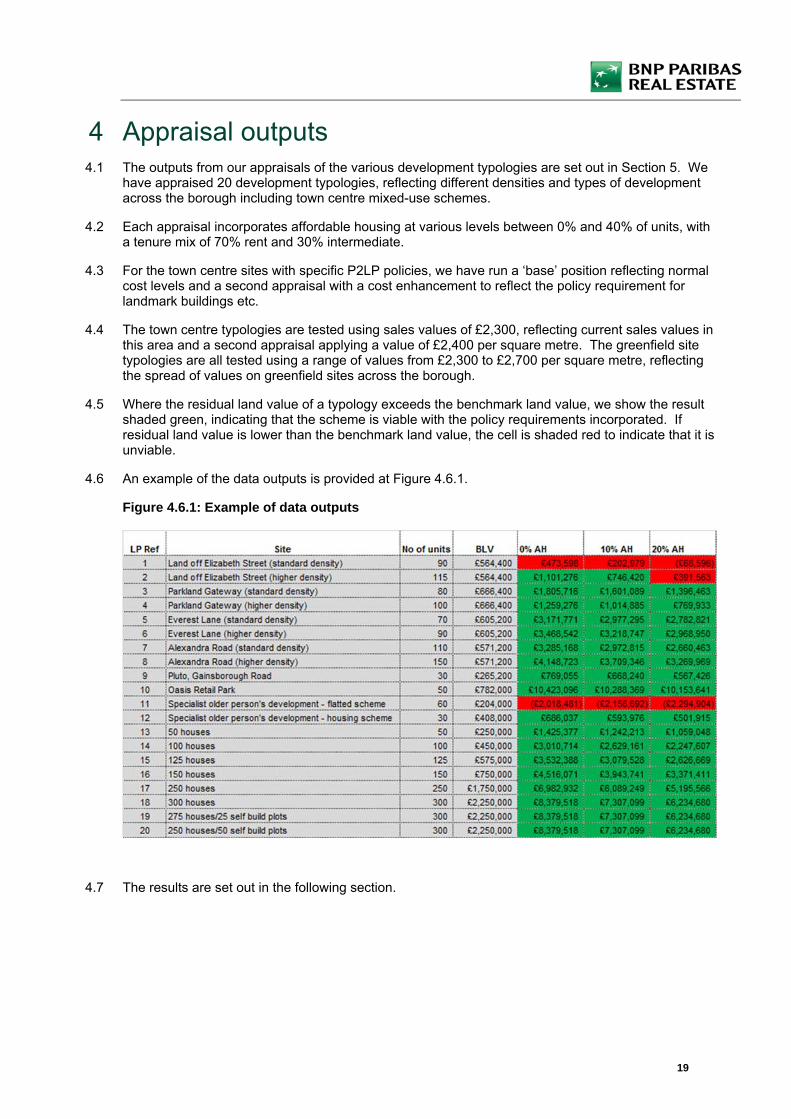
4.6 An example of the data outputs is provided at Figure 4.6.1.
Figure 4.6.1: Example of data outputs
4.7 The results are set out in the following section.
20
5 Appraisal results 5.1 This section sets out the results of our appraisals with the residual land values calculated for scenarios
with sales values and capital values reflective of market conditions across the Borough.
5.2 Development value is finite and is rarely enhanced through the adoption of new policy requirements. This is because existing use values are sometimes relatively high prior to development. In contrast, areas which have previously undeveloped land clearly have greater scope to secure an uplift in land value through the planning process. Corby is seeking to bring forward both sites in the town centre that are previously developed and sites outside the town centre that are within the wider urban area.
5.3 In assessing the results, it is important to clearly distinguish between two scenarios; namely, schemes that are unviable regardless of the Council’s policy requirements and schemes that are viable prior to the imposition of policy requirements. If a scheme is unviable before policy requirements, planning obligations and other policies are applied, it is unlikely to come forward and policy requirements would not be a factor that comes into play in the developer’s/landowner’s decision making. The unviable schemes will only become viable following an increase in values and/or a reduction in construction costs, and sites would remain in their existing use.
5.4 There is clearly a balance that has to be struck between the aims of JCS Policy 30 on the delivery of affordable housing and securing adequate contributions towards infrastructure from the developments that contribute towards the need for new infrastructure. The extent of planning obligations cannot therefore be set on the basis that every single development typology right across the borough will deliver 30%, as this is not always viable.
Site specific policies
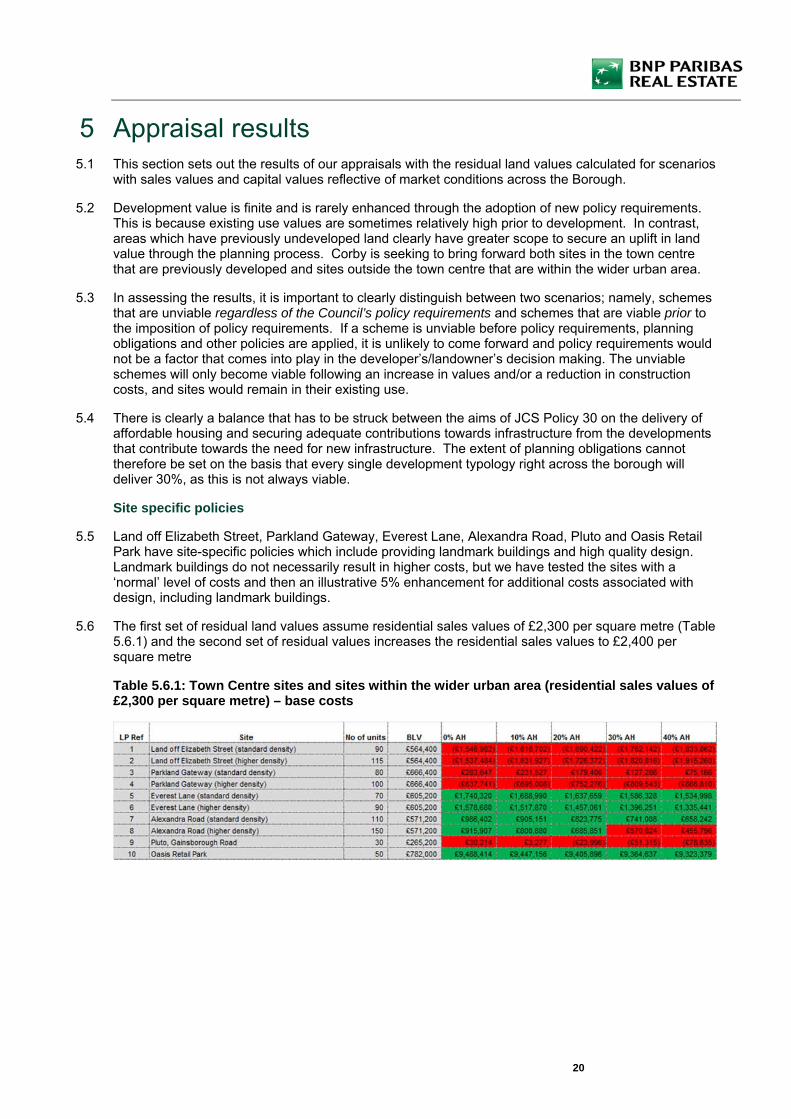
5.5 Land off Elizabeth Street, Parkland Gateway, Everest Lane, Alexandra Road, Pluto and Oasis Retail Park have site-specific policies which include providing landmark buildings and high quality design. Landmark buildings do not necessarily result in higher costs, but we have tested the sites with a ‘normal’ level of costs and then an illustrative 5% enhancement for additional costs associated with design, including landmark buildings.
5.6 The first set of residual land values assume residential sales values of £2,300 per square metre (Table 5.6.1) and the second set of residual values increases the residential sales values to £2,400 per square metre
Table 5.6.1: Town Centre sites and sites within the wider urban area (residential sales values of £2,300 per square metre) – base costs

21
Table 5.6.2: Town Centre sites and sites within wider urban area (residential sales values of £2,400 per square metre) – base costs
5.7 At values of £2,400 per square metre, the viability of the town centre sites improves, although some sites remain in deficit against the benchmark land values. Clearly P2LP sets out the Council’s long term vision and it is not envisaged that these sites will come forward at the beginning of the plan period. Modest growth will see the sites becoming more viable, as shown in Table 5.7.1, which increases sales values to £2,700 per square metre reflecting medium term growth. It would also be possible for Vacant Building Credit to be deployed to assist with the viability of developments which are marginally viable.
Table 5.7.1: Town Centre sites and sites within wider urban area (residential sales values of £2,700 per square metre) – base costs
5.8 Table 5.8.1 and 5.8.2 test the impact of an increase in build costs to reflect the policy requirement for design enhancements, landmark buildings and innovative parking solutions.
Table 5.8.1: Town Centre Sites and sites within wider urban area (residential sales values of £2,300 per square metre) – costs increased by 5% above base level
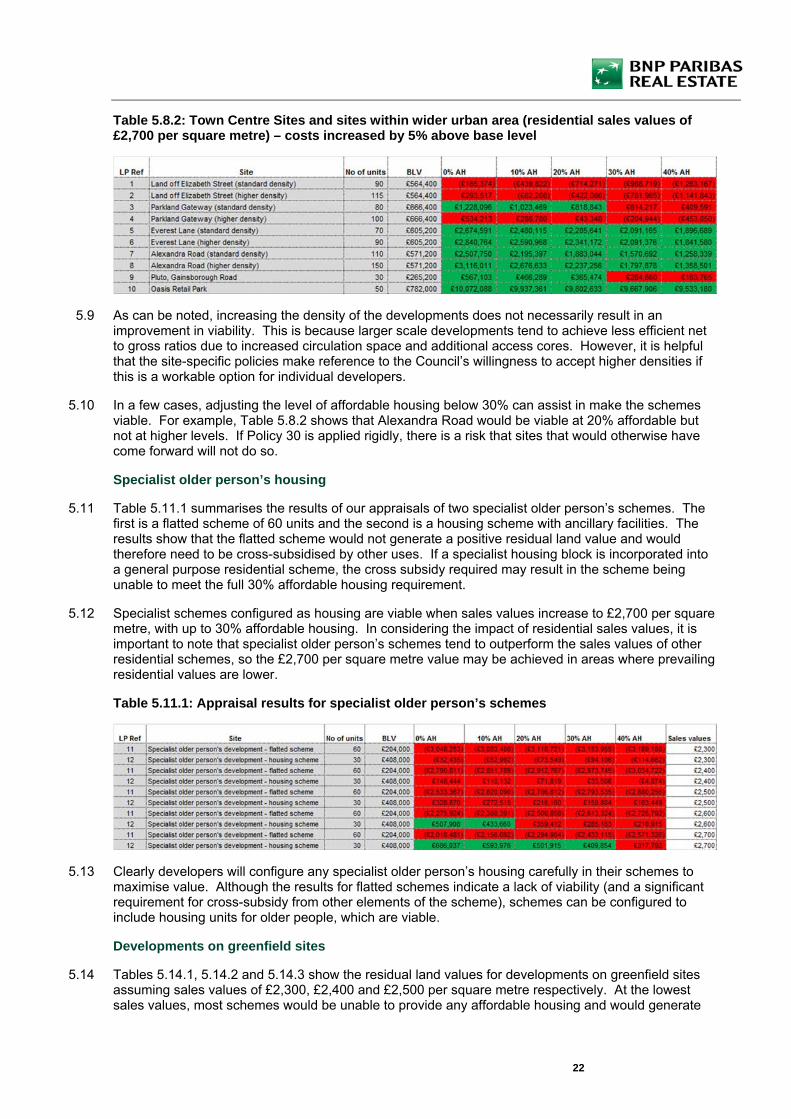
22
Table 5.8.2: Town Centre Sites and sites within wider urban area (residential sales values of £2,700 per square metre) – costs increased by 5% above base level
5.9 As can be noted, increasing the density of the developments does not necessarily result in an improvement in viability. This is because larger scale developments tend to achieve less efficient net to gross ratios due to increased circulation space and additional access cores. However, it is helpful that the site-specific policies make reference to the Council’s willingness to accept higher densities if this is a workable option for individual developers.
5.10 In a few cases, adjusting the level of affordable housing below 30% can assist in make the schemes viable. For example, Table 5.8.2 shows that Alexandra Road would be viable at 20% affordable but not at higher levels. If Policy 30 is applied rigidly, there is a risk that sites that would otherwise have come forward will not do so.
Specialist older person’s housing
5.11 Table 5.11.1 summarises the results of our appraisals of two specialist older person’s schemes. The first is a flatted scheme of 60 units and the second is a housing scheme with ancillary facilities. The results show that the flatted scheme would not generate a positive residual land value and would therefore need to be cross-subsidised by other uses. If a specialist housing block is incorporated into a general purpose residential scheme, the cross subsidy required may result in the scheme being unable to meet the full 30% affordable housing requirement.
5.12 Specialist schemes configured as housing are viable when sales values increase to £2,700 per square metre, with up to 30% affordable housing. In considering the impact of residential sales values, it is important to note that specialist older person’s schemes tend to outperform the sales values of other residential schemes, so the £2,700 per square metre value may be achieved in areas where prevailing residential values are lower.
Table 5.11.1: Appraisal results for specialist older person’s schemes
5.13 Clearly developers will configure any specialist older person’s housing carefully in their schemes to maximise value. Although the results for flatted schemes indicate a lack of viability (and a significant requirement for cross-subsidy from other elements of the scheme), schemes can be configured to include housing units for older people, which are viable.
Developments on greenfield sites
5.14 Tables 5.14.1, 5.14.2 and 5.14.3 show the residual land values for developments on greenfield sites assuming sales values of £2,300, £2,400 and £2,500 per square metre respectively. At the lowest sales values, most schemes would be unable to provide any affordable housing and would generate
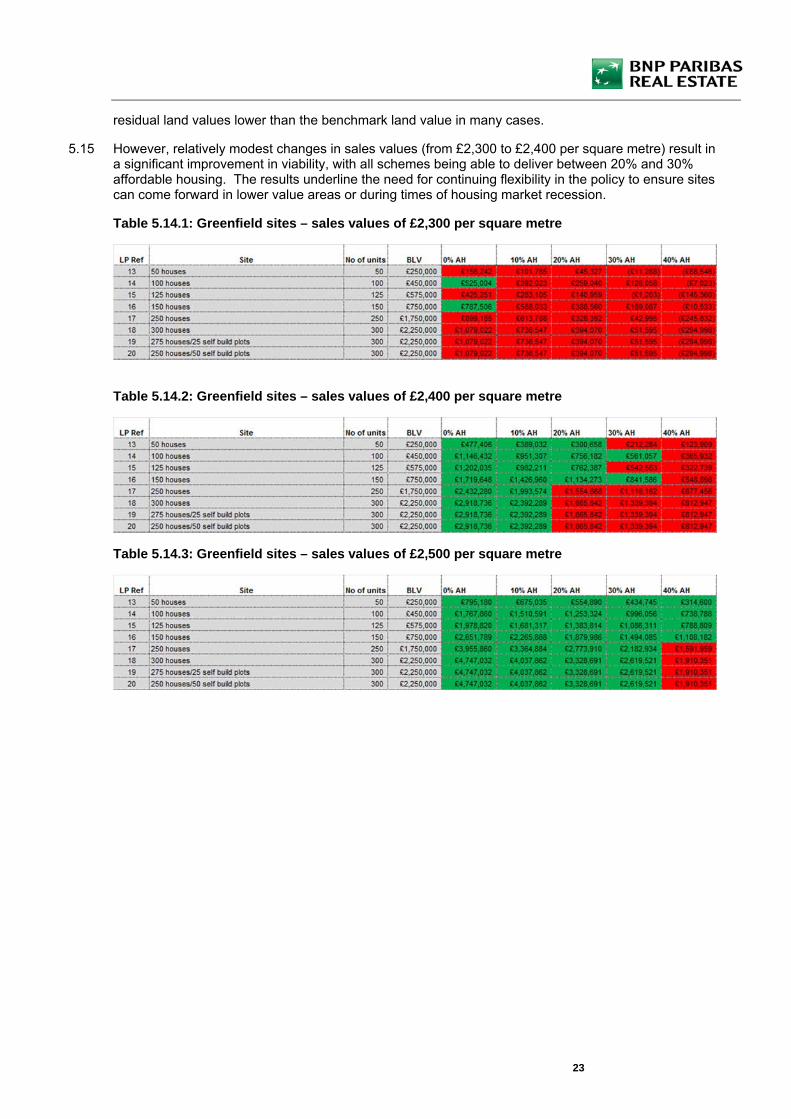
23
residual land values lower than the benchmark land value in many cases.
5.15 However, relatively modest changes in sales values (from £2,300 to £2,400 per square metre) result in a significant improvement in viability, with all schemes being able to deliver between 20% and 30% affordable housing. The results underline the need for continuing flexibility in the policy to ensure sites can come forward in lower value areas or during times of housing market recession.
Table 5.14.1: Greenfield sites – sales values of £2,300 per square metre
Table 5.14.2: Greenfield sites – sales values of £2,400 per square metre
Table 5.14.3: Greenfield sites – sales values of £2,500 per square metre
24
6 Conclusions and recommendations 6.1 The PPG on ‘Planning Obligations’ (March 2019) states that the combined total impact of planning
obligations should not “undermine the delivery of the plan” (para 003). It goes on to state that “Plans should be informed by evidence of infrastructure and affordable housing need, and a proportionate assessment of viability that takes into account all relevant policies, and local and national standards including the cost implications of CIL and planning obligations” (para 005). This report and its supporting appendices test the ability of development typologies in Corby to support the requirements set out in the Council’s draft P2LP alongside other Local Plan policies, most notably affordable housing requirements.
6.2 Site-specific policies for town centre sites set out the Council’s aspiration for high quality design, including landmark buildings. Schemes can in principle be well designed without incurring additional costs. However, landmark buildings that may require additional height may add to costs. Our appraisals indicate that the P2LP requirements can be accommodated on some of the sites when current sales values are applied. However, on other sites, modest increases in sales values would be required for the schemes to become viable. It is our understanding that the Council does not rely upon all the town centre schemes coming forward at the beginning of the plan period, so there is scope for change in the second phase of the plan period.
6.3 P2LP also includes the option for developers to increase density on the town centre sites to offset the requirement for high quality design and landmark buildings. Although our appraisals indicate that increasing density does not improve viability, this is a high level exercise undertaken without the benefit of detailed design. A well designed high density scheme could attract higher sales values than those we have modelled, which would result in an increase in residual land value, thus improving the ability of the scheme to provide affordable housing.
6.4 The P2LP requirement for custom-build housing is unlikely to have anything more than a deminimis impact on scheme viability. Current structures available for delivering such housing can actually result in overall cost reductions, as Developer’s profit is applied to the (lower) land value they will receive from purchasers, rather than to the (higher) end sales value of the unit. With profit being a cost component in the residual valuation, reduced profit will increase the residual land value.
6.5 The requirement for specialist housing for older people can be absorbed by developments, but configuration will be critical. Specialist housing schemes typically achieve premium sales values above general market units but they have higher costs associated with the delivery of extensive communal and ancillary space. Specialist housing delivered as housing is generally viable, but flatted units would require cross-subsidy from other uses, which is likely to result in reduced capacity for other planning requirements, including affordable housing.
6.6 Meeting the pre-existing 30% affordable housing target is challenging in the settlements where sales values are at the lower end of the borough range. The policy is, in any case, applied flexibly, having regards to site-specific viability at the planning application stage.
6.7 In these instances, the Council may need to apply the requirements flexibly and weigh which are priorities over others. In some instances, the Council may decide to accept a reduced quantum of affordable housing (below its 30% policy target) to facilitate a scheme meeting other P2LP or JCS requirements. Clearly there are trade-offs between affordable housing, contributions towards infrastructure and requirements in the P2LP and all of these serve vital functions in weighing the planning balance.
6.8 The ideal scenario will clearly be that developers fully reflect the full range of P2LP requirements in their bids for land so that land values reduce to accommodate planning policy. The Planning Practice Guidance emphasises the need for local planning authorities to clearly set out their requirements so that they can be priced into land. The Council’s P2LP clearly provides this clarity. However, in some instances, this would result in residual land values that are lower than existing use values of sites and in these instances, flexible application of the requirements will be needed, assuming the Council wishes or needs to see that particular site coming forward.

25
6.9 The evidence base presented in this report provides justification that the Council’s emerging requirements will not put development at risk having regards to the flexible application of other policy requirements, most notably affordable housing. Our appraisals do not show that all development typologies can viably deliver all of the emerging requirements, but that the bulk of schemes will be able to make a significant contribution towards affordable housing and other planning requirements.

26
Appendix 1 - Sites details
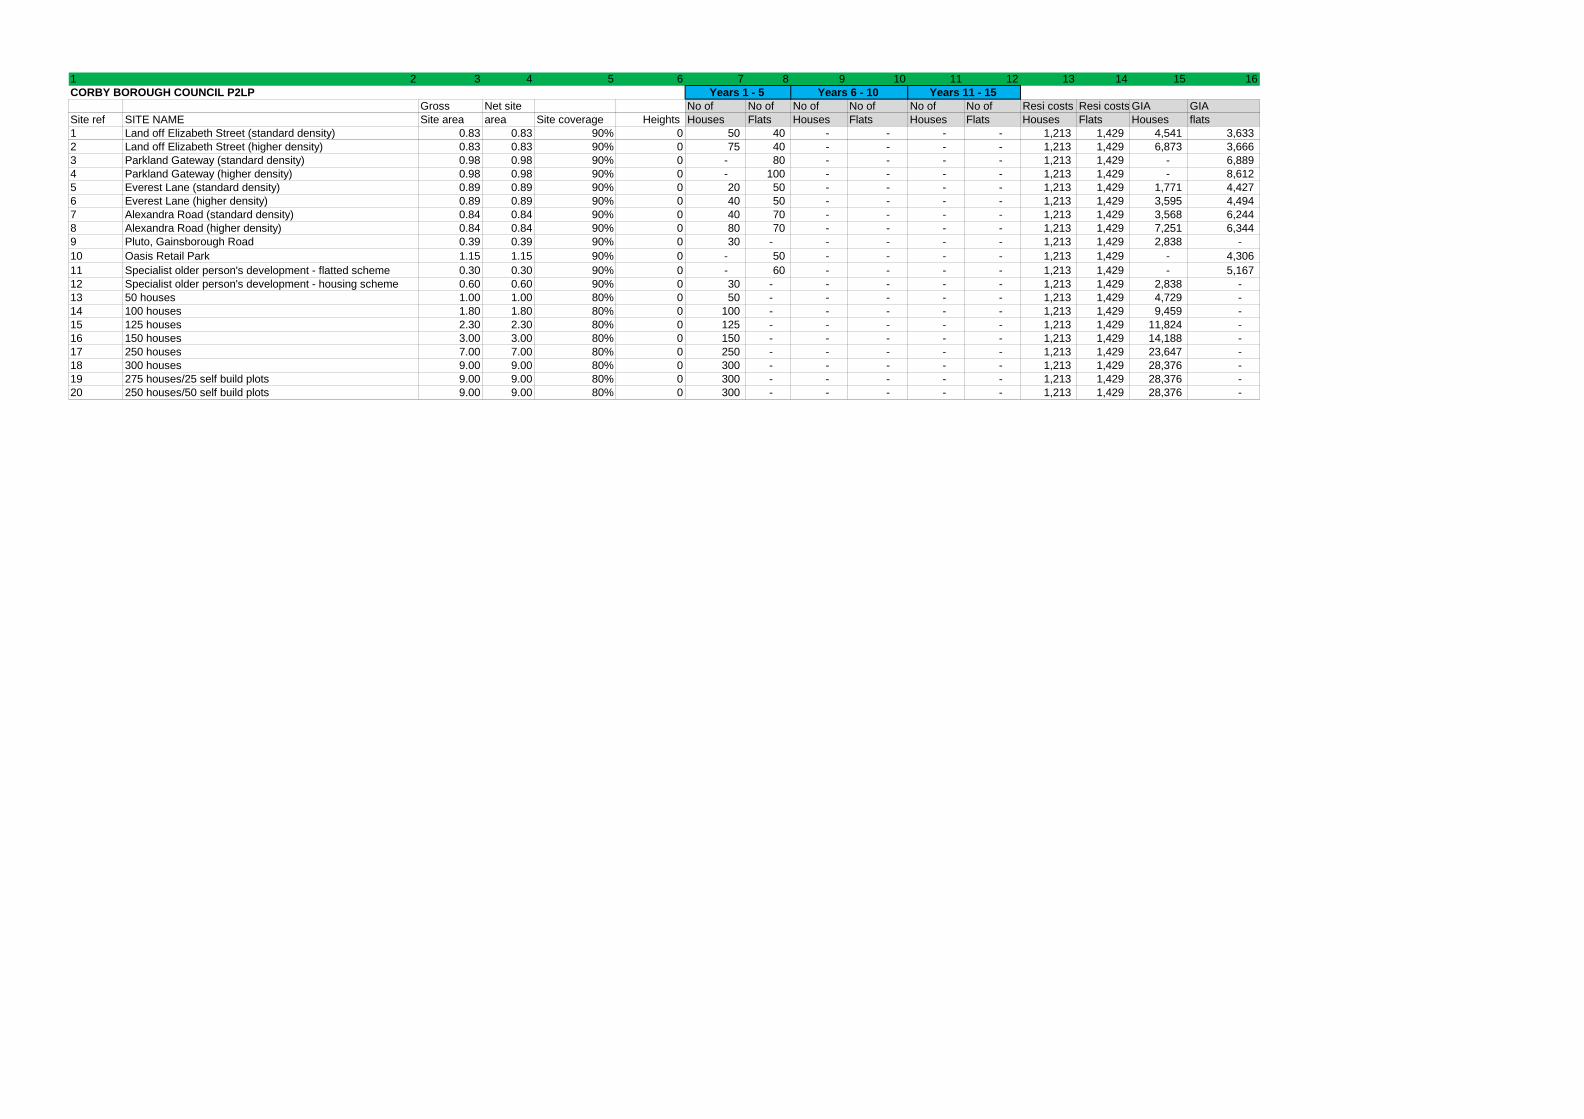
1 2 3 4 5 6 7 8 9 10 11 12 13 14 15 16CORBY BOROUGH COUNCIL P2LP
Gross Net site No of No of No of No of No of No of Resi costs Resi costs GIA GIA Site ref SITE NAME Site area area Site coverage Heights Houses Flats Houses Flats Houses Flats Houses Flats Houses flats 1 Land off Elizabeth Street (standard density) 0.83 0.83 90% 0 50 40 - - - - 1,213 1,429 4,541 3,633 2 Land off Elizabeth Street (higher density) 0.83 0.83 90% 0 75 40 - - - - 1,213 1,429 6,873 3,666 3 Parkland Gateway (standard density) 0.98 0.98 90% 0 - 80 - - - - 1,213 1,429 - 6,889 4 Parkland Gateway (higher density) 0.98 0.98 90% 0 - 100 - - - - 1,213 1,429 - 8,612 5 Everest Lane (standard density) 0.89 0.89 90% 0 20 50 - - - - 1,213 1,429 1,771 4,427 6 Everest Lane (higher density) 0.89 0.89 90% 0 40 50 - - - - 1,213 1,429 3,595 4,494 7 Alexandra Road (standard density) 0.84 0.84 90% 0 40 70 - - - - 1,213 1,429 3,568 6,244 8 Alexandra Road (higher density) 0.84 0.84 90% 0 80 70 - - - - 1,213 1,429 7,251 6,344 9 Pluto, Gainsborough Road 0.39 0.39 90% 0 30 - - - - - 1,213 1,429 2,838 - 10 Oasis Retail Park 1.15 1.15 90% 0 - 50 - - - - 1,213 1,429 - 4,306 11 Specialist older person's development - flatted scheme 0.30 0.30 90% 0 - 60 - - - - 1,213 1,429 - 5,167 12 Specialist older person's development - housing scheme 0.60 0.60 90% 0 30 - - - - - 1,213 1,429 2,838 - 13 50 houses 1.00 1.00 80% 0 50 - - - - - 1,213 1,429 4,729 - 14 100 houses 1.80 1.80 80% 0 100 - - - - - 1,213 1,429 9,459 - 15 125 houses 2.30 2.30 80% 0 125 - - - - - 1,213 1,429 11,824 - 16 150 houses 3.00 3.00 80% 0 150 - - - - - 1,213 1,429 14,188 - 17 250 houses 7.00 7.00 80% 0 250 - - - - - 1,213 1,429 23,647 - 18 300 houses 9.00 9.00 80% 0 300 - - - - - 1,213 1,429 28,376 - 19 275 houses/25 self build plots 9.00 9.00 80% 0 300 - - - - - 1,213 1,429 28,376 - 20 250 houses/50 self build plots 9.00 9.00 80% 0 300 - - - - - 1,213 1,429 28,376 -
Years 1 - 5 Years 6 - 10 Years 11 - 15
1CORBY BO
Site ref1234567891011121314151617181920
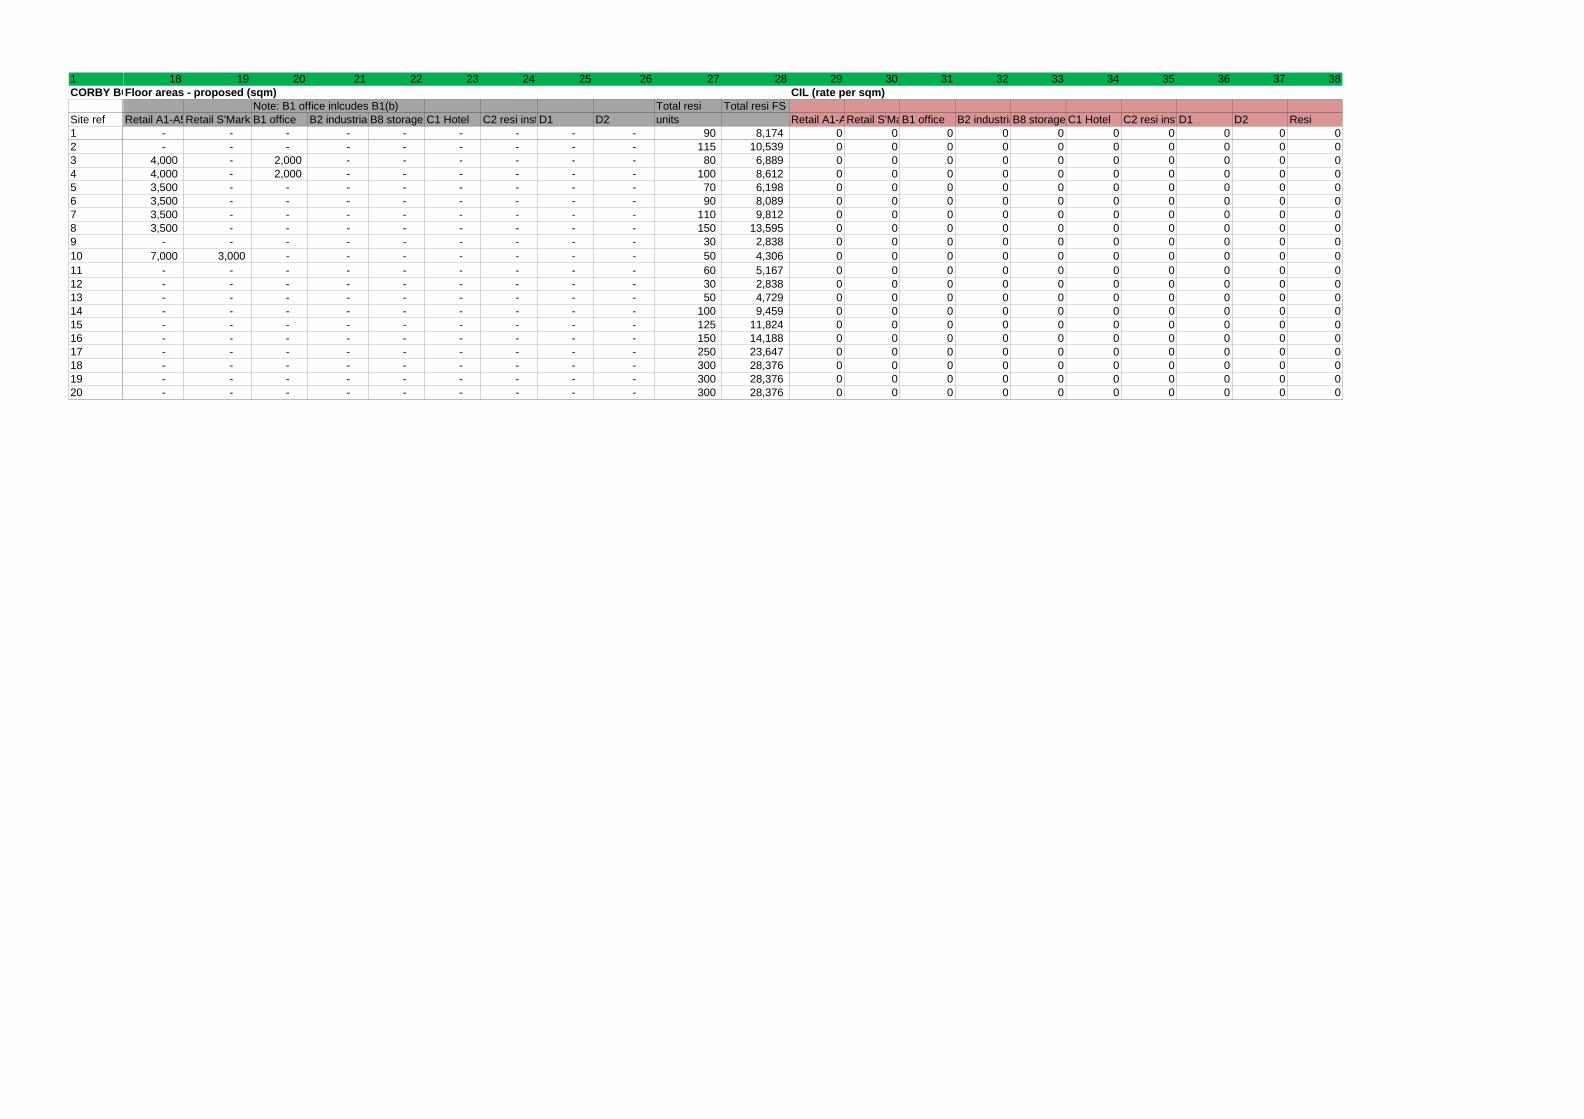
18 19 20 21 22 23 24 25 26 27 28 29 30 31 32 33 34 35 36 37 38Floor areas - proposed (sqm) CIL (rate per sqm)
Note: B1 office inlcudes B1(b) Total resi Total resi FSRetail A1-A5Retail S'Mark B1 office B2 industria B8 storage C1 Hotel C2 resi instD1 D2 units Retail A1-ARetail S'MaB1 office B2 industriaB8 storage C1 Hotel C2 resi instD1 D2 Resi
- - - - - - - - - 90 8,174 0 0 0 0 0 0 0 0 0 0- - - - - - - - - 115 10,539 0 0 0 0 0 0 0 0 0 0
4,000 - 2,000 - - - - - - 80 6,889 0 0 0 0 0 0 0 0 0 04,000 - 2,000 - - - - - - 100 8,612 0 0 0 0 0 0 0 0 0 03,500 - - - - - - - - 70 6,198 0 0 0 0 0 0 0 0 0 03,500 - - - - - - - - 90 8,089 0 0 0 0 0 0 0 0 0 03,500 - - - - - - - - 110 9,812 0 0 0 0 0 0 0 0 0 03,500 - - - - - - - - 150 13,595 0 0 0 0 0 0 0 0 0 0
- - - - - - - - - 30 2,838 0 0 0 0 0 0 0 0 0 07,000 3,000 - - - - - - - 50 4,306 0 0 0 0 0 0 0 0 0 0
- - - - - - - - - 60 5,167 0 0 0 0 0 0 0 0 0 0- - - - - - - - - 30 2,838 0 0 0 0 0 0 0 0 0 0- - - - - - - - - 50 4,729 0 0 0 0 0 0 0 0 0 0- - - - - - - - - 100 9,459 0 0 0 0 0 0 0 0 0 0- - - - - - - - - 125 11,824 0 0 0 0 0 0 0 0 0 0- - - - - - - - - 150 14,188 0 0 0 0 0 0 0 0 0 0- - - - - - - - - 250 23,647 0 0 0 0 0 0 0 0 0 0- - - - - - - - - 300 28,376 0 0 0 0 0 0 0 0 0 0- - - - - - - - - 300 28,376 0 0 0 0 0 0 0 0 0 0- - - - - - - - - 300 28,376 0 0 0 0 0 0 0 0 0 0

1CORBY BO
Site ref1234567891011121314151617181920
48 49 50 51 52 53 54 55 56 57 58 59 60 61 62 63 64 65 66 67 68 69 70 71S106 (per sqm for commercial; per unit for resi Rents Cap val Yields
E&T cost Retail A1-ARetail S'MaB1 office B2 industriaB8 storage C1 Hotel C2 resi instD1 D2 Resi Retail A1-ARetail S'MaB1 office B2 industriaB8 storage C1 Hotel C2 resi instD1 D2 Resi Retail A1-ARetail S'MaB1 office
- 20 20 20 20 20 20 20 20 20 5,000 269 250 215 170 170 300 300 250 250 2,700 7.00% 5.00% 8.00%- 20 20 20 20 20 20 20 20 20 5,000 269 250 215 170 170 300 300 250 250 2,700 7.00% 5.00% 8.00%- 20 20 20 20 20 20 20 20 20 5,000 269 250 215 170 170 300 300 250 250 2,700 7.00% 5.00% 8.00%- 20 20 20 20 20 20 20 20 20 5,000 269 250 215 170 170 300 300 250 250 2,700 7.00% 5.00% 8.00%- 20 20 20 20 20 20 20 20 20 5,000 269 250 215 170 170 300 300 250 250 2,700 7.00% 5.00% 8.00%- 20 20 20 20 20 20 20 20 20 5,000 269 250 215 170 170 300 300 250 250 2,700 7.00% 5.00% 8.00%- 20 20 20 20 20 20 20 20 20 5,000 269 250 215 170 170 300 300 250 250 2,700 7.00% 5.00% 8.00%- 20 20 20 20 20 20 20 20 20 5,000 269 250 215 170 170 300 300 250 250 2,700 7.00% 5.00% 8.00%- 20 20 20 20 20 20 20 20 20 5,000 269 250 215 170 170 300 300 250 250 2,700 7.00% 5.00% 8.00%- 20 20 20 20 20 20 20 20 20 5,000 269 250 215 170 170 300 300 250 250 2,700 7.00% 5.00% 8.00%- 20 20 20 20 20 20 20 20 20 5,000 269 250 215 170 170 300 300 250 250 2,700 7.00% 5.00% 8.00%- 20 20 20 20 20 20 20 20 20 5,000 269 250 215 170 170 300 300 250 250 2,700 7.00% 5.00% 8.00%- 20 20 20 20 20 20 20 20 20 5,000 269 250 215 170 170 300 300 250 250 2,700 7.00% 5.00% 8.00%- 20 20 20 20 20 20 20 20 20 5,000 269 250 215 170 170 300 300 250 250 2,700 7.00% 5.00% 8.00%- 20 20 20 20 20 20 20 20 20 5,000 269 250 215 170 170 300 300 250 250 2,700 7.00% 5.00% 8.00%- 20 20 20 20 20 20 20 20 20 5,000 269 250 215 170 170 300 300 250 250 2,700 7.00% 5.00% 8.00%- 20 20 20 20 20 20 20 20 20 5,000 269 250 215 170 170 300 300 250 250 2,700 7.00% 5.00% 8.00%- 20 20 20 20 20 20 20 20 20 5,000 269 250 215 170 170 300 300 250 250 2,700 7.00% 5.00% 8.00%- 20 20 20 20 20 20 20 20 20 5,000 269 250 215 170 170 300 300 250 250 2,700 7.00% 5.00% 8.00%- 20 20 20 20 20 20 20 20 20 5,000 269 250 215 170 170 300 300 250 250 2,700 7.00% 5.00% 8.00%

1CORBY BO
Site ref1234567891011121314151617181920
72 73 74 75 76 77 78 79 80 81 82 83 84 85 86 87 88 89 90 91 92 93 94n/a Build costs Net to gross
NOT USEDB2 industriaB8 storage C1 Hotel C2 resi instD1 D2 Resi Retail A1-A5 Retail S'MaB1 office B2 industriaB8 storage C1 Hotel C2 resi instD1 D2 Retail A1-A5Retail S'MaB1 office B2 industrial B8 storage C1 Hotel
6.00% 6.00% 5.00% 6.00% 7.00% 7.00% 1,161 1,556 1,865 1,164 1,129 2,284 2,284 2,549 2,537 85% 85% 85% 85% 85% 85%6.00% 6.00% 5.00% 6.00% 7.00% 7.00% 1,161 1,556 1,865 1,164 1,129 2,284 2,284 2,549 2,537 85% 85% 85% 85% 85% 85%6.00% 6.00% 5.00% 6.00% 7.00% 7.00% 1,161 1,556 1,865 1,164 1,129 2,284 2,284 2,549 2,537 85% 85% 85% 85% 85% 85%6.00% 6.00% 5.00% 6.00% 7.00% 7.00% 1,161 1,556 1,865 1,164 1,129 2,284 2,284 2,549 2,537 85% 85% 85% 85% 85% 85%6.00% 6.00% 5.00% 6.00% 7.00% 7.00% 1,161 1,556 1,865 1,164 1,129 2,284 2,284 2,549 2,537 85% 85% 85% 85% 85% 85%6.00% 6.00% 5.00% 6.00% 7.00% 7.00% 1,161 1,556 1,865 1,164 1,129 2,284 2,284 2,549 2,537 85% 85% 85% 85% 85% 85%6.00% 6.00% 5.00% 6.00% 7.00% 7.00% 1,161 1,556 1,865 1,164 1,129 2,284 2,284 2,549 2,537 85% 85% 85% 85% 85% 85%6.00% 6.00% 5.00% 6.00% 7.00% 7.00% 1,161 1,556 1,865 1,164 1,129 2,284 2,284 2,549 2,537 85% 85% 85% 85% 85% 85%6.00% 6.00% 5.00% 6.00% 7.00% 7.00% 1,161 1,556 1,865 1,164 1,129 2,284 2,284 2,549 2,537 85% 85% 85% 85% 85% 85%6.00% 6.00% 5.00% 6.00% 7.00% 7.00% 1,161 1,556 1,865 1,164 1,129 2,284 2,284 2,549 2,537 85% 85% 85% 85% 85% 85%6.00% 6.00% 5.00% 6.00% 7.00% 7.00% 1,161 1,556 1,865 1,164 1,129 2,284 2,284 2,549 2,537 85% 85% 85% 85% 85% 85%6.00% 6.00% 5.00% 6.00% 7.00% 7.00% 1,161 1,556 1,865 1,164 1,129 2,284 2,284 2,549 2,537 85% 85% 85% 85% 85% 85%6.00% 6.00% 5.00% 6.00% 7.00% 7.00% 1,161 1,556 1,865 1,164 1,129 2,284 2,284 2,549 2,537 85% 85% 85% 85% 85% 85%6.00% 6.00% 5.00% 6.00% 7.00% 7.00% 1,161 1,556 1,865 1,164 1,129 2,284 2,284 2,549 2,537 85% 85% 85% 85% 85% 85%6.00% 6.00% 5.00% 6.00% 7.00% 7.00% 1,161 1,556 1,865 1,164 1,129 2,284 2,284 2,549 2,537 85% 85% 85% 85% 85% 85%6.00% 6.00% 5.00% 6.00% 7.00% 7.00% 1,161 1,556 1,865 1,164 1,129 2,284 2,284 2,549 2,537 85% 85% 85% 85% 85% 85%6.00% 6.00% 5.00% 6.00% 7.00% 7.00% 1,161 1,556 1,865 1,164 1,129 2,284 2,284 2,549 2,537 85% 85% 85% 85% 85% 85%6.00% 6.00% 5.00% 6.00% 7.00% 7.00% 1,161 1,556 1,865 1,164 1,129 2,284 2,284 2,549 2,537 85% 85% 85% 85% 85% 85%6.00% 6.00% 5.00% 6.00% 7.00% 7.00% 1,161 1,556 1,865 1,164 1,129 2,284 2,284 2,549 2,537 85% 85% 85% 85% 85% 85%6.00% 6.00% 5.00% 6.00% 7.00% 7.00% 1,161 1,556 1,865 1,164 1,129 2,284 2,284 2,549 2,537 85% 85% 85% 85% 85% 85%
1CORBY BO
Site ref1234567891011121314151617181920
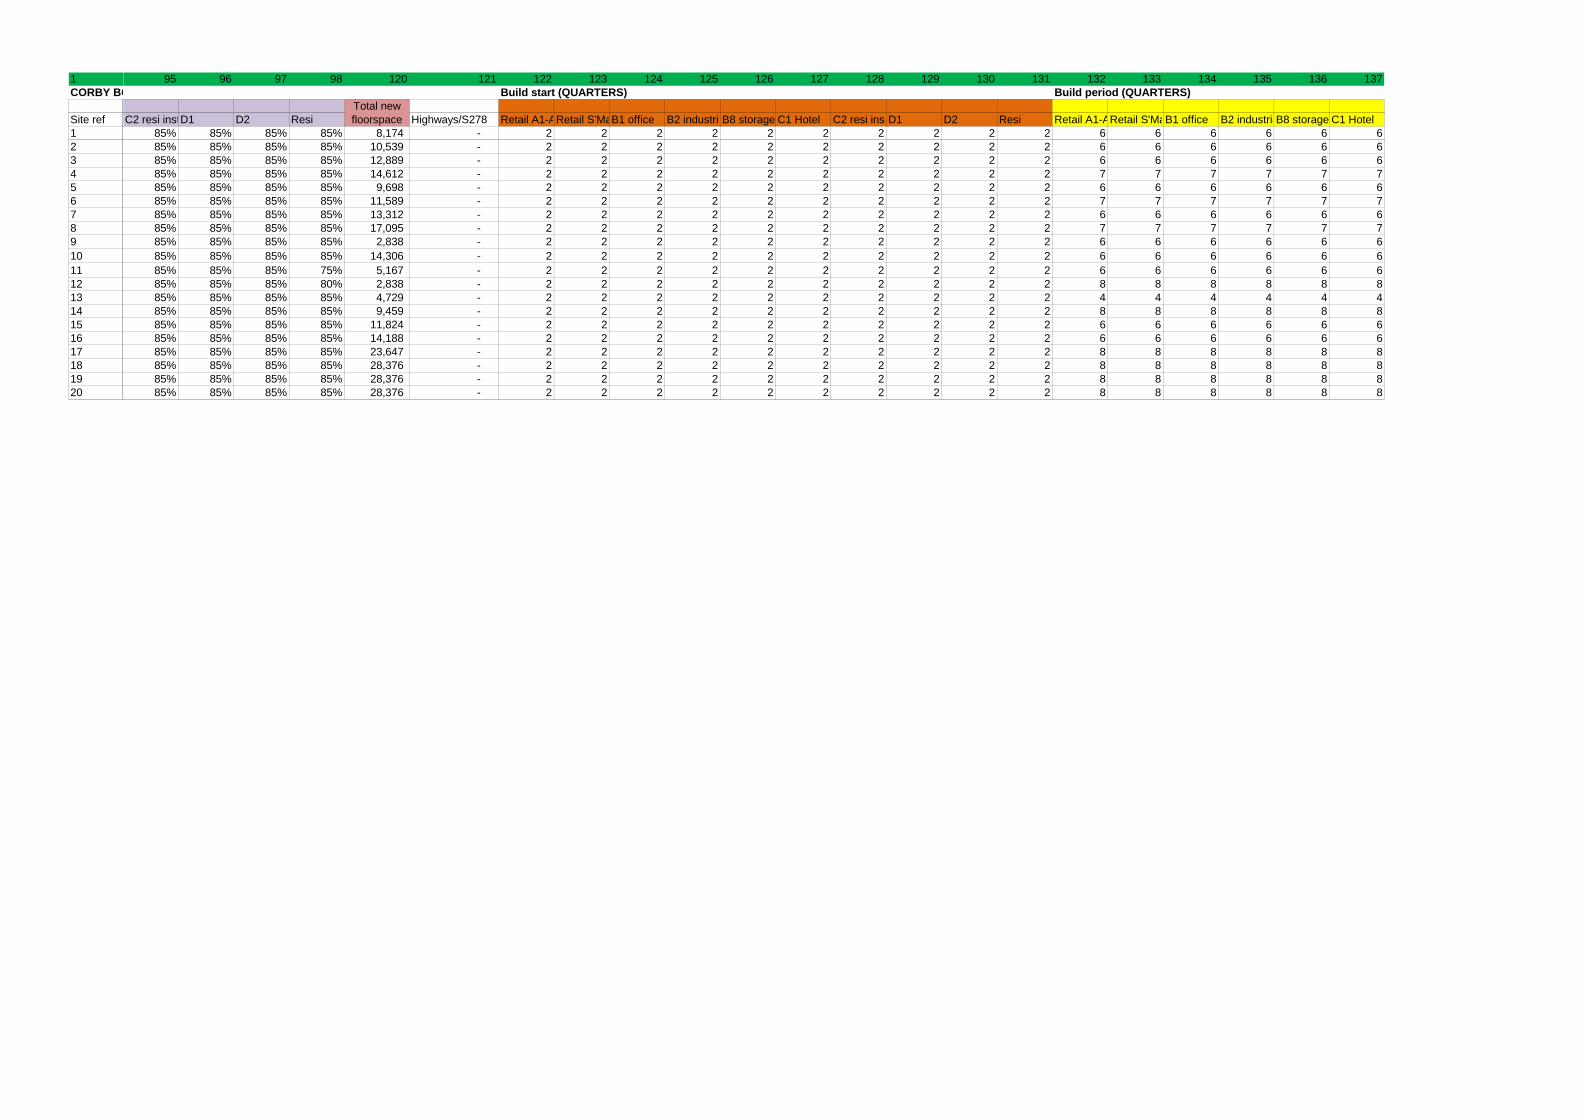
95 96 97 98 120 121 122 123 124 125 126 127 128 129 130 131 132 133 134 135 136 137Build start (QUARTERS) Build period (QUARTERS)
C2 resi instD1 D2 Resi Highways/S278 Retail A1-ARetail S'MaB1 office B2 industriaB8 storage C1 Hotel C2 resi instD1 D2 Resi Retail A1-ARetail S'MaB1 office B2 industriaB8 storage C1 Hotel 85% 85% 85% 85% 8,174 - 2 2 2 2 2 2 2 2 2 2 6 6 6 6 6 685% 85% 85% 85% 10,539 - 2 2 2 2 2 2 2 2 2 2 6 6 6 6 6 685% 85% 85% 85% 12,889 - 2 2 2 2 2 2 2 2 2 2 6 6 6 6 6 685% 85% 85% 85% 14,612 - 2 2 2 2 2 2 2 2 2 2 7 7 7 7 7 785% 85% 85% 85% 9,698 - 2 2 2 2 2 2 2 2 2 2 6 6 6 6 6 685% 85% 85% 85% 11,589 - 2 2 2 2 2 2 2 2 2 2 7 7 7 7 7 785% 85% 85% 85% 13,312 - 2 2 2 2 2 2 2 2 2 2 6 6 6 6 6 685% 85% 85% 85% 17,095 - 2 2 2 2 2 2 2 2 2 2 7 7 7 7 7 785% 85% 85% 85% 2,838 - 2 2 2 2 2 2 2 2 2 2 6 6 6 6 6 685% 85% 85% 85% 14,306 - 2 2 2 2 2 2 2 2 2 2 6 6 6 6 6 685% 85% 85% 75% 5,167 - 2 2 2 2 2 2 2 2 2 2 6 6 6 6 6 685% 85% 85% 80% 2,838 - 2 2 2 2 2 2 2 2 2 2 8 8 8 8 8 885% 85% 85% 85% 4,729 - 2 2 2 2 2 2 2 2 2 2 4 4 4 4 4 485% 85% 85% 85% 9,459 - 2 2 2 2 2 2 2 2 2 2 8 8 8 8 8 885% 85% 85% 85% 11,824 - 2 2 2 2 2 2 2 2 2 2 6 6 6 6 6 685% 85% 85% 85% 14,188 - 2 2 2 2 2 2 2 2 2 2 6 6 6 6 6 685% 85% 85% 85% 23,647 - 2 2 2 2 2 2 2 2 2 2 8 8 8 8 8 885% 85% 85% 85% 28,376 - 2 2 2 2 2 2 2 2 2 2 8 8 8 8 8 885% 85% 85% 85% 28,376 - 2 2 2 2 2 2 2 2 2 2 8 8 8 8 8 885% 85% 85% 85% 28,376 - 2 2 2 2 2 2 2 2 2 2 8 8 8 8 8 8
Total new floorspace

1CORBY BO
Site ref1234567891011121314151617181920
138 139 140 141 142 143 144 145 146 147 148 149 150 151 152 153 154 155 156 157Investment sale (QUARTERS) Resi sales period (qtrs) Sales period start Area On-site AH % AH rented
% of PRS C2 resi instD1 D2 Resi Retail A1-ARetail S'MaB1 office B2 industriaB8 storage C1 Hotel C2 resi instD1 D2 Resi Resi Resi units
6 6 6 6 8 8 8 8 8 8 8 8 8 4 8 0.00% 50% 70%6 6 6 6 8 8 8 8 8 8 8 8 8 4 8 0.00% 50% 70%6 6 6 6 8 8 8 8 8 8 8 8 8 4 8 0.00% 50% 70%7 7 7 7 9 9 9 9 9 9 9 9 9 4 9 0.00% 50% 70%6 6 6 6 8 8 8 8 8 8 8 8 8 4 8 0.00% 50% 70%7 7 7 7 9 9 9 9 9 9 9 9 9 4 9 0.00% 50% 70%6 6 6 6 8 8 8 8 8 8 8 8 8 4 8 0.00% 50% 70%7 7 7 8 9 9 9 9 9 9 9 9 9 4 9 0.00% 50% 70%6 6 6 6 8 8 8 8 8 8 8 8 8 4 8 0.00% 50% 70%6 6 6 6 8 8 8 8 8 8 8 8 8 4 8 0.00% 50% 70%6 6 6 6 8 8 8 8 8 8 8 8 8 4 8 0.00% 50% 70%8 8 8 8 10 10 10 10 10 10 10 10 10 4 10 0.00% 50% 70%4 4 4 4 6 6 6 6 6 6 6 6 6 4 6 0.00% 50% 70%8 8 8 8 10 10 10 10 10 10 10 10 10 6 6 0.00% 50% 70%6 6 6 6 8 8 8 8 8 8 8 8 8 6 6 0.00% 50% 70%6 6 6 8 8 8 8 8 8 8 8 8 8 6 6 0.00% 50% 70%8 8 8 8 10 10 10 10 10 10 10 10 10 8 6 0.00% 50% 70%8 8 8 8 10 10 10 10 10 10 10 10 10 8 6 0.00% 50% 70%8 8 8 8 10 10 10 10 10 10 10 10 10 8 6 0.00% 50% 70%8 8 8 8 10 10 10 10 10 10 10 10 10 8 6 0.00% 50% 70%

27
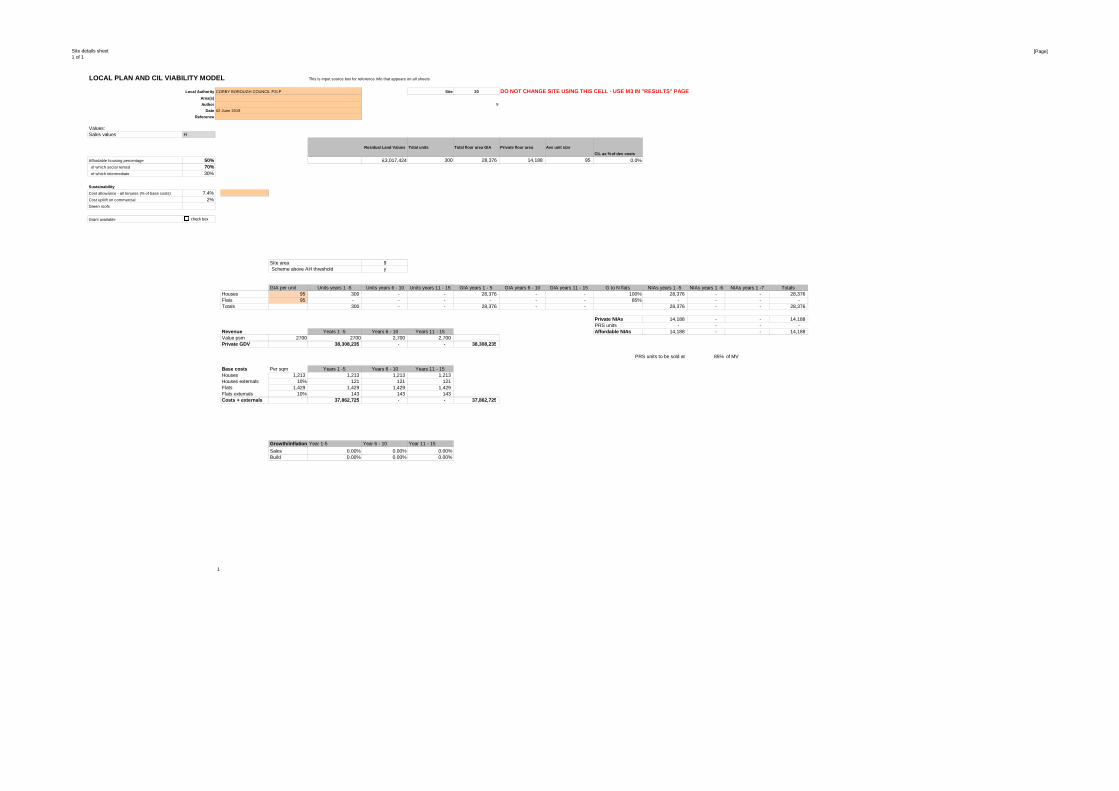
Appendix 2 - Sample appraisal
Site details sheet1 of 1
[Page]
LOCAL PLAN AND CIL VIABILITY MODEL This is input source box for reference info that appears on all sheets
Local Authority Site 20 DO NOT CHANGE SITE USING THIS CELL - USE M3 IN "RES ULTS" PAGEArea(s)
Author 9
Date
Reference
Values: FALSE A Value 1 2300Sales values H B Value 1 2350
Residual Land Values Total units Total floor area GIA Private floor area Ave unit size
CIL as % of dev costs C Value 1 2400Affordable housing percentage 50% £3,017,424 300 28,376 14,188 95 0.0% D Value 1 2450 of which social rented 70% E Value 1 2500 of which intermediate 30% F Value 1 2550
G Value 1 2600Sustainability H Value 1 2650Cost allowance - all tenures (% of base costs) 7.4% I Value 1 2700Cost upliift on commercial 2%Green roofs
Grant available
Site area 9Scheme above AH threshold y
GIA per unit Units years 1 -5 Units years 6 - 10 Units years 11 - 15 GIA years 1 - 5 GIA years 6 - 10 GIA years 11 - 15 G to N flats NIAs years 1 -5 NIAs years 1 -6 NIAs years 1 -7 Totals Houses 95 300 - - 28,376 - - 100% 28,376 - - 28,376 Flats 95 - - - - - - 85% - - - - Totals 300 - - 28,376 - - 28,376 - - 28,376
Private NIAs 14,188 - - 14,188 PRS units - - - -
Revenue Years 1 -5 Years 6 - 10 Years 11 - 15 Affordable NIAs 14,188 - - 14,188 Value psm 2700 2700 2,700 2,700 Private GDV 38,308,235 - - 38,308,235
85% of MV
Base costs Per sqm Years 1 -5 Years 6 - 10 Years 11 - 15 Houses 1,213 1,213 1,213 1,213 Houses externals 10% 121 121 121 Flats 1,429 1,429 1,429 1,429 Flats externals 10% 143 143 143 Costs + externals 37,862,725 - - 37,862,725
Growth/inflation Year 1-5 Year 6 - 10 Year 11 - 15
Sales 0.00% 0.00% 0.00%Build 0.00% 0.00% 0.00%
1
PRS units to be sold at
02 June 2019
CORBY BOROUGH COUNCIL P2LP
check box

Costs, s106, CIL, Timings, Other costs, Inflation 09/07/2019
LOCAL PLAN AND CIL VIABILITY MODEL
Local Authority
Area(s)
Author
Date
Reference
BUILD COSTS
Build start
Build period
Sales period
Sales period start S106 payments CIL Charges (incl Mayoral CIL) Fees
Typology
Build costs per gross sqm - HOUSES
Build costs per gross sq m - FLATS
External works and other costs
Gross to net adjustment for flats Quarters Quarters Quarters
Quarters from start on site
£s per sqm all tenures
Quarter paid
£s p sq m private sales only
Instal-ment 1 - Qtr paid
Instal-ment 2 - Qtr paid
Instal-ment 3 - Qtr paid
% of build cost
Residential £1,213 £1,429 £214 85.0% 2 8 8 6 £5,000 3 £0 1 2 3 9%
NB externals included in base costs in 'sites page'
£0 (Total for scheme)
£0
OTHER COSTS Cat 2 accessibility: Applies to all dwellings Nos of units: Houses £521 300
Private 17.00% Flats £924 - Affordable 6.00%
Zero carbon All tenures 7.4% Cat 3 accessibility Contingency 5% Houses £22,694 8 Marketing costs % of sales values 3.00% Flats £7,906 - Legal Fees % of GDV 0.50%
Site acquisition costs % land value 6.80%
Development Finance 6.00%
TIMINGS for cash flow PLANNING OBLIGATIONS / CIL
Developer return % GDV
CORBY BOROUGH COUNCIL P2LP
0
0
02 June 2019
0

COMMERCIAL INPUTS
Value Retail A1-A5 Retail S'Market B1 office B2 industrial B8 storage C1 Hotel C2 resi institutionD1 D2
Rent per sq m £269.10 £250.00 £215.28 £170.00 £170.00 £300.00 £300.00 £250.00 £250.00
Yield 7.00% 5.00% 8.00% 6.00% 6.00% 5.00% 6.00% 7.00% 7.00%
Rent free/void period (years) 1.0 0.50 1.00 1.00 1.00 1.00 1.00 1.00 1.00
Net floor area (sq m) - - - - - - - - -
Purchaser's costs 5.80% 5.80% 5.80% 5.80% 5.80% 5.80% 5.80% 5.80% 5.80%
Disposal CostsLetting Agent's fee (% of rent ) 10.00% 10.00% 10.00% 10.00% 10.00% 10.00% 10.00% 10.00% 10.00%
Agent's fees (on capital value) 1.00% 1.00% 1.00% 1.00% 1.00% 1.00% 1.00% 1.00% 1.00%
Legal fees (% of capital value) 0.75% 0.75% 0.75% 0.75% 0.75% 0.75% 0.75% 0.75% 0.75%
Costs Demolition costs £50 psm £50 psm £50 psm £50 psm £50 psm £50 psm £50 psm £50 psm £50 psm
Demolition area (sq m)
Building costs £1161 psm £1556 psm £1865 psm £1164 psm £1129 psm £2284 psm £2284 psm £2549 psm £2537 psm
Net to gross floor area 85.00% 85.00% 85.00% 85.00% 85.00% 85.00% 85.00% 85.00% 85.00%
External works 10.00% 10.00% 10.00% 10.00% 10.00% 10.00% 10.00% 10.00% 10.00%
CIL (incl Mayoral) £0 £0 £0 £0 £0 £0 £0 £0 £0
Crossrail S106 £0 £0 £0 £0 £0 £0 £0 £0 £0
S106 (per net sq m) £20 psm £20 psm £20 psm £20 psm £20 psm £20 psm £20 psm £20 psm £20 psm
Cashflow timing Quarters Build start 2 2 2 2 2 2 2 2 2
Build period 8 8 8 8 8 8 8 8 8
Investment sale (quarters from start on site) 10 10 10 10 10 10 10 10 10
Note: demolition of existing floorspace is loaded as a single amount on Retail A1-A5
Site 20
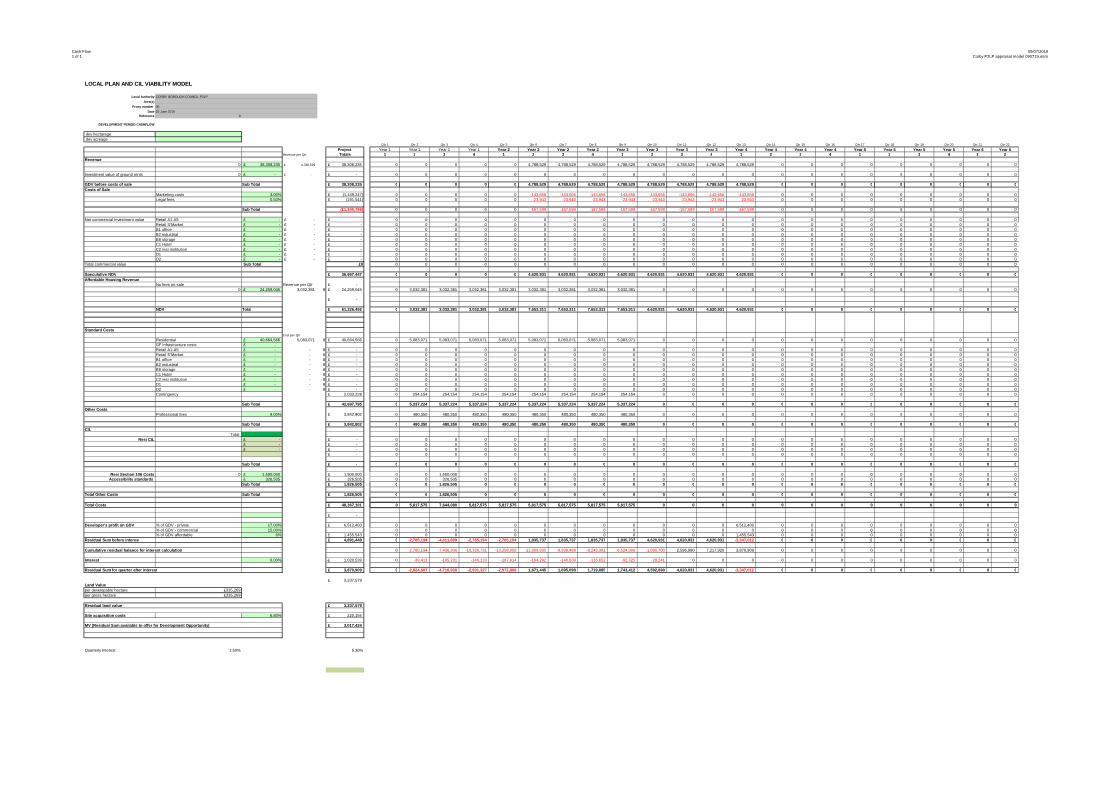
Cash Flow1 of 1
09/07/2019Corby P2LP appraisal model 090719.xlsm
LOCAL PLAN AND CIL VIABILITY MODEL
Local Authority
Area(s)
Proxy number
DateReference 9
DEVELOPMENT PERIOD CASHFLOW
dev hectarage dev acreage
Qtr 1 Qtr 2 Qtr 3 Qtr 4 Qtr 5 Qtr 6 Qtr 7 Qtr 8 Qtr 9 Qtr 10 Qtr 11 Qtr 12 Qtr 13 Qtr 14 Qtr 15 Qtr 16 Qtr 17 Qtr 18 Qtr 19 Qtr 20 Qtr 21 Qtr 22
Project Year 1 Year 1 Year 1 Year 1 Year 2 Year 2 Year 2 Year 2 Year 3 Year 3 Year 3 Year 3 Yea r 4 Year 4 Year 4 Year 4 Year 5 Year 5 Year 5 Year 5 Year 6 Year 6Revenue per Qtr Totals 1 2 3 4 1 2 3 4 1 2 3 4 1 2 3 4 1 2 3 4 1 2
Revenue0 38,308,235£ 4,788,529£ 38,308,235£ 0 0 0 0 0 4,788,529 4,788,529 4,788,529 4,788,529 4,788,529 4,788,529 4,788,529 4,788,529 0 0 0 0 0 0 0 0 0
Investment value of ground rents 0 -£ -£ -£ 0 0 0 0 0 0 0 0 0 0 0 0 0 0 0 0 0 0 0 0 0 0
GDV before costs of sale Sub Total 38,308,235£ 0 0 0 0 0 4,788,529 4,788,529 4,788,529 4,788,529 4,788,529 4,788,529 4,788,529 4,788,529 0 0 0 0 0 0 0 0 0Costs of Sale
Marketing costs 3.00% (1,149,247)£ 0 0 0 0 0 -143,656 -143,656 -143,656 -143,656 -143,656 -143,656 -143,656 -143,656 0 0 0 0 0 0 0 0 0Legal fees 0.50% (191,541)£ 0 0 0 0 0 -23,943 -23,943 -23,943 -23,943 -23,943 -23,943 -23,943 -23,943 0 0 0 0 0 0 0 0 0
Sub Total (£1,340,788) 0 0 0 0 0 -167,599 -167,599 -167,599 -167,599 -167,599 -167,599 -167,599 -167,599 0 0 0 0 0 0 0 0 0
Net commercial investment value Retail A1-A5 -£ -£ -£ 0 0 0 0 0 0 0 0 0 0 0 0 0 0 0 0 0 0 0 0 0 0Retail S'Market -£ -£ -£ 0 0 0 0 0 0 0 0 0 0 0 0 0 0 0 0 0 0 0 0 0 0B1 office -£ -£ -£ 0 0 0 0 0 0 0 0 0 0 0 0 0 0 0 0 0 0 0 0 0 0B2 industrial -£ -£ -£ 0 0 0 0 0 0 0 0 0 0 0 0 0 0 0 0 0 0 0 0 0 0B8 storage -£ -£ -£ 0 0 0 0 0 0 0 0 0 0 0 0 0 0 0 0 0 0 0 0 0 0C1 Hotel -£ -£ -£ 0 0 0 0 0 0 0 0 0 0 0 0 0 0 0 0 0 0 0 0 0 0C2 resi institution -£ -£ -£ 0 0 0 0 0 0 0 0 0 0 0 0 0 0 0 0 0 0 0 0 0 0D1 -£ -£ -£ 0 0 0 0 0 0 0 0 0 0 0 0 0 0 0 0 0 0 0 0 0 0D2 -£ -£ -£ 0 0 0 0 0 0 0 0 0 0 0 0 0 0 0 0 0 0 0 0 0 0
Total commercial value Sub Total £0 0 0 0 0 0 0 0 0 0 0 0 0 0 0 0 0 0 0 0 0 0 0
Speculative NDV 36,967,447£ 0 0 0 0 0 4,620,931 4,620,931 4,620,931 4,620,931 4,620,931 4,620,931 4,620,931 4,620,931 0 0 0 0 0 0 0 0 0Affordable Housing Revenue
No fees on sale Revenue per Qtr -£ 0 24,259,045£ 3,032,381 8 24,259,045£ 0 3,032,381 3,032,381 3,032,381 3,032,381 3,032,381 3,032,381 3,032,381 3,032,381 0 0 0 0 0 0 0 0 0 0 0 0 0
-£
NDV Total 61,226,492£ 0 3,032,381 3,032,381 3,032,381 3,032,381 7,653,311 7,653,311 7,653,311 7,653,311 4,620,931 4,620,931 4,620,931 4,620,931 0 0 0 0 0 0 0 0 0
Standard CostsCost per Qtr
Residential 40,664,566£ 5,083,071 8 40,664,566£ 0 5,083,071 5,083,071 5,083,071 5,083,071 5,083,071 5,083,071 5,083,071 5,083,071 0 0 0 0 0 0 0 0 0 0 0 0 0GF infrastructure costs -£ Retail A1-A5 -£ - 8 -£ 0 0 0 0 0 0 0 0 0 0 0 0 0 0 0 0 0 0 0 0 0 0Retail S'Market -£ - 8 -£ 0 0 0 0 0 0 0 0 0 0 0 0 0 0 0 0 0 0 0 0 0 0B1 office -£ - 8 -£ 0 0 0 0 0 0 0 0 0 0 0 0 0 0 0 0 0 0 0 0 0 0B2 industrial -£ - 8 -£ 0 0 0 0 0 0 0 0 0 0 0 0 0 0 0 0 0 0 0 0 0 0B8 storage -£ - 8 -£ 0 0 0 0 0 0 0 0 0 0 0 0 0 0 0 0 0 0 0 0 0 0C1 Hotel -£ - 8 -£ 0 0 0 0 0 0 0 0 0 0 0 0 0 0 0 0 0 0 0 0 0 0C2 resi institution -£ - 8 -£ 0 0 0 0 0 0 0 0 0 0 0 0 0 0 0 0 0 0 0 0 0 0D1 -£ - 8 -£ 0 0 0 0 0 0 0 0 0 0 0 0 0 0 0 0 0 0 0 0 0 0D2 -£ - 8 -£ 0 0 0 0 0 0 0 0 0 0 0 0 0 0 0 0 0 0 0 0 0 0Contingency 2,033,228£ 0 254,154 254,154 254,154 254,154 254,154 254,154 254,154 254,154 0 0 0 0 0 0 0 0 0 0 0 0 0
Sub Total 42,697,795£ 0 5,337,224 5,337,224 5,337,224 5,337,224 5,337,224 5,337,224 5,337,224 5,337,224 0 0 0 0 0 0 0 0 0 0 0 0 0Other Costs
Professional fees 9.00% 3,842,802£ 0 480,350 480,350 480,350 480,350 480,350 480,350 480,350 480,350 0 0 0 0 0 0 0 0 0 0 0 0 0
Sub Total 3,842,802£ 0 480,350 480,350 480,350 480,350 480,350 480,350 480,350 480,350 0 0 0 0 0 0 0 0 0 0 0 0 0CIL Total -
Resi CIL -£ -£ 0 0 0 0 0 0 0 0 0 0 0 0 0 0 0 0 0 0 0 0 0 0-£ -£ 0 0 0 0 0 0 0 0 0 0 0 0 0 0 0 0 0 0 0 0 0 0
-£ -£ 0 0 0 0 0 0 0 0 0 0 0 0 0 0 0 0 0 0 0 0 0 0-£ 0 0 0 0 0 0 0 0 0 0 0 0 0 0 0 0 0 0 0 0 0 0
Sub Total -£ 0 0 0 0 0 0 0 0 0 0 0 0 0 0 0 0 0 0 0 0 0 0
Resi Section 106 Costs 0 1,500,000£ 1,500,000£ 0 0 1,500,000 0 0 0 0 0 0 0 0 0 0 0 0 0 0 0 0 0 0 0Accessibility standards 326,505£ 326,505£ 0 0 326,505 0 0 0 0 0 0 0 0 0 0 0 0 0 0 0 0 0 0 0
Sub Total 1,826,505£ 0 0 1,826,505 0 0 0 0 0 0 0 0 0 0 0 0 0 0 0 0 0 0 0
Total Other Costs Sub Total 1,826,505£ 0 0 1,826,505 0 0 0 0 0 0 0 0 0 0 0 0 0 0 0 0 0 0 0
Total Costs 48,367,101£ 0 5,817,575 7,644,080 5,817,575 5,817,575 5,817,575 5,817,575 5,817,575 5,817,575 0 0 0 0 0 0 0 0 0 0 0 0 0
-£
Developer's profit on GDV % of GDV - private 17.00% 6,512,400£ 0 0 0 0 0 0 0 0 0 0 0 0 6,512,400 0 0 0 0 0 0 0 0 0% of GDV - commercial 15.00% 0 0 0 0 0 0 0 0 0 0 0 0 0 0 0 0 0 0 0 0 0 0% of GDV affordable 6% 1,455,543£ 0 0 0 0 0 0 0 0 0 0 0 0 1,455,543 0 0 0 0 0 0 0 0 0
Residual Sum before interest 4,891,448£ 0 -2,785,194 -4,611,699 -2,785,194 -2,785,194 1,835,737 1,835,737 1,835,737 1,835,737 4,620,931 4,620,931 4,620,931 -3,347,012 0 0 0 0 0 0 0 0 0
Cumulative residual balance for interest calculatio n 0 -2,785,194 -7,436,306 -10,326,731 -13,258,058 -11,609,935 -9,938,489 -8,243,391 -6,524,306 -1,995,700 2,596,990 7,217,920 3,870,909 0 0 0 0 0 0 0 0 0
Interest 6.00% 1,020,539-£ 0 -39,413 -105,231 -146,133 -187,614 -164,292 -140,639 -116,652 -92,325 -28,241 0 0 0 0 0 0 0 0 0 0 0 0
Residual Sum for quarter after interest 3,870,909£ 0 -2,824,607 -4,716,930 -2,931,327 -2,972,808 1,671,445 1,695,098 1,719,085 1,743,412 4,592,690 4,620,931 4,620,931 -3,347,012 0 0 0 0 0 0 0 0 0
3,237,579£ 12
Land Value per developable hectare £335,269per gross hectare £335,269
Residual land value 3,237,579£
Site acquisition costs 6.80% 220,155£
MV (Residual Sum available to offer for Development Opportunity) 3,017,424£
Quarterly Interest 1.50% 5.36%
CORBY BOROUGH COUNCIL P2LP
20
02 June 2019