part 4 of the eight critical elements of asset management ... · pdf filepart 4 of the eight...
TRANSCRIPT

- 1 -
Part 4 of the Eight Critical Elements of Asset ManagementSurvey.
Critical Element 8.
Maintenance StrategiesA strategy is the who, what, when where and how of maintaining your assets. Strategies are
not “set and forget”, they are living documents that should be reviewed and improved
continuously. What methods do you use to review strategies? Do the strategies address the
failure modes of your assets? Who is involved in the review process? The review and
development of strategies is a critical component of Asset Management.
In years gone by, when maintenance labor was plentiful, there were some very extensive
Planned maintenance programs in place, with most being based on the “best guess” of the
experienced people in the business. The results were often a plant that was being over
serviced or the servicing was occurring on equipment that had very low failure rates. In the
last 20 years there has been a significant movement to actions being based on the mitigation
of failure modes. Some of these tools are breifly described below.
Tools for Improving Maintenance strategies.
A tool is anything used as a means of accomplishing a task or purpose. The following generic
tools are used widely in determining new or revising existing Maintenance Strategies.
Reliability Centred Maintenance. RCM
Reliability Centred Maintenance is defined by John Moubray as “a process used to determine
what must be done to ensure that the physical asset continues to fulfil its intended functions
in its present operating context” (1993, pg.7). RCM was born from the airline industry in the
US in the early 70’s in response to the statutory maintenance requirements that had to be
applied to larger aircraft such as Boeings 747. It was determined that the cost of applying the
standards to these aircraft would make them uneconomical to operate (Smith and Hinchcliffe,
2004). The basis of RCM is to ensure equipment maintains its function and the process
requires that the following seven questions be answered (Moubray, 1993).

- 2 -
1. What is the function of the equipment and what are the required performancestandards?
2. In what ways can it fail to perform its function?3. What could cause each functional failure?4. What happens when the failure occurs?5. In what way does the failure matter?6. What can be done to prevent the failure?7. What has to be done if the failure can’t be prevented?
Smith and Mobley (2008) highlight the following types of asset management strategies that
may be developed from an RCM process.
1. Condition based tasks. E.g. Oil is sampled from a transformer and the results of theanalysis determine if further maintenance is required.
2. Scheduled restoration. E.g. A Sheave bank running in a corrosive environment thatrequires overhaul at fixed intervals.
3. Scheduled Discard. E.g. The replacement of oil in a combustion engine.4. Failure finding task. E.g. Calibration of instrumentation. The fault may not be
discovered until the calibration is done.5. One-time change. Typically a one off redesign.
RCM in its pure form is a resource hungry process that should only be applied to the most
critical of assets. The results from the process if performed properly and coupled with
assessment of historical failures will produce efficient and effective maintenance strategies,
but this will be at the expense of a significant amount of time for plant staff and the project
analyst.
Failure Modes and Effects Analysis. FMEA.
A Failure Mode and Effects Analysis is an integral part of the RCM process and deals with
questions 2, 3 and 4 of the 7 RCM questions listed above. Teng and Ho (1996) define FMEA
as a technique that identifies the potential failure modes of a device or product, determines
the effects of these failures and assesses the criticality of the failure. The Teng and Ho model
is shown in figure 83.

- 3 -
Figure 83. FMEA flowchart.
An FMEA completed on DC machines in an Australian Steel mill revealed the following
most likely causes of DC machine failure to be:
1. Contamination of motor by Dust, Dirt fumes etc.2. Inadequate maintenance practices. (Internal and contract)3. Inadequate brush tension4. Over tensioning of belts or shaft misalignment.5. Overheating due to ineffective ventilation6. Neutral axis and compounding issues.7. Overloading.8. Inadequate lubrication (Too much or not enough).
9. Incorrect or ineffective protection devices.

- 4 -
These findings were used to improve the existing PM’s with excellent results. Over a 3 year
period there was a 70% reduction in DC motors that failed in service.
Planned Maintenance Optimisation. PMO
Planned Maintenance Optimisation is a process where existing PM inspections and failure
history are used to form the basis of a new set of strategies. This can provide a similar output
to classical RCM in far less time. As unknown failure modes are not addressed in the first
instance the process allows for input of potential failure modes after the initial assessment.
This process couples the PMO top down approach with the RCM bottom up approach and in
many cases will be the best option for mature businesses with existing PM systems and
access to failure history. New businesses with no existing systems or failure history will need
to apply more classical methods such as a RCM or a knowledge based process.
Management support of strategy optimization.
The most significant step related to gathering management support for a strategy review
process is educating them in the critical elements of asset management. It is common for
managers to see maintenance as a cost that can be cut, and not an investment in the future of
the operation. Question 57 is aimed at gauging whether management support the review of,
and optimization of maintenance strategies.
Figure 84. Question 57.
The results here were surprising with 54% rating a 4 or a 5. This indicates management have
a clear understanding of the importance of optimisation of maintenance strategies. A further
30% support strategy review but do not have a clear understanding of the benefits. With this
high level of management support there should be little reason not to progress with
improvements.
- 5 -
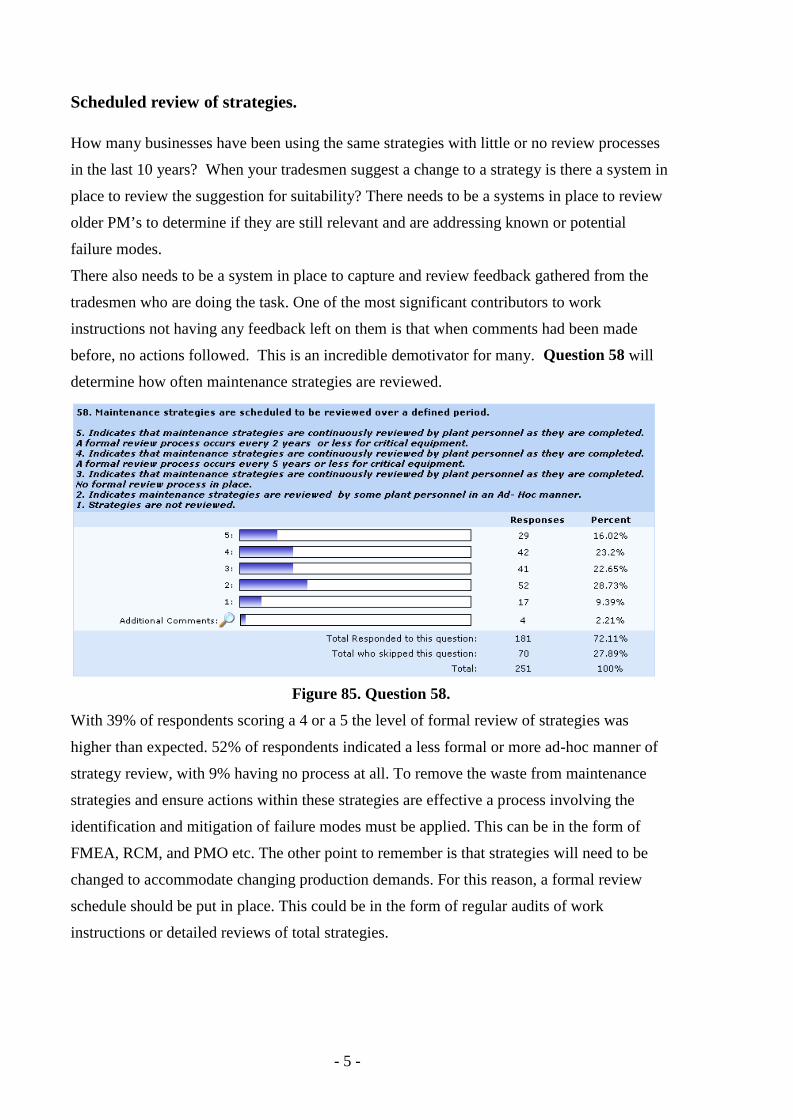
Scheduled review of strategies.
How many businesses have been using the same strategies with little or no review processes
in the last 10 years? When your tradesmen suggest a change to a strategy is there a system in
place to review the suggestion for suitability? There needs to be a systems in place to review
older PM’s to determine if they are still relevant and are addressing known or potential
failure modes.
There also needs to be a system in place to capture and review feedback gathered from the
tradesmen who are doing the task. One of the most significant contributors to work
instructions not having any feedback left on them is that when comments had been made
before, no actions followed. This is an incredible demotivator for many. Question 58 will
determine how often maintenance strategies are reviewed.
Figure 85. Question 58.
With 39% of respondents scoring a 4 or a 5 the level of formal review of strategies was
higher than expected. 52% of respondents indicated a less formal or more ad-hoc manner of
strategy review, with 9% having no process at all. To remove the waste from maintenance
strategies and ensure actions within these strategies are effective a process involving the
identification and mitigation of failure modes must be applied. This can be in the form of
FMEA, RCM, and PMO etc. The other point to remember is that strategies will need to be
changed to accommodate changing production demands. For this reason, a formal review
schedule should be put in place. This could be in the form of regular audits of work
instructions or detailed reviews of total strategies.

- 6 -
Maintenance supervisors and strategy review.
With strategy review being a critical component of this element, it becomes clear that
someone needs to be responsible for the review process. Question 59 questions whether the
development and review of Maintenance strategies is included in the job responsibilities of
Maintenance supervisors.
Figure 86. Question 59.
The telling result here is that 39% of maintenance supervisors that review their strategies in
an ad-hoc manner and a further 30% that do little review or none at all. With only 31%
scoring a 4 or 5 this is an area of significant opportunity for many businesses.
Include the review of maintenance strategies in the job goals of maintenance supervisors at
all levels. The Maintenance Team Leader may be responsible for feedback on work
instructions, the Area Supervisors could arrange regular work instruction audits, where the
maintenance manager may include large formal strategy review processes in the maintenance
budget. Making people responsible for strategy review will make it occur and the benefits
will come.

- 7 -
Involvement in Strategy review.
An effective strategy review process will only occur if a representative of all stakeholders are
involved in the process. This will gain a significant amount of local knowledge as well as
building ownership of any revised strategy. Questions 60 will determine to what
degree operations and maintenance employees are involved in the development of strategies.
Figure 87. Question 60.
What is pleasing here is that 35% of respondents indicated that operations and maintenance
personnel are regularly or always involved in strategy review. 32% of respondents indicated
some input while 33% have little or no involvement. The aim here should be that there is
always involvement with stakeholders. When strategy review processes occur in isolation it
is unlikely that the outcome will be as best as it could be, as one persons view will be not
uncover all possible failure modes or the actions that will prevent the failures. The ideal
situation is to have a senior mechanical fitter, an electrician, an operator and maintenance
leader involved in the review process. The important aspect here is to get a total
understanding as to what failures occur and whether the actions currently occurring address
these failures. If no actions are currently in place the group should decide on what actions to
implement, and making these decisions as a group will build ownership of the strategy. It is
worthwhile considering the use of a strategy review tool and experienced facilitator during
these reviews.

- 8 -
Maintenance strategies and the CMMS.
If you have a CMMS, it will have the ability to store and manage the work instructions that
are working documents of your asset management strategies. Question 61 is aimed at
understanding the level at which strategies and work instructions are stored in the CMMS.
Figure 88. Question 61.
With only 40% scoring a 4 or a 5 in this question there is clear room for improvement. As
your CMMS is generally made to manage your strategies it is the obvious this is where they
should be kept. If there are some work instructions or operating procedures that are kept in
other systems, then these should be linked to the CMMS. This may be the case if a third party
is providing software tools to help with strategy development.
- 9 -
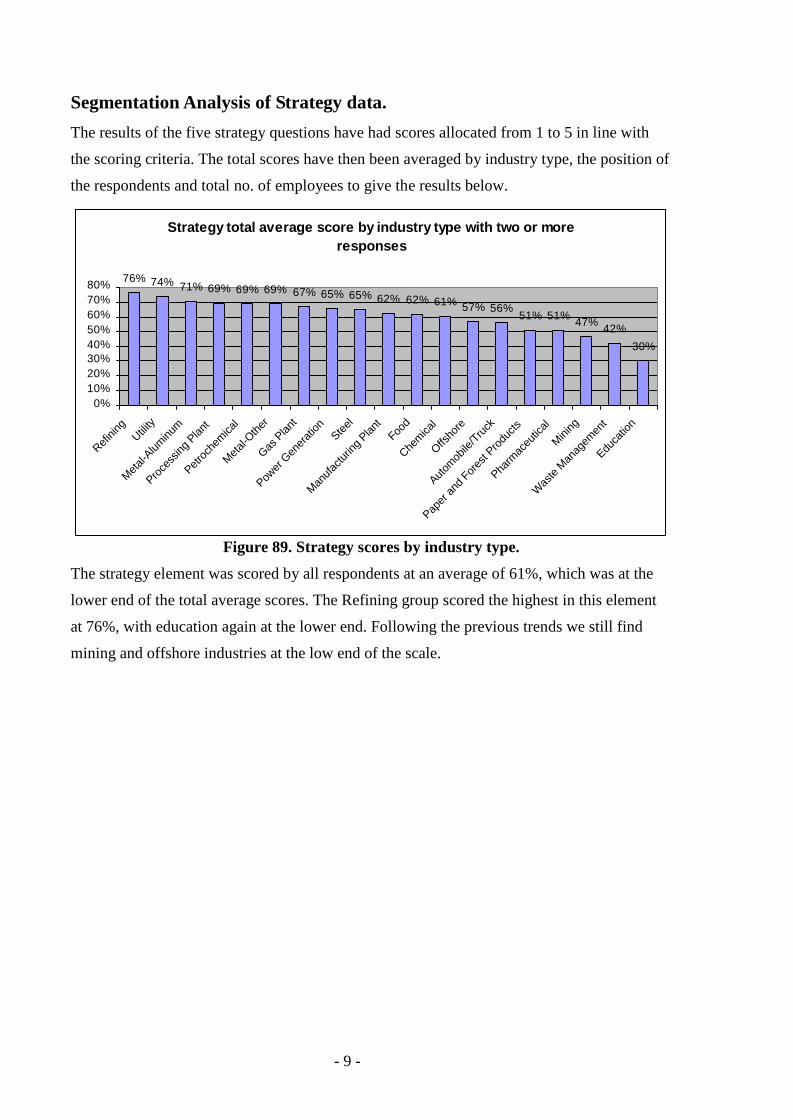
Segmentation Analysis of Strategy data.
The results of the five strategy questions have had scores allocated from 1 to 5 in line with
the scoring criteria. The total scores have then been averaged by industry type, the position of
the respondents and total no. of employees to give the results below.
Strategy total average score by industry type with two or moreresponses
76% 74% 71% 69% 69% 69% 67% 65% 65% 62% 62% 61% 57% 56%51% 51% 47% 42%
30%
0%10%20%30%40%50%60%70%80%
Refinin
gUtili
ty
Metal-A
luminu
m
Proces
sing P
lant
Petroc
hemica
l
Metal-O
ther
Gas P
lant
Power
Genera
tion
Steel
Manufa
cturin
g Plan
tFoo
d
Chemica
l
Offsho
re
Automob
ile/Truc
k
Paper
and F
orest
Produc
ts
Pharm
aceu
tical
Mining
Was
te Man
agem
ent
Educa
tion
Figure 89. Strategy scores by industry type.
The strategy element was scored by all respondents at an average of 61%, which was at the
lower end of the total average scores. The Refining group scored the highest in this element
at 76%, with education again at the lower end. Following the previous trends we still find
mining and offshore industries at the low end of the scale.

- 10 -
Strategy total average scores by Role.
76%68% 66% 66% 65% 64% 63% 63% 61%
57% 55%
0%10%20%30%40%50%60%70%80%
Pla
nt m
anag
er
If ot
her,
plea
se s
peci
fy
Mai
nten
ance
Sup
erin
tend
ent
Mai
nten
ance
Pla
nner
/Sch
edul
er
Ope
ratio
ns M
anag
er
Mai
nten
ance
Trad
esm
an/C
rafts
man
Rel
iabi
lity
Eng
inee
r
Pro
ject
Eng
inee
r
Mai
nten
ance
Sup
ervi
sor
Vic
e P
resi
dent
Pla
nt E
ngin
eer
Figure 90. Strategy scores by role.
With the exception of the plant managers responses there was a close range of results here.
With only one score over 70% this again supports the view that there is significant room for
improvement in this element.
Strategy analysis by size of industry.
77%
65% 62% 61% 61% 61%57% 57%
0%
10%
20%
30%
40%
50%
60%
70%
80%
90%
1 to 10 500 to 1000 50 to 100 300 to 500 10 to 50 over 5000 1000 to5000
100 to 300
Figure 91. Strategy score by industry size.
In keeping with the trend through this survey the smallest business have rated themselves the
highest in this element. At the bottom end we again find the largest of businesses.

- 11 -
Conclusions on the Maintenance Strategies Element.
Overall the scores were down in this element and this highlights business don’t always value
or understand the benefits that can come from a well run strategy review process. From the
responses there is clear evidence avaliable that highlights management do or will support the
review of maintenance strategies, even if the benefits are not totally understood. This
indicates there is a certain amount of faith in the maintenance professional’s point of view.
Although there is some examples where strategies are reviewed on a regular basis, there was
still more than 60% of respondents who can step up in this area. Where strategies have not
been reviewed for many years, it should become a priority for these companies. There is a
clear lack of clarity in relation to who is responsible for the strategy review process. Ensure
your operation has strategy reviews included in position descriptions and set gaols for these
people around improvement actions. Generally there is not enough involvement from people
on the floor in the strategy review process and this needs to be considered as a matter of
importance if your business goes done the path of strategy review. The use of the CMMS to
store strategies and work instructions is also a potential area of improvement.
- 12 -
Further Segmentation Analysis.
The structure of this Survey has allowed for easily segmented results and some of these
reports have been presented through the assessment. Question 62 asked respondents what
type of reports they would like to see with some examples being:
- Comparisons between like industries.
- Your company against the rest of the respondents.
- Comparison of responses by role type.
- Comparisons of response by the size of the company
Reports already provided throughout this assessment include:
- Total no of Maintenance employees compared to business size in Chapter 1.
- Average overall score of all respondents by role type in Chapter 1.
- Total average overall score by industry type in Chapter 1.
- Average overall score by Country where the facility is based.
- The spread of and median scores for industries with 10 or more responses in Chapter
1.
- For each of the eight elements in Chapter 2 through to 9 the following reports were
generated. Total averaged score by industry type, the position of the respondents and
total number of employees.
Individual Scores by similar industries
Following are individual plant scores grouped by industry types. To protect the identity of the
companies they have been named the country that the response came from. If there was more
than 1 from that country then they will be called the country and a number, e.g., Australia 1,
Australia 2 etc. In the responses for Steel, Onesteel has been named however the plants have
not been identified. Of particular interest, is that in all of the data presented the trends are
very similar. In every case there is a large variation between the highest and lowest scores no
matter what data is presented. This means that there is no industry type that is better than any
other and this is also the case when assessed by industry size.

- 13 -
What is a good score from the survey?
Scores of 75% or greater would indicate and excellent result, between 65% and 75% a good
results with some room for improvement. Between 50% and 65% is an average result where
there is significant opportunity to improve. If the score is less than 50% the result can be
considered poor and your business has a long road to improvement.
Steel Industry
Average total score of steel industry sites
88%79% 78% 74% 73% 72% 71% 69% 68% 66% 63% 63% 59% 58% 58% 56%
49%44%
0%10%20%30%40%50%60%70%80%90%
100%
Euro st
eel 1
USA stee
l 1
Oneste
el 1
Oneste
el 2
Oneste
el 3
Oneste
el 4
Oneste
el 5
Oneste
el 6
USA stee
l 2
Oneste
el 7
OneStee
l 8
Oneste
el 9
Aust S
teel 1
Oneste
el 7
Euro st
eel 2
USA stee
l 3
Asia S
teel 1
USA Stee
l 4
Figure 92. Steel industry individual scores.
A steel company in Europe rated themselves the highest in the survey with a total score of
88% which was 9% higher than the next highest which is a Steel Company located in the
United states. The 7 scores from Onesteel in Australia were from different plants located in
numerous places in Australia. The median score for the Steel industry was 67%.

- 14 -
Chemical Plants.
Individual Chemical Plant scores
79% 79% 78% 77% 75%70% 69%
58% 57% 57% 56% 54% 53%47%
0%10%20%30%40%50%60%70%80%90%
Argenti
na
United
Stat
es 1
United
Stat
es 2
Austra
lia 1
United
Stat
es 1
Belgium
1
United
Stat
es 3
United
Stat
es 4
Switzerl
and 1
United
Stat
es 5
United
Stat
es 6
United
King
dom 1
Argenti
na 1
Puerto
Rico
1
Figure 93. Chemical Plant individual scores.
Of the chemical plant results a two plants tied for first with scores of 79%, one being I
Argentina and the other in the United States. The Median score for Chemical plants is 63%
Gas Plants
Individual gas plant scores
80%75%
59% 57%
0%
10%
20%
30%
40%
50%
60%
70%
80%
90%
United States Netherlands Canada Canada
Figure 94. Gas Plant individual scores.
The highest score for gas plants came from a company in the United States at 80%. The
median score for Gas plants was 66.5%.

- 15 -
Manufacturing Plants
Individual Manufacturing plants total scores
90% 89%86%80%78%75% 74%73% 72%72%72% 69%68%68% 67%62% 61%59%56% 51%
37% 34%33%
0%10%20%30%40%50%60%70%80%90%
100%
United
Stat
es 1
United
Stat
es 2
United
Stat
es 3
United
King
dom
United
Stat
es 4
United
Stat
es 5
Colombia
United
Stat
es 6
United
Stat
es 7
United
Stat
es 8
Austra
lia 1
United
Stat
es 9
United
Stat
es 10
United
Stat
es 11
Austra
lia 2
United
Stat
es 12
Canad
a 1
Austra
lia 3
Canad
a 2
Philipp
ines 1
Austra
lia 4
Vanua
tu
United
Stat
es 13
Figure 95. Manufacturing Plants individual scores.
Manufacturing plants cover many different types of manufacturing so it may be expected that
there is a large variation in scores. There were three scores here higher than 80%, but at the
other end of the scale there were three plants that scored below 40%. This sector had a large
spread between the top and bottom scores, being 57%. The median score for manufacturing
plants was 71%.
Aluminium Plants
Individual Aluminium Plant total score
89%85% 81%
67%62%
51%
0%10%20%30%40%50%60%70%80%90%
100%
United States 1 United States 2 United States 3 Australia United States 4 Netherlands
Figure 96. Aluminium industry individual scores

- 16 -
Again some high scores are offset by some very low scores. The Aluminium plants in the
United States scored themselves the highest. The median score for this industry sector was
74%.
Offshore industries.
Individual Offshore industries scores
85%
60% 57%
33%
0%
10%
20%
30%
40%
50%
60%
70%
80%
90%
India Oman Unknow n Angola
Figure 97. Offshore industry individual scores.
Another very large spread of scores in these results of 52%. The highest score came from a
offshore industry in India with an extremely low score coming from an industry in Angola.
The median score here was 58.5%.
Paper, Pulp and Forestry industries
Individual paper and pulp industries scores
79%75%
65%58%
42%
0%
10%
20%
30%
40%
50%
60%
70%
80%
90%
Canada 1 Canada 2 United States 1 New Zealand United States 2
Figure 98. Paper and Forestry individual results.
- 17 -
The best paper, pulp and forest industries according to the survey are located in Canada with
scores of 79 and 75%. The median score in this sector was 65%.
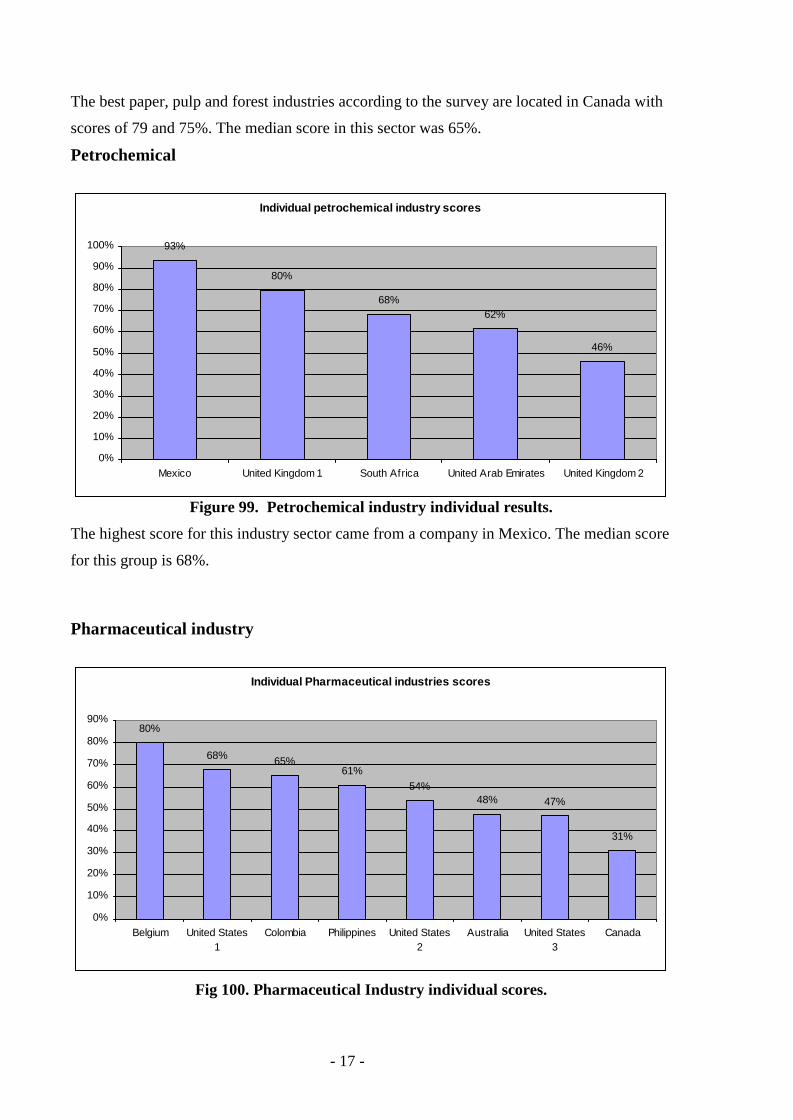
Petrochemical
Individual petrochemical industry scores
93%
80%
68%62%
46%
0%
10%
20%
30%
40%
50%
60%
70%
80%
90%
100%
Mexico United Kingdom 1 South Africa United Arab Emirates United Kingdom 2
Figure 99. Petrochemical industry individual results.
The highest score for this industry sector came from a company in Mexico. The median score
for this group is 68%.
Pharmaceutical industry
Individual Pharmaceutical industries scores
80%
68% 65%61%
54%48% 47%
31%
0%
10%
20%
30%
40%
50%
60%
70%
80%
90%
Belgium United States1
Colombia Philippines United States2
Australia United States3
Canada
Fig 100. Pharmaceutical Industry individual scores.
- 18 -
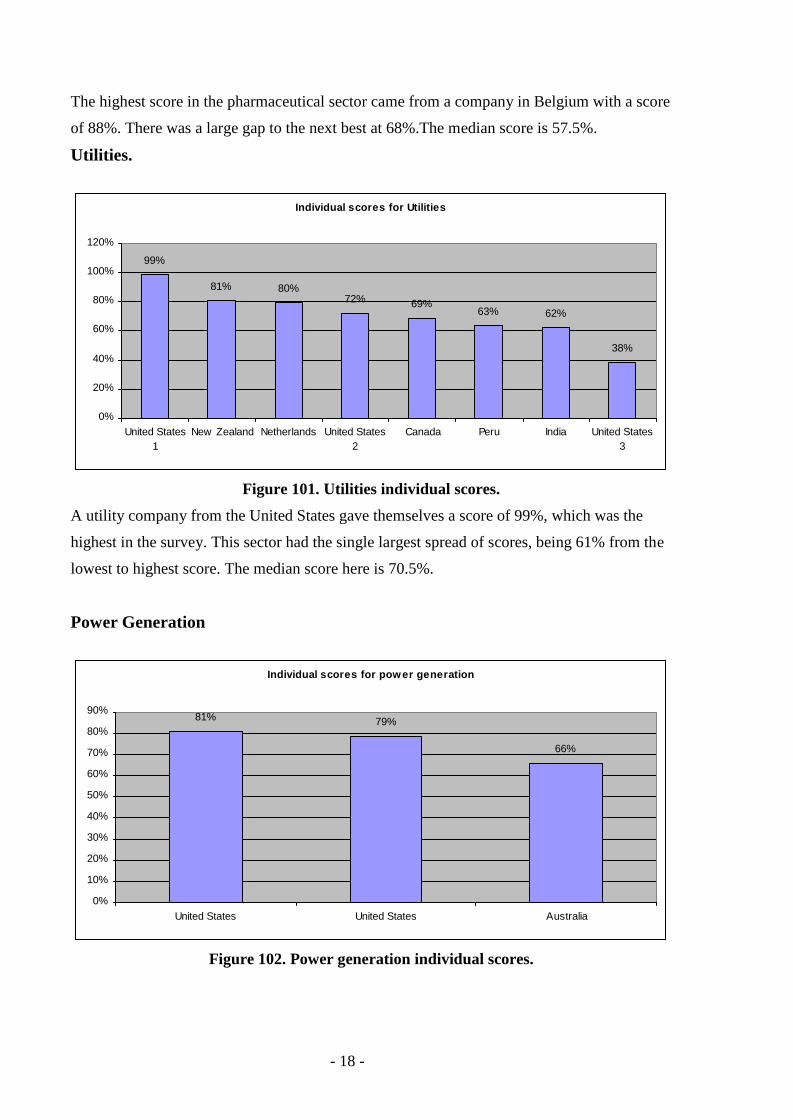
The highest score in the pharmaceutical sector came from a company in Belgium with a score
of 88%. There was a large gap to the next best at 68%.The median score is 57.5%.
Utilities.
Individual scores for Utilities
99%
81% 80%72% 69%
63% 62%
38%
0%
20%
40%
60%
80%
100%
120%
United States1
New Zealand Netherlands United States2
Canada Peru India United States3
Figure 101. Utilities individual scores.
A utility company from the United States gave themselves a score of 99%, which was the
highest in the survey. This sector had the single largest spread of scores, being 61% from the
lowest to highest score. The median score here is 70.5%.
Power Generation
Individual scores for power generation
81% 79%
66%
0%
10%
20%
30%
40%
50%
60%
70%
80%
90%
United States United States Australia
Figure 102. Power generation individual scores.

- 19 -
The highest of the 3 responses from the power generation sector came from the United States
with 81%. The Median score for this group is high at 79%. This was the highest median score
of the 13 industry types in this section of the survey.
Mining
Individual m ining industry scores
85%77%
71%
58%54% 54%
41%
29%
0%
10%
20%
30%
40%
50%
60%
70%
80%
90%
A ustralia 1 A ustralia 2 Chile A ustralia 3 United States1
A ustralia 4 United States2
Peru
Figure 103. Mining Individual scores.
Again there is a significant variation between the scores of different mining operations. The
Australian operations have scored the highest here but the median score has been dragged
down to 58% by a number of results under 60%.
Food Industry.
Individual scores for the food industry
76% 75% 75% 72% 69%
54%
44%
0%
10%
20%
30%
40%
50%
60%
70%
80%
United States 1 Belgium United States 2 United States 3 Mexico New Zealand United States 4
Figure 104. Food Industry individual scores.
- 20 -
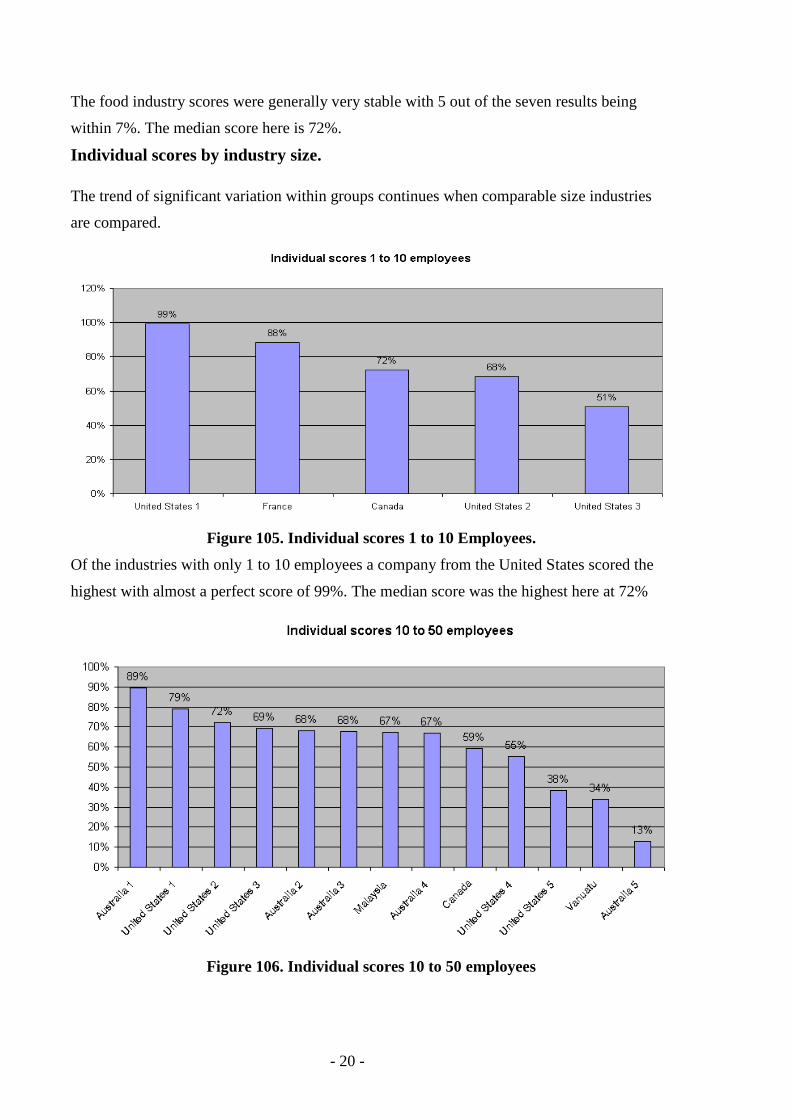
The food industry scores were generally very stable with 5 out of the seven results being
within 7%. The median score here is 72%.
Individual scores by industry size.
The trend of significant variation within groups continues when comparable size industries
are compared.
Figure 105. Individual scores 1 to 10 Employees.
Of the industries with only 1 to 10 employees a company from the United States scored the
highest with almost a perfect score of 99%. The median score was the highest here at 72%
Figure 106. Individual scores 10 to 50 employees

- 21 -
The high score in these small companies with 10 to 50 employees was 89% with a low score
of 13%. The median score is 67%
Figure 107. Individual scores 50 to 100 employees.
There was one standout company from Mexico in this group with a score of 93%. The
median score for this group is 63%.
Figure 108. Individual scores 100 to 300 employees.
Companies or business units with 100 to 300 employees had the most responses in the part of
the survey. The high score came from an Australian company that scored itself as 90% where
at the other end of the scale is a Canadian company scoring 31%. The median score here is
relatively high at 69%.

- 22 -
Fig 109. Individual scores 300 to 500 employees.
The highest score in this sector was an Australian company with a 91% rating. The median
score for this group is relatively high at 68%.
Figure 110. Individual scores 500 to 1000 employees
The highest score in this sector was from a company in Iran with 96%. The median score for
this group was also high at 69%.

- 23 -
Figure 111. Individual scores 1000 to 5000 employees
The high score in this group was 99% and came from a company in the United States. The
median score for this group was 70%.
Fig 112. Individual scores over 5000 employees
The high score for the largest businesses was from a Canadian company at 89%. The median
score was the lowest by far at 62%. Does this indicate that the largest of businesses are the
least efficient at asset management?
- 24 -
Conclusions from Individual results analysis.
As mentioned in the beginning of this chapter the type of industry or size of industry does not
make them any better than any other. There is a significant variation in scores regardless of
the way the data is presented. To take this further business units within the same company
also can have significant variation in how well they manage their assets. This can be seen in
the Onesteel results where the scores ranged from 58% to 78%. So how do these results help
the reader? It shows that any type and size of company can be excellent at asset management
if the right conditions are in place to encourage it. So for all those who say, “We’ve tried that
before but we’re different and it doesn’t work here”, It can be done with the right resources
driving the Asset management Improvement process. The information contained in this
survey should help each business understand where they can improve, and indicates that it
can be done.

- 25 -
Assessment of Sub theme’s within the Survey.
Within each group of questions in the survey there were a number of sub theme’s within the
question groups. The following assessment has been built from the following question types:
- Management.
- The Organisation Structure
- Plant Operations
- Materials management.
Assessment has only been completed on Industries types where three or more responses were
gathered. This includes the following industries:
- Steel
- Power Generation
- Utilities
- Pharmaceutical
- Aluminum
- Petrochemical
- Manufacturing
- Offshore
- Automobile/truck
- Paper and forestry
- Mining.
- 26 -
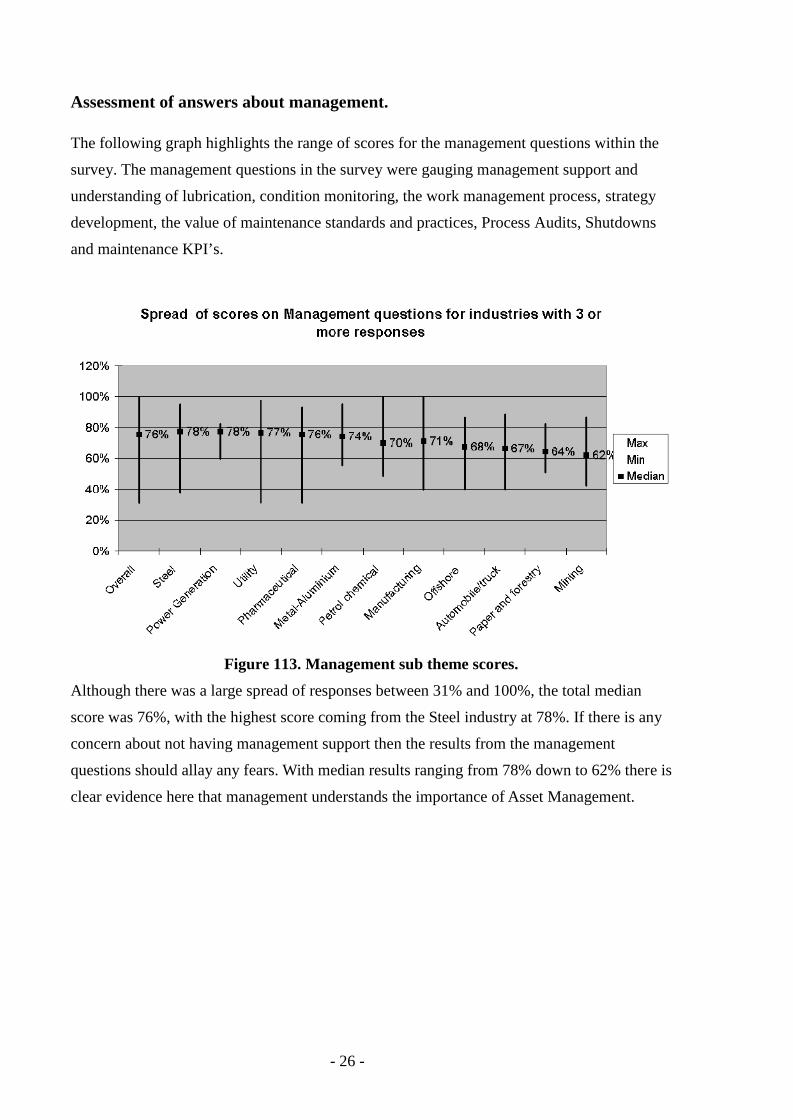
Assessment of answers about management.
The following graph highlights the range of scores for the management questions within the
survey. The management questions in the survey were gauging management support and
understanding of lubrication, condition monitoring, the work management process, strategy
development, the value of maintenance standards and practices, Process Audits, Shutdowns
and maintenance KPI’s.
Figure 113. Management sub theme scores.
Although there was a large spread of responses between 31% and 100%, the total median
score was 76%, with the highest score coming from the Steel industry at 78%. If there is any
concern about not having management support then the results from the management
questions should allay any fears. With median results ranging from 78% down to 62% there is
clear evidence here that management understands the importance of Asset Management.

- 27 -
Assessment of questions about the Organisation.
The questions related to the organisation focus on having dedicated resources for lubrication,
condition monitoring and shutdown management, the level of qualifications held by trades
people, the level of training received in the use of the CMMS for operations and
maintenance, the definition of roles and responsibilities in the work management process, and
finally determining who is responsible for strategy reviews.
Figure 114. Organisation sub-theme scores.
There was a range of total average scores between 28% and 100% for these industry
segments, with the median score being 70%. The highest median score here was 88% in the
power generation sector with a low of 56% being obtained by the Offshore industries.

- 28 -
Assessment of questions about the Operations Departments.
The questions related to operations departments focus on the level of basic care completed by
operations, operational practices, understanding and use of the work management process,
understanding production losses, and the level of training in asset management processes.
Figure 115. Operations Department sub-theme scores.
The overall scores in the operations based questions were very low with the overall median
score being 57%. The only median score over 70% was in the power generation sector, with 6
of the eleven industry sectors scoring below 60%. These figures clearly point to Operations
not valuing the reliability and maintenance of their assets. Considering all aspects of this
survey this is the one area where significant improvements can be made in all industry
sectors. Operations departments have to build ownership of both there process output and
equipment reliability.
- 29 -
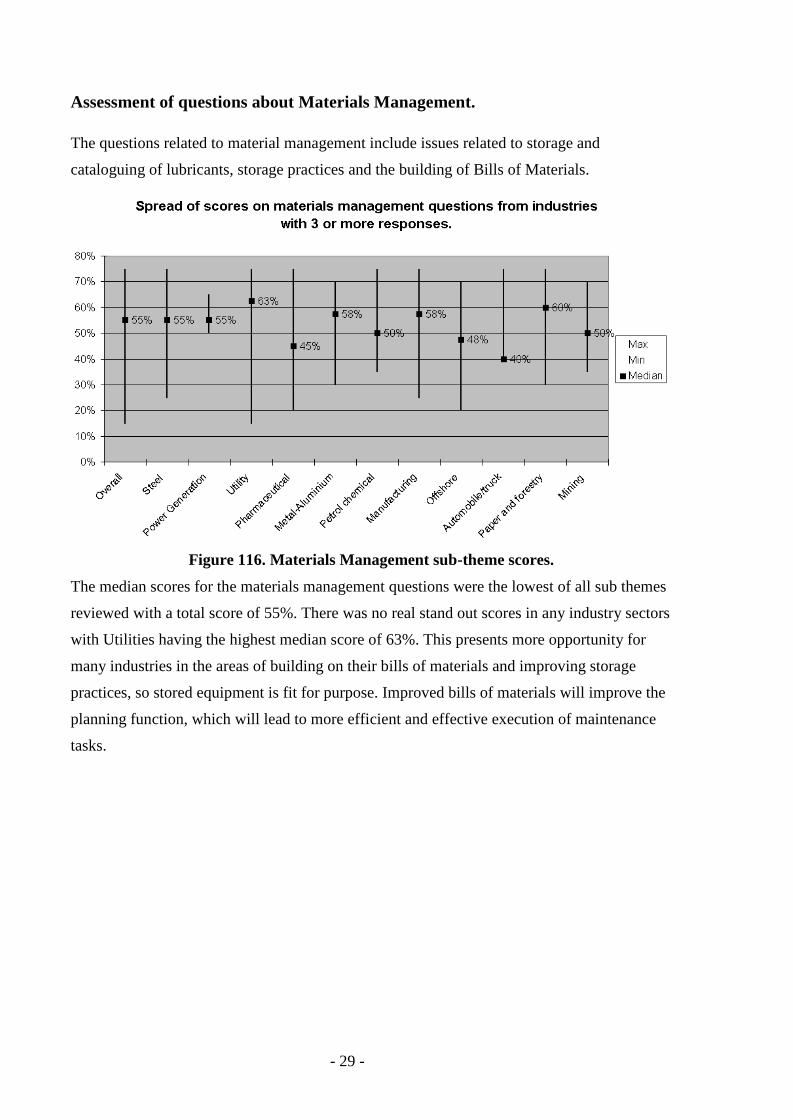
Assessment of questions about Materials Management.
The questions related to material management include issues related to storage and
cataloguing of lubricants, storage practices and the building of Bills of Materials.
Figure 116. Materials Management sub-theme scores.
The median scores for the materials management questions were the lowest of all sub themes
reviewed with a total score of 55%. There was no real stand out scores in any industry sectors
with Utilities having the highest median score of 63%. This presents more opportunity for
many industries in the areas of building on their bills of materials and improving storage
practices, so stored equipment is fit for purpose. Improved bills of materials will improve the
planning function, which will lead to more efficient and effective execution of maintenance
tasks.

- 30 -
Feedback from the Survey.
The survey results were extracted from the survey software on the 3rd of September 2009 and
at that time there had been 251 responses with a total completion ratio of 73%. Considering
the survey was quite long this is considered a good result. The survey will be left open until
May 2010, which will then be a total of 12 months. At that time the survey results will be
reviewed to determine if there are any shifts in the trends. The survey can be taken at the
following web address: http://www.surveymethods.com/EndUser.aspx?B793FFE2B4F3E1E6
Question 63 of the survey asked for contact details of those that would like feedback from
the survey. The respondent who left their email details will be sent a copy of the report and
will be able to request specific details on how their company compared to all other
respondents by direct request to the Author.
The survey is still open for those who would like to assess themselves against the results
presented in this report. Use the following link to participate.
http://tinyurl.com/onesteelsurvey
Mark Brunner
Oct 2009.

- 31 -
Bibliography.
Asset Maintenance Council Website. “Definition of asset management”
http://www.amcouncil.com.au/wiki/index.php/Asset_Management
Viewed 1/08/09
PAS 55-1:2004. “Asset Management. Part 1: Specification dor the optimized management of
physical infrastructure assets. British Standards Institution
Van Dullemen, R, Comment on, “Preview survey results from the eight critical elements of
asset management”. Reliabilityweb. Viewed 9-8-2009.
http://reliabilityweb.com/index.php/articles/preview_survey_results_from_the_eight_critical_
elements_of_asset_management/
Onesteel Wire Maintenance Business plan on a page. 2007-09.
http://www.alltestpro.com/products.html, All-Test Pro Website. Viewed 19-09-2009
Rules of Thumb for Maintenance and Reliability Engineers. Smith and Mobley 2008.
Butterworth-Heinemann Burlington MA USA.
Advanced Condition Monitoring Study Guide. Module EMMM 20017. Central Queensland
University. 2006.
Lenahan, Tom. “Turnaround shutdown and outage Management” Butterworth-Heinemann,
2006. (p5)
Central Queensland University (CQU) ENMM 20018, Turnaround management study guide.