part 6_characterisation techniques
TRANSCRIPT


Characterisation of Nanocomposites
Exfoliation should be assed by a multitechnique approach:
• X-ray diffraction• Trasmission Electron Microscopy• Plate oscillatory rheometer • Nuclear Magnetic Resonance
Different tools available
• Spectroscopy• Microscopy• Rheology
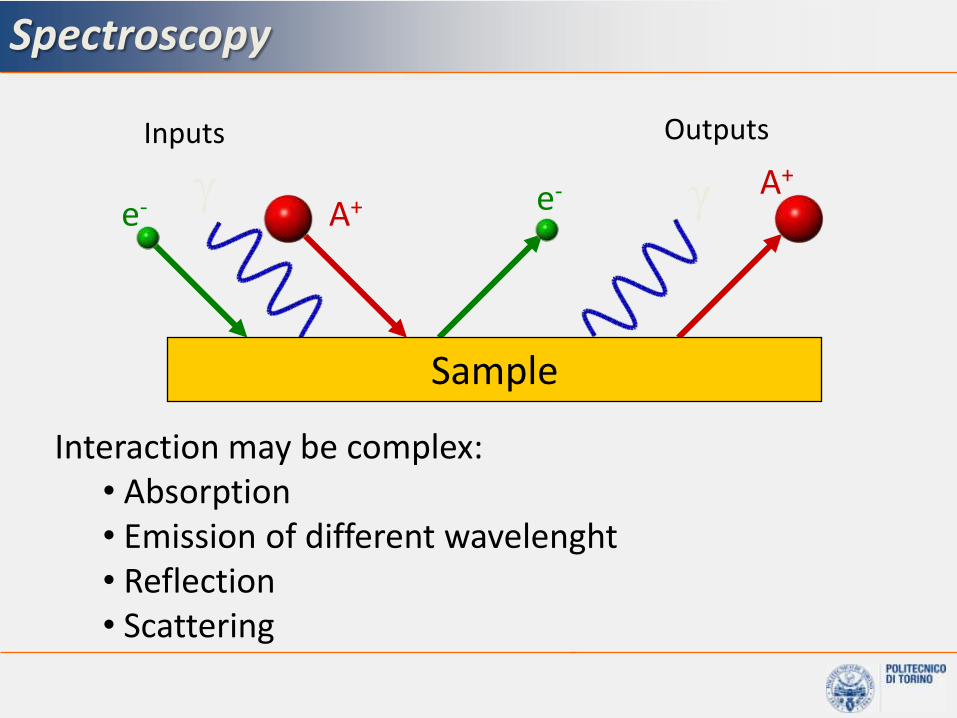
Spectroscopy
e- γA+ e- γ A+
Sample
Inputs Outputs
Interaction may be complex:• Absorption• Emission of different wavelenght• Reflection• Scattering

Spectroscopy
• Absorption– UV-visible– Infrared– NMR– …
• Emission– Raman– Atomic emission (AES)– Fluorescence
• Scattering– XRD– Neutron scattering
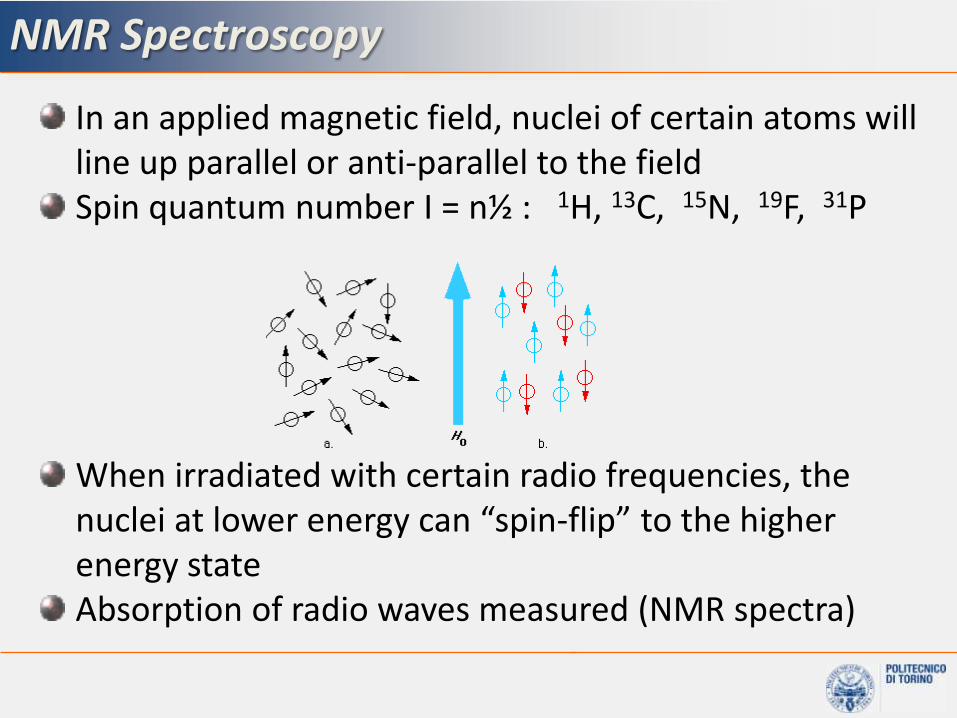
In an applied magnetic field, nuclei of certain atoms will line up parallel or anti-parallel to the fieldSpin quantum number I = n½ : 1H, 13C, 15N, 19F, 31P
When irradiated with certain radio frequencies, the nuclei at lower energy can “spin-flip” to the higher energy stateAbsorption of radio waves measured (NMR spectra)
NMR Spectroscopy

Natural abundance and sensitivity

Nuclear spins in a magnetic field

m
B0
B1
Q
w0
w0 = Larmor frequency(107-108 Hz. radio wave domain)
Nuclear spins in a magnetic field
E = h n =w0 ħ = ħB 0
N = N exp(- kbT)
N
N
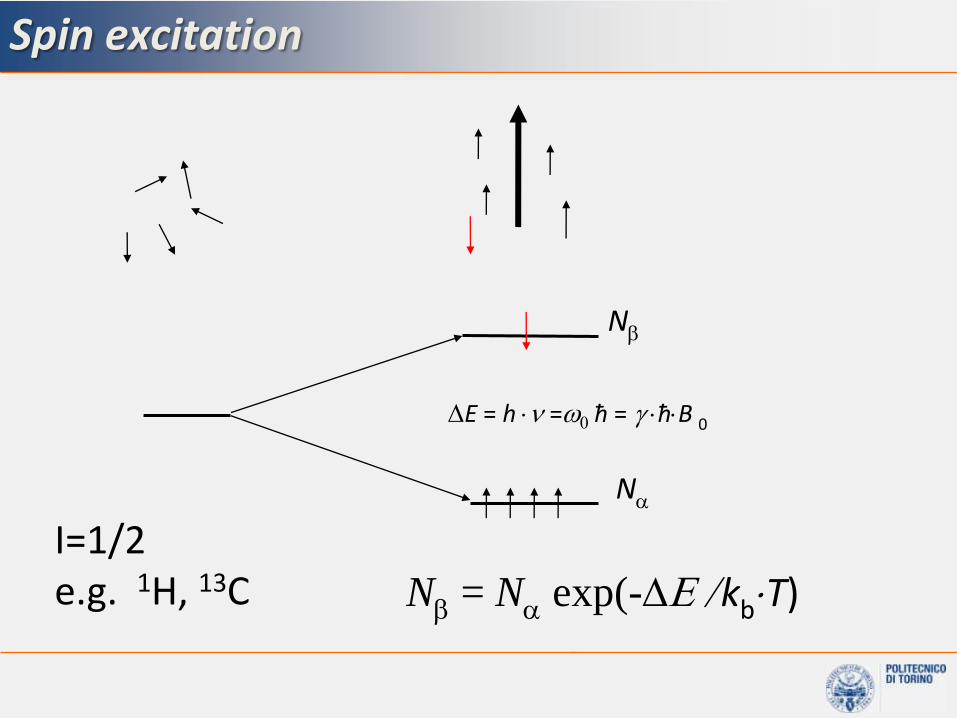
Spin excitation
I=1/2e.g. 1H, 13C

nuclei with a spin quantum number I
angular momentum J = ħ {I (I+1)}1/2
magnetic moment mI = I, I-1, I-2…0…-I (2I+1) states
nuclear magnetic moment (z-component) µz = ħ mI
energy of the state: E = µz B0 = - ħ mI B0
Larmor-frequency: w0 = 2n0 = B0 mI
an ensemble of isolated spins I = 1/2in an external field B0 split up into two states (lower) and (higher)
energy difference: E = E-E=hn0= ħ w0= ħ B0
in an external field B0:
= (experimental) magnetogyric ratio
The very basic of NMR

rf-transmission andDetection coil (antenna)
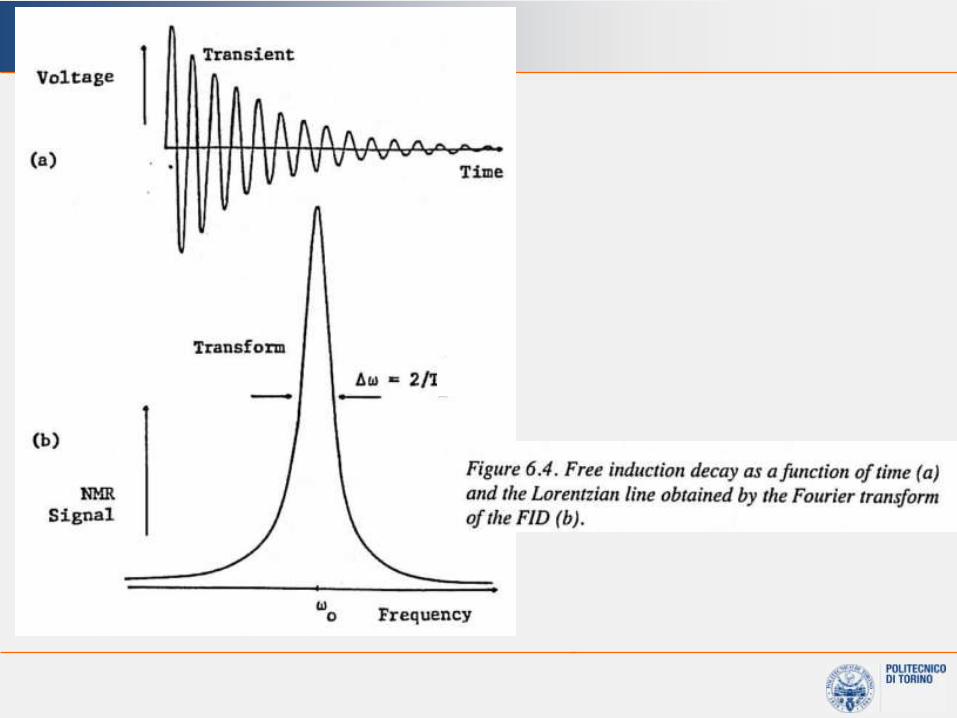
The pulsed NMR experiment

Pulsed NMR experiment
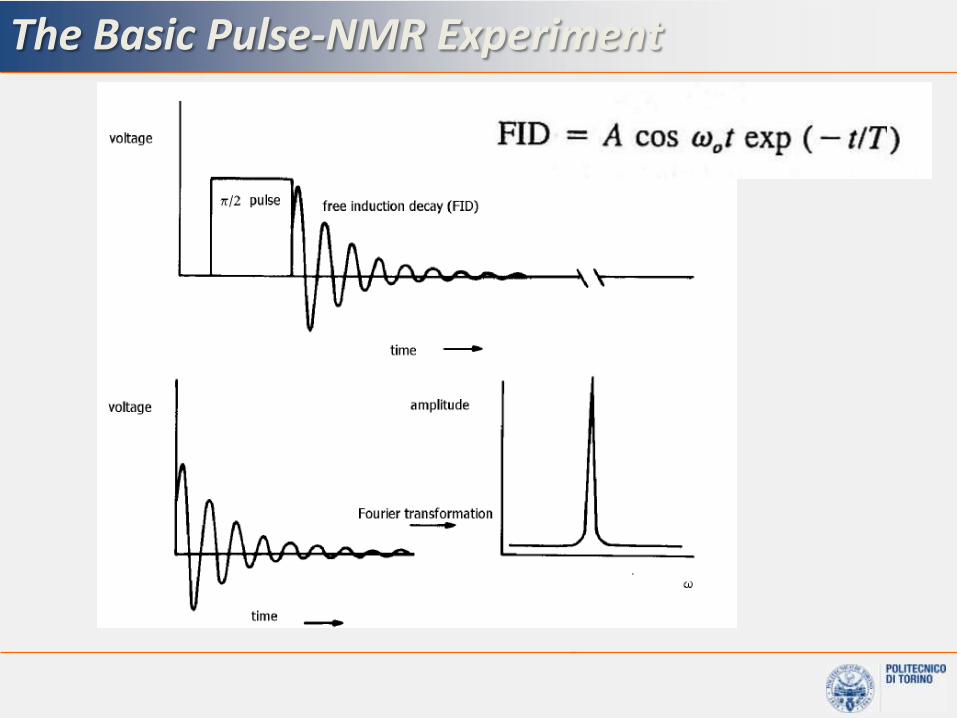
The Basic Pulse-NMR Experiment
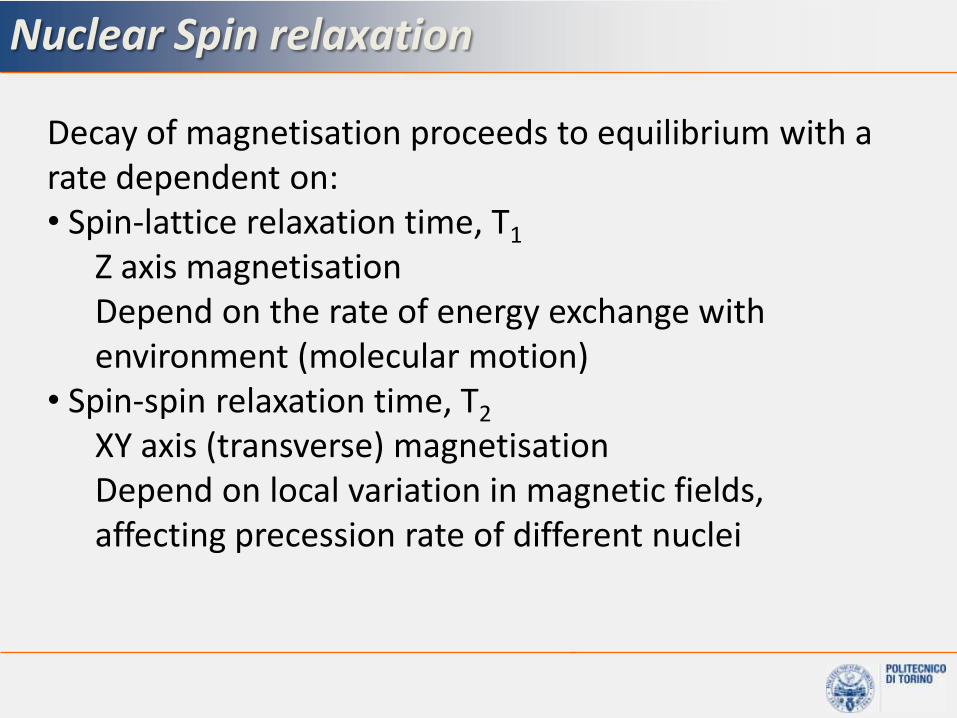
Nuclear Spin relaxation
Decay of magnetisation proceeds to equilibrium with a rate dependent on:• Spin-lattice relaxation time, T1
Z axis magnetisationDepend on the rate of energy exchange with environment (molecular motion)
• Spin-spin relaxation time, T2
XY axis (transverse) magnetisationDepend on local variation in magnetic fields, affecting precession rate of different nuclei

NMR Spectrometer

Solid state NMR

narrow is beautiful
…but line shape can also tell us a lot
Solid State NMR
Broad lines

Nuclear magnetic resonance (NMR)
Quantitative method based on proton longitudinal relaxation time (T1H)
measurements, being affected by the presence of clay *.
Factor f: Degree of separation of the platelets
Factor ε: Homogeneity of the dispersion
*S. Bourbigot, D. L. Vanderhart, J.
W. Gilman, W.H. Awad, R.D. Davis, A.B. Morgan, C.A. Wilkie, Journal of polymer science : part B : polymer physics, 41 (2003) 3188-3213

Relaxation in confined polymer chains

The major methods of morphology can be grouped into two classes:
• Microscopy
– Get actual image
– Sampling problems
– Poor statistics
• Scattering
– No actual image
– Everything inferred
– Requires theory
Microscopy
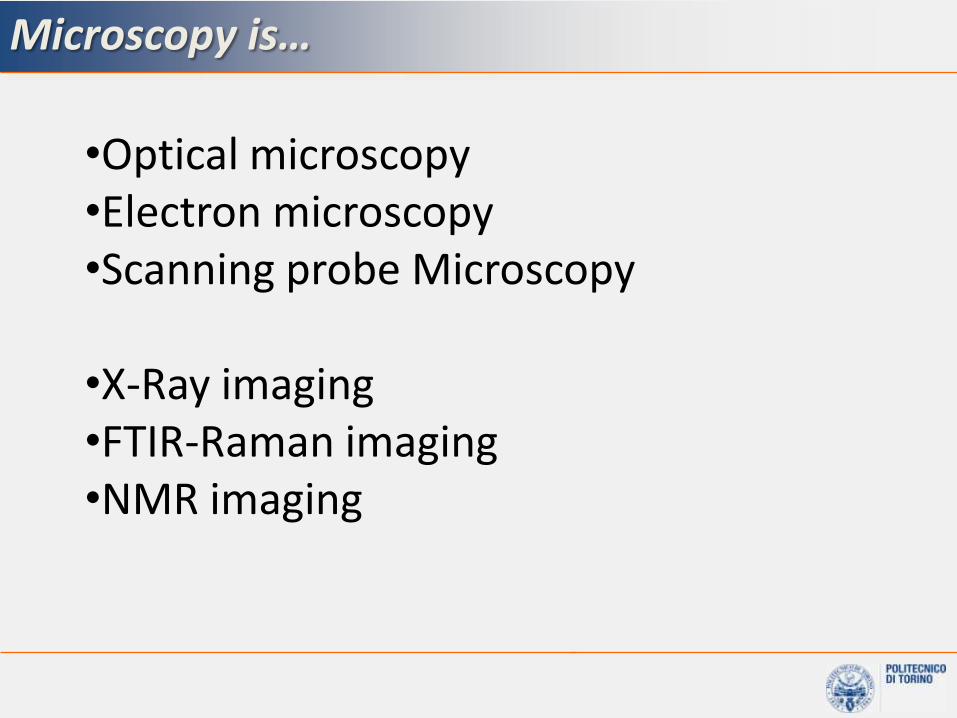
•Optical microscopy•Electron microscopy•Scanning probe Microscopy
•X-Ray imaging•FTIR-Raman imaging•NMR imaging
Microscopy is…

Microscopy - comparison
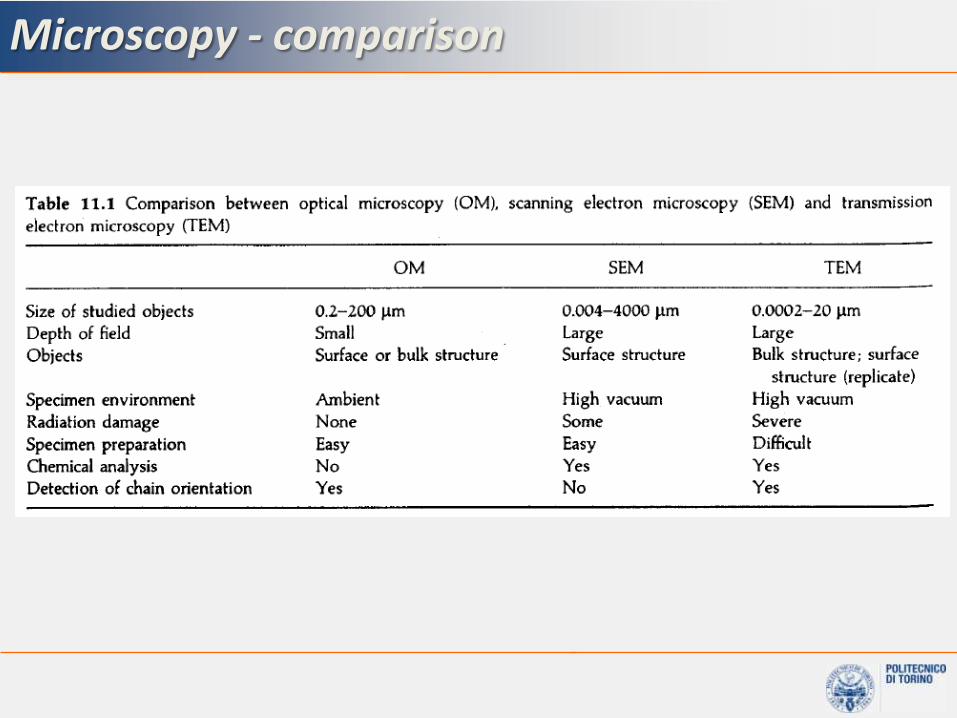
Microscopy - comparison
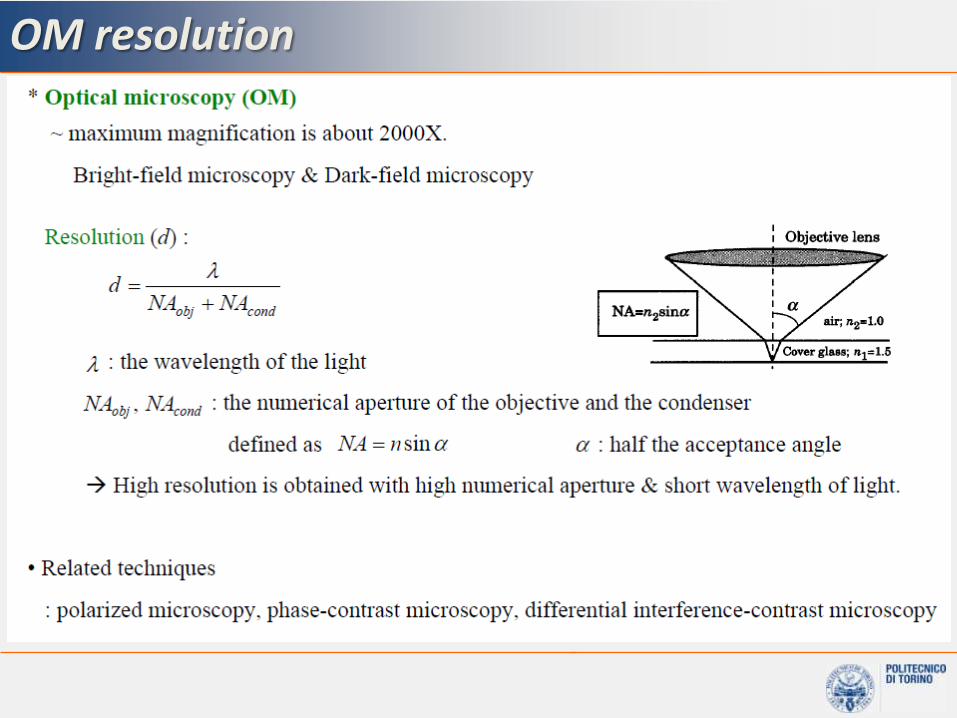
OM resolution
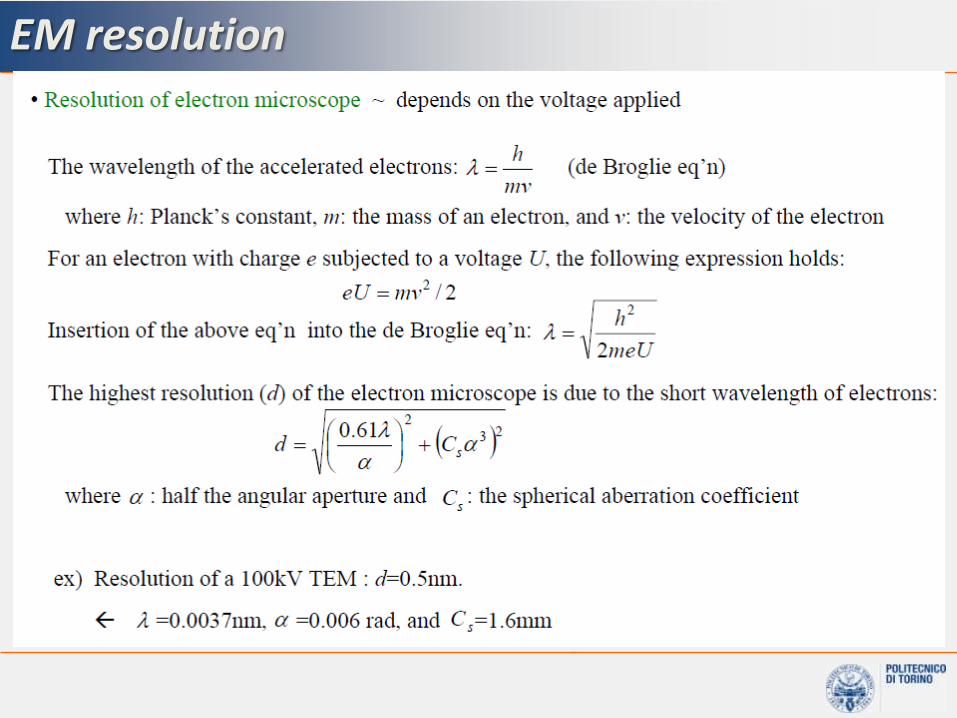
EM resolution
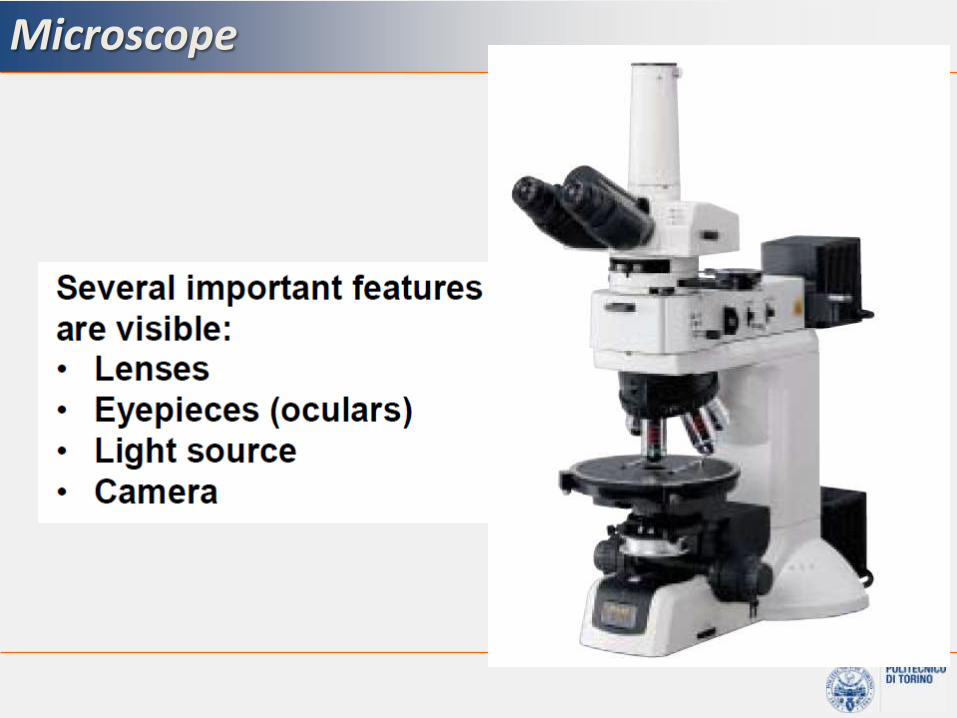
Microscope


Resolution vs λ

Depth of field


Enhancing contrast

Etching agents

Raman microscopy

Optical vs electronic microscopy

Two basic forms of EM are extremely important to morphologists. (there are many subvarieties)
• SEM– Surfaces
– Great depth of field
– 3D looking
– Resolution 100 Å
– Easy sample prep
• TEM
– Looks through sample
– Thin samples!
– OsO4 or other contrast agent often required
37

Scanning Electron Microscopy
38

Field Emission sources
39

SEM
FNI 1C 40

41

42
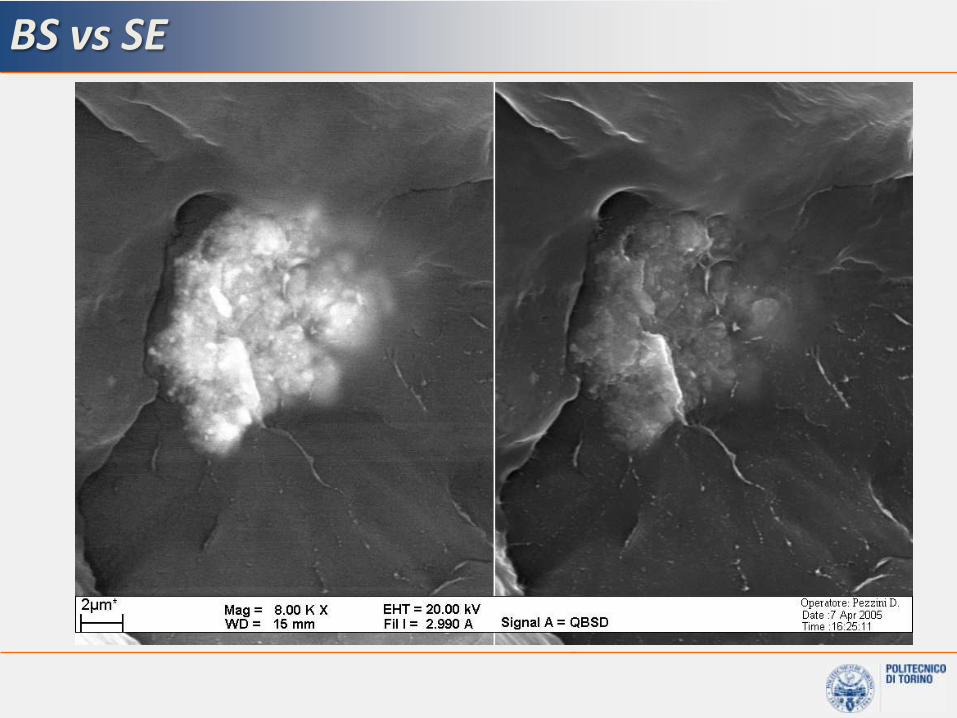
BS vs SE
Cfr SE BS
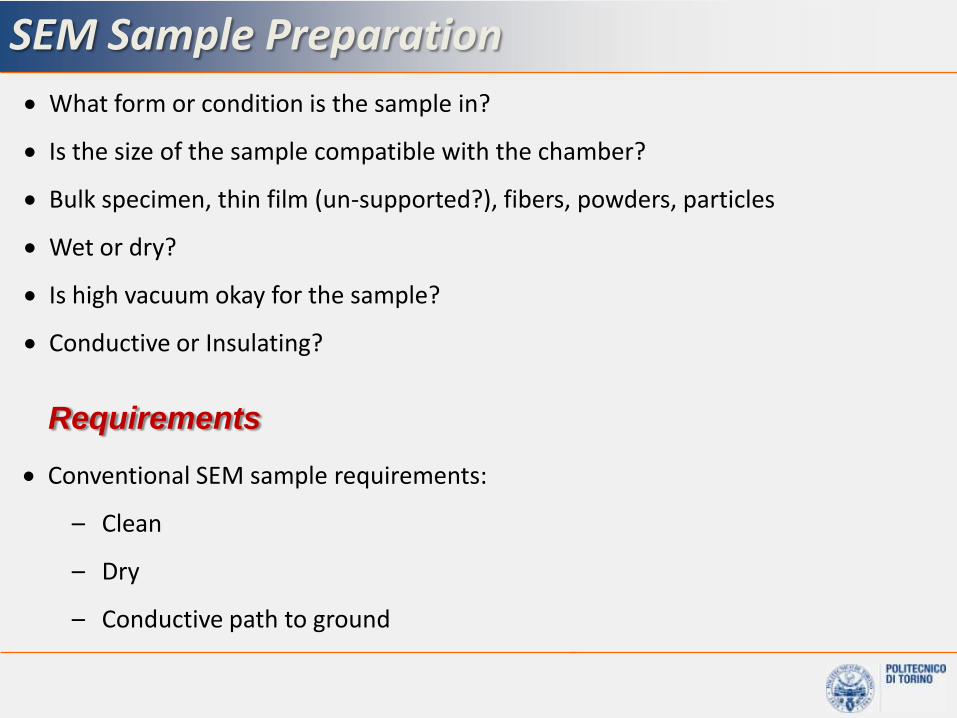
Conventional SEM sample requirements:
– Clean
– Dry
– Conductive path to ground
SEM Sample Preparation
Requirements
What form or condition is the sample in?
Is the size of the sample compatible with the chamber?
Bulk specimen, thin film (un-supported?), fibers, powders, particles
Wet or dry?
Is high vacuum okay for the sample?
Conductive or Insulating?

No standard SEM sample holder or stub
Usually made of aluminum, brass, or copper
Sample mounting

Target material (typically AuPd alloy, Ir, etc.) exposed to an energized gas plasma
Gas plasma is usually an inert gas such as Ar
Target surface is eroded by the plasma and atoms are ejected
Atoms collide with residual gas molecules and deposit everywhere in chamber
Provides a multidirectional coating on a stationary specimen
Sputter coating

47

Stabilità termica del campione
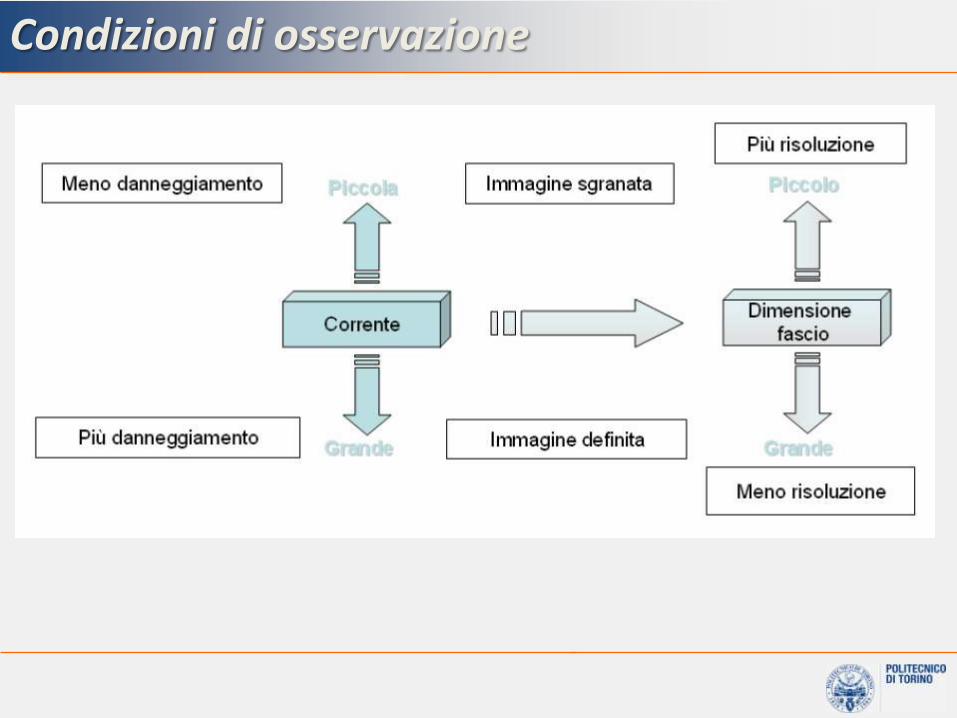
Condizioni di osservazione

Morphology - Inclusions


Examples
Top Down SEM of SiO2 Oblique Angle SEM
SEM images before nitride etch and oxide growth Samples without nitride buffer layer resulted in rounded profiles


Morphology – Sphelulitic structures
PP PE
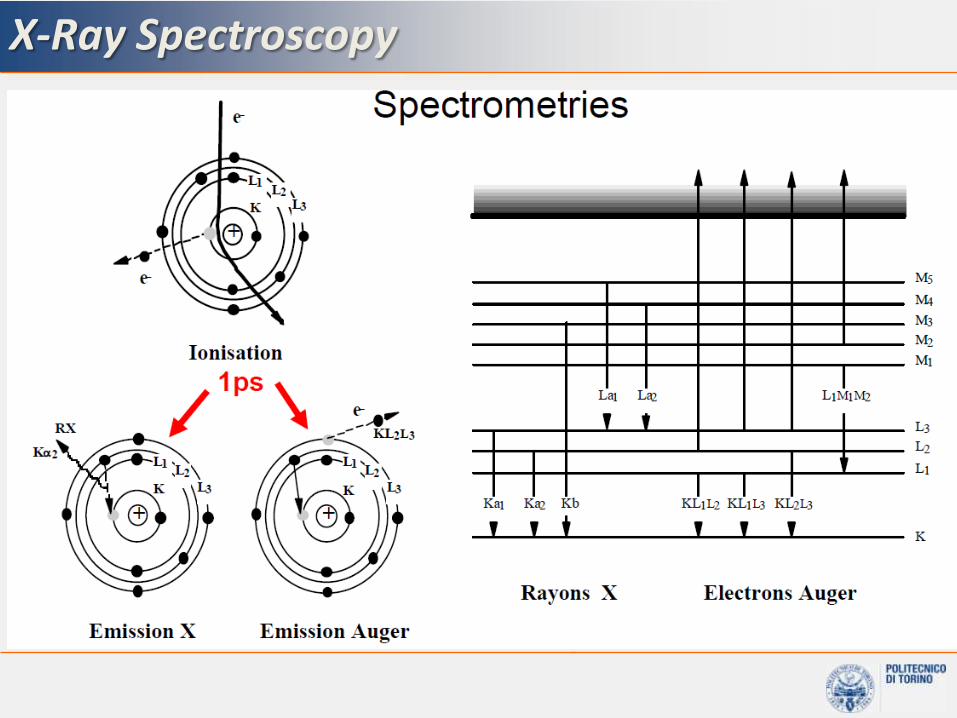
X-Ray Spectroscopy

X-Ray Spectroscopy


Energy Dispersive X-Ray Spectroscopy, EDS
60
Used to determine the elemental composition of a sample.Qualitative and quantitative analysis.


62
Energy Dispersive X-Ray Detector System

EDS detector
63
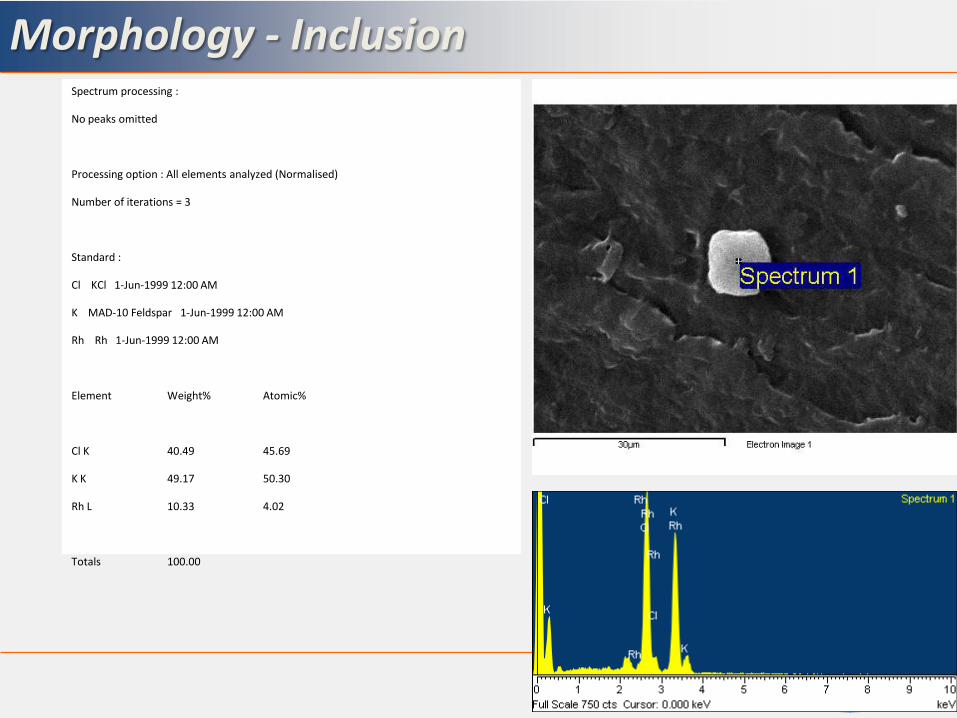
Spectrum processing :
No peaks omitted
Processing option : All elements analyzed (Normalised)
Number of iterations = 3
Standard :
Cl KCl 1-Jun-1999 12:00 AM
K MAD-10 Feldspar 1-Jun-1999 12:00 AM
Rh Rh 1-Jun-1999 12:00 AM
Element Weight% Atomic%
Cl K 40.49 45.69
K K 49.17 50.30
Rh L 10.33 4.02
Totals 100.00
Morphology - Inclusion
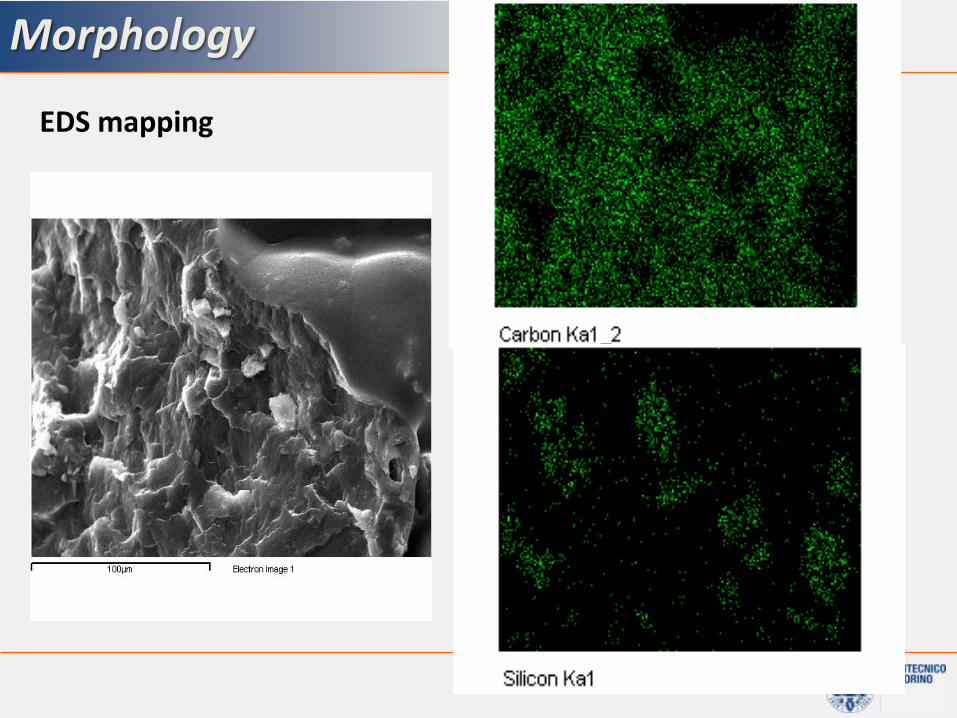
Morphology
EDS mapping

EDS Element Map
FNI 1C 66
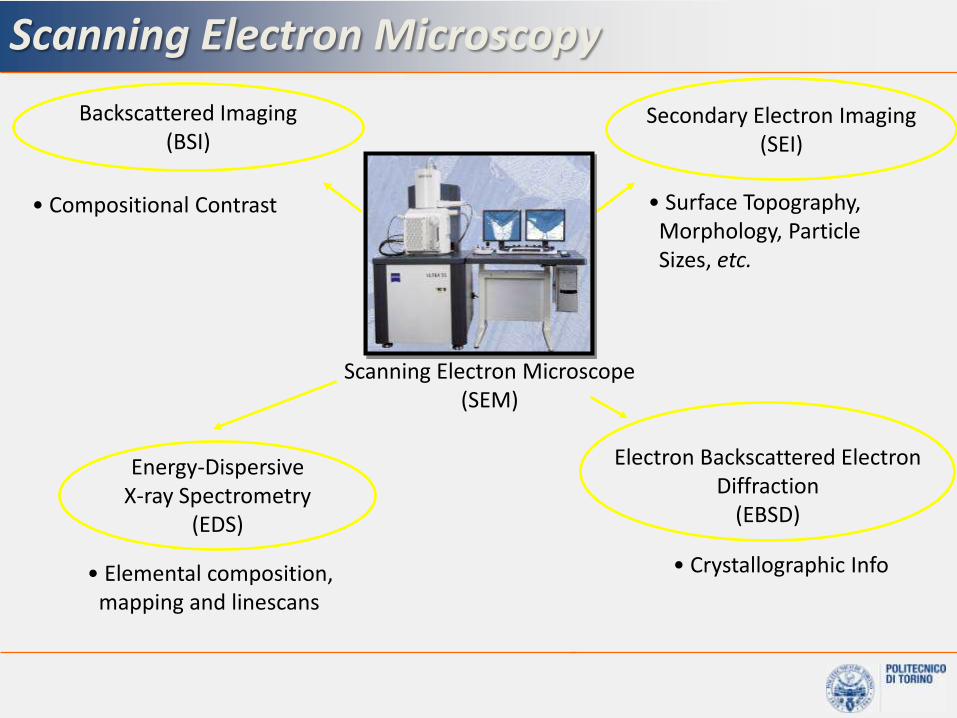
Secondary Electron Imaging(SEI)
Backscattered Imaging(BSI)
• Surface Topography, Morphology, Particle Sizes, etc.
• Compositional Contrast
Energy-Dispersive X-ray Spectrometry
(EDS)
• Elemental composition, mapping and linescans
• Crystallographic Info
Electron Backscattered Electron Diffraction
(EBSD)
Scanning Electron Microscope(SEM)
Scanning Electron Microscopy
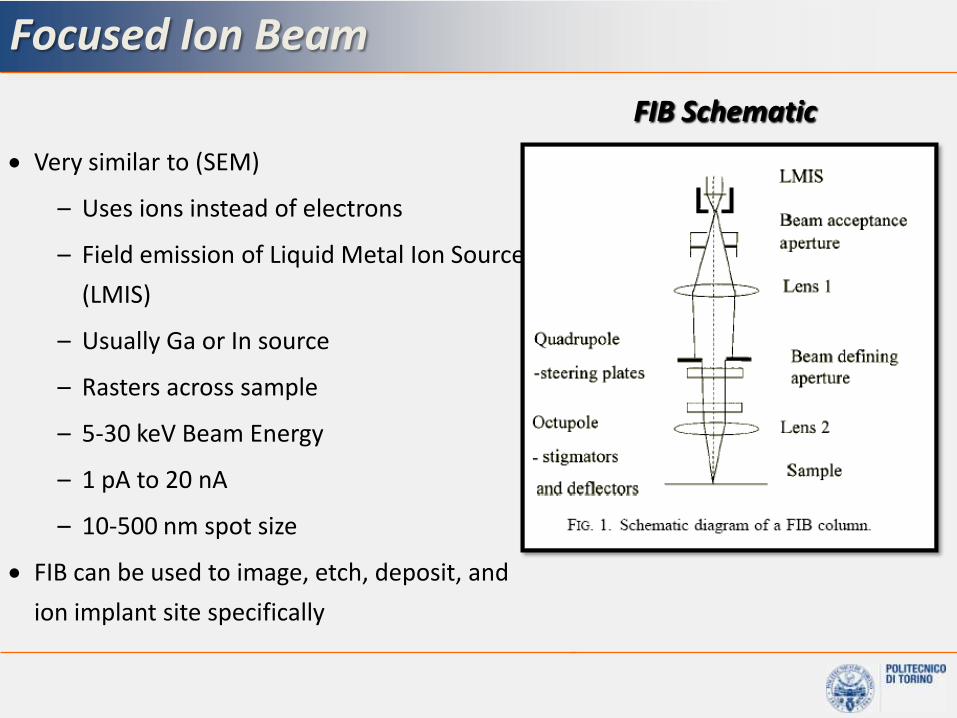
Very similar to (SEM)
– Uses ions instead of electrons
– Field emission of Liquid Metal Ion Source
(LMIS)
– Usually Ga or In source
– Rasters across sample
– 5-30 keV Beam Energy
– 1 pA to 20 nA
– 10-500 nm spot size
FIB can be used to image, etch, deposit, and
ion implant site specifically
FIB Schematic
Focused Ion Beam

Microscopio Elettronico in Trasmissione
FNI 1C 69
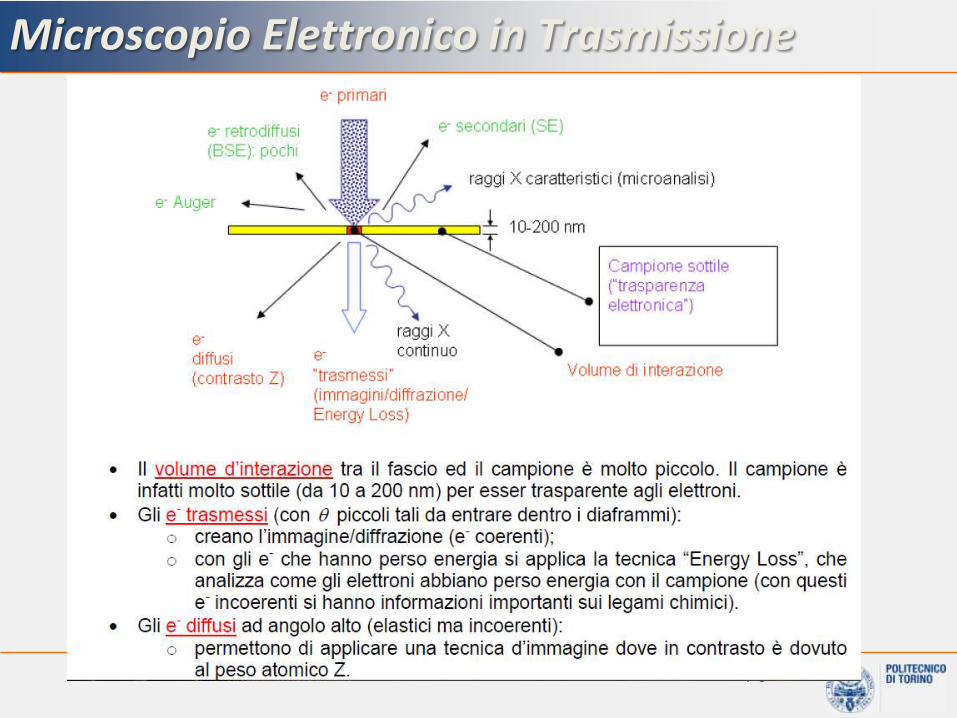
Microscopio Elettronico in Trasmissione
70

TEM Specimen Preparation
Specimen must be thin enough to transmit sufficient electrons to form an image (100 nm)
It should be stable under electron bombardment in a high vacuum
Must fit the specimen holder (i.e. < 3 mm in diameter)
Ideally, specimen preparation should not alter the structure of the specimen at a level observable with the microscope
Always research (i.e. literature search) the different methods appropriate for your sample prep first
Specimen Requirements

Usually used for polymers, polymer
matrix composites, various particles
embedded in epoxy resin, etc.
Automated high precision cutting
machine using glass or diamond knives
capable of cutting specimens as thin as
10 nm
Ultramicrotomy
TEM specimen preparation
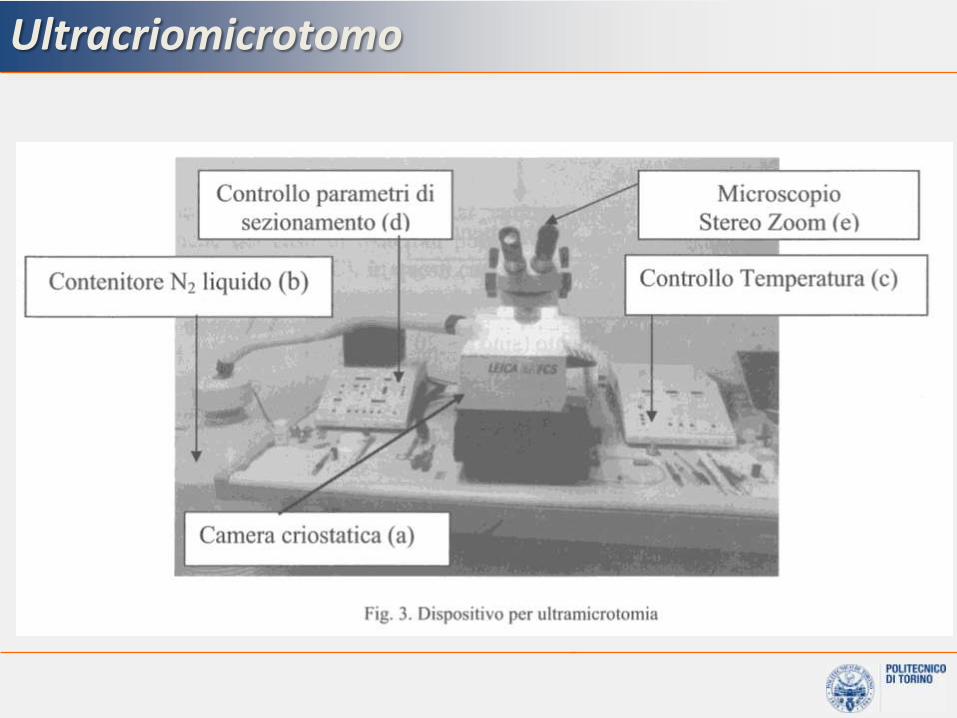
Ultracriomicrotomo

F. Shaapur, “An Introduction to Basic Specimen Preparation Techniques for Electron Microscopy of Materials”, Arizona State University, (1997) http://www.asu.edu.class/csss
Ultramicrotomy
Specimen arm holds and slices a sample with a tapered end (to reduce the cutting cross-section) by lowering it against the sharp edge of the knife
Cutting strokes combined with simultaneous feeding of the sample toward the cutting edge produce ultra-thin sections
TEM specimen preparation
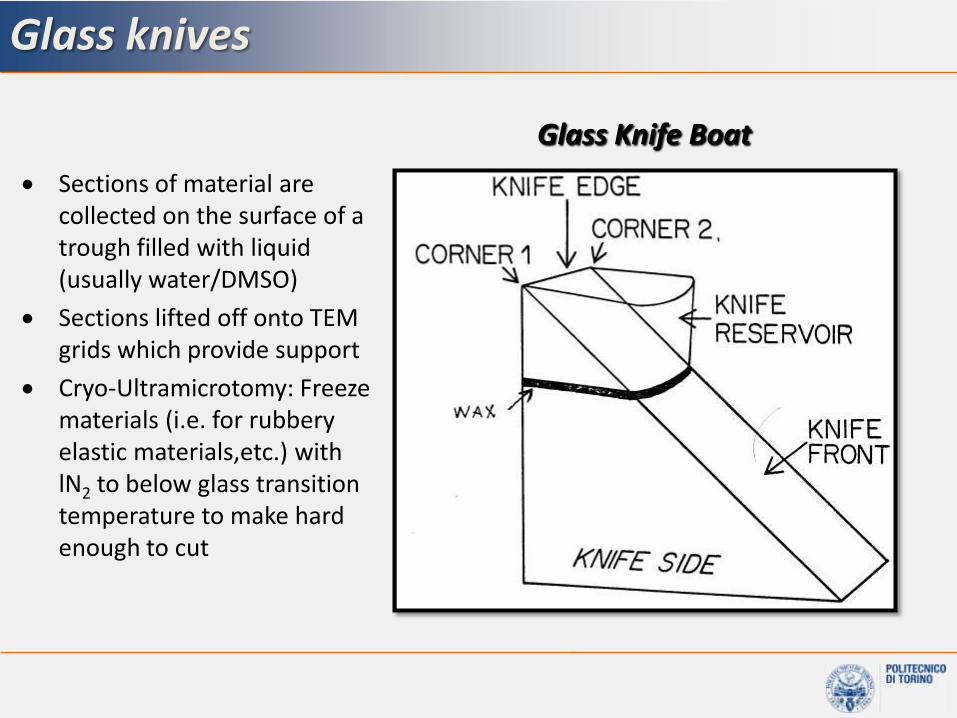
Glass Knife Boat
Sections of material are collected on the surface of a trough filled with liquid (usually water/DMSO)
Sections lifted off onto TEM grids which provide support
Cryo-Ultramicrotomy: Freeze materials (i.e. for rubbery elastic materials,etc.) with lN2 to below glass transition temperature to make hard enough to cut
Glass knives
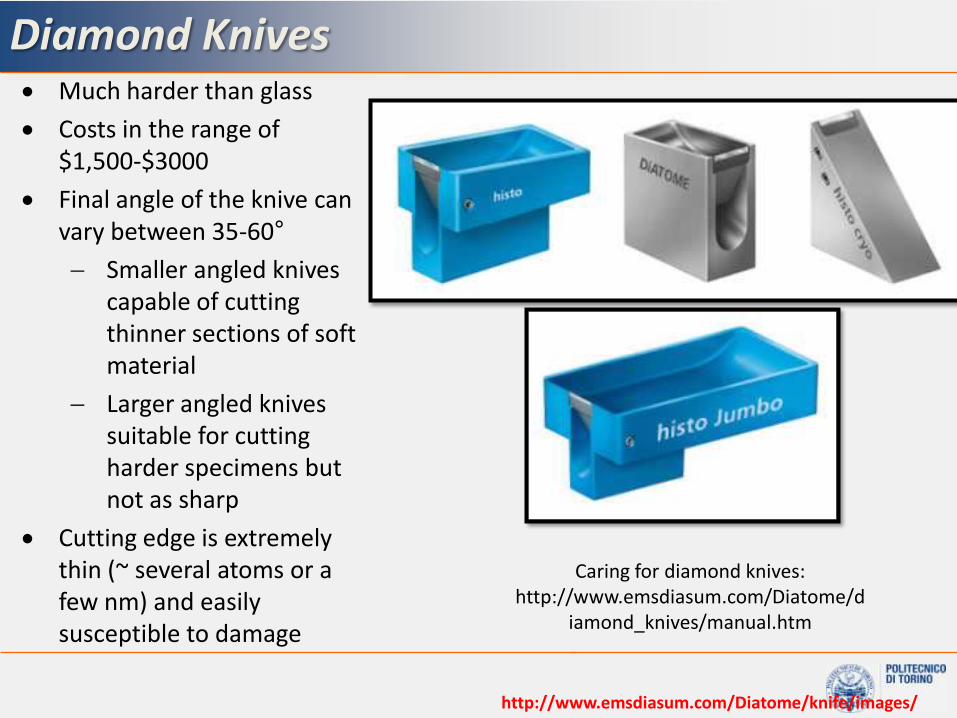
http://www.emsdiasum.com/Diatome/knife/images/
Caring for diamond knives:http://www.emsdiasum.com/Diatome/d
iamond_knives/manual.htm
Much harder than glass
Costs in the range of $1,500-$3000
Final angle of the knive can vary between 35-60°
Smaller angled knives capable of cutting thinner sections of soft material
Larger angled knives suitable for cutting harder specimens but not as sharp
Cutting edge is extremely thin (~ several atoms or a few nm) and easily susceptible to damage
Diamond Knives

Raccolta sezioni
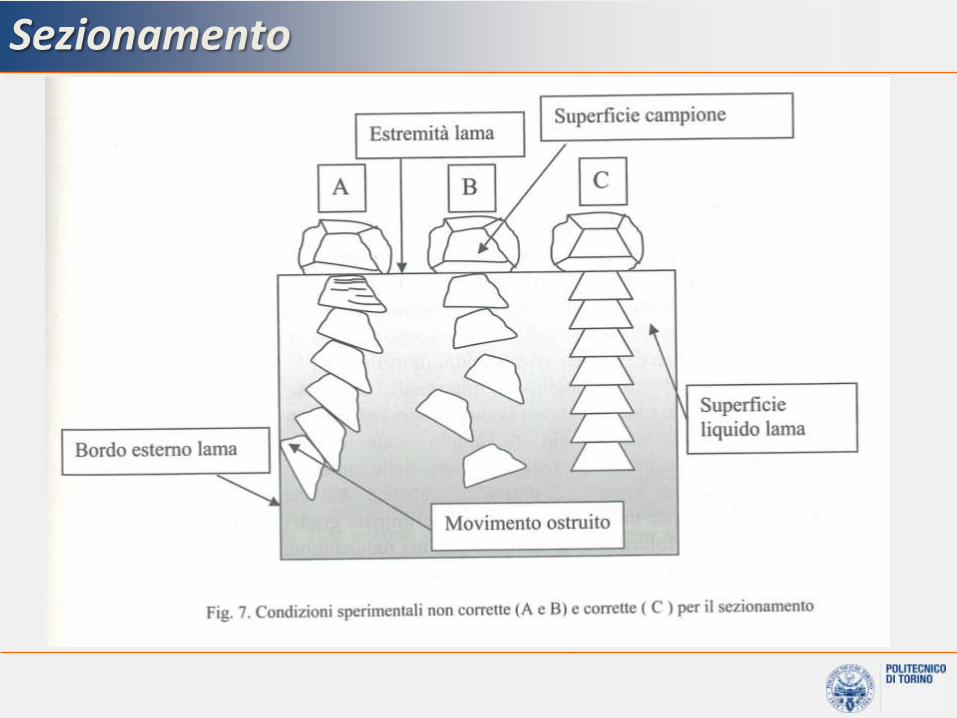
Sezionamento
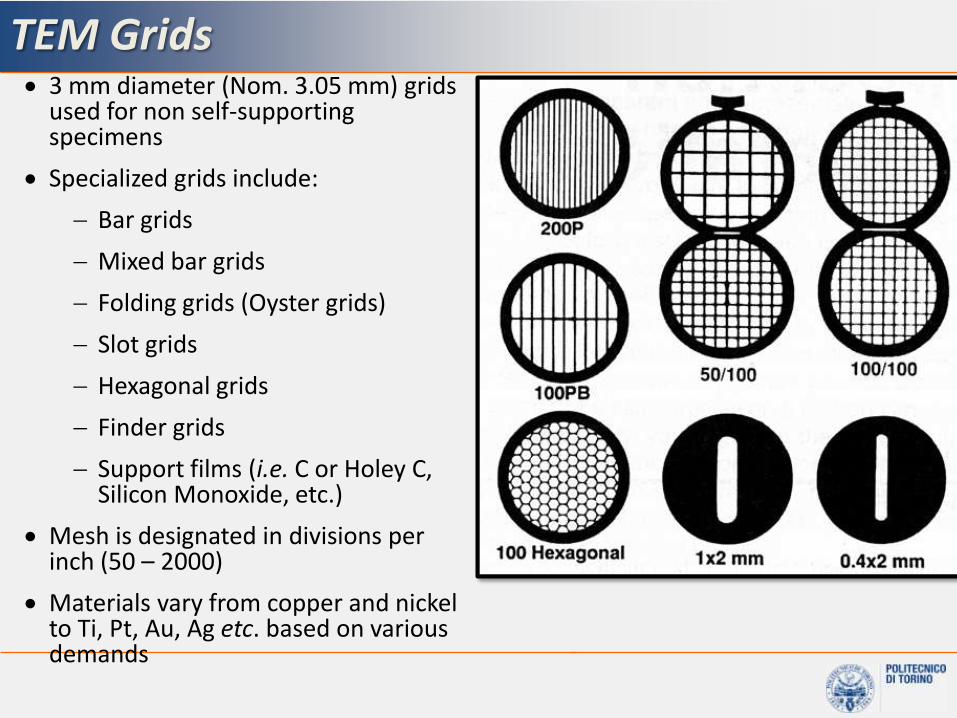
TEM Grids 3 mm diameter (Nom. 3.05 mm) grids
used for non self-supporting specimens
Specialized grids include:
Bar grids
Mixed bar grids
Folding grids (Oyster grids)
Slot grids
Hexagonal grids
Finder grids
Support films (i.e. C or Holey C, Silicon Monoxide, etc.)
Mesh is designated in divisions per inch (50 – 2000)
Materials vary from copper and nickel to Ti, Pt, Au, Ag etc. based on various demands

Morfologia – SiO2 in gomma

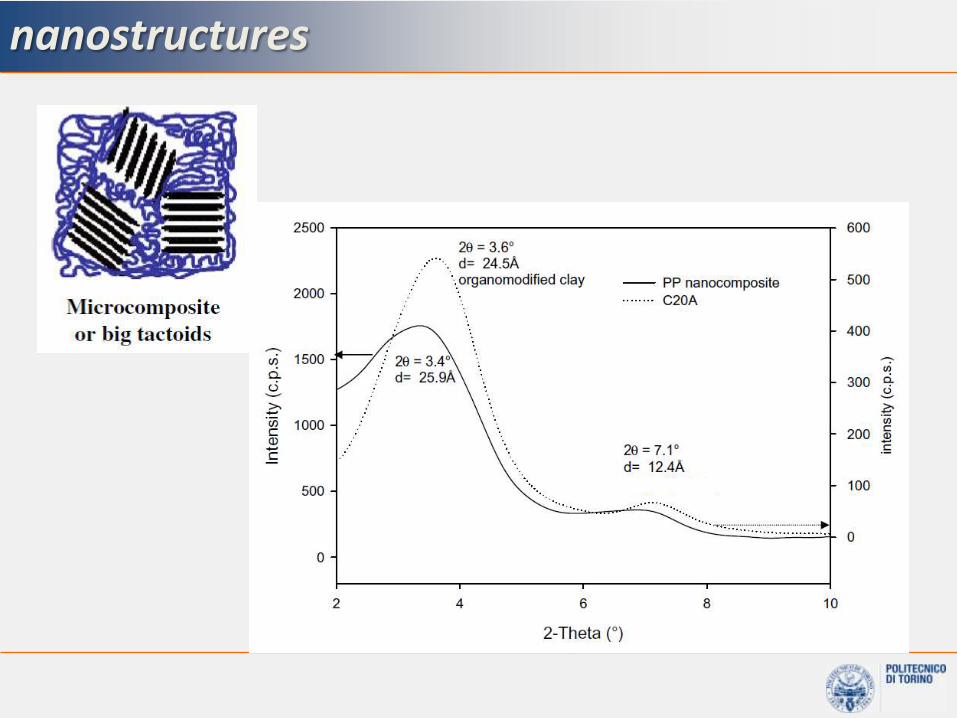
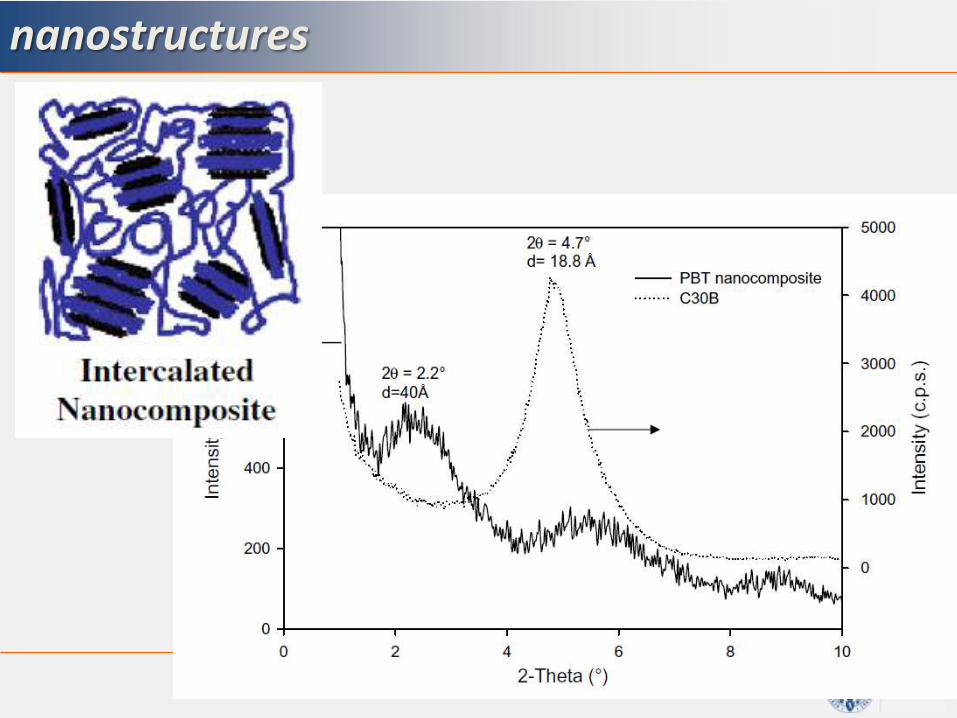
Polymer-Layered Silicate Nanocomposites
Organoclay nanocomposite (10% in Novalac-Based Cyanate Ester)
XRD gives average interlayer d-spacing while TEM can give site specific morphology and d-spacing
In this case, XRD gave no peaks
Many factors such as concentration and order of the clay can influence the XRD patterns
XRD often inconclusive when used alone
TEM of Intercalated Nanoclay
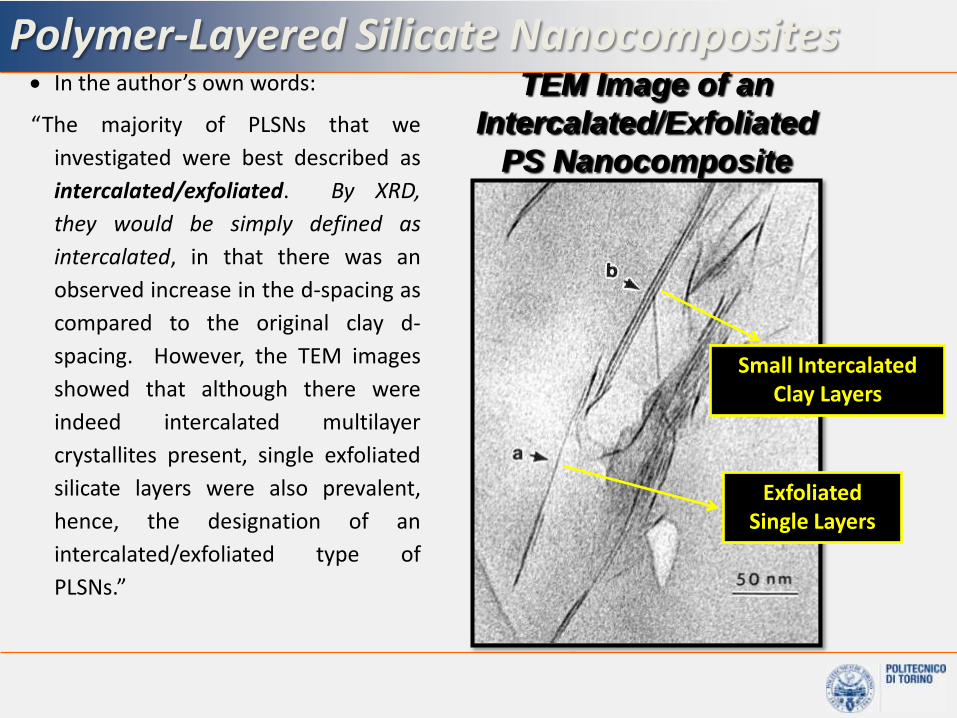
Polymer-Layered Silicate Nanocomposites In the author’s own words:
“The majority of PLSNs that we
investigated were best described as
intercalated/exfoliated. By XRD,
they would be simply defined as
intercalated, in that there was an
observed increase in the d-spacing as
compared to the original clay d-
spacing. However, the TEM images
showed that although there were
indeed intercalated multilayer
crystallites present, single exfoliated
silicate layers were also prevalent,
hence, the designation of an
intercalated/exfoliated type of
PLSNs.”
TEM Image of an
Intercalated/Exfoliated
PS Nanocomposite
Exfoliated Single Layers
Small Intercalated Clay Layers

TEM image of exfoliated systemTEM image of intercalated system
Trasmission Electron Microscopy

Trasmission Electron Microscopy (TEM)
Very local analysis
Time Consuming
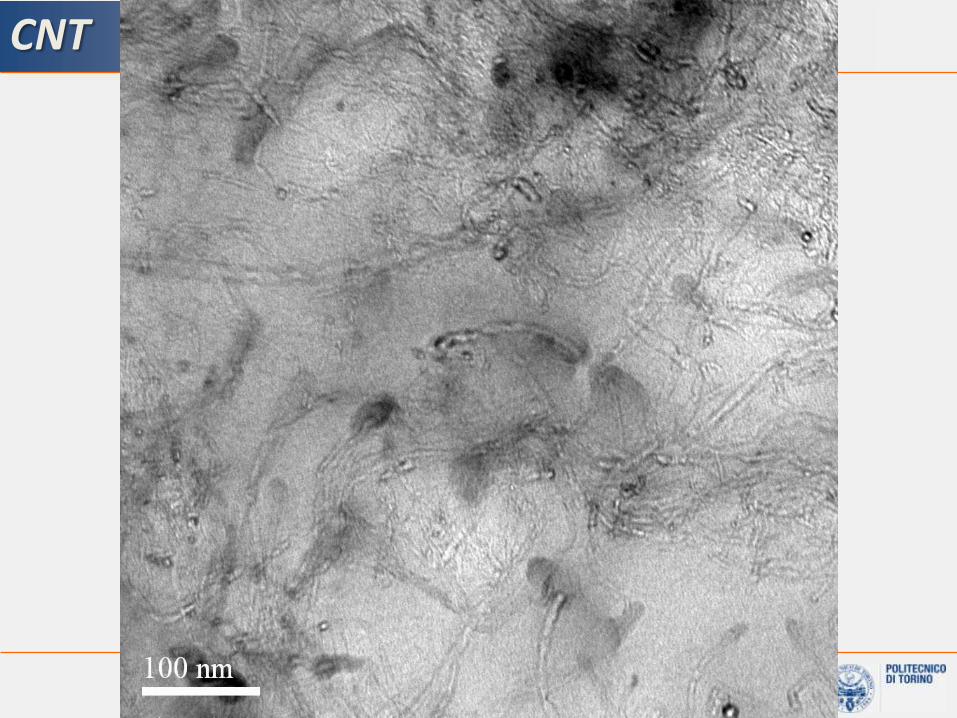
CNT

0.5 μm
CNT preferentially located at the interface
CNT in polymer blends

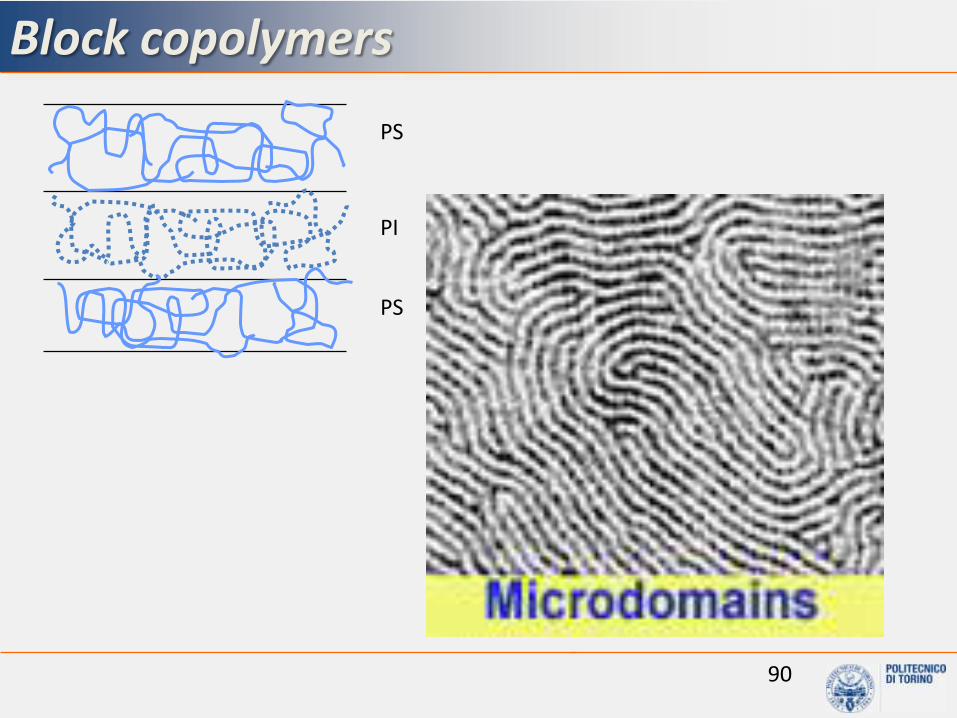
Morfologia – copolimeri a blocchi
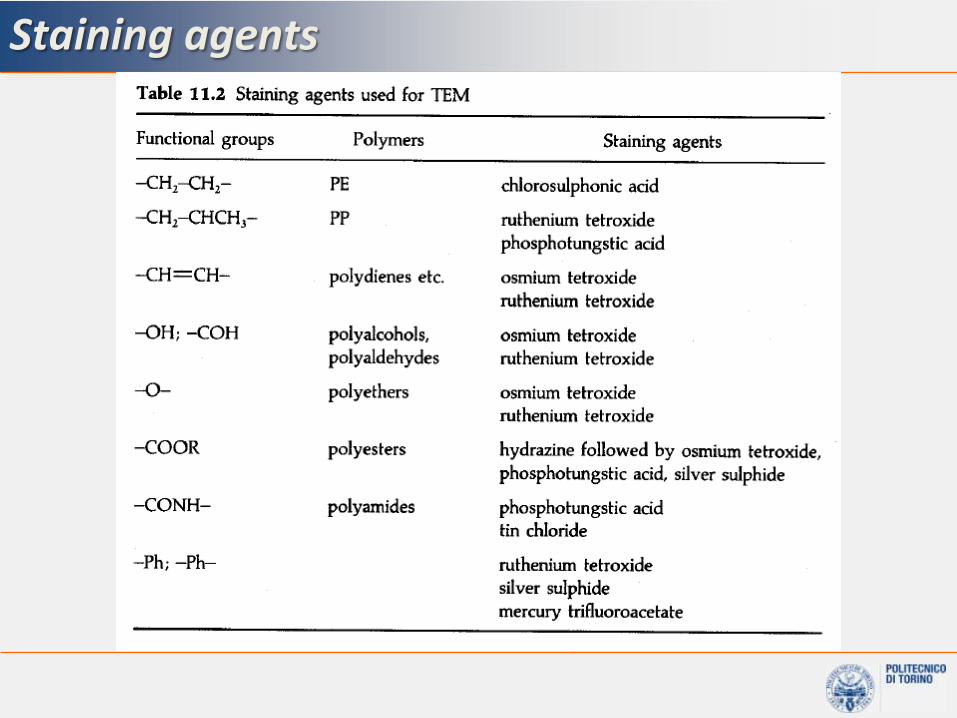
Staining agents
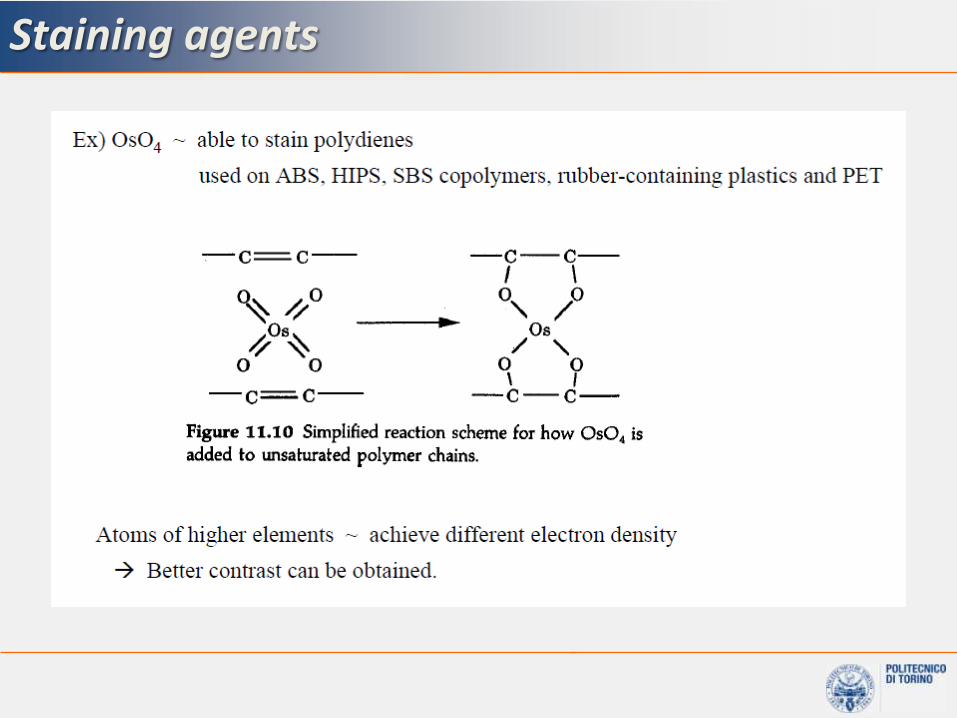
Staining agents
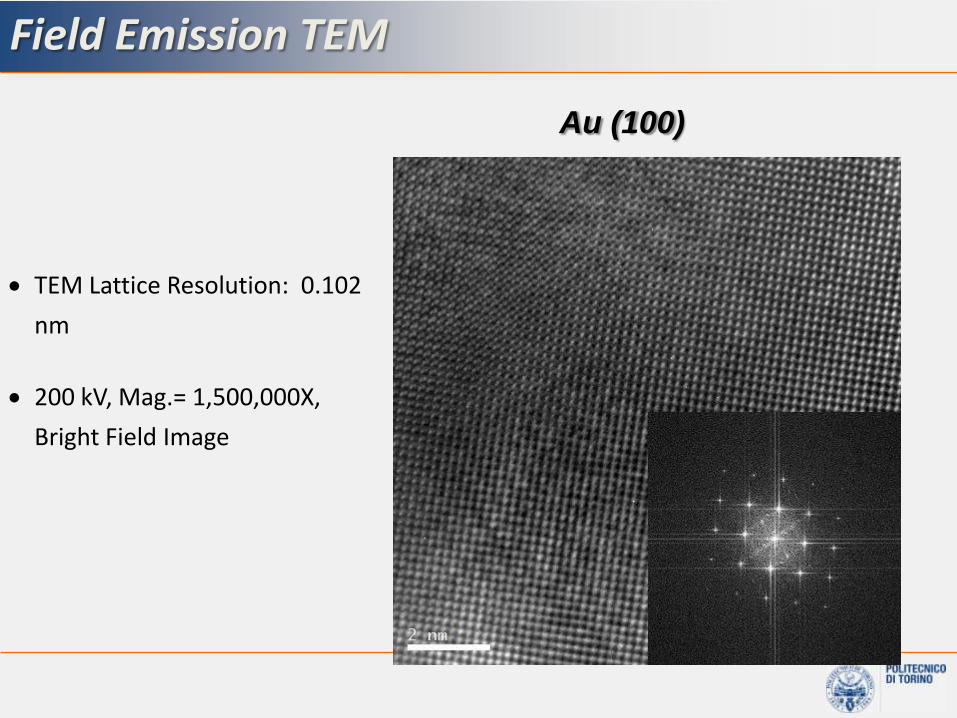
Field Emission TEM
TEM Lattice Resolution: 0.102
nm
200 kV, Mag.= 1,500,000X,
Bright Field Image
Au (100)

Electron Diffraction(ED)
High-Resolution Transmission Electron Microscopy
(HR-TEM)
Bright- and Dark-Field Imaging(BF/DF imaging)
• Crystallographic Info• Internal ultrastructure• Nanostructure dispersion• Defect identification
• Interface structure• Defect structure
Energy-Dispersive X-ray Spectrometry
(EDS)
• Elemental composition, mapping and linescans
Transmission Electron Microscope(TEM)
TEM capabilities
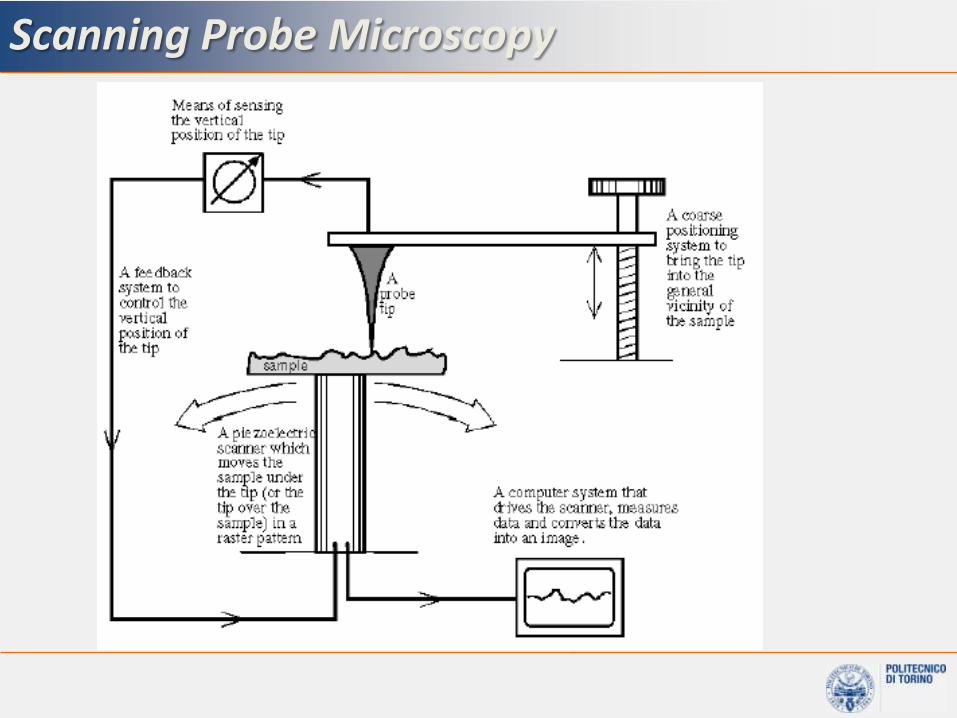
Scanning Probe Microscopy

Scanning Tunneling Microscopy

Atomic Force Microscopy

Atomic Force Microscopy
96
Position sensitive detectorLaser
Braille for Scientists
potentially simple idea, can be very sophisticated

Atomic Force Microscopy

Advantages of AFM

Advantages of AFM

AFM modes

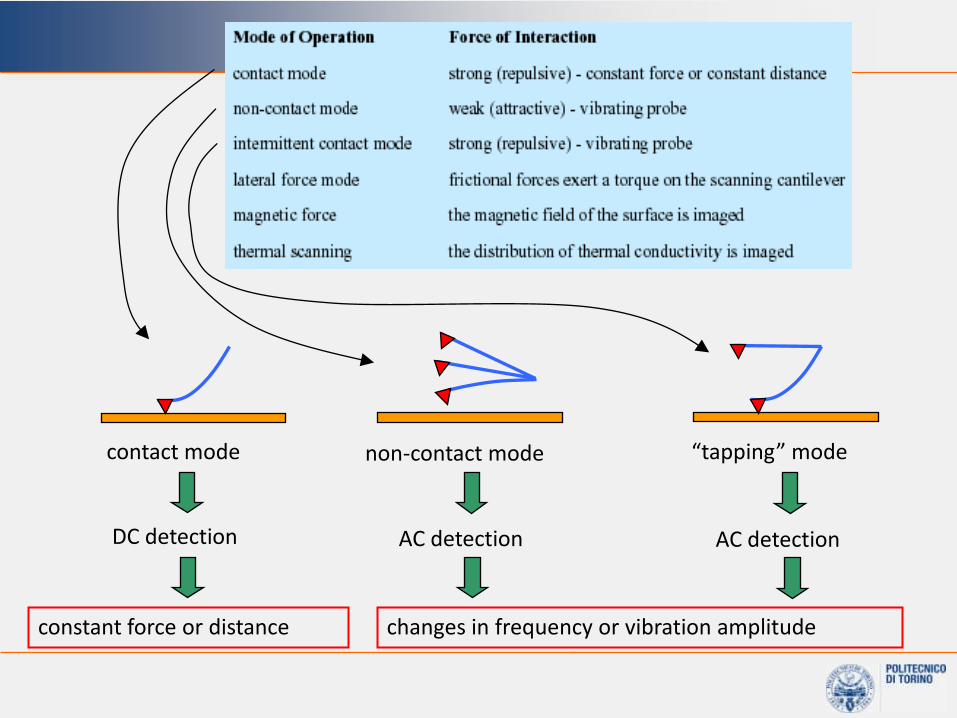
contact mode non-contact mode “tapping” mode
DC detection AC detection AC detection
constant force or distance changes in frequency or vibration amplitude

AFM modes

M. Ataeefard, S. Moradian / Applied Surface Science 257 (2011) 2320–2326
PP/oMMT
3D, 2D and phase image topographic images of atomic force microscopy various PP nanocomposites
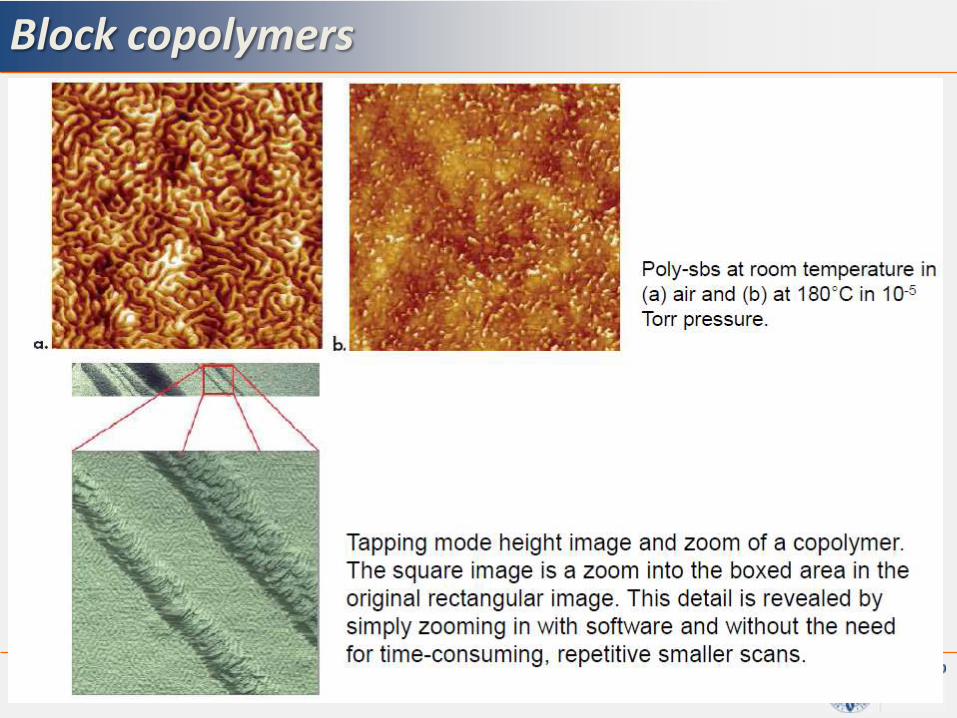
Block copolymers

TPO/PP-g-MA/ MMT nanocomposites
D.H. Kim et al. / Polymer 48 (2007) 5960-5978

Artifacts

X-Ray Imaging
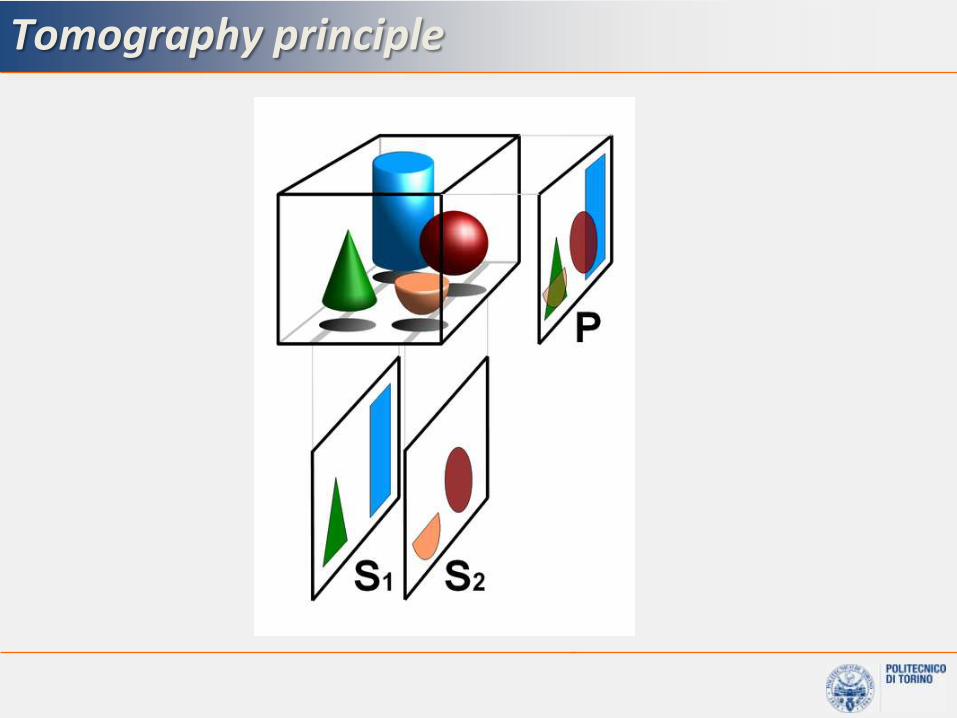
Tomography principle
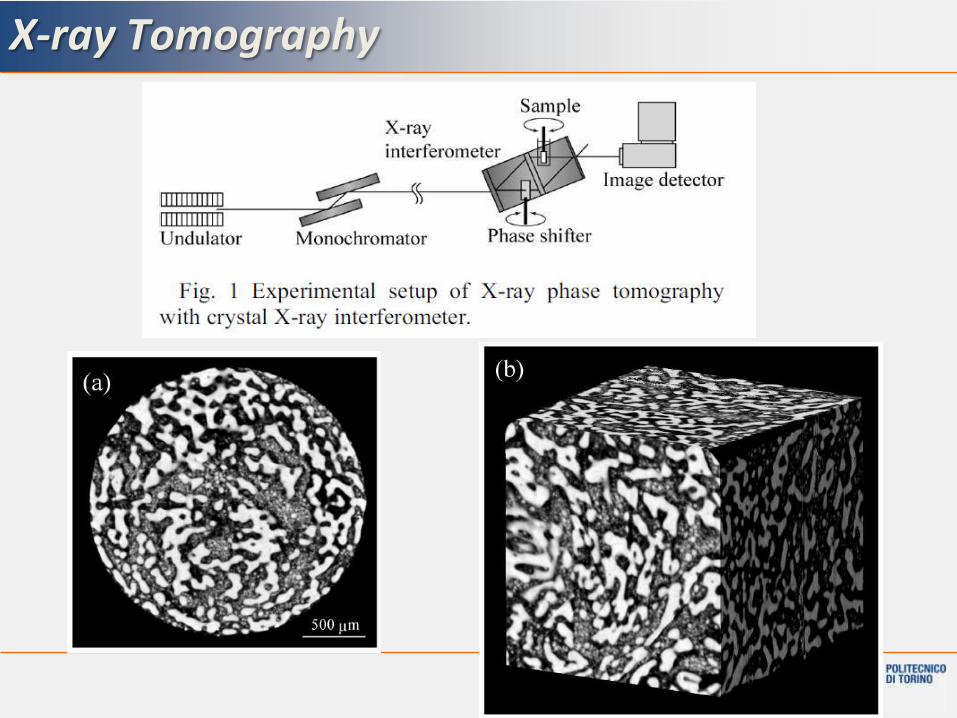
X-ray Tomography

X-ray Tomography

NMR imaging
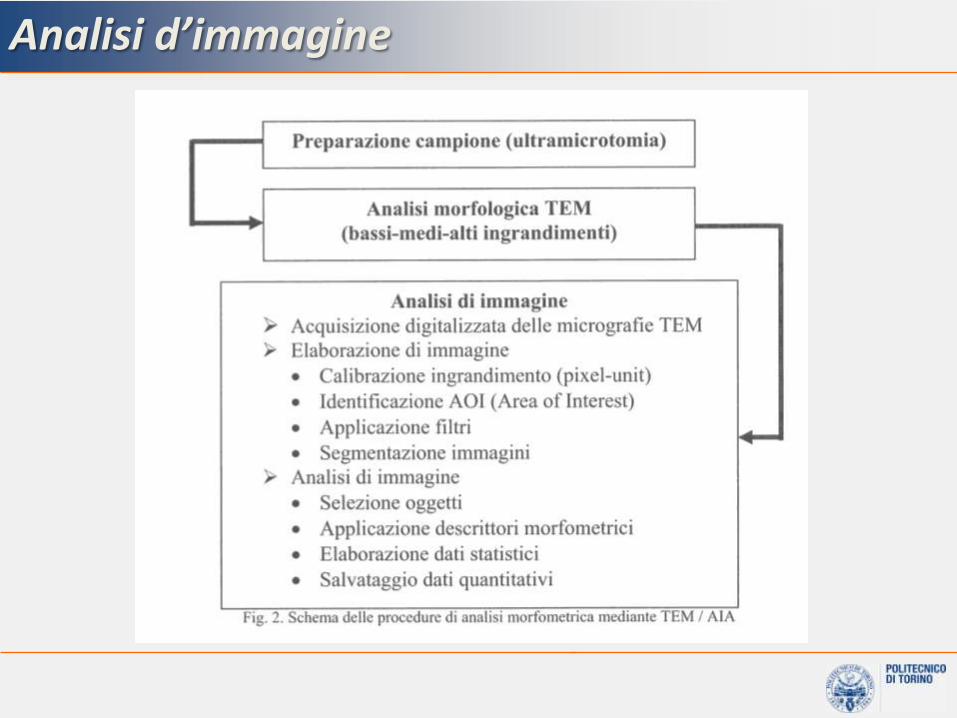
Analisi d’immagine

Binarisation


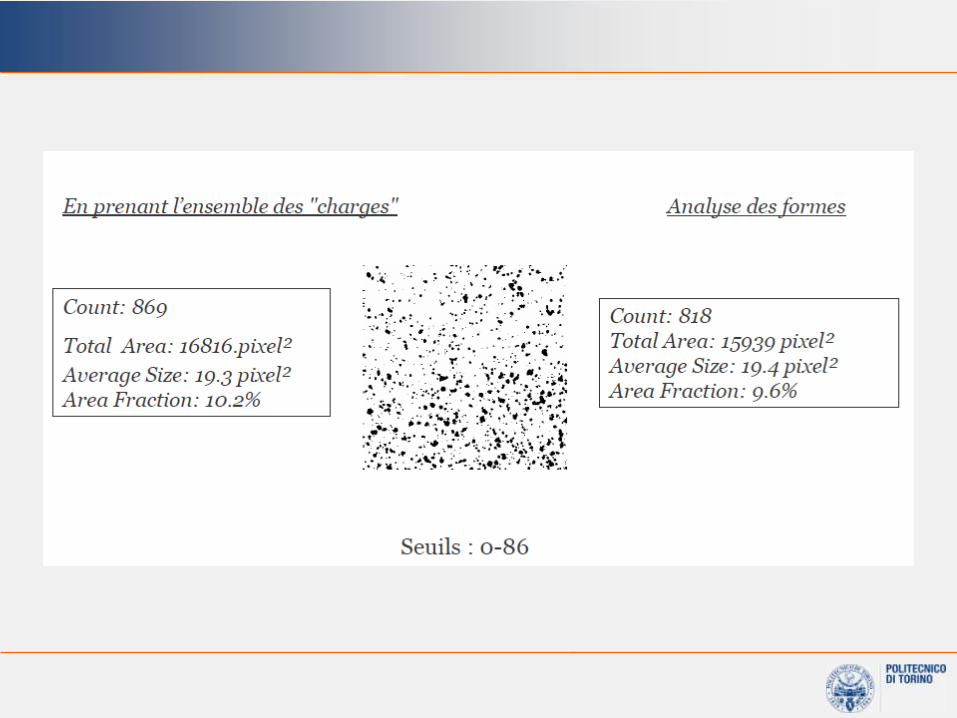
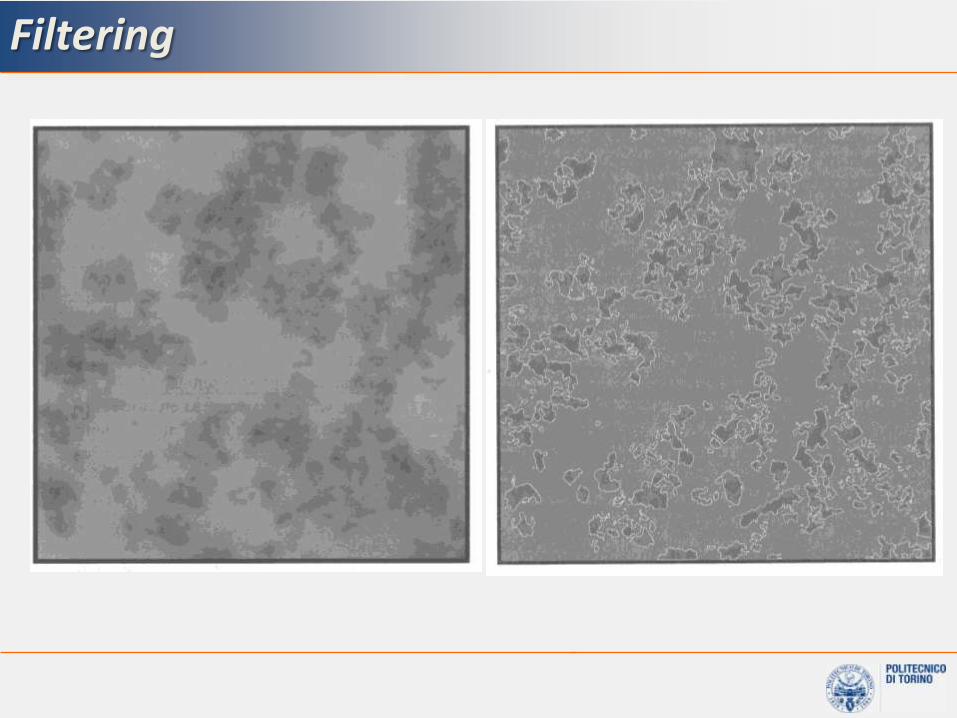
Filtering


X-raydiffraction

Diffrazione
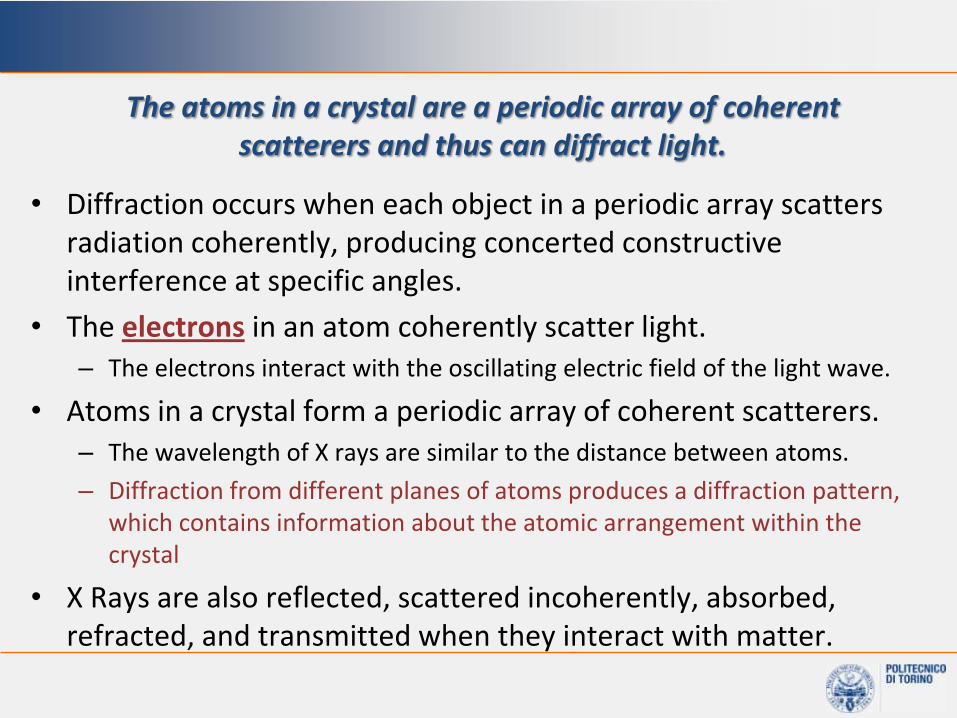
The atoms in a crystal are a periodic array of coherent scatterers and thus can diffract light.
• Diffraction occurs when each object in a periodic array scatters radiation coherently, producing concerted constructive interference at specific angles.
• The electrons in an atom coherently scatter light. – The electrons interact with the oscillating electric field of the light wave.
• Atoms in a crystal form a periodic array of coherent scatterers.– The wavelength of X rays are similar to the distance between atoms.
– Diffraction from different planes of atoms produces a diffraction pattern, which contains information about the atomic arrangement within the crystal
• X Rays are also reflected, scattered incoherently, absorbed, refracted, and transmitted when they interact with matter.

Waves interaction

Bragg’s law
• For parallel planes of atoms, with a space dhkl between the planes, constructive interference only occurs when Bragg’s law is satisfied. – In our diffractometers, the X-ray wavelength l is fixed.
– Consequently, a family of planes produces a diffraction peak only at a specific angle q.
– Additionally, the plane normal must be parallel to the diffraction vector• Plane normal: the direction perpendicular to a plane of atoms
• Diffraction vector: the vector that bisects the angle between the incident and diffracted beam
• The space between diffracting planes of atoms determines peak positions.
• The peak intensity is determined by what atoms are in the diffracting plane.
ql sin2 hkldn = q q dh
kld
hkl

At 20.6 °2q, Bragg’s law fulfilled for the (100) planes, producing a diffraction peak.
The (110) planes would diffract at 29.3 °2q; however, they are not properly aligned to produce a diffraction peak (the perpendicular to those planes does not bisect the incident and diffracted beams). Only background is observed.
The (200) planes are parallel to the (100) planes. Therefore, they also diffract for this crystal. Since d200 is ½ d100, they appear at 42 °2q.
2q
Active diffraction planes

• For every set of planes, there will be a small percentage of crystallites that are properly oriented to diffract (the plane perpendicular bisects the incident and diffracted beams).
• Basic assumptions of powder diffraction are that for every set of planes there is an equal number of crystallites that will diffract and that there is a statistically relevant number of crystallites, not just one or two.
2q 2q 2q
Active diffraction planes

• Powder Diffraction is more aptly named polycrystalline diffraction
– Samples can be powder, sintered pellets, coatings on substrates, polymers, …
• If the crystallites are randomly oriented, and there are enough of them, then they will produce a continuous Debye cone.
• In a linear diffraction pattern, the detector scans through an arc that intersects each Debye cone at a single point; thus giving the appearance of a discrete diffraction peak.

Diffraction

Peak width
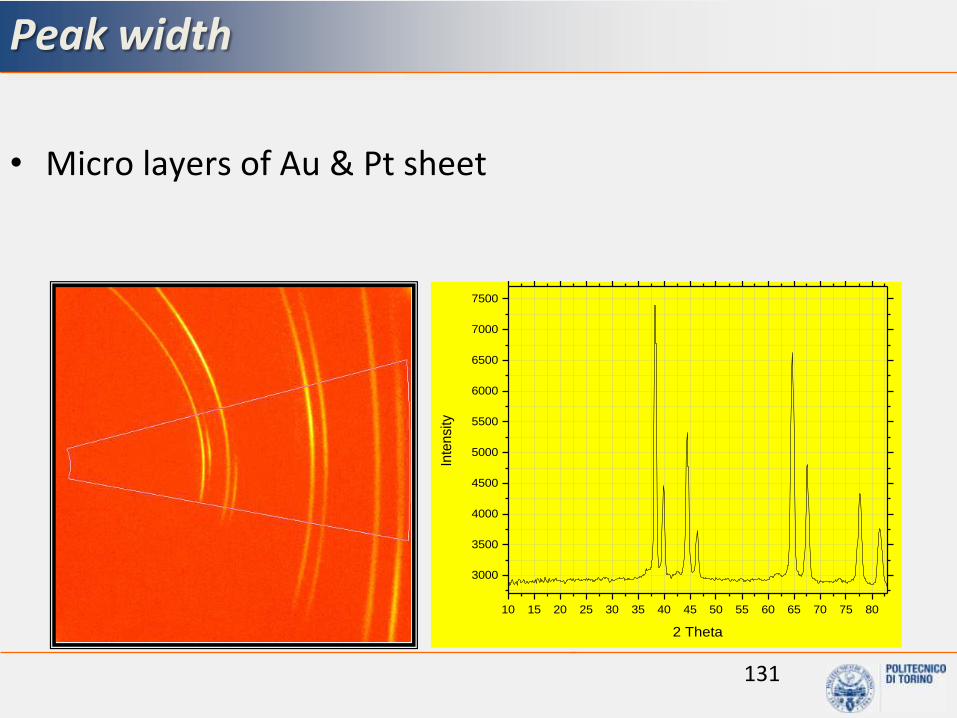
Peak width
• Micro layers of Au & Pt sheet
131
10 15 20 25 30 35 40 45 50 55 60 65 70 75 80
3000
3500
4000
4500
5000
5500
6000
6500
7000
7500
Inte
nsity
2 Theta
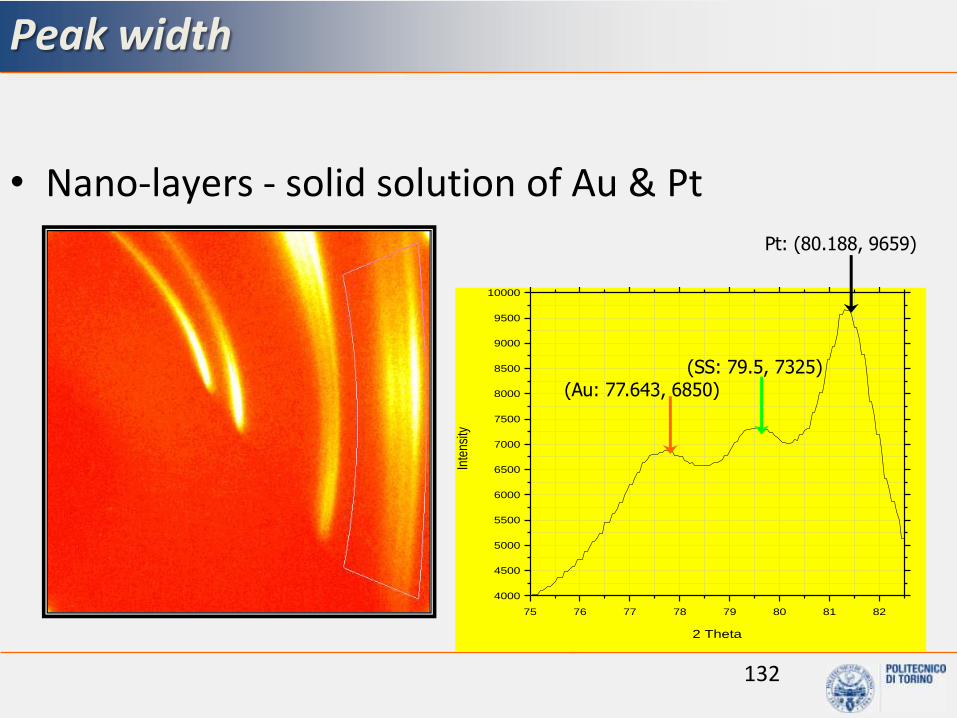
Peak width
• Nano-layers - solid solution of Au & Pt
132
75 76 77 78 79 80 81 82
4000
4500
5000
5500
6000
6500
7000
7500
8000
8500
9000
9500
10000
Inte
nsity
2 Theta
Pt: (80.188, 9659)
(SS: 79.5, 7325)
(Au: 77.643, 6850)
nanostructures
nanostructures

nanostructures

Be careful with XRD
2 4 6 8 10 12 14 16 18 20 22 24 26 28 30
0
100
200
300
400
500
600
700
800
Inte
nsity
2q []
ABS
CNa+
ABS/5% CNa+
1.22nm
When dispersion/distribution of particles is very bad, XRD in reflection may underestimate particle signals

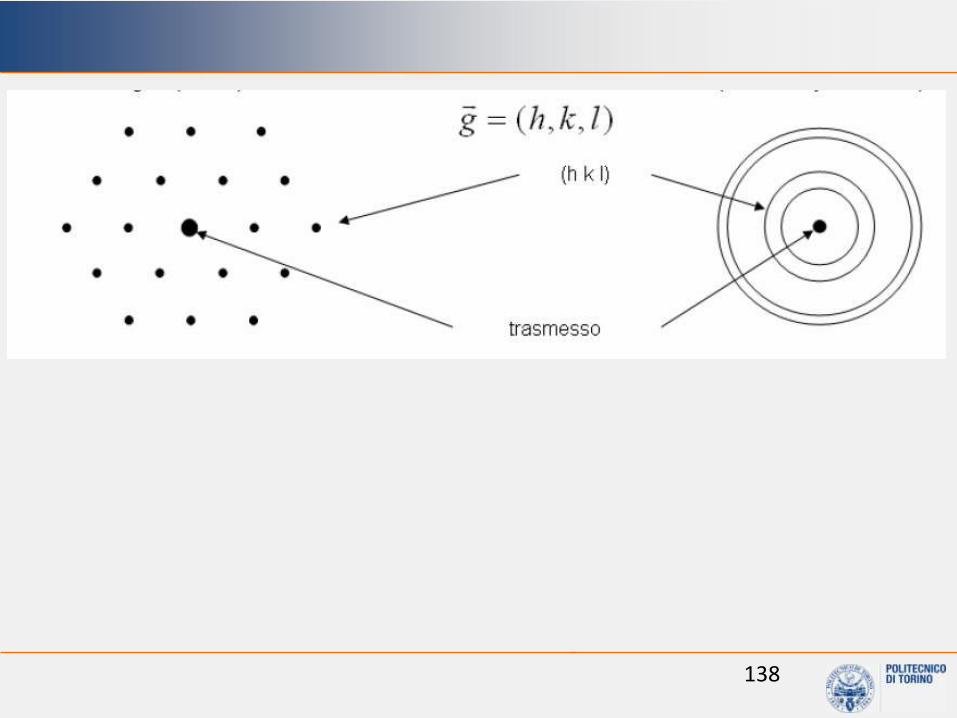
Diffraction in TEM
FNI 1C 137
138
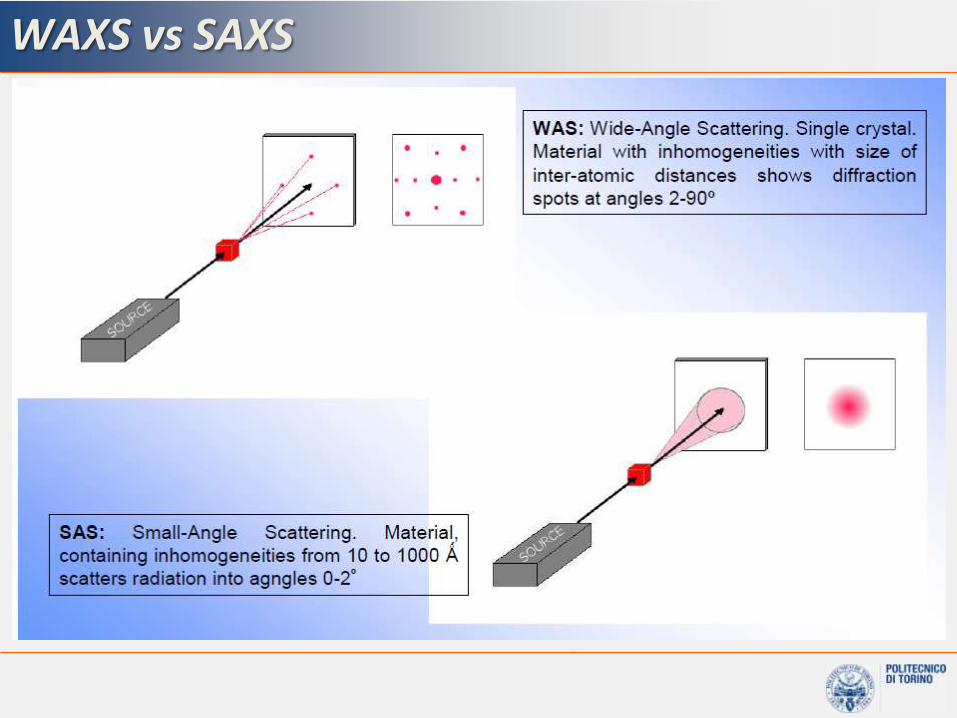
WAXS vs SAXS
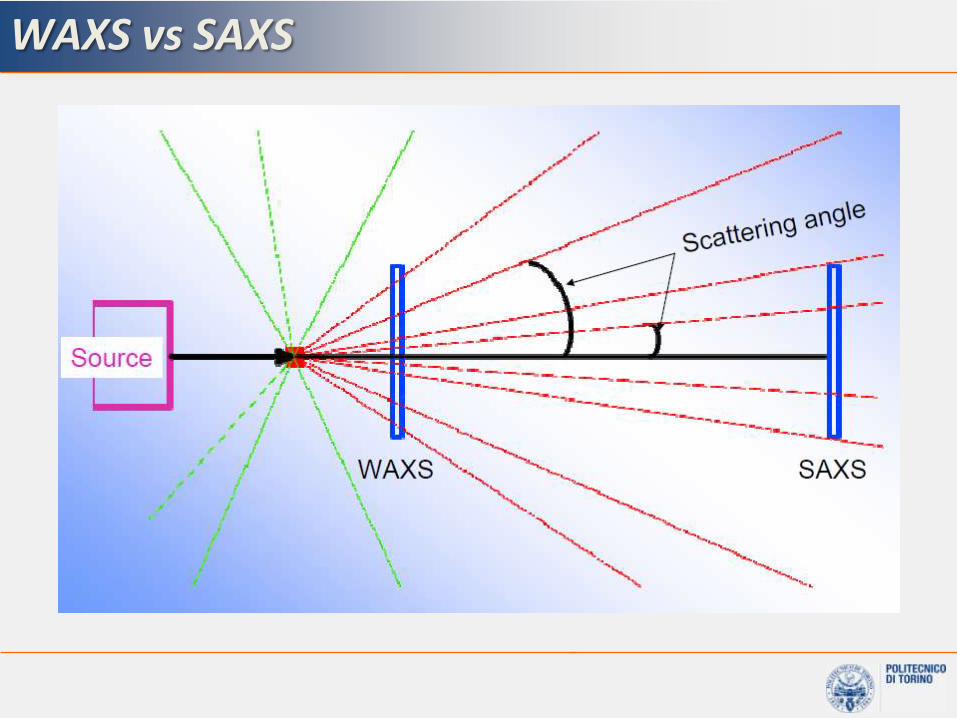
WAXS vs SAXS

SAXS example
L.N. Carli et al. / Materials Science and Engineering C 33 (2013) 932–937

Rheology

Newton and Simple Fluids
• Reflected upon the resistance of liquids to a cylinder rotating in a vessel.
• Newton (-Stokes) Law
– Deformation rate is expected to be proportional to stress and the constant coefficient of proportionality is called viscosity.
• Purely viscous fluid.
143
=

Common Non-Newtonian Behavior
• shear thinning
• shear thickening
• yield stress
• viscoelastic effects
– Weissenberg effect
– Fluid memory
– Die Swell
144

Why polymer rheology is important
Shear Rate, (s-1
)
10-3 10-2 10-1 100 101 102 103 104 105
,
(Pa s
)
101
102
103
104
105
Polypropylene 160-230°C
T
Shear Rate, (s-1
)
10-3 10-2 10-1 100 101 102 103 104 105
,
(Pa s
)
101
102
103
104
105
Polypropylene 160-230°C
TPolymer viscosity changes with shear rate.
This nonlinear effect can be more important than temperature effects.
In polymer processing, accounting for such effects is of vital importance.

Two standard kinds of flows, shear and shearfree, are used to characterize polymeric liquids
FIG. 3.1-1. Steady simple shear flow
xv y=
; 0; 0x zy yxv y v v= = =
FIG. 3.1-2. Streamlines for elongational flow (b=0)
2
2
x
y
z
v x
v y
v z
=
=
=
(a) Shear (b) Shearfree
Shear rate
Elongationrate
Rheometry

Deformation modes
x
y
zShear Flow Elongational Flow
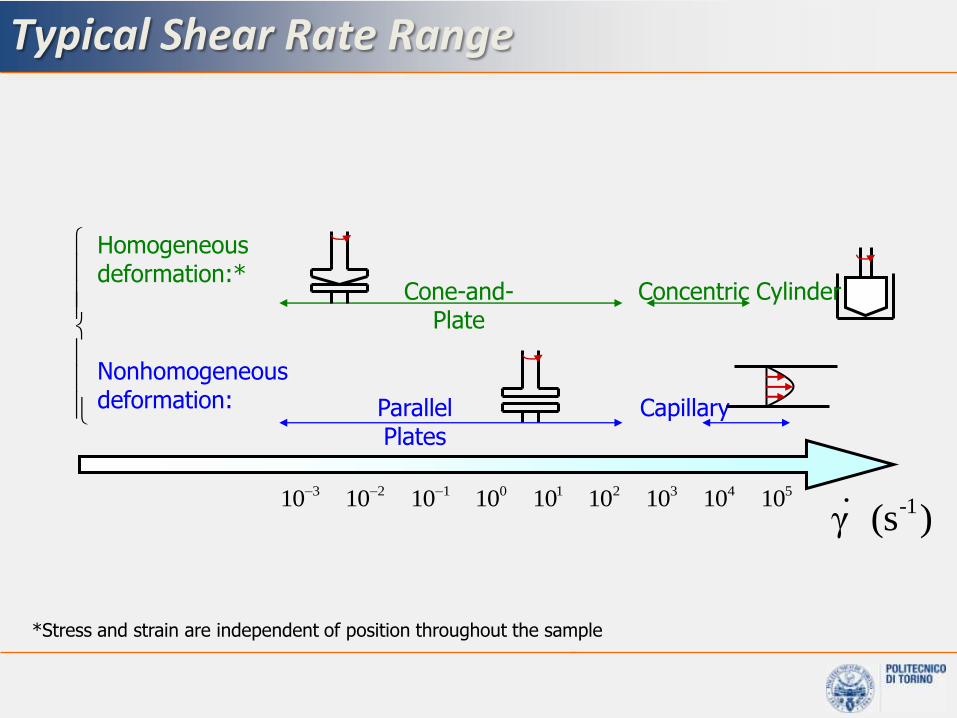
Typical Shear Rate Range
-1γ (s )
Homogeneousdeformation:*
Nonhomogeneousdeformation: Parallel
PlatesCapillary
3 2 1 0 1 2 3 4 510 10 10 10 10 10 10 10 10
Cone-and-Plate
Concentric Cylinder
*Stress and strain are independent of position throughout the sample
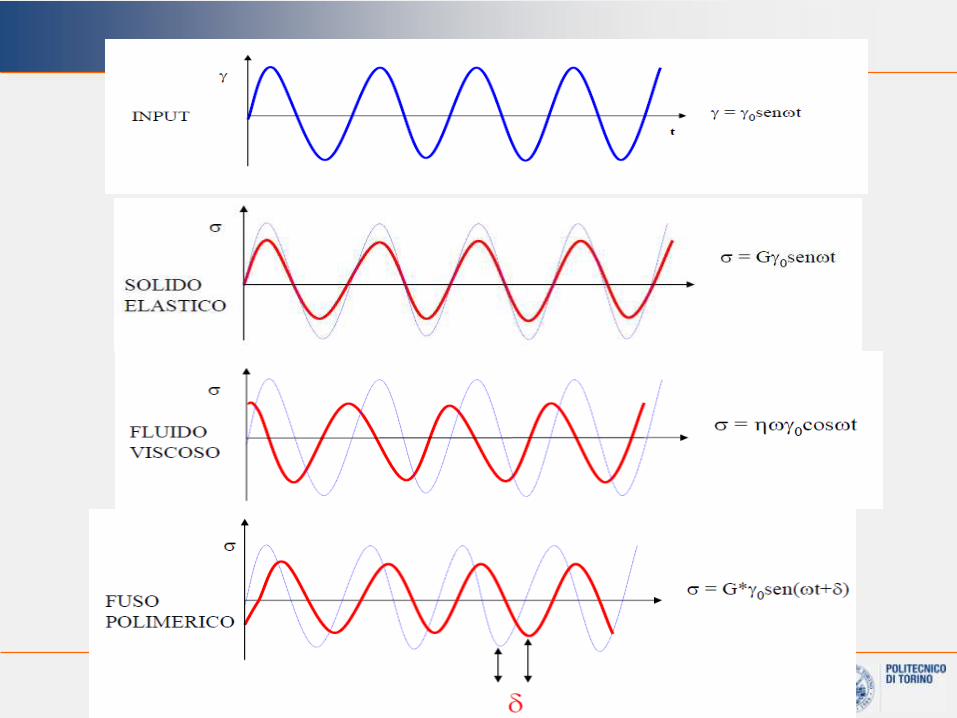
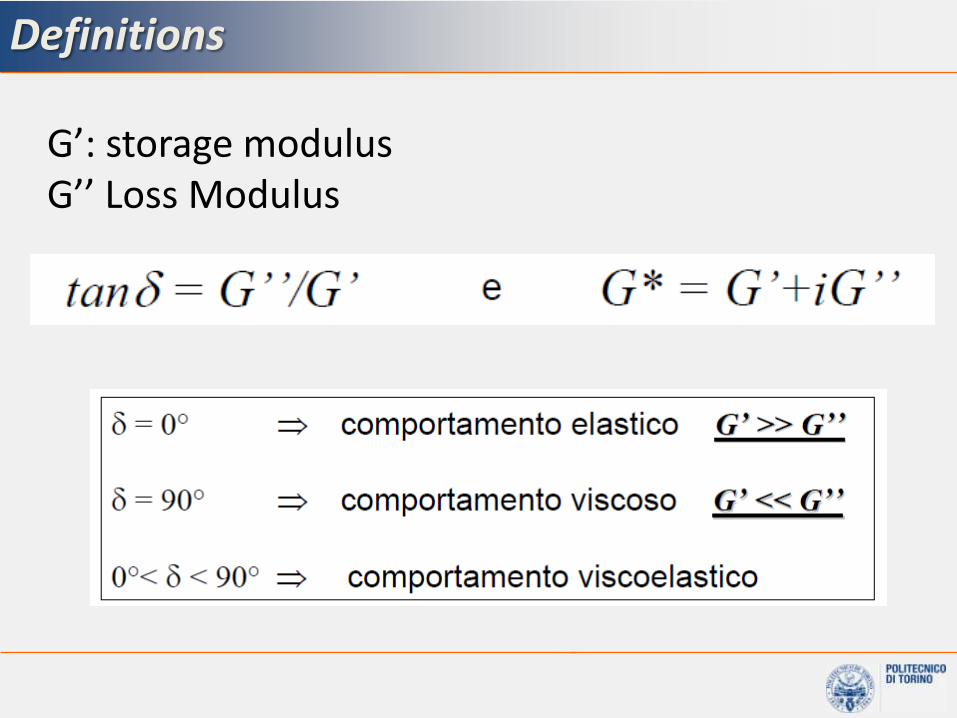
Definitions
G’: storage modulusG’’ Loss Modulus

For a common polymer
Liquid-like Solid-like

Torque (viscosity) during blending
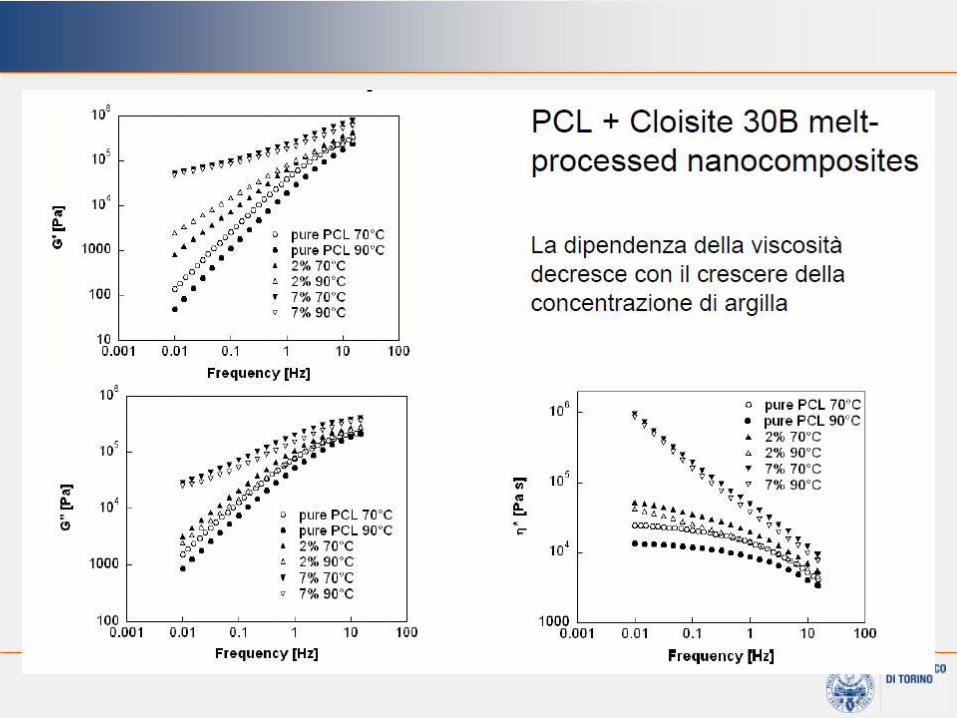
In PCL
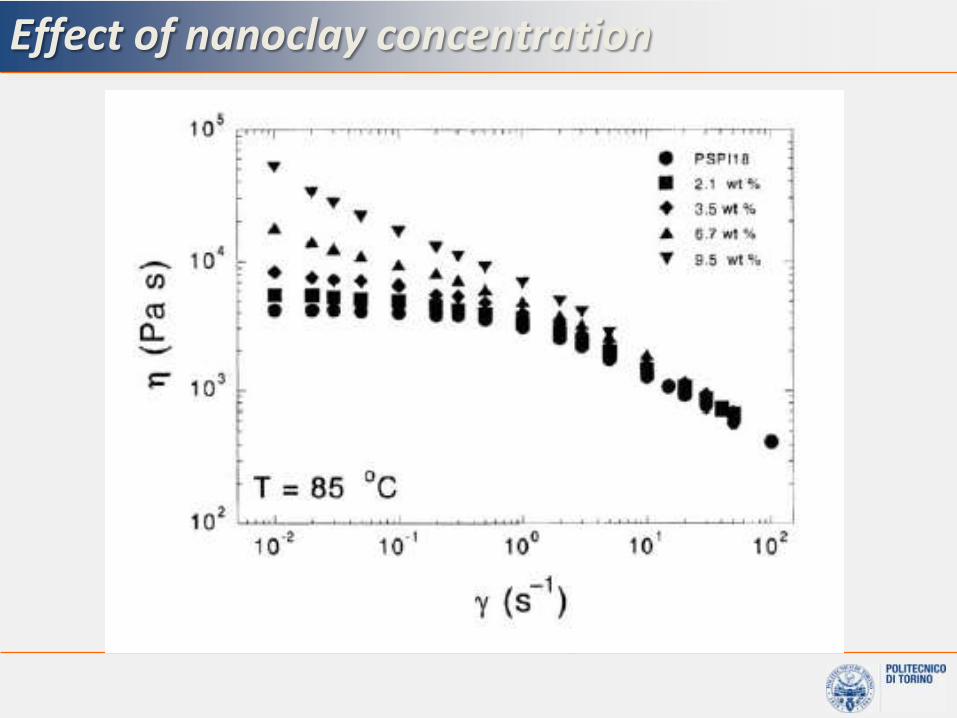
Effect of nanoclay concentration


Zero shear viscosity vs nanoclay

10-1
100
101
102
Nylon6N6C1.6N6C3.7
tan
101
102
103
104
105
G'G"
2 1
101
102
103
104
2 1
0.8
101
102
103
104
10-3
10-2
10-1
100
101
102
103
aTw/rad.s
-1
2 1
0.67
bTG
',b
TG
"/P
aCross over frequency wrel (tan ≅1)
(relaxation time 1/wrel)
G’~G”~w0.86
D = 1.5 *)
wrel
wrel
N6C1.6
Nylon6
N6C3.7
Tr=235oC
Martin E., Adolf D., Wilcoxon P., Phys. Rev. A39 1325 (1989)
500nm
Maiti P. Okamoto M, Macromole. Mater. Eng., 2003; 288, 440.

RheologyExtent of delamination of
platelets may be evaluated by the method developed by Wagener and Reisinger*:
= A ωn
Shear thinning exponent n is a semi-quantitative measure of the degree of exfoliation and
delamination
* R Wagener, TJG
Reisinger, Polymer 44 (2003) 7513-7518

Conclusions
Several characterisation techniques available forcharacterisation of nanoparticles dispersion•Direct vs indirect methods•Local vs surface vs bulk
Complememtarity of different metods requiresintegrated approach exploiting at least twodifferent techniques