part d prescription drug coverage in esrd patients
TRANSCRIPT
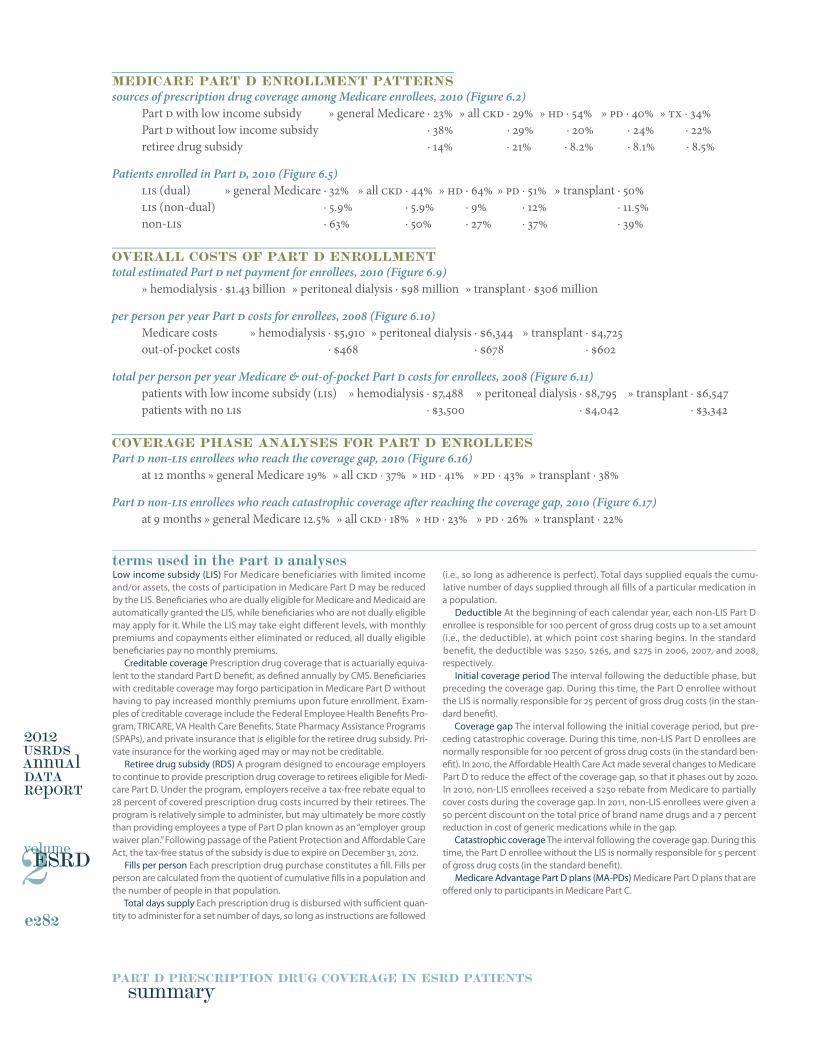
A B C D E F G H I J K L M N O
Bars
: Tot
al d
ays
supp
ly (i
n m
illio
ns)
0
10
20
30
40
Line
: Cum
ulat
ive
perc
ent o
f tot
al
0
20
40
60
80
General Medicare All CKD Hemodialysis Peritoneal dialysis Transplant
Percen
t
0
20
40
60
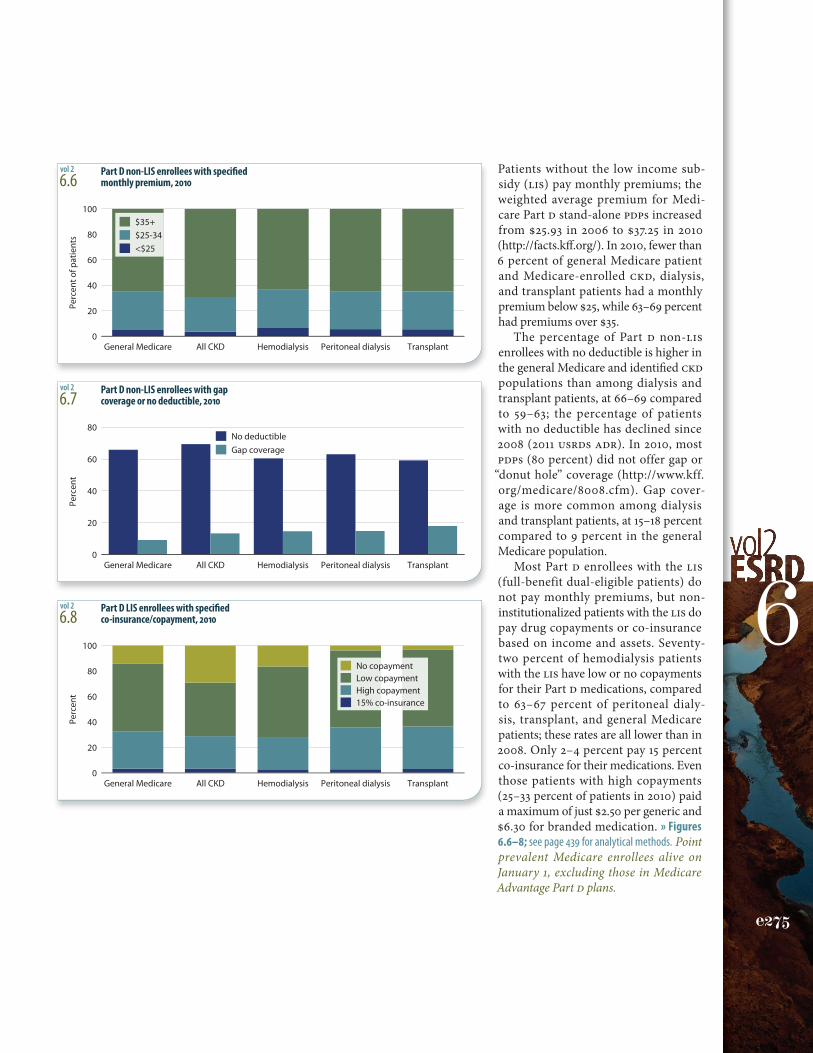
80No deductible Gap coverage
White Black/Af Am Asian Other
Expe
nditu
res ($
, in
1,00
0s)
0
2
4
6
8LISNo LIS
Gen Med All CKD HD PD Tx
Expe
nditu
res ($
, in
1,00
0s)
0
2
4
6
8
Medicare
Out-of-pocket (OOP)
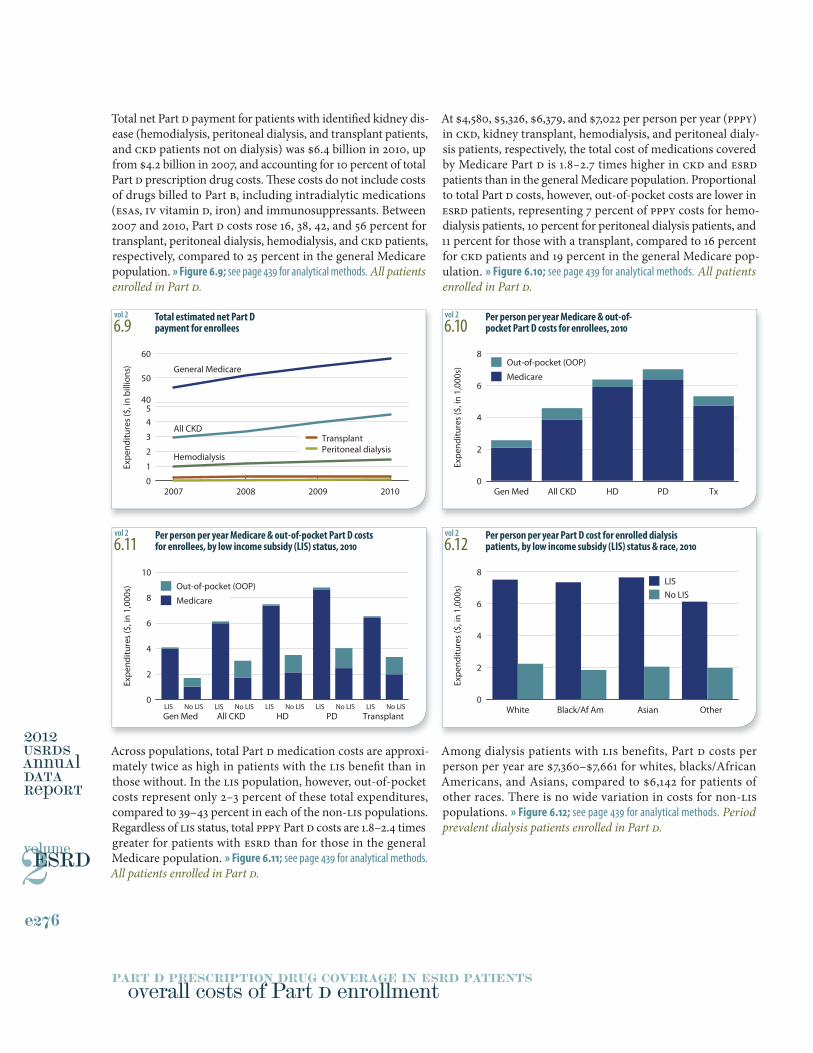
2007 2008 2009 2010
Expe
nditu
res (
$, in
bill
ions
)
0
1
2
3
45
40
50
60
General Medicare
All CKD
HemodialysisPeritoneal dialysisTransplant
Gen MedLIS LIS LIS LIS LISNo LIS No LIS No LIS No LIS No LIS
Expe
nditu
res
($, i
n 1,
000s
)
0
2
4
6
8
10
All CKD HD TransplantPD
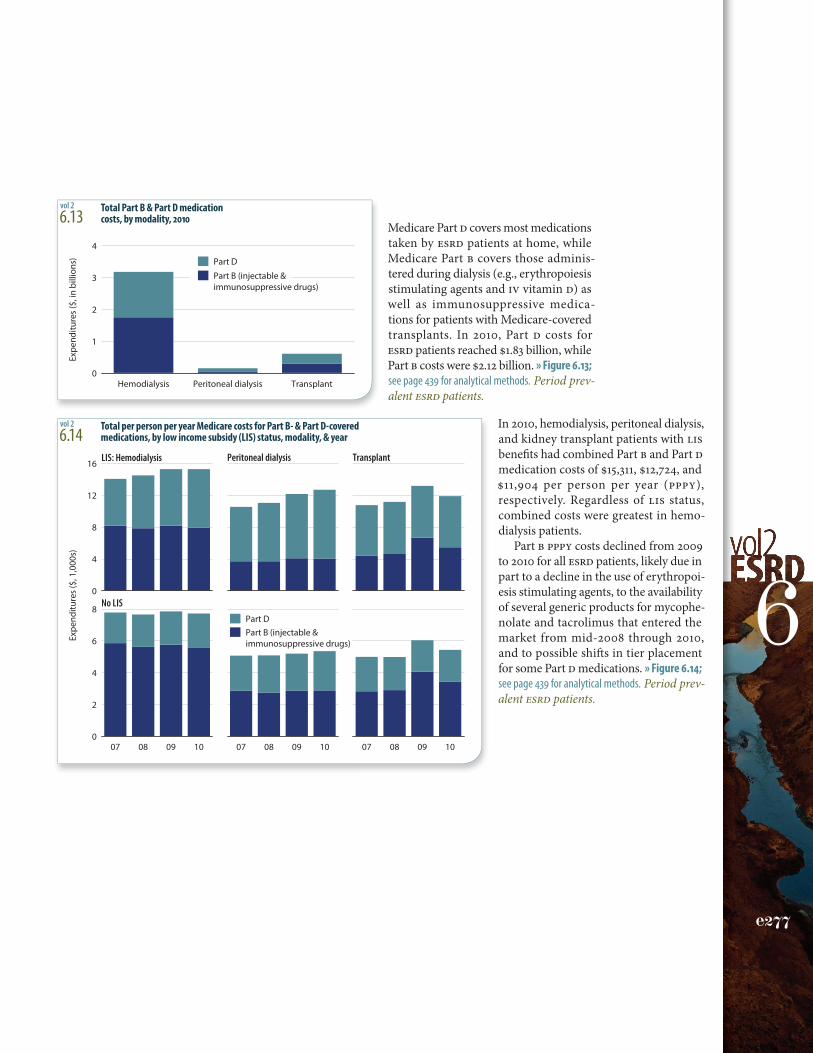
Medicare
Out-of-pocket (OOP)
Expe
nditu
res
($, 1
,000
s)
0
4
8
12
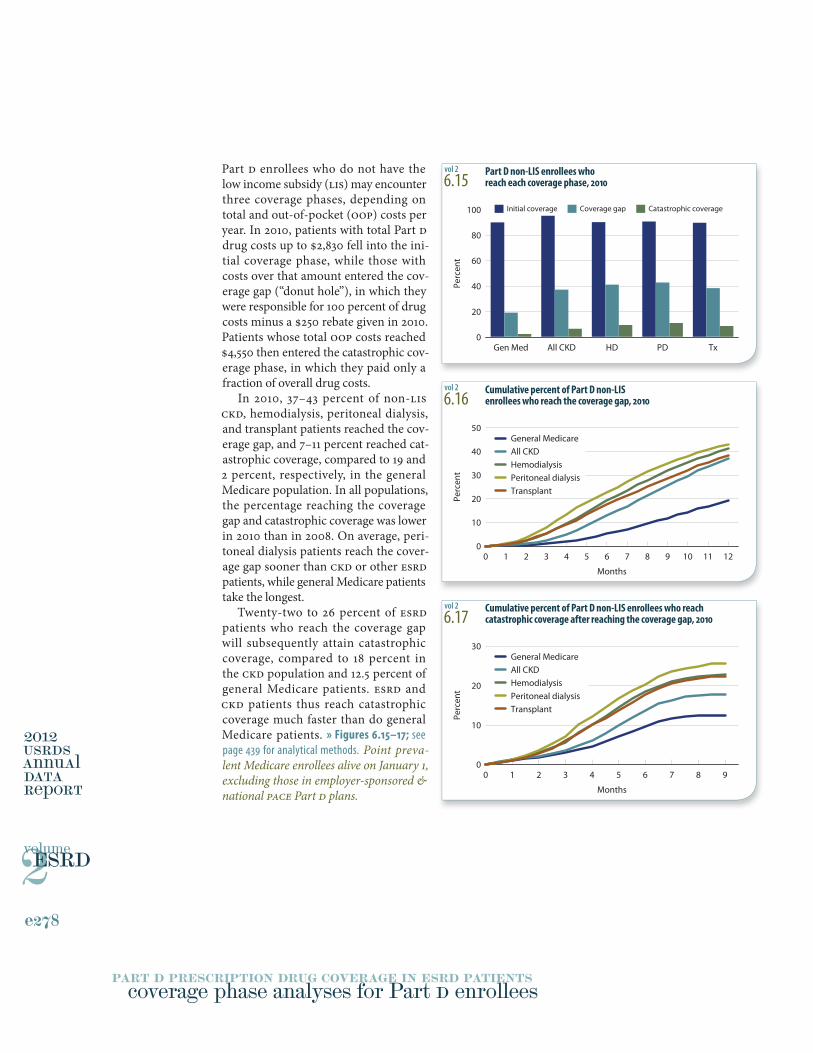
16LIS: Hemodialysis Peritoneal dialysis Transplant
07 08 09 100
2
4
6
8
07 08 09 10 07 08 09 10
Part B (injectable & immunosuppressive drugs)
Part D
No LIS
Expe
nditu
res (
$, in
bill
ions
)
0
1
2
3
Hemodialysis Peritoneal dialysis Transplant
4
Part B (injectable & immunosuppressive drugs)
Part D
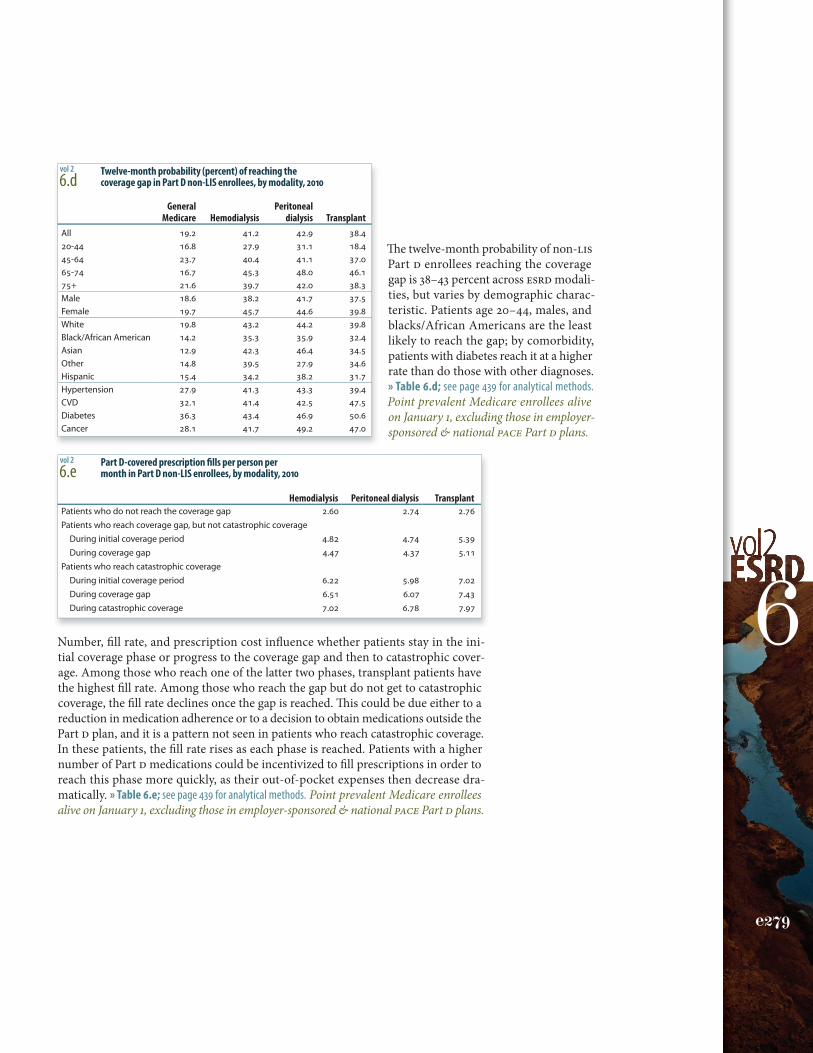
Gen Med All CKD HD PD Tx
Perc
ent
0
20
40
60
80
100 Initial coverage Coverage gap Catastrophic coverage
Months
0 1 2 3 4 5 6 7 8 9 10 11 12
Perc
ent
0
10
20
30
40
50General MedicareAll CKDHemodialysis Peritoneal dialysis Transplant
Months
0 1 2 3 4 5 6 7 8 9
Perc
ent
0
10
20
30General MedicareAll CKDHemodialysis Peritoneal dialysis Transplant
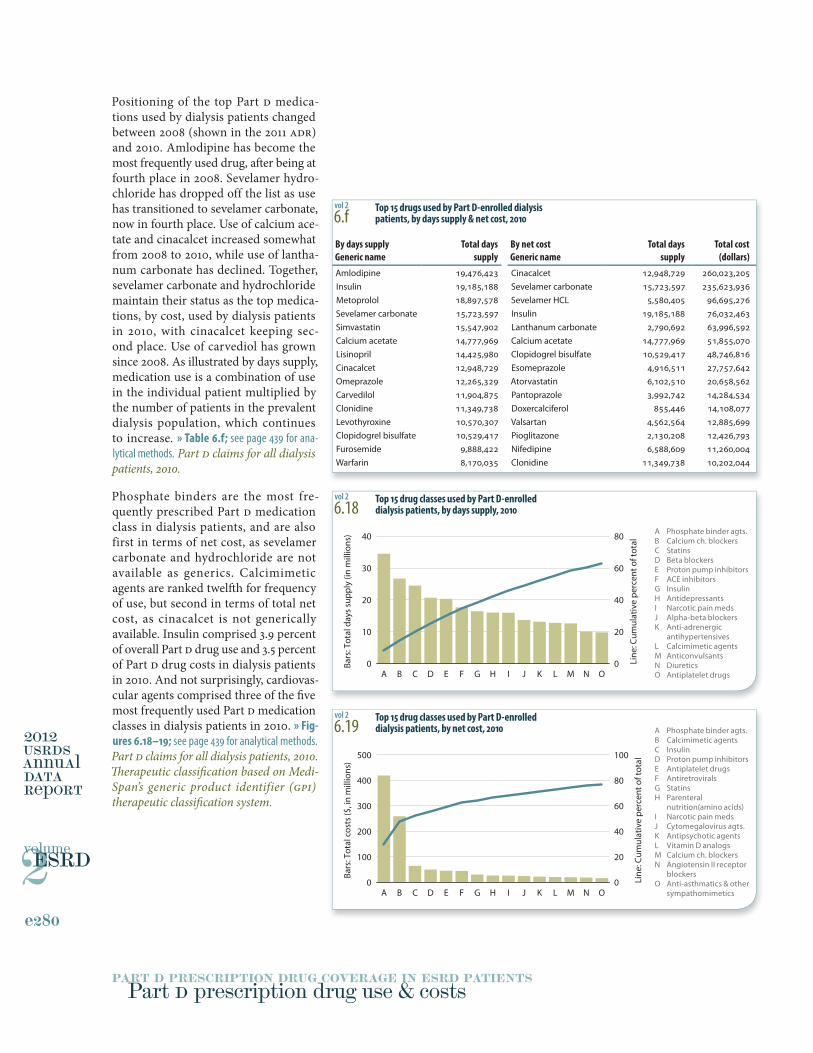
A B C D E F G H I J K L M N O
Bars
: Total
days supp
ly (in millions)
0
10
20
30
40
Line
: Cum
ulative pe
rcen
t of total
0
20
40
60
80
A B C D E F G H I J K L M N O
Bars
: Total
costs
($, in millions)
0
100
200
300
400
500
Line
: Cum
ulative pe
rcen
t of total
0
20
40
60
80
100
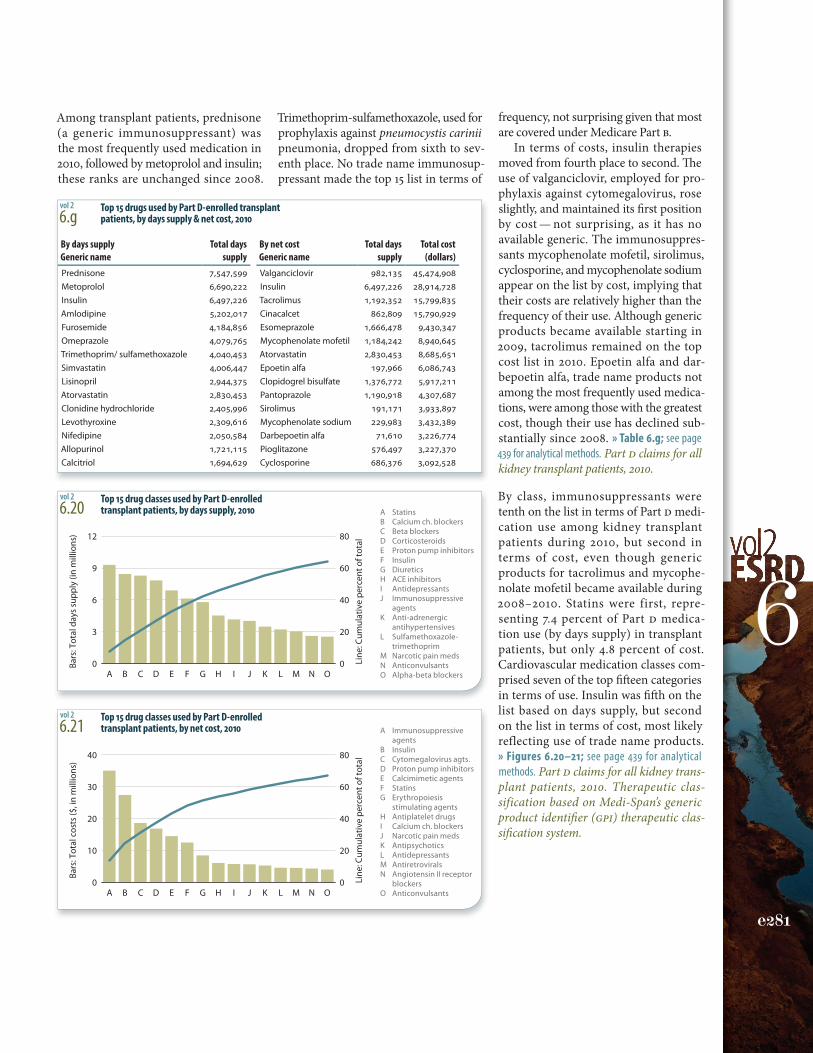
A B C D E F G H I J K L M N O
Bars
: Total
days supp
ly (in millions)
0
3
6
9
12
Line
: Cum
ulative pe
rcen
t of total
0
20
40
60
80
A B C D E F G H I J K L M N O
Bars
: Total
costs
($, in millions)
0
10
20
30
40
Line
: Cum
ulative pe
rcen
t of total
0
20
40
60
80