part d: sustainable future 30/50 - whangarei · part d: sustainable future 30/50 part d:...
TRANSCRIPT

Whangarei District Growth Strategy :117
PAR
T D:
SUSTA
INA
BLE FU
TUR
E 30/50
PART D: SUSTAINABLE FUTURE 30/50
Introduction1. Future Development Path1.1
Overview of Nodal Analysis1.2
Whangarei City2. Environment2.1
Society2.2
Culture2.3
Economy2.4
Infrastructure2.5
Summary2.6
Five Urban Villages3. Kamo3.1
Maunu3.2
Otaika3.3
Onerahi3.4
Tikipunga3.5
Satellite Town - 4. Marsden Point/ RuakakaEnvironment4.1
Society4.2
Culture4.3
Economy4.4
Infrastructure4.5
Summary4.6
Growth Nodes5. Hikurangi5.1
Waipu5.2
Parua Bay5.3
Rural Villages6. Maungatapere6.1
Maungakaramea6.2
Coastal Villages7. Matapouri7.1
McLeod Bay/Reotahi7.2
Ngunguru7.3
Oakura7.4
Pataua7.5
Taurikura/Urquharts Bay7.6
Tutukaka7.7
Waipu Cove/Langs Beach7.8
Rural/Coastal Area8. Rural Hamlets8.1
Coastal Hamlets8.2

118: Whangarei District Growth Strategy
PAR
T D
: SU
STA
INA
BLE
FU
TUR
E 30
/50
To effectively influence the spatial arrangement of land uses the District Plan must zone land in suitable locations and in appropriate amounts. This may be determined by prior structure planning. The release of new land must be carefully controlled and released in a staged manner so that undersupply or oversupply of land does not result in perverse distortions, either in land prices or location of development. It is preferable to have more capacity than undersupply as lack of capacity can increase the cost of land and constrain development.
The Growth Strategy provides critical information to enable effective land use planning. Section 1.2 of Part D contains an overview of the nodal analysis. Here, past and future population growth is analysed for each node along with growth in household numbers and household projections. Business floor area is analysed for each node along with future projections. Business land area is examined and future projections included. Employment growth is analysed and projections of future employment calculated.
Based on the above information, existing land capacity for both residential and business use is determined and, where existing capacity is exhausted, projections made for future land requirements. In calculating land capacity, both existing and future, two scenarios are outlined. The first is an unconstrained capacity based solely on land area; the second is a constrained capacity that takes into account a number of biophysical constraints on development. These include flood susceptibility, land instability and significant natural habitat. The ‘true’ or actual capacity will be between the two estimates. Further refinement through structure planning or detailed local analysis may be necessary to determine ‘true’ capacity.
One constraint that has not been modelled is productive land. The productivity of land can be related to soil fertility, but can also be related to the relative ease with which production based activities are carried out. In some cases, the presence of residential properties close to a productive unit can act as a constraint on production, as certain activities are phased out as residents object to effects. Such constraints are sometimes called ‘reverse sensitivity’ effects.
Some locations in the district are important because of the significant area of versatile land containing high quality soils, such as the volcanic soils around Maunu, Maungatapere, Maungakaramea, Three Mile Bush Road and Glenbervie. Others are important because they are relatively intact, such as the Hikurangi Basin. The productive capacity of these localities should be protected. Alternatively, some locations, despite the presence of high quality versatile soils, have been heavily compromised by development, especially in the last 15 years. In these locations, there may be difficulties in retaining the existing potential. These areas may be preferable locations for continued lifestyle development if demand exists.
Another factor related to the spatial distribution of land uses is the provision of infrastructure. The availability of infrastructure can be a key driver (or constraint) of future development. Infrastructure includes roads, water, wastewater, stormwater, parks and amenities like libraries, public toilets and community halls. Infrastructure also includes the availability of hospitals, schools, emergency services, police, and arts, cultural and civic amenities. Settlements across Whangarei District have varying levels of these services with urban areas tending to have more services, and small rural and coastal villages often having the least.
Growth in settlements with low levels of infrastructure provision can be more costly compared with settlements with high levels of existing infrastructure capacity. Some locations are growing faster than others, and demand for future services will be higher. Increasingly, some of the cost for providing new growth related infrastructure is provided by new users through development contributions. Locations with less numbers of users will have higher potential costs associated with new infrastructure provision than those areas with high numbers of users. Therefore, there are competing priorities for infrastructure provision. The Growth Strategy provides some direction to prioritise amongst these competing options for the provision of infrastructure over the next 30/50 years.
Introduction1. Part B of the Strategy, Sustainable District, examined a range of district wide issues. These were grouped under the four sustainability criteria (or well beings): sustainable environment (environmental well being), sustainable economy (economic well being), sustainable society (social well being), and sustainable culture (cultural well being). Based upon the issues examined in Part B, Part C of the Strategy, Future Development Path, assessed several development options for the district over the next 30/50 years. A preferred option, Sustainable Future 30/50, was identified.
This part of the Strategy (Part D) examines in more detail the preferred future development path for the district. It is structured, once again, around the four sustainability criteria or well beings, but does so at a nodal (or individual settlement) level. Each node is examined to determine its past and future growth rates, the economic factors that influence those growth rates, existing and future infrastructure needs, environmental constraints and opportunities, and the social and cultural implications surrounding all of the above. The boundaries of the nodes are based upon existing structure plans and, where structure plans do not exist, on the District Plan maps and Statistics New Zealand mesh blocks.
Each nodal analysis includes an examination of existing land availability for various uses including residential, rural/residential, commercial and industrial uses. Future land requirements for residential and business uses are identified based upon projected growth rates for each node. The projections for the three identified ‘growth nodes’ of Waipu, Parua Bay and Hikurangi, are based upon preferred level of growth rather than historical trends, whilst the other nodes use projections from Council’s Growth Model, based upon past growth as an indicator of future growth, together with recent subdivision and building activity.
The economic conditions and projections for the future that determine nodal growth and hence land requirements are analysed for each node. A business profile is developed which includes number of businesses, types of businesses, number of employees, types of employment, etc. An analysis of existing infrastructure is included along with projected infrastructure needs and indicative costings for the next 30/50 years. This includes water provision, wastewater disposal, stormwater, transportation and parks and reserves.
The environment of each node is examined to determine existing land use, water resources, natural hazard constraints, existing biodiversity, landscape and natural character values, ecosystem services and the implications of future climate change. The social and cultural infrastructure of each node is examined to determine present circumstances and future needs. This includes health, education and safety, sense of place and urban design features, arts, culture and civic amenities, historic and cultural heritage and tangata whenua interests.
All of the above analyses contribute to a comprehensive examination of the preferred future development path for the district over the next 30/50 years, and a detailed spatial plan for the future development path is derived from this analysis.
Strategic spatial plans are only effective if they are implemented rigorously and consistently. This relies upon a suite of land use planning techniques. Determining the spatial arrangement of land uses is fraught with difficulties unless these techniques are applied in a rigorous and consistent manner. In essence, they involve management of the land market to bring about desired, pre-determined outcomes. The usual method is through land use zoning and associated provisions in the District Plan. This process may well involve land use structure planning as a mediating step between the strategic spatial plan in the Growth Strategy and implementation through the District Plan. Structure plans have no statutory mandate and land uses shown on structure plans are indicative only.

Whangarei District Growth Strategy :119
PAR
T D:
SUSTA
INA
BLE FU
TUR
E 30/50
Sustainable Future 30/50Figure 94: Future Development Path1.1 The preferred future development path for the district is a five tier settlement pattern. This consists of Whangarei City as the primary district and regional urban centre with a strong, protected and enduring CBD; a satellite town at Marsden Point/Ruakaka which complements (but does not compete with) Whangarei City; five urban villages within greater Whangarei urban area; one rural and two coastal growth nodes; and two rural villages along with eight coastal villages (see Part C of the Strategy for a more detailed description). The Strategy also examines a number of small hamlets located in rural and coastal parts of the district. These hamlets are often a legacy of the past and have either declined in population or grown very slowly over time. A few have experienced recent growth. They are not examined in any detail, and are not part of the main settlement pattern, but they are included in the Strategy for completeness as part of the economic, social, cultural and historical fabric of the district.
Consolidation is a key theme of the Growth Strategy, with most identified future development occurring in proximity to existing urban areas that have the capacity to grow. The purpose of consolidation is to take advantage of existing assets, including council infrastructure, schools, medical facilities, and other services that may make future development more affordable and more sustainable over the longer term. There is also preference for avoiding development in areas that have high levels of constraints associated with them, and a preference for not exacerbating existing hazard risks and minimising future risks from climate change. There is also a priority to avoid continued scattered rural residential or lifestyle development on productive farm land and ribbon development along the coast and transport corridors. This approach is a deliberate shift from the present development path, in which much scattered, market driven development has taken place.
Despite similarities, consolidation is not the same as intensification. Intensification is development on existing residential/commercial/industrial land that increases the intensity of existing activities. For example, intensification of residential land involves redevelopment of that land to increase the number of residents per unit of land area. This may be achieved through infill development, building higher, or changes in housing style, e.g. detached villas to semidetached, or terraced housing. Intensification is seen as an important land use planning tool in cities, especially those with significant constraints on land availability. Whilst more intensive residential land use may be an attractive option in some settlements, most future development in Whangarei District is likely to occur on land that it is presently occupied with another land use, such as pastoral farming. There could be circumstances where increased residential intensification may be desirable in Whangarei City such as in the lower Town Basin area, the Avenues, or around service/shopping centres in the suburban nodes.
Future development options are, and will continue to be, influenced by past development. A substantial amount of recent land development has occurred outside of the urbanised area of our main settlements. This type of development is often considered lifestyle development, and has been very popular in many parts of the district. This has led to an oversupply of lifestyle lots in many parts of the district. There are estimated to be around 6,000 vacant lots across the district, many of these in rural and coastal areas. The existing availability of this number of vacant lots scattered across the district will impact on efforts to create a more consolidated settlement pattern for a considerable period of time. In addition, in some nodes there is a surplus of land already zoned for various uses. This too will impact on future efforts to consolidate development.
Therefore, a shift to a more consolidated settlement pattern will take time. Existing vacant lots will be taken up over time and existing surplus zoned land will be developed. In the meantime, consistent efforts need to be made to ensure future land development occurs in a carefully staged and managed manner that avoids continued scattered and ribbon development and, over time, results in a more rational and sustainable development pattern.

120: Whangarei District Growth Strategy
PAR
T D
: SU
STA
INA
BLE
FU
TUR
E 30
/50
The fastest growing rural and coastal villages between 1991 and 2006 were Pataua, Matapouri and Maungakaramea, while the greatest population increase was experienced in Maungakaramea, Ngunguru and Pataua. Oakura was the only village in which population declined (-7% or 24 people).
The fastest growing rural and coastal hamlets between 1991 and 2006 were Taiharuru, Teal Bay and Ruatangata, while the greatest population increase was experienced in Ruatangata, Mangapai and Taiharuru. Pipiwai, Whangaruru, Pakotai and Titoki were the only hamlets in which population declined (-24%, -18%, -5% and -2% respectively). The remaining hamlets experienced lower than average population growth between 1991 and 2006.
Population ProjectionsThe Growth Strategy is based on a population increase between 2006-2061 of around 55,000 people (1.35% per annum) with the district population reaching around 110,000 in 2041 and around 130,000 in 2061. Over half of this growth is expected to occur in the urban area (54%), with an addition of almost 30,000 people. Approximately 21% of the district’s growth is expected to occur in the Marsden Point/Ruakaka area with an addition of over 10,000 people. Appendix 1 contains population projections for five yearly intervals.
Population ProjectionsTable 49:
Settlement Type 30/50 Node 2006 2041 2061 2006 -2061 Growth
Total Growth
Growth % p.a.
% of District Growth
Whangarei City 14,298 18,562 22,038 7,740 54% 1.0% 14%Urban Villages Kamo 10,155 14,940 17,737 7,582 75% 1.4% 14%
Maunu 4,047 5,706 6,774 2,727 67% 1.2% 5%Onerahi 7,161 9,669 11,480 4,319 60% 1.1% 8%Otaika/Toetoe 5,091 6,826 8,104 3,013 59% 1.1% 5%Tikipunga 7,521 10,027 11,904 4,383 58% 1.1% 8%
Total 33,975 47,169 55,999 22,024 47% 1.2% 40%Satellite Town Marsden Point/
Ruakaka (high)3,108 10,378 14,587 11,479 369% 6.7% 21%
Growth Node Hikurangi 1,557 3,271 5,000 3,443 221% 4.0% 6%Parua Bay 1,068 2,852 5,000 3,932 368% 6.7% 7%Waipu 1,035 3,614 5,000 3,965 383% 7.0% 7%
Total 3,660 9,737 15,000 11,340 310% 5.6% 21%Rural Villages Maungakaramea 756 1,124 1,334 578 76% 1.4% 1%
Maungatapere 645 1,044 1,239 594 92% 1.7% 1%Total 1,401 2,168 2,573 1,172 84% 1.5% 2%Coastal Villages Matapouri 372 685 814 442 119% 2.2% 1%
McLeod Bay/Reotahi 627 956 1,135 508 81% 1.5% 1%Ngunguru 846 1,184 1,405 559 66% 1.2% 1%Oakura 345 704 836 491 142% 2.6% 1%Pataua 480 843 1,001 521 109% 2.0% 1%Taurikura/Urquharts Bay
339 717 895 556 164% 3.0% 1%
Tutukaka 756 1,457 1,730 974 129% 2.3% 2%Waipu Cove/Langs Beach
450 1,386 1,645 1,195 266% 4.8% 2%
Total 4,215 7,932 9,461 5,246 124% 2.3% 9%District Total 74,430 109,235 129,678 55,248 74% 1.3%
Overview of Nodal Analysis1.2
Population GrowthThe population of the district grew by 20% between 1991 and 2006, from 62,202 to 74,430. Around 40% of this growth occurred in the urban area (43%) adding 5,247 people, while over a third of the district’s growth (36%) occurred in the rural areas, adding 4,494 people. The remainder of the population growth occurred in the coastal areas (21%).
Between 1991 and 2006, Maunu grew the fastest of the urban villages (26%) adding 840 people, while Kamo experienced the greatest population increase of 1,791 people during this period. Otaika/Toetoe lagged well behind the district average with 4% growth, adding 174 people. Fifteen percent of the district’s population growth between 1991 and 2006 was in Kamo, and 10% was in Tikipunga.
Parua Bay was the fastest growing growth node, increasing 75% (456 people) between 1991 and 2006, while Hikurangi and Marsden Point/Ruakaka experienced below average growth (2% and 11% respectively) during the same period.
Population GrowthTable 48:
Settlement Type 30/50 Node 1991 2006 1991-2006 Growth
Total Growth
Growth % p.a.
% of District Growth
Whangarei City 13,422 14,298 876 7% 0.4% 7%Urban Villages Kamo 8,364 10,155 1,791 21% 1.4% 15%
Maunu 3,207 4,047 840 26% 1.7% 7%Onerahi 6,765 7,161 396 6% 0.4% 3%Otaika/Toetoe 4,917 5,091 174 4% 0.2% 1%Tikipunga 6,351 7,521 1,170 18% 1.2% 10%
Total 29,604 33,975 4,371 15% 1.0% 36%Satellite Town Marsden Point/Ruakaka 2,808 3,108 300 11% 0.7% 2%Growth Node Hikurangi 1,527 1,557 30 2% 0.1% 0%
Parua Bay 612 1,068 456 75% 5.0% 4%Waipu 783 1,035 252 32% 2.1% 2%
Total 2,922 3,660 738 25% 1.7% 6%Rural Villages Maungakaramea 429 756 327 76% 5.1% 3%
Maungatapere 444 645 201 45% 3.0% 2%Total 873 1,401 528 60% 4.0% 4%Coastal Villages Matapouri 198 372 174 88% 5.9% 1%
McLeod Bay/Reotahi 486 627 141 29% 1.9% 1%Ngunguru 552 846 294 53% 3.6% 2%Oakura 369 345 -24 -7% -0.4% 0%Pataua 234 480 246 105% 7.0% 2%Taurikura/Urquharts Bay 234 339 105 45% 3.0% 1%Tutukaka 570 756 186 33% 2.2% 2%Waipu Cove/Langs Beach
306 450 144 47% 3.1% 1%
Total 2,949 4,215 1,266 43% 2.9% 10%District Total 62,202 74,430 12,228 20% 1.3%
Source: Statistics New Zealand, 2006.

Whangarei District Growth Strategy :121
PAR
T D:
SUSTA
INA
BLE FU
TUR
E 30/50
Between 1991 and 2006, Maunu experienced the greatest growth in occupied dwellings with a growth rate of 36% (over 400 dwellings), while Kamo experienced the greatest increase in occupied dwellings with 870 additional dwellings during this period (30% growth). Otaika/Toetoe lagged well behind the district average with 9% growth, adding 132 dwellings. Fourteen percent of the district’s growth in occupied dwellings between 1991 and 2006 was in Kamo, 10% was in Tikipunga and 10% in Whangarei City.
Parua Bay was the fastest growing growth node, increasing 88% (180 dwellings) between 1991 and 2006, while Hikurangi and Marsden Point/Ruakaka experienced below average growth (17% and 22% respectively) during the same period.
The fastest growing rural and coastal villages between 1991 and 2006 were Maungakaramea and Pataua, while the greatest increase in occupied dwellings was experienced in Ngunguru, Maungakaramea, and Tutukaka. Oakura was the only village in which the number of occupied dwellings declined (-7% or 9 dwellings).
The fastest growing rural and coastal hamlets between 1991 and 2006 were Ruatangata, Teal Bay and Mangapai, while the greatest increase in occupied dwellings was experienced in Ruatangata, Mangapai and Taiharuru. Pakotai and Pipiwai were the only hamlets in which the number of occupied dwellings declined (-18, -12 respectively). The remaining hamlets experienced lower than average growth in occupied dwellings between 1991 and 2006.
Household ProjectionsThe Growth Strategy is based on an increase in occupied dwellings of around 20,000 dwellings (1.42% per annum) between 2006-2061, with the number of occupied dwellings in the district reaching around 40,000 in 2041 and around 50,000 in 2061. Household projections in Table 51 assume that present household size within each node remains constant over time. These projections can differ from projected population and household residential demand tables within each nodal analysis that assume broad household sizes of 2.5 people per household in 2041 and 2.4 people per household in 2061 in each node.
Over half of this increase in households is expected to occur in the urban villages (60%), with an addition of almost 12,000 dwellings. Approximately 25% of the district’s growth is expected to occur in the Marsden Point/Ruakaka area with an addition of around 5,000 dwellings. Between 2006 and 2061, of the urban villages, it is expected that Kamo will experience the greatest growth in occupied dwellings (79% or 1.4% per annum), with an increase of around 3,000 dwellings (or around 55 dwellings per year). Whangarei City is expected to experience the greatest increase in the number of occupied dwellings of over 3,000 dwellings (approximately 60 dwellings per year) during the same period.
Of the growth nodes, Waipu is expected to experience the greatest growth in occupied dwellings (7% per annum.), with an increase of over 1,500 dwellings (around 30 dwellings per year).
The fastest growing rural and coastal villages between 2006 and 2061 are expected to be Waipu Cove/ Langs Beach (4.6% per annum), Taurikura/Urquharts Bay (2.98% per annum), and Oakura (2.9% per annum). Waipu Cove/ Langs Beach and Tutukaka are expected to experience the greatest increase in the number of dwellings of approximately 10 dwellings per year.
It needs to be kept in mind that this analysis includes only occupied dwellings, i.e. permanently lived in houses. Holiday homes are not included. This is important in the coastal nodes where there are a higher number of holiday homes. Based on recent trends it is expected that around 100 holiday homes per annum will be added to coastal areas.
Between 2006 and 2061, of the urban villages, it is expected that Kamo will experience the greatest population growth (75% or 1.4% per annum), with an increase of around 7,500 people (or almost 140 people per year). Whangarei City is expected to experience the greatest population increase of almost 8,000 people (140 people per annum) over that time.
Of the growth nodes, Waipu is expected to experience the greatest population growth (7% per annum), with an increase of almost 4,000 people (approximately 70 people per year). The fastest growing rural and coastal villages between 2006 and 2061 are expected to be Waipu Cove/Langs Beach (4.8% per annum), Taurikura/Urquharts Bay (2.98% per annum), and Oakura (2.6% per annum). Waipu Cove/Langs Beach and Tutukaka are expected to experience the greatest population increase of around 20 people per year.
Household GrowthThe number of occupied dwellings in the district increased by almost 30% between 1991 and 2006, from 21,624 to 27,993. Nearly one half of this growth occurred in the urban area (49%) adding over 3,000 dwellings. Around 48% occurred in the rural and coastal areas, adding 3,030 dwellings. The remaining growth (3%) occurred in the Marsden Point/Ruakaka area with the addition of over 200 dwellings (15 dwellings per year).
Household GrowthTable 50:
Settlement Type 30/50 Node 1991 2006 2006 -2061 Growth
Total Growth
Growth % p.a.
% of District Growth
Whangarei City 5,262 5,871 609 12% 0.8% 10%Urban Villages Kamo 2,922 3,792 870 30% 2.0% 14%
Maunu 1,146 1,557 411 36% 2.4% 6%Onerahi 2,316 2,808 492 21% 1.4% 8%Otaika/Toetoe 1,512 1,644 132 9% 0.6% 2%Tikipunga 2,031 2,637 606 30% 2.0% 10%
Total 9,927 12,438 2,511 25% 1.7% 39%Satellite Town Marsden Point/Ruakaka 984 1,203 219 22% 1.5% 3%Growth Nodes Hikurangi 462 540 78 17% 1.1% 1%
Parua Bay 204 384 180 88% 5.9% 3%Waipu 282 429 147 52% 3.5% 2%
Total 948 1,353 405 43% 2.8% 6%Rural Villages Maungakaramea 141 291 150 106% 7.1% 2%
Maungatapere 132 222 90 68% 4.5% 1%Total 273 513 240 88% 5.9% 4%Coastal Villages Matapouri 96 153 57 59% 4.0% 1%
McLeod Bay/Reotahi 195 279 84 43% 2.9% 1%Ngunguru 207 360 153 74% 4.9% 2%Oakura 132 123 -9 -7% -0.5% 0%Pataua 90 183 93 103% 6.9% 1%Taurikura/Urquharts Bay 90 144 54 60% 4.0% 1%Tutukaka 228 339 111 49% 3.2% 2%Waipu Cove/Langs Beach
123 201 78 63% 4.2% 1%
Total 1,161 1,782 621 53% 3.6% 10%Total for District 21,624 27,993 6,369 29% 2.0%
Source: Statistics New Zealand, 2006.

122: Whangarei District Growth Strategy
PAR
T D
: SU
STA
INA
BLE
FU
TUR
E 30
/50
Business area in the rural and coastal villages is limited to the settlements of Maungatapere and Ngunguru. The floor area in Maungatapere increased by 75% (4,857m²), and by 6% in Ngunguru (16m²).
Growth in Business Floor Area (m²)Table 52:
Settlement Type 30/50 Node 1991 2006 1991-2006 Growth
Total Growth
Growth % p.a.
% of District Growth
Whangarei City 270,680 495,106 224,426 83% 5.5% 34%Urban Villages Kamo 25,871 45,238 19,367 75% 5.0% 3%
Maunu 365 534 169 46% 3.1% 0.0%Onerahi 16,807 23,702 6,895 41% 2.7% 1.1%Otaika/Toetoe 32,090 109,239 77,149 240% 16.0% 12%Tikipunga 3,355 9,505 6,150 183% 12.2% 0.9%
Total 78,488 188,218 109,730 140% 9.3% 17%Satellite Town Marsden Point/
Ruakaka23,612 326,497 302,885 1283% 85.5% 46%
Growth Node Hikurangi 13,210 20,628 7,418 56% 3.7% 1.1%Parua Bay 9 134 125 1389% 92.6% 0.0%Waipu 7,049 12,016 4,967 70% 4.7% 0.8%
Total 20,268 32,778 12,510 62% 4.1% 1.9%Rural Villages 6,507 11,364 4,857 75% 5.0% 0.7%Coastal Villages 283 299 16 6% 0.4% 0%Total for District 401,171 1,055,606 654,435 163% 10.9%
Source: Whangarei District Growth Model, 2008.
Business Floor Area ProjectionsThe Growth Strategy is based on an increase in business floor area of around 1.7 million m² (3.01% per annum) between 2006-2061, with the area of business floor area in the district reaching around 2.1 million m² in 2041 and around 2.8 million m² in 2061. Almost three-quarters of this growth is expected to occur in the Marsden Point/Ruakaka area (69%) with the addition of 1.2 million m² of business floor area (22,000m² per year). The remaining 30% growth of business floor area is expected to occur in the urban areas (27%) with the addition of 500,000m² (8,500m² per year).
Between 2006 and 2061, of the urban areas, it is expected that Otaika/Toetoe will experience the greatest growth in business floor area (80% or 1.45% per annum), with an increase of around 87,000m² of business floor area (or around 1,600m² per year). Whangarei City is expected to experience the greatest increase in business floor area of over 300,000m² (approximately 6,000m² per year) during the same period.
Of the growth nodes, Hikurangi is expected to experience the greatest growth in business floor area (3.7% per annum), with an increase of over 42,000m² (around 770m² per year). Increases are expected also in both Parua Bay and Waipu.
Household ProjectionsTable 51:
Settlement Type 30/50 Node 2006 2041 2061 2006 -2061 Growth
Total Growth
Growth % p.a.
% of District Growth
Whangarei City 5,871 7,625 9,102 3,231 55% 0.8% 17%Urban Villages Kamo 3,792 5,671 6,769 2,977 79% 2.0% 15%
Maunu 1,557 2,214 2,643 1,086 70% 2.4% 6%Onerahi 2,808 3,807 4,545 1,737 62% 1.4% 9%Otaika/Toetoe 1,644 2,242 2,676 1,032 63% 0.6% 5%Tikipunga 2,637 3,551 4,239 1,602 61% 2.0% 8%
Total 12,438 17,485 20,872 8,434 68% 1.7% 43%Satellite Town Marsden Point/
Ruakaka1,203 4,324 6,078 4,875 405% 1.5% 25%
Growth Nodes Hikurangi 540 1,135 1,734 1,194 221% 1.1% 6%Parua Bay 384 1,026 1,798 1,414 368% 5.9% 7%Waipu 429 1,498 2,072 1,643 383% 3.5% 8%
Total 1,353 3,658 5,604 4,251 314% 2.8% 22%Rural Villages Maungakaramea 291 438 523 232 80% 7.1% 1%
Maungatapere 222 376 449 227 102% 4.5% 1%Total 513 814 972 459 89% 5.9% 2%Coastal Villages Matapouri 153 283 338 185 121% 4.0% 1%
McLeod Bay/Reotahi 279 421 502 223 80% 2.9% 1%Ngunguru 360 503 600 240 67% 4.9% 1%Oakura 123 267 319 196 159% -0.5% 1%Pataua 183 330 394 211 115% 6.9% 1%Taurikura/Urquharts Bay
144 304 380 236 164% 4.0% 1%
Tutukaka 339 637 761 422 124% 3.2% 2%Waipu Cove/Langs Beach
201 594 709 508 253% 4.2% 3%
Total 1,782 3,340 4,003 2,221 125% 3.6% 11%Total for District 27,993 41,704 49785 21,789 78% 1.4%
Business Floor Area GrowthBusiness floor area increased by 163% between 1991 and 2006, from almost 500,000m² to over one million m² of business zoned floor area. Over half of this growth occurred in the urban area (51%), with an increase of almost 350,000m² of business floor area between 1991 and 2006. Just under half of the district business floor area growth occurred in the Marsden Point/Ruakaka area, with an increase of over 300,000m².
Between 1991 and 2006, Otaika/Toetoe grew the fastest of the urban villages (240%) adding 77,149m², while Whangarei City experienced the greatest business floor area increase of 224,426m² (83% growth) during this period. Maunu lagged well behind the district average with 46% growth, adding 169m². Thirty-four percent of the district’s business floor area growth between 1991 and 2006 was in Whangarei City, and 12% was in Otaika/Toetoe.
Parua Bay was the fastest growing growth node, increasing 1,389% (125m²) between 1991 and 2006, while Hikurangi and Waipu experienced below average growth (56% and 70% respectively) during the same period.

Whangarei District Growth Strategy :123
PAR
T D:
SUSTA
INA
BLE FU
TUR
E 30/50
Growth in Business Land (ha)Table 54:
Settlement Type
30/50 Node 1995 2010 1995-2010 Growth
Total Growth Growth % p.a.
% of District Growth
Whangarei City
349.44 348.54 -0.9 -0.3% 0.0% -0.2%
Urban Villages
Kamo 50.92 51.81 0.9 1.7% 0.1% 0.2%Maunu 0.30 5.32 5.0 1666.9% 111.1% 0.9%Onerahi 16.06 19.21 3.2 19.6% 1.3% 0.6%Otaika/Toetoe
93.24 135.82 42.6 45.7% 3.0% 7.9%
Tikipunga 3.61 22.64 19.0 526.5% 35.1% 3.5%Total 164.14 234.81 70.7 43.1% 2.9% 13.2%Satellite Town
Marsden Point/Ruakaka
247.58 715.99 468 189.2% 12.6% 87.2%
Growth Node Hikurangi 29.95 28.17 -1.8 -5.9% -0.4% -0.3%Parua Bay 2.31 2.31 0.0 -0.2% 0.0% 0.0%Waipu 8.87 9.15 0.3 3.1% 0.2% 0.1%
Total 41.14 39.63 -1.5 -3.7% -0.2% -0.3%Rural Villages
5.09 5.07 0.0 -0.4% 0.0% 0.0%
Coastal Villages
0.45 0.91 0.5 102.4% 6.8% 0.1%
Total for District
807.83 1,344.94 537 66% 4.4%
Source: Whangarei District Plan 1995-2010.
Business Land ProjectionsThe Growth Strategy is based on an increase in business zoned land area of around 700ha (1.98% per annum) between 2010 and 2061, with the area of business zoned land in the district reaching around 1,200ha in 2041 and around 1,400ha in 2061. Almost 40% of this growth is expected to occur in the urban villages, with an addition of 240ha (5ha per year). Of the remaining 70% growth in business land, 26% is expected to occur in the Whangarei City, 24% in the Marsden Point/Ruakaka area and 14% in the growth nodes. Those areas that have limited growth capacity are likely to expand into neighbouring areas. For example, Whangarei City is expected to require a further 180ha of business zoned land. This is likely to come from expanding into neighbouring urban villages such as Otaika/Toetoe area.
Between 2010 and 2061, of the urban villages, it is expected that Otaika/Toetoe will experience the greatest growth in business zoned land (128% or 2.5% per annum), with an increase of almost 200ha of business land (or over 3.4ha per year).
Of the growth nodes, Waipu is expected to experience the greatest growth in business zoned land (8.2% per annum), with an increase of almost 40ha, while Hikurangi is expected to experience the greatest increase in business zoned land of over 50ha (one ha per annum).
Note: Business land projections are based on the average employee density between 2001 and 2006 and employee projections. It assumes that the 2001-2006 average employee density will be maintained up to 2061, except for Marsden Point/Ruakaka, and that business land requirements will be proportional to employee growth.
Business Floor Area Projections (m²)Table 53:
Settlement Type
30/50 Node 2006 2041 2061 2006 -2061 Growth
Total Growth
Growth % p.a.
% of District Growth
Whangarei City 495,106 671,809 829,943 334,837 68% 1.2% 19%Urban Villages Kamo 45,238 61,383 73,644 28,406 63% 1.1% 1.6%
Maunu 534 725 893 359 67% 1.2% 0.0%Onerahi 23,702 32,161 38,900 15,198 64% 1.2% 0.9%Otaika/Toetoe 109,239 148,226 196,203 86,964 80% 1.4% 5%Tikipunga 9,505 12,897 16,229 6,724 71% 1.3% 0.4%
Total 188,218 255,392 325,869 137,651 73% 1.3% 8%Satellite Town Marsden Point/
Ruakaka326,497 1,088,095 1,529,403 1,202,906 368% 6.7% 69%
Growth Node Hikurangi 20,628 42,013 63,083 42,455 206% 3.7% 2.4%Parua Bay 134 244 345 211 157% 2.9% 0.0%Waipu 12,016 22,972 33,267 21,251 177% 3.2% 1.2%
Total 32,778 65,229 96,694 63,916 195% 3.5% 4%Rural Villages 11,364 15,420 18,793 7,429 65% 1.2% 0.4%Coastal Villages
299 406 465 166 56% 1.0% 0.0%
Total for District
1,055,606 2,096,350 2,801,168 1,747,619 166% 3.0%
Business Land GrowthBusiness zoned land increased by 66% between 1995 and 2010, from 800ha to 1,300ha. Over three-quarters of this growth occurred in the Marsden Point/Ruakaka area (87%), with an increase of 470ha of business zoned land between 1995 and 2010. The urban areas experienced 13% growth, with an increase of 70ha of business land during the same period.
Between 1995 and 2010, Maunu grew the fastest of the urban villages (1,700%) adding 5ha of business land, while Otaika/Toetoe experienced the greatest business land increase of 43ha (46% growth) during this period. Onerahi, Kamo and Whangarei City lagged well behind the district average with an average of 7% growth for these areas, adding a total of 3ha of business land between them.
Waipu was the fastest growing growth node, increasing 3% (0.3ha) of business land between 1995 and 2010, while Hikurangi and Parua Bay experienced a decrease in business zoned land during the same period.
Business area in the rural and coastal villages is limited to the settlements of Maungatapere, Ngunguru and McLeod Bay. The business land in the rural and coastal villages did not experience any increase between 1995 and 2010.

124: Whangarei District Growth Strategy
PAR
T D
: SU
STA
INA
BLE
FU
TUR
E 30
/50
Employment Growth by Workplace Address (Salary and Wage Earners)Table 56:
Settlement Type 30/50 Node 2001 2006 2001-2006 Growth
Total Growth
Growth % p.a.
% of District Growth
Whangarei City 10,257 11,955 1,698 17% 3.3% 56%Urban Villages Kamo 1,803 1,896 93 5% 1.0% 3%
Maunu 1,653 1,719 66 4% 0.8% 2.2%Onerahi 642 708 66 10% 2.1% 2.2%Otaika/Toetoe 1,062 1,383 321 30% 6.0% 11%Tikipunga 945 972 27 3% 0.6% 0.9%
Total 6,105 6,678 573 9% 1.9% 19%Satellite Town Marsden Point/Ruakaka 774 1,071 297 38% 7.7% 10%Growth Node Hikurangi 204 216 12 6% 1.2% 0.4%
Parua Bay 195 204 9 5% 0.9% 0.3%Waipu 336 384 48 14% 2.9% 1.6%
Total 735 804 69 9% 1.9% 2.3%Rural Villages Maungakaramea 147 156 9 6% 1.2% 0%
Maungatapere 150 126 -24 -16% -3.2% -1%Total 297 282 -15 -5% -1.0% -0.5%Coastal Villages Matapouri 36 60 24 67% 13.3% 1%
McLeod Bay/Reotahi 63 57 -6 -10% -1.9% 0%Ngunguru 66 75 9 14% 2.7% 0%Oakura 42 42 0 0% 0.0% 0%Pataua 48 66 18 38% 7.5% 1%Taurikura/Urquharts Bay 54 51 -3 -6% -1.1% 0%Tutukaka 135 174 39 29% 5.8% 1%Waipu Cove/Langs Beach
66 123 57 86% 17.3% 2%
Total 510 648 138 27% 5.4% 4.6%Total for District 21,405 24,423 3,018 14% 2.8%
Source: Statistics New Zealand, 2006.
Employment ProjectionsThe employment projections are based on the ratio of the resident to workforce population. The employment projections used in the Growth Strategy show even stronger levels of concentration than the population projections, with 68% of the anticipated job growth in the Whangarei urban area, and a third of employment growth in the satellite town and growth nodes.
The Growth Strategy is based on employment increase between 2006-2061 of around 17,000 people (1.29% per annum) with the district employment population reaching around 35,000 in 2041 and around 42,000 in 2061. Over half of this growth is expected to occur in the Whangarei urban area (68%), with an addition of almost 12,000 employees. Approximately 17% of the district’s employment growth is expected to occur in the Marsden Point/Ruakaka area with an addition of around 3,000 employees.
Between 2006 and 2061, of the urban villages, it is expected that the Otaika/Toetoe area will experience the greatest employment growth (178% or 3.2% per annum), with an increase of around 2,500 employees (or around 45 employees per year). Whangarei City is expected to experience the greatest employment increase of around 5,000 employees (approximately 90 employees per annum) during the same period. Of the growth nodes, Waipu is expected to
Business Land Projections (ha)Table 55:
Settlement Type 30/50 Node 2010 2041 2061 2010 -2061 Growth
Total Growth
Growth % p.a.
% of District Growth
Whangarei City 348.54 446.97 530.67 182 52% 1.0% 28%Urban Villages Kamo 51.81 73.49 87.25 35 68% 1.3% 5.5%
Maunu 5.32 10.13 12.03 7 126% 2.5% 1.0%Onerahi 19.21 24.01 28.50 9 48% 0.9% 1.4%Otaika/Toetoe 135.82 260.63 309.43 174 128% 2.5% 27%Tikipunga 22.64 31.76 37.56 15 66% 1.3% 2.3%
Total 234.81 400.02 474.77 240 102% 2.0% 37%Satellite Town Marsden Point/
Ruakaka*63** 165 233 170 269% 5.3% 26%
Growth Node Hikurangi 28.17 53.11 81.18 53 188% 3.7% 8.3%Parua Bay 2.31 6.53 11.45 9 396% 7.8% 1.4%Waipu 9.15 34.35 47.53 38 420% 8.2% 6.0%
Total 39.63 93.99 140.16 101 254% 5.0% 16%Rural Villages 5.07 8.74 10.32 5 104% 2.0% 0.8%Coastal Villages 0.91 1.29 1.52 0.6 67% 1.3% 0.1%Total for District 691.95 1,116.46 1,389.97 698 100.9% 1.98%
* Marsden Point/Ruakaka business land area projections are based on an employee density ratio of 17 people per ha.
** The 2010 business land area for Marsden Point/Ruakaka is based on an employee density of 17 people per ha.
Employment GrowthEmployment, by workplace address, in the Whangarei District grew by 14% between 2001 and 2006, from 21,405 to 24,423. Three-quarters of this growth occurred in the urban areas (75%) with the addition of over 2,000 employees. Over 15% of employment growth occurred in the rural areas, and 10% occurred in Marsden Point/Ruakaka.
Between 2001 and 2006, Otaika/Toetoe grew the fastest of the urban villages (30%) adding 320 employees, while Whangarei City experienced the greatest work force increase of almost 1,700 employees. Tikipunga, Kamo and Maunu lagged well behind the district average with less than 5% employment growth.
Waipu was the fastest growing growth node, increasing 14% (50 employees) between 2001 and 2006, while Hikurangi and Parua Bay experienced below average growth (5% and 6% respectively) during the same period.
The fastest growing rural and coastal villages between 2001 and 2006 were Waipu Cove/Langs Beach, Matapouri and Pataua, while the greatest increase in employees was experienced in Waipu Cove/Langs Beach, Tutukaka and Matapouri. Maungatapere, McLeod Bay/Reotahi and Taurikura/Urquharts Bay experienced a decline in the number of employees.
The greatest employment increase in the rural and coastal hamlets between 2001 and 2006 was in Portland, Whananaki, Waiotira and Whangaruru, with the remaining rural and coastal hamlets experiencing a decline in employment levels.

Whangarei District Growth Strategy :125
PAR
T D:
SUSTA
INA
BLE FU
TUR
E 30/50
years of population capacity currently available within the coastal and rural villages, growth nodes and hamlets.
For the urban villages, Maunu and Tikipunga have over 200 years of supply based on the structure plan scenario. Whangarei City is expected to exhaust its capacity earlier than the other urban villages, within the next 20 years.
Given the potential at Marsden Point/Ruakaka, and the low population growth, the area is not expected to exhaust its maximum population capacity under the structure plan within the next 212 years.
Maximum Residential Population CapacityTable 58:
Maximum Residential Population Capacity 2061 Projected Residential Population
Projected Years until all Capacity Exhausted under Structure Plan
Settlement Type 30/50 Node Current (2006 Census)
Current + Vacant
District Plan
Structure Plan
Whangarei City 14,186 14,551 17,031 17,031 21,865 20Urban Villages Kamo 7,321 7,880 12,547 17,185 14,190 75
Maunu 3,196 3,551 7,027 13,152 5,758 213Onerahi 6,405 6,717 8,567 8,868 10,561 31Otaika/Toetoe 4,539 4,692 8,007 8,119 7,456 65Tikipunga 5,876 6,152 13,176 23,616 10,000 229
Total 27,336 28,992 49,323 70,940 47,964 48Satellite Town Marsden Point/Ruakaka 2,441 3,951 8,756 40,162 11,456 212Growth Nodes Hikurangi 935 988 2,538 2,538 3,750 33
Parua Bay 453 645 2,174 3,267 3,750 49Waipu 546 738 2,011 3,029 3,750 41
Total 1,599 2,019 6,374 8,772 10,500 30Rural Villages Maungakaramea 92 102 351 351 534 34
Maungatapere 45 52 217 217 310 37Total 137 154 568 568 843 19Coastal Villages Matapouri 238 432 1,336 1,361 570 194
McLeod Bay/Reotahi 539 758 1,724 2,612 1,022 240Ngunguru 628 782 1,779 1,734 1,124 120Oakura 213 367 980 1,043 627 111Pataua 213 234 541 1,679 701 163Taurikura/Urquharts Bay 200 313 1,461 1,494 627 176Tutukaka 589 901 2,709 5,610 1,470 329Waipu Cove/Langs Beach 263 580 1,815 2,543 1,119 148
Total 2,883 4,366 12,344 18,075 7,258 76Total for District 49,354 54,943 95,307 156,458 100,449 112
Constrained population capacity of the Whangarei District is based on the maximum number of residents possible, having regard to environmental and physical constraints (flooding, land stability, mining subsidence and indigenous vegetation), under several scenarios - building on vacant properties, developing all properties to 75% of their minimum residential lot size (Living 1, 2, and 3) under the District Plan, and developing all properties to 75% of their minimum residential lot size under the existing structure plan (where there is one). Under these scenarios, the potential year that capacity may be reached or exhausted is calculated based on population
experience the greatest employment growth (7% per annum), with an increase of almost 2,500 people (approximately 30 people per year).
The fastest growing rural and coastal villages between 2006 and 2061 are expected to be Waipu Cove/Langs Beach (3% per annum), Taurikura/Urquharts Bay (2.9% per annum), and Oakura (2.3% per annum). Waipu Cove/Langs Beach and Tutukaka are expected to experience the greatest employment increase of around four employees per year.
Employment Projections by Workplace Address (Wage and Salary Earners)Table 57:
Settlement Type 30/50 Node 2006 2041 2061 2006 -2061 Growth
Total Growth
Growth % p.a.
% of District Growth
Whangarei City 11,955 14,286 16,961 5,006 42% 0.8% 29%Urban Villages Kamo 1,896 2,623 3,114 1,218 64% 1.2% 7%
Maunu 1,719 3,215 3,816 2,097 122% 2.2% 12%Onerahi 708 814 966 258 36% 0.7% 1%Otaika/Toetoe 1,383 3,235 3,840 2,457 178% 3.2% 14%Tikipunga 972 1,349 1,596 624 64% 1.2% 4%
Total 6,678 11,236 13,333 6,655 100% 1.8% 39%Satellite Town Marsden Point/
Ruakaka1,071 2,813 3,953 2,882 269% 4.9% 17%
Growth Nodes Hikurangi 216 396 605 389 180% 3.3% 2%Parua Bay 204 563 987 783 384% 7.0% 5%Waipu 384 1,357 1,878 1,494 389% 7.1% 9%
Total 804 2,316 3,470 2,666 332% 6.0% 15%Rural Villages Maungakaramea 156 249 295 139 89% 1.6% 1%
Maungatapere 126 238 280 154 123% 2.2% 1%Total 282 486 576 294 104% 1.9% 2%Coastal Villages Matapouri 60 90 112 52 87% 1.6% 0%
McLeod Bay/Reotahi 57 91 108 51 89% 1.6% 0%Ngunguru 75 87 101 26 35% 0.6% 0%Oakura 42 76 96 54 129% 2.3% 0%Pataua 66 107 127 61 93% 1.7% 0%Taurikura/Urquharts Bay
51 107 133 82 161% 2.9% 0%
Tutukaka 174 254 343 169 97% 1.8% 1%Waipu Cove/Langs Beach
123 204 327 204 166% 3.0% 1%
Total 648 1,016 1,349 701 108% 2.0% 4%Total for District 24,423 34,971 41,660 17,237 71% 1.3%
Population Capacity AnalysisUnconstrained population capacity of the Whangarei District is based on the maximum number of residents possible under several scenarios – building on vacant properties, developing all properties to 75% of their minimum residential lot size (Living 1, 2, and 3) under the District Plan, and developing all properties to 75% of their minimum residential lot size under the existing structure plan (where there is one). Seventy-five percent of a property’s land area is considered available to be subdivided, based on the average building coverage rules in the District Plan, and allowing for shared access, accessways, and reserve contributions.
Under these scenarios, the potential year that capacity may be reached or exhausted is calculated based on population projections. The district as a whole is expected to reach capacity under the District Plan (and structure plan if one exists) within the next 100 years, with between 20 to 240

126: Whangarei District Growth Strategy
PAR
T D
: SU
STA
INA
BLE
FU
TUR
E 30
/50
Location of Business Zoned Land in the Whangarei DistrictFigure 95: projections. The district as a whole is expected to reach constrained capacity by 2061, with between 1 to 120 years of population capacity within the coastal and rural villages, growth nodes and hamlets.
For the urban villages, Tikipunga and Maunu have around 100 years of supply left based on the structure plan scenario and environmental and physical constraints. Given the composition of natural hazards in Onerahi, Otaika/Toetoe and Whangarei City, and that they have been thoroughly mapped for natural hazards, these areas are expected to exhaust their population capacities within the near to medium term.
Given the potential for development at Marsden Point/Ruakaka, and the low population growth, the area is expected to exhaust its constrained maximum population capacity under the structure plan within the next 110 years.
Constrained Residential Population CapacityTable 59:
Maximum Residential Population Capacity 2061 Projected Residential Population
Projected Years until all Capacity Exhausted under Structure Plan
Settlement Type 30/50 Node Current (2006 Census)
Current + Vacant
District Plan
Structure Plan
Whangarei City 14,186 14,448 14,448 14,448 21,865 3Urban Villages Kamo 7,321 7,736 8,640 12,147 14,190 35
Maunu 3,196 3,508 3,776 7,469 5,758 90Onerahi 6,405 6,580 6,580 6,580 10,561 2Otaika/Toetoe 4,539 4,594 4,594 4,594 7,456 1Tikipunga 5,876 6,001 7,608 13,780 10,000 102
Total 27,336 28,418 31,197 44,570 47,964 20Satellite Town Marsden Point/
Ruakaka2,441 3,790 4,804 22,136 11,456 111
Growth Nodes Hikurangi 935 971 1,557 1,557 3,750 14Parua Bay 453 640 1,298 1,894 3,750 27Waipu 542 717 1,035 2,566 3,750 33
Total 1,599 1,997 3,889 5,829 10,500 30Rural Villages Maungakaramea 92 102 187 187 534 14
Maungatapere 45 52 134 134 310 21Total 137 154 322 336 843 19Coastal Villages Matapouri 238 399 784 919 570 114
McLeod Bay/Reotahi
539 722 906 1,622 1,022 122
Ngunguru 628 770 878 1,076 1,124 48Oakura 213 357 338 539 627 38Pataua 213 227 261 654 701 46Taurikura/Urquharts Bay
200 282 477 798 627 77
Tutukaka 589 858 1,237 1,585 1,470 57Waipu Cove/Langs Beach
263 551 1,043 1,863 1,119 100
Total 2,883 4,165 5,925 9,056 7,258 76Total for District 49,354 53,875 62,705 98,543 100,449 51

Whangarei District Growth Strategy :127
PAR
T D:
SUSTA
INA
BLE FU
TUR
E 30/50
Whangarei CityFigure 96: Whangarei City2. Whangarei City is the heart of the district, in terms of both people and wider commercial opportunities. Most parts of the district are within 30 minutes driving time of the City centre, and this has led to a wide range of services and job opportunities in the central business areas. Whangarei is also the key commercial, service and cultural centre for Northland. Whangarei is reasonably close (less that 100km) to other Northland population centres, including Kerikeri, Dargaville, Kaikohe, Russell, Paihia, and Mangawhai.
In 2006, approximately 14,300 people lived within the Whangarei City boundaries, in diverse suburbs such as Morningside, the Avenues, Regent, Kensington, Mairtown, the Town Basin and Otangarei. The population is projected to increase to around 22,000 people by 2061. Most of this population will be accommodated within the present City boundaries, mainly in areas of redevelopment. Some will likely overspill into neighbouring nodes. The total land area of the node is 1,825ha. Of this, 679ha is zoned residential, and 349ha is zoned business.
Environment2.1
Land UseGiven the urban context, the major land uses in the area are residential (34%), industrial (21.5%) and some forestry (10%). Commercial uses occupy 5% of the land area. Whangarei City is located within three main catchment areas: the Hatea, Waiarohia and Whangarei South Catchment areas. Of the three, the Hatea Catchment area has the most mixed land uses, with considerable areas of indigenous bush and forestry (mainly in the upper parts of the catchment located outside of Whangarei City), lifestyle blocks and limited pastoral land use in the middle segments, and residential and commercial uses in the lower catchment.
The Waiarohia Catchment area rises in the Pukenui Forest, flows through Council water reserves and lifestyle blocks, and then through residential and commercial areas in its lower catchment. The Whangarei South Catchment rises in a small patch of indigenous and exotic forest in the upper parts, moves into residential areas in the middle catchment, then some industrial and commercial areas in the lower catchment.
Water ResourcesWaterways are important in urban Whangarei, with many different streams flowing through Whangarei City. Most of the waterways passing through the City centre have their source in other nodes, although a couple of small streams rise on Parihaka within Whangarei City. The Hatea River, Waiarohia Stream, and Raumanga Stream are the most notable of these waterways. Other small streams that flow into the area include the Wharowharo Stream, Kirikiri Stream, and other small streamlets emerging from Pukenui Forest. The waterways form a length of about 23km, with substantial tidal sections for some streams.
These waterways should be an asset to the City but at present they are largely ignored except as a drainage network. The section of the Waiarohia Stream through Cafler Park illustrates the potential of these streams to contribute to the amenity, ecological, social and cultural values of the City and to its sense of place as a water-based settlement. The streams flowing through the City should act as ‘green/blue’ corridors through the urban fabric. To achieve this, water quality and riparian margins need to be improved. Community groups have been involved in riparian plantings along some of the streams, but Council needs to take a leading role in providing a strategic direction for incorporating the waterways into the City landscape.

128: Whangarei District Growth Strategy
PAR
T D
: SU
STA
INA
BLE
FU
TUR
E 30
/50
are indicated as habitat for remnant populations of kiwi. The Waiarohia Streamcare Group, Whau Valley Landcare Group, and the Pukenui Trust all operate in the area.
Whangarei Harbour is a particularly important habitat and breeding site for wading birds, including the nationally critical Fairy Tern and White Heron, and the mangrove forests and coastal forests bordering the harbour act as important buffers from land use activities.
Around 448ha or 25% of the nodal area is formally protected by Department of Conservation reserve, Council reserve, esplanade reserve or private covenanting. This includes 186ha (75%) of PNA areas (areas of ecological significance). Fifty-two percent of the total node area (951ha) is classified as acutely or chronically threatened (<20% indigenous vegetation cover remaining). A break down of acutely and chronically threatened environments within the PNAs, and the amount and type of formal protection in these is shown in Table 60.
Significant Natural Areas and Formal Protection of These Within Acutely and Table 60: Chronically Threatened Environments
Area of PNA within Acutely or Chronically Threatened Environment (ha)
Area of Formal Protection within Area of PNA that is Acutely or Chronically Threatened (ha)Conservation Covenant
QEII Esplanade DoC WDC Park/ Reserve
Total (ha) Proportion Protected
2.05 0.04 0.40 0.44 21%
Source: Whangarei District Council, Department of Conservation, Land Environments New Zealand.
Landscape/Natural CharacterWhangarei City is generally regarded as an urban landscape. However, some parts of the City are highly regarded landscapes, with notable landscape as identified in the District Plan (Landscape Sensitivity 6) around Parihaka and Pukenui forming about 16% of the City’s area.
Parihaka and the Pukenui/Western Hills provide a striking and dominant native bush backdrop to the City. These hills are a vital part of the City’s identity, and all the more important because their cover of indigenous vegetation is virtually continuous and unbroken by buildings, contributing to a high degree of naturalness. There are few places in the City where they cannot be seen, even in the commercial centre. Because of this visibility, they are extremely sensitive to any changes.
The landscape of Parihaka also holds strong cultural/historical values, as it was the location of the largest defensible pa site in New Zealand, and is a site of significance to Maori. Parihaka is also identified as being an area of high natural character.
Ecosystem ServicesWith its high population and heavily modified urban landscape, Whangarei City would generally be a consumer of ecosystem services, rather than a provider/generator. However, the forested hills around Whangarei City play key roles in providing a range of services including water quality and quantity provision, natural hazard regulation (especially, but not limited to, flooding), air quality regulation, erosion regulation, and pest regulation.
Over the future, the influence on air pollution is a key service, especially with an increased population density, but also with more commercial enterprises and traffic movements projected. Changes in population density, and possible reduction in some lot sizes, would mean that Council parks will play a more prominent role in generating ecosystem services.
Air QualityAir quality in Whangarei is generally good, thanks in part to prevailing south westerly winds, and limited heavy industry. However, the City has been highlighted as an area where pollutant levels may come close to, or even exceed, national standards for air quality at times (an ‘airshed’). The main contributors to air pollution in the area are vehicle emissions and smoke from domestic fires; the main form of air pollution is PM10 (particulate matter smaller than 10 microns in size and able to enter the human respiratory system). High levels of this pollutant can impact upon people’s health, causing respiratory problems and illness.
Under government regulations, if an air quality standard is breached within an airshed, the regional authority must develop a path to compliance by 2013. If the standard is breached after this time, no new air discharge consents for that pollutant may be granted. The standard for PM10 has been exceeded once in Whangarei in 2006. Over the next 30/50 years, additional development in the Whangarei urban area could mean that the standards are exceeded more frequently. This may have implications for managing growth over the longer term, including residential and industrial expansion. It does not appear to be a serious constraint, but careful management of air emissions, including domestic, vehicle, and industry sources may be required.
Natural HazardsNatural hazards are an important feature of Whangarei City, both in terms of area coverage, and in the number of parcels of land affected. In land area terms, approximately 466ha or 26% of the nodal land area is regarded as flood susceptible. Approximately 34% of the total number of land parcels are regarded as fully or partially flood susceptible. Much of this is close to the main commercial and industrial areas, with only a small area being located near residential land use. However, some locations highlighted for future residential development are located in flood susceptible areas.
A larger area of land, mainly on the surrounding hill slopes, is classified as having a high risk of land instability, totalling 637ha or 35% of the land area within the node. However, the proportion of total land parcels within unstable areas is lower at 28%. This is due to some of this land being within indigenous habitat reserves, together with large residential lots on other unstable areas. A smaller amount of land is erosion prone, around 255ha (14%), once again mainly on the surrounding hill slopes.
A major issue is the risk of flooding in the CBD/Town Basin areas. Apart from the effect on businesses in the area, much critical infrastructure is located within areas that are flood susceptible, especially around Whangarei CBD, Riverside, and along Port Road. This means that managing flooding issues is especially important for the resilience and well being of not just Whangarei City, but the wider district and region.
BiodiversityWhangarei City has a large amount of significant natural habitat, about 248ha (14%) of the total area. This area is concentrated in Parihaka (Q07/018), Pukenui Forest (Q07/022), and Whangarei Harbour (Q07/058). Numbers refer to survey references in the Protected Natural Areas Programme (PNAP) reports produced by the Department of Conservation. Such ecological areas are important in that they provide habitat for threatened and regionally significant species.
Parihaka Forest is an important habitat in an urban location, and Pukenui Forest is the largest remaining contiguous area of forest left in the Whangarei Ecological District and the catchment area for the Whau Valley Dam. This habitat also forms a very prominent scenic backdrop to the City and allows easy access for recreational purposes. Parts of Parihaka and Pukenui Forests

Whangarei District Growth Strategy :129
PAR
T D:
SUSTA
INA
BLE FU
TUR
E 30/50
Projected Population and Household Residential DemandTable 61:
2006 2011 (projected)
2041 (projected)
2061 (projected)
Existing vacant lots
Vacant lot shortfall
(year)Population 14,298 14,511 18,562 22,038 - -Total households (lots) 5,870 5,947 7,425 9,183 152 -Households (Living 1,2,3) 5,814 5,900 7,367 9,111 152 2011Households (other) 56 47 58 72 - -
The average Living Environment lot size in Whangarei City is 0.1ha. This average size may need to reduce over time to meet the projected household numbers, or potential rezoning of land is required that allows for this. However, care needs to be taken, as many people prefer living on the old quarter acre section. Based upon this existing average residential lot size, accommodating future population needs would require 330ha of new urban land equivalent, assuming that the present 99/1 settlement pattern split remains constant over time. Increased mixed use development may reduce this area.
Residential Land Area Required to Meet Projected DemandTable 62:
2006 (estimate) 2011 (projected) 2041 (projected) 2061 (projected)Total urban residential land area (ha) 581.4 590.0 736.7 911.1New urban residential land (ha) - 8.6 155.3 329.7
Capacity, in this case, refers to the potential for creating new lots for accommodating population growth, or development potential.
Capacity Under the Whangarei District PlanTable 63:
District Plan Living 1,2,3 (maximum) District Plan Living 1,2,3 (constrained)
Population 17,031 (14,448)*Maximum households (lots) 7,097 (6,020)*Potential for new lot creation (2011) 1,045 N/A**Projected year capacity exhausted 2014 N/A**
* A large part of the population already lives in an area with high land instability risk, and a large amount of land is significant natural habitat. Overall, the present number of households exceeds the number of lots available without constraint. This calculation adds the present number of used and existing vacant lots to project the population at 2.4 people per household.
** Under the constrained calculation, there is little potential to create more lots. This is because many existing lots are already in areas of flood susceptibility or high land instability risk. This is exacerbated by the lack of available land alternatives that are not subject to any of the constraints.
Present development potential under the Whangarei District Plan is noted in Table 62. Two types of estimates for capacity are given. The first type is the theoretical maximum number of creatable lots based upon all available land (by land area) being utilised. Present lots that are too small to subdivide are excluded from this calculation, as are those sites which are designated in the District Plan. The second type takes into account biophysical constraints that may reduce potential capacity. In this calculation the factors of flood susceptibility, significant natural habitat, and high land stability were applied, in addition to the exclusion of small lots and designated sites. The final number of households or lots is likely to be between the two estimates, as no constraint is absolute.
Overall, the constrained capacity figures in Table 63 suggest that much of the land without constraints has already been developed, and that future development is likely to occur on at risk
Climate ChangeTwo issues in regard to climate change impacts are important to the future well being of Whangarei City. The first is increased flooding risks around the CBD/Town Basin. Specific research has indicated that the risks around flooding, both in terms of magnitude and frequency, are expected to increase around the CBD. Both Northland Regional Council and Whangarei District Council are preparing and implementing options to mitigate this risk. The second is the economic costs around climate change for Whangarei residents, and the downstream impacts on local financial security. Whilst these costs are minimal in the early stages, they can be expected to rise over time if not carefully managed. Figures contained in Appendix 2 give a visual representation of the modelled impacts of climate change on flooding in the CBD/Town Basin Area.
Society2.2 The median age in Whangarei City is 37.8 years, which is close to the district average of 38.4 years. Approximately 30% of the population was under the age of 20 years in 2006, and this, in line with an ageing population, is projected to decline as a proportion of the overall population. At the same time, approximately 18% of the population was aged 65 years and over, which is greater than the district average. This is projected to rise substantially, reaching 33% by 2041, and 38% by 2061. By 2061, this would mean that 8,345 residents will be over the age of 65 years within Whangarei City, up from the present 2,607. This equates to an increase of 220% and will have a corresponding impact on service type and demand, and resources required to provide these.
The median household income in Whangarei City is $36,800, which is 10% less than the district average. Of more importance is that a large part (74%) of the population is considered as “more deprived” under the Index of Deprivation. This suggests that financial resources are neither particularly strong nor evenly spread across the community.
Residential Land RequirementsEstimating future residential land requirements in Whangarei City is complex, with factors such as increased population and declining household sizes needing to be taken into account. This is further compounded by an expected consolidation pattern driven by increased urbanisation as well as declining average lot sizes. The increased population over the age of 65 would be an important driver of this process. Assessment, therefore, needs to take into account both demand and capacity (supply) factors. Demand in Whangarei City takes into account the declining household size and a probable small increase in consolidation to more urban dwellings.
The present split of households between Living Environments and non-Living Environments in Whangarei City is 99/1, with 5,184 households within the Living Environments, and 56 outside. This split is expected to remain roughly the same over time, although mixed use development in present commercial areas may reduce this ratio. As Table 61 suggests, there will need to be a 27% increase in the number of Living Environment lots by 2041 and close to a 60% increase in Living Environment lots by 2061 to meet projected demand. Some of this may need to be accommodated in adjacent nodes.
Notably, there are very few existing vacant lots in Whangarei City, and a shortfall of land is projected in the very near future. Many future lots will need to be from redevelopment of residential areas, increased use of mixed use areas, and brownfield land redevelopment. Given the increased number of people over the age of 65, much demand may occur for smaller, easily maintained lots. In addition, there may be some increased demand for apartment style living in locations with high amenity, especially around Whangarei Harbour, and close to green spaces and parks.

130: Whangarei District Growth Strategy
PAR
T D
: SU
STA
INA
BLE
FU
TUR
E 30
/50
beds. An ageing population is also more likely to be located within easy access to facilities, i.e. in town and city centres. Thus it is likely that more rest home/retirement village facilities will be required within Whangarei City in the future.
The Whangarei Central Police Station is located in Whangarei City, and a new police station building was completed in 2009. This facility should be adequate for a 30/50 year period, with a possible need for expansion at some point after 50 years. It would seem likely that with a projected increase in population of 55,000 for the district as a whole there would be a need for increased staffing levels at the Central Police Station, of both police officers and support staff. The main fire station for the district is also located in the Whangarei City node. This facility will probably need expanding over the next 30/50 years as the population in the district approaches 130,000 people.
Sense of Place/Urban DesignWhangarei City has an extensive water-based edge and dramatic bush clad hills backdrop, which creates an attractive setting to the City centre. The central City urban form has been squeezed between the hills, with the CBD lying on a largely reclaimed area that branches out from the narrow valley strip located between these hills running north/south. This unique topography provides strong character to the identity of Whangarei City, but also presents challenges for the development of infrastructure.
The central City area derives its primary character from the CBD, being a concentration of business, retail, entertainment, dining, light industrial and commercial activities; and the role they play as a place of community gathering and activity. Many small shops and offices in the downtown area are generally two storeys in height and, in many cases, are consistent in the style of their facades. The few buildings that are higher than this are located near John Street. The presence of verandas, a mix of different signs and the development of newer buildings, all contribute to the character of the CBD townscape.
Within the City centre, historic buildings are not common but some can be found near the southern part of Bank Street, and occasional examples are scattered throughout the rest of the commercial and light industrial area. Overall, the City centre has a hotchpotch of styles, although there have been some attempts to form consistency in the pedestrian area along Cameron Street. The Town Basin is one area with a coherent ‘sense of place’. Future development plans have often centred on expanding this ‘sense of place’ to other parts of the City. Other commercial areas beyond the CBD, including Hihiaua Peninsula, Okara, and Port Road, tend to also have a mixture of building styles.
Whangarei City has many older suburbs located within its bounds. The residential areas within Whangarei City also display a wide set of urban forms, but there is more coherency within different areas. Wooden villas and bungalows dominate the urban landscape around the Avenues, Regent and Kensington. Some of the older attractive residences have been converted to small boutique offices, especially close to Bank Street and along Norfolk Street. A mixture of brick and wooden bungalows are important in Mairtown, whilst the state housing style and wide boulevard feel is apparent in Otangarei. The multiple north facing railway cottages in Morningside are important features, and the well-wooded slopes of Parihaka help define the Riverside suburbs.
The development of new living patterns has started in the City area, including the beginnings of mixed use development in accordance with principles of the Whangarei 20/20 Living the Vision project. Future consideration could be given to encouraging slightly higher buildings, especially around the CBD, some increased intensification close to green spaces, and the potential rezoning of existing land use in some locations to allow for more efficient use of land. The Port Nikau
land, or will require intensification of existing areas. The lack of existing vacant lots and the low capacity combine to imply that efforts to increase population within Whangarei City requires a different approach to that of areas with more available land. At present there is no structure plan for the Whangarei City, but there are a variety of other documents, including Whangarei 20/20 Living the Vision, and the Port Nikau private plan change, which will have an impact on future development potential.
Education, Health, and SafetyWhangarei City plays a crucial role in primary and secondary education in Whangarei District, as well as an important role in tertiary education. Ten schools, public and private, are found within the Whangarei City boundaries. The total school roll across these schools in 2009 was 3,511 students, and 74% of the population within Whangarei City is located within 500m of a school. School deciles range from 1-6, suggesting that much of the student catchment often comes from families with low incomes, similar to the statistics noted in the Deprivation Index.
Draft projections from the Ministry of Education indicate that generally the existing schools in Whangarei City have sufficient capacity to cope with the predicted increase in population over the next 20 years (their planning timeframe). However, due to popularity of certain schools and population growth in certain areas, some schools are close to, or exceeding their allocated capacity. A number have introduced zoning schemes to prevent overcrowding, while other schools are well below capacity. Although there is capacity, future planning for population growth will have to take the provision of schools into account. It is unlikely that new schools will be required within the Whangarei City area over the next 50 years.
The University of Auckland’s Tai Tokerau campus was established in Whangarei City in 1992. It is the site for teacher education programmes offered by the University. Student numbers in 2009 totalled 180 Full Time Equivalent (FTE) Students. Also, Northland Polytech’s newly opened Future Trades campus is based in Whangarei’s industrial centre. There are close links with local industry, and it can cater for over 1,000 students each year. Twenty percent of students at the Polytech are currently undertaking trades-related programmes.
It is unlikely that the Government will view Whangarei as a critical location for a new university in the future, with Auckland being in close proximity. Northland lacks the critical mass required to make a university viable. However, an increasing population will provide an opportunity for other tertiary providers to expand facilities and programmes, particularly in areas of industry growth, including tourism, construction and horticulture. There is also significant potential to increase courses and student numbers at Northland Polytech.
As the regional and district centre, Whangarei City is well served by health facilities, including one private hospital (Kensington Hospital), two hospital level rest home facilities at Lester Heights and Potter Home, 13 medical centres, and six chemists. At present, 66% of the population in the node is within 500m of a medical centre. Future intensification of population growth may increase this proportion. The main St. John ambulance station is based in Whangarei City, and there are currently 23 (FTE) ambulance officers and 12 volunteer ambulance officers stationed here. The Northland Emergency Services Trust also owns and operates two rescue helicopters which are dispatched via the St. John communication centre in Kensington and crewed by two paramedics. The service provides a vital linkage with remote coastal and rural communities and urgent medical treatment.
There are ten retirement villages or rest home facilities located in the node; which is the highest out of all the nodes. The number of people aged 65 years and over is expected to increase significantly over the next 30/50 years. The ageing population will place additional demands on health care services, particularly an increased demand for rest home, hospital and dementia

Whangarei District Growth Strategy :131
PAR
T D:
SUSTA
INA
BLE FU
TUR
E 30/50
Forum North as a ‘heritage and culture generator precinct’.•
The Town Basin already acts as a culture and leisure cluster with Clapham’s Clock Museum and Reyburn House at its centre. There is a proposal to develop a Hundertwasser Museum in the former Northland Regional Council office building which could be supported by other Town Basin buildings for arts and heritage activities, including a proposed Cultural Centre on the Hihiaua Peninsula.
Forum North encompasses the new library, the old library building (currently occupied by the Arts Promotion Trust), the Capitaine Bougainville Theatre, the Exhibition Hall, and the Whangarei Art Museum building (in Cafler Park). Other arts and heritage activities may in future be added to those already present in this precinct.
Historic/Cultural HeritageFifty-one known archaeological sites are within Whangarei City. Some 18 buildings have been registered with the New Zealand Historic Places Trust. In addition, there are 109 sites containing heritage trees found within the area. Historic sites registered within the District Plan include four Group I Heritage Buildings, Sites and Objects - Glanville House, Hanlon’s House, Kensington Park Grandstand, and Reyburn House; and, numerous Group II Heritage Buildings, Sites and Objects, such as Cubitt’s House, Dalhousie House, Dobbies Fruit Tunnel, Eureka House, Gorrie House, Hatea House, Whangarei Art Museum, Harding Army Hall, and many houses on Manse Street, Cross Street, Aubrey Street, and Marsden Place.
In addition to those residential dwellings, there are a number of early commercial/civic heritage buildings in Whangarei City. Many of the very early buildings were destroyed in the fires of 1899 and 1900. Those remaining include the first courthouse in Walton Street (now a tavern), built in 1891; the Municipal Chambers in Bank Street built in 1912, a fine example of a civic building from the ‘Art Nouveau’ period; the old public library at 7 Rust Avenue, opened in 1936, which won the Gold Medal of the New Zealand Institute of Architects; and the former Whangarei Railway Station in Railway Road, constructed in 1924-5 which is an excellent example of station architecture of that era.
Originally, the area where the Rose Street Cenotaph is located was a central public space between the Railway Station, the Borough Council of the day, and the Grand Hotel. Over time, it may reclaim this role as a gathering place, especially if transport patterns change. Redevelopment of the City centre needs to incorporate, wherever possible, existing heritage buildings and sites so as to retain and enhance the City’s historic and cultural heritage, and contribute to its sense of place.
Economy2.4
Business Profile and ProjectionsWhangarei City dominates the number of jobs, industries and the number of larger employers within the district. As well as the main CBD area, nine other small commercial or retail centres can be found within the node, including on Maunu Road, Kensington, and the Regent. Approximately 80% of population is located within 500m of a shopping centre of some sort. In 2006, some 5,931 employees lived in Whangarei City. Their main industries of employment were retail trade, healthcare, and manufacturing. Most identified themselves as professionals, technicians, or managers and administrators. Forty-one percent of the population is presently in some form of employment.
private plan change is an example of potential land use changes where land that is zoned for a particular use (industrial) may be used for other alternative uses (including residential).
Culture2.3
Tangata Whenua Whangarei City is located within the Ngapuhi rohe, and the hapu group in the node area is Nga Hapu Katoa. Both Terenga Paraoa marae (Kaka Porowini) and Otangarei marae are located in this node. A substantial amount of land (202ha or 11%) in Whangarei City is classified as Maori land.
Significant features to Maori within the node include Hihiaua, Okara, Parihaka (including a pa site of significance to Maori), Motu Taua, Pukenui Pa and Maori Settlement (Western Hills), Wilson Road Area (site of Te Kauika), Urupa – Rust Ave (Settlement Cemetery), Pa (surrounding area of Quarry Arts), Regent Triangle – Anglican Church (burial place of some early Maori settlers), Pihoi Pa (Presbytarian Church, Old Town Hall including Court House area, Hunt Street and Vinery Lane), Laurie Hall Park (He Unga Waka), Te Ahipupurangi (Town Basin area), Te Matau a Pohe (Pohe Island), Okuru Pa (The Bluff), Pa on ridge above swimming pool complex, and Kioreroa Cemetery. Major landscapes include: Rewarewa, Okara (Old Boys), Opau, Puke Atua and Matakohe. Further sites of significance to Maori may still be identified in future, particularly with the development of Iwi Management Plans.
Archaeological sites of Maori association in the node include two artefact finds, one burial site, eight pa sites, 17 midden/oven sites, 14 pit/terraces and one unclassified – a total of 43. Further archaeological sites may also be uncovered in future.
Arts, Culture and Civic AmenitiesWhangarei City has a number of arts, culture and civic amenities, such as museums, library, cinema/theatres and art galleries, commensurate with its central role. Table 64 provides an overview of a cultural and civic amenities inventory in Whangarei City.
Community Amenities Inventory in Whangarei CityTable 64:
Museums Whangarei Art Museum Whangarei CityClaphams Clocks Museum Town Basin
Library Whangarei Central Library Whangarei CityCinema/Theatres Event Cinemas Whangarei City
Northland Youth Theatre Whangarei CityOctagon Theatre RegentWhangarei Theatre Company Town BasinCapitaine Bougainville Theatre Whangarei City
Multi-purpose Events Centre Northland Events Centre Whangarei CityOther Community Facilities Old Library (Arts Promotion Trust) Whangarei City
Whangarei Aquatic Centre Whangarei CityQuarry Arts Centre Whangarei CityReyburn House Whangarei CityQuarry Gardens Whangarei City
According to the Arts, Culture and Heritage Policy, Council will focus on fulfilling its role of ‘cultural capital and heritage hub’ for the region. Proposals from the Policy include:
The Town Basin as a ‘heritage and culture experience precinct’; and,•

132: Whangarei District Growth Strategy
PAR
T D
: SU
STA
INA
BLE
FU
TUR
E 30
/50
expected to increase substantially to 445ha in 2041 and 530ha in 2061. Given the limited land area for expansion and the possible redevelopment of some areas, growth in business land area may need to spill out into neighbouring areas or be taken up by multi-level developments in the City.
Business Projections, Whangarei CityTable 65:
2006 2041 2061Business floor area (m²) 495,106 671,809 829,943Business land area (ha) 348.33 446.97 530.67Employees (by workplace) 11,955 14,286 16,961
Infrastructure2.5
WaterThe Whangarei City node is currently reticulated with an extensive network of supply, treatment and reticulation infrastructure. The main water treatment plant is located outside the node at Kamo, along with the key water storage facility (the Whau Valley Dam), although there are some supplementary water sources, such as a collection point on the Hatea River, also utilised.
To meet projected population growth, a series of upgrades are required to future proof water infrastructure. These include the development of new storage sites and some reticulation upgrades. The final storage needs and location will be dependent upon the pattern of settlement, but at a minimum a new 5,000m³ storage facility and further reticulation works would be required for Whangarei City at an estimated cost of $8 million over the next 50 years.
WastewaterThe whole of Whangarei City is current served by a sewerage reticulation system, which is connected to the main Whangarei Wastewater Treatment Plant at Kioreroa Road. Parts of the network are currently at capacity with known areas of surcharge during rain events, and significant parts of the infrastructure are ageing. Whangarei District Council is currently undertaking a range of activities to upgrade and renew the present wastewater system.
Council has voted to spend $10 million in the next three years (Stage One) as part of a proposed $50 million programme to prevent overflows of untreated sewage from the City’s wastewater system. Council had already spent $4.5 million in 2009/10 to upgrade the Okara Park Pump Station, install a duplicate rising main from the pump station to the Whangarei Wastewater Treatment Plant and upgrade the stormwater bypass process at the treatment plant to receive these flows. The network model identified that the discharge of wastewater from the Hatea Pump Station during storms is a significant point source discharge, after the Okara Park Pump Station. Therefore, works including a $1.9 million dollar investment on the construction of 1,000m³ storage tank near the pumping station, are proposed.
In Stage Two of the Whangarei City service level improvements (2013/19 LTCCP), Council has committed funding of $3.4 million for the Whangarei City improvements and $8.6 million for sewerage system upgrades and inflow/infiltration mitigation in years 2013/19 of the LTCCP. However, an additional $22 million is required to complete the Stage Two improvement works.
StormwaterThe stormwater network is generally sufficient to service a 1 in 5 year rainfall event, although some property flooding occurs in more extreme events. Reticulation will require renewal/rehabilitation as necessary. Most redevelopment in the City will contain plans for dealing with stormwater as
Work options within the node were more expansive, with 11,995 employees stating that they worked in Whangarei City. The main employment sectors were retail trade, manufacturing, and professional services. The main occupations were managers and administrators, technicians, and professionals. This number is projected to rise to 14,286 by 2041, and 16,961 by 2061. This projection assumes that there is considerable job growth in Marsden Point/Ruakaka, and some job growth in the various urban nodes and growth nodes, in line with enhanced population growth in these areas.
As well as the census figures, Statistics New Zealand undertakes a business survey in which employers are contacted for information. The result of this survey can differ from census figures, and includes information about employment numbers, employer numbers, industries of employment, and size of businesses. According to this data, Whangarei City contains employment for approximately 17,400 employees, and is the location for 2,900 employers. Less than half of these employers were sole-operators/self-employed (1,340). There were 1,140 firms that employed between 1-9 staff. This leaves 420 firms that employed more than nine people.
In Whangarei City, the biggest employers (employing over 100 people) are involved in the retail trade, education, health and community services, personal and other services, and construction industries. It is noted that there are pockets of different industries and employment within different parts of the City.
Kensington’s largest employers tend to be dominated by the health and community services sector, as is the small amount of employment found in Otangarei. The Regent also has a considerable presence of employers in the health and community services sector, but also had a considerable presence in personal and other services, property and business services, and retail trade. The largest employer in Mairtown is involved in property and business services. Overall, however, the two biggest employers within the wider area are the two secondary schools.
Whangarei Central, as opposed to the surrounding suburbs, has the bulk of employment, and has a considerable number of firms across most sectors. Personal and other services, government administration and defence, property and business services, finance and insurance, accommodation cafes and restaurants, retail trade, and cultural and recreational services are all industries that are prominent. Less prominent in this area are the manufacturing, construction, and transport sectors.
The Limeburners/Old Port area has the bulk of the manufacturing, construction, and transport sector employment, and a total of around 2,360 jobs in the area. The Morningside area is also important in terms of employment, especially for the construction sector, and to a lesser extent manufacturing, with around 1,220 employees in the vicinity. Over time, and with changes due to Porowini Avenue, the Morningside economy is expected to grow.
Given the projected increase in Whangarei District population, the ageing population, and its large commercial sector, over the long term Whangarei City employment is expected to grow, especially in the services sector. With the growth in business land in Otaika and the availability of business land in Marsden Point/Ruakaka, it appears unlikely that substantial large scale manufacturing will occur in this node. However, much future industry may be based around the production of niche products and services to Northland, similar to the present role.
Business Land RequirementsCurrently there is around 350ha of business zoned land and around 495,000m² of business floor area in Whangarei City. If the relationship between population, employee numbers and business numbers hold over time, then the business floor area is projected to increase to around 670,000m² in 2041 and 830,000m² in 2061. The land required for this business floor area expansion is

Whangarei District Growth Strategy :133
PAR
T D:
SUSTA
INA
BLE FU
TUR
E 30/50
from Onerahi to the Okara area south of Whangarei by providing an alternative route rather than travelling through town. Funding for the project will be spread over three years with $1.6 million in 2009/10, $31.7 million in 2010/11, and $0.5 million in 2011/12.
The Porowini Avenue extension will involve the construction of a new two lane road (including cyclist facilities) that extends Porowini Avenue across the rail line to Okara Drive. It is also proposed to upgrade the intersections at Porowini Ave/Tarewa Road and Porowini Ave/Maunu Road, as well as a new roundabout intersection at Okara Drive. The new road will provide an additional vehicular/cyclist link to/from the CBD and the east. This project is estimated at $4.2 million in 2009/10 and $2.6 million in 2010/11.
It is proposed to upgrade Walton Street, including four-laning between Tarewa Road and Dent Street, upgrading the signals at Walton Street/Dent Street and Walton Street/Cameron Street, and new signals at the Walton Street/Robert Street intersection. The project is estimated to cost $3.7 million in 2016/17, $3.8 million in 2017/18 and $3.9 million in 2018/19.
Parks and ReservesThere is a significant variety of parks and reserves located within Whangarei City. A total of 264ha of reserve (Council and other) can be found within the node, including Kensington Sports Fields, Parihaka Reserve, Mair Park, Coronation Reserve, and a number of other small local community reserves. These small parks and reserve areas include Laurie Hall Park, Fernery, Okara Park, Otangarei Sports Park, Morningside Sports Park, Jack Street Reserve, Moody Avenue Reserve, Cairnfield Road Reserve, Corn Street Reserve, Nixon Street Reserve, Riverside Reserve, Mander Park, Cookson Park Reserve, Mackesy Bush Natural Area, Otangarei Shops Reserve, Selwyn Reserve, Hihiaua Reserve, Elliot Reserve, Waiarohia Esplanade and Old Selwyn Avenue Cemetery.
An analysis of ‘Neighbourhood’, ‘Sports’ and ‘Other’ parks found 5.6ha, 7.2ha and 77ha of existing capacity respectively, which is enough to meet present population needs. To meet anticipated future population demands and present service levels, it is estimated that 30ha of land for different parks purposes is required. Such parks would play a range of roles such as providing recreational space and generating ecosystem services, especially along riparian areas. This land estimate includes 22ha of local parks, 3.4ha of sports fields, and 4.5ha of destination reserve. The cost of these works is estimated at $23.6 million, spread out over the next 50 years.
Summary2.6 Whangarei City will continue to be the heart of Whangarei District over the next 50 years. Being the main population centre, and central gathering place for the wider region ensures it the best opportunity to offer the widest range of services. To fulfil this role will require a range of initiatives. The most pressing issue is the revitalisation of the central business district and the associated business areas. Revitalisation includes improvements to pedestrian connectivity around much of the area, but especially between the CBD and Town Basin. The second, and related, issue is a continuation in improvements to traffic flow around the central area. Works such as Porowini Avenue, the second harbour crossing, and ongoing improvements to State Highway 1 will allow for improved traffic movement around the City. These improvements are likely to promote changed transport patterns that, in turn, may allow for improved pedestrian access.
In terms of residential opportunities, there is limited potential for population growth with green-field development. Other options need to be looked at including business land redevelopment, intensification in appropriate areas, and some mixed use development, particularly around the CBD/Town Basin and old port area. To ensure this, a detailed structure plan for Whangarei City is required.
part of land development consent. Several stormwater catchment plans have been prepared, and include the City Catchment Drainage Plan (1999); the Waiarohia Stream Catchment Drainage Plan (1998); the Limeburners Catchment Drainage Plan (1995); and the Port Road Catchment Management Plan (2004). The Limeburners Catchment Drainage Plan is in the process of being reviewed and updated.
TransportationWhangarei City is currently serviced by a roading network catering for approximately 125,000 vehicles per day. There is a known backlog of roading works that will need to be met in order to provide for current traffic movements, let alone changes in future capacity. As befits the main central meeting point, a wide variety of road types and lengths are found within the network. The most important, on a regional basis, is the 4.6km of state highway passing through the node, but heavy traffic means that the 23km of arterial roads are important to the various suburbs and settlements that connect to the City centre. In addition to these, there are 17km of collector roads that have a medium level of traffic movements. Finally, there are 42km of public roads, which are essentially the streets that people live on.
Should projected population growth occur, it is expected that future proofing the roading network will be required to meet localised traffic demands, but in general such works will be incorporated within existing programmes. The obvious exception to this will be the major upgrade around Port Road following the construction of the second harbour crossing. However, major roading network development in Otaika, Kamo, and Maunu will have a major influence on the City centre roads. Close to 201,623 vehicles per day will be generated for this node as part of the increased population size. This will require an estimated $44 million of additional Council administered roading expenditure over the next 20 years.
State Highway 1 through Whangarei plays a very important role in the transport network, partly due to the natural geography of the area and also the lack of alternative routes. As well as serving regional traffic, it also acts as a bypass around the CBD for traffic travelling within Whangarei. During peak periods the level of service is poor. Several upgrades to State Highway 1 through the City have been committed to, in conjunction with the New Zealand Transport Agency, to relieve congestion along the most critical parts.
The signals at the intersections of Selwyn Avenue and Central Avenue with Western Hills Drive (State Highway 1) are proposed to be upgraded, and the road widened to two lanes in each direction between Selwyn Avenue and Fourth Avenue. It is expected that capacity will be improved, drawing traffic away from local roads and leading to improved travel times on State Highway 1 through Whangarei. The project has been allocated $2 million in 2009/10, $3.7 million in 2010/11 and $3.8 million in 2011/12. A long term project to four lane the section of State Highway 1 from Manse Street to Kamo Road is also anticipated to improve capacity through the city along State Highway 1.
The signalisation of the State Highway 1/Tarewa Road intersection and an upgrade of the intersection of State Highway 1 and Maunu Road (State Highway 14) are proposed to improve traffic flow. Tarewa Road intersection improvements and four-laning of State Highway 1 have been allocated $0.7 million in 2009/10, $0.58 million in 2010/11, $3.3 million in 2011/12, and $4.5 million in 2012/13. State Highway 14 intersection improvements have been allocated $2.3 million in 2009/10 and $1.7 million in 2010/11.
Other local roading projects are also proposed to complement state highway upgrades and improve the roading network in Whangarei. The Lower Hatea River crossing will involve construction of a two lane road and bridge with cycle lanes and footpaths connecting Riverside Drive to Port Road across Pohe Island. The project is intended to remove traffic from the CBD, directing traffic

134: Whangarei District Growth Strategy
PAR
T D
: SU
STA
INA
BLE
FU
TUR
E 30
/50
KamoFigure 97: Five Urban Villages3.
Kamo3.1 Kamo is long established as a separate entity within Whangarei City, dating back to its founding in the nineteenth century. Kamo merged with Whangarei in the early twentieth century, but with separate beginnings Kamo has retained a strong local identity. In recent years, Kamo has emerged as one of the fastest growing urban areas within Whangarei District. This expansion has led to some concerns over development within the area, especially expansion onto rural land around Three Mile Bush Road. Kamo is projected to continue its recent high growth, especially with the growing presence and availability of residential options targeted at retirees. If these projected rates of growth occur, Kamo will remain the second largest settlement node in Whangarei District, larger than Marsden Point/Ruakaka, and would have a population approaching that of central Whangarei.
The population in 2006 was 10,155 residents within the urban and rural area of the Kamo node. This is projected to rise to around 15,000 by 2041 and to 18,000 by 2061. Within the wider area of 3,428ha, 485ha of land is zoned Living 1 and 3 Environments, with most being zoned Living 1 Environment. A further 52ha is zoned as Business 2 or Business 3 Environments.
Compared with some future urban villages, Kamo has a reasonably centralised commercial and industrial area, with a wide range of shopping and services. In addition, churches, schools, sports clubs and fields are relatively central in the settlement. This core of services and social infrastructure can enable Kamo to continue to maintain and develop local services. However, the central area lacks green space.
A substantial area of residential development has occurred within former pastoral or horticultural areas, and is strongly evident along Springs Flat, and the lower to middle sections of Three Mile Bush Road. This level of change has been recognised, and much of the farming area that has already been compromised is being incorporated into a new zone within the Whangarei District Plan, called the Urban Transition Environment, so as to accommodate future rural residential development.
Environment3.1.1
Land UseKamo contains a modest amount of the higher quality versatile soils, despite the strong volcanic origins and presence of volcanic soils in the area. The soils are, on the whole, a result of the weathering of the underlying (parent) rock. The parent material of Kamo is in several layers, the most predominant being the Kerikeri Volcanic Group, pockets of the Te Kuiti Group, the Northern Allochthon, the Waipapa Group (shattered greywacke and argillites) and the soft alluvial sediments of the Holocene Sediments.
The best soils in Kamo are classified as Class 3 soils, and form 38% of the settlement area. Much of this land is used for lifestyle purposes. Surprisingly, there are no soils classified as either Class 1 or Class 2 versatile soils in the area. This is because soils have several constraints that impact on land use capability, rather than simply fertility or drainage aspects. These constraints can range from a high ratio of stones, to an inability to access portions of the area. This lower level of soil versatility is reflected in the main land uses of the area, in which horticulture does not feature as a major land use. However, there is potential for horticultural use if residential and rural residential development is consolidated.

Whangarei District Growth Strategy :135
PAR
T D:
SUSTA
INA
BLE FU
TUR
E 30/50
and residential properties. Land use in Kamo also has an influence on downstream flooding susceptibility or risk, especially in Tikipunga and Whangarei City.
A slightly larger area of the Kamo node is categorised as having high land instability risk. These areas are located primarily along the slopes of Parakiore and other steep hills. Areas with high land instability cover around 300ha (around 9% of the node). Ten percent of land parcels are within an area of high risk of land instability. In addition to pockets of high land instability, a slightly larger area (around 10%) of the Kamo nodal area is regarded as erosion prone (around 335ha).
Another key natural hazard, dating back to the origins of Kamo, are mining hazard zones located in some parts of the node. These are areas where there is risk of subsidence due to past coal mining activities. This is a hazard type that Kamo shares with parts of Hikurangi. In general terms, most mining hazard areas are located east of Kamo Road. The highest levels of mining hazard risk can be found in two pockets, one located around Puriri, Ogle and Meldrum Streets and a second following Boswell Street. An area with medium level hazard stretches along either side of the Kamo Bypass from Ogle Crescent in the north to Tai Street in the south. The area of lowest mining hazard occurs on the southern slopes of Mount Denby, includes much of Denby Golf Course, and takes in most of the residential area between Paramount Parade and Corks Road.
Like other major population centres, increase in the population over the age of 65, and the level of deprivation will increase the vulnerability of the settlement to hazard risk over time, but it is limited compared with other populated areas such as Whangarei City.
BiodiversityGiven the presence of Pukenui Forest, and the bush located upon numerous volcanic cones, it is not surprising that the Kamo node has a reasonable proportion regarded as significant natural habitat, an area of approximately 530ha (16%) of total land area. However, it is the second lowest proportion of significant natural habitat amongst the urban nodes. Important areas of habitat include Mount Parakiore (Q06/156), Rotomate Road Volcanic Cones (Q06/161), Vinegar Road Bush (Q06/153), Waitaua Stream (Q06/158), Hurupaki Cone (Q06/163), Lower Whau Valley Forest (Q06/164), Smithville Road Remnants (Q06/170), Finlayson Stream (Q06/159), Church Road Wetland (Q06/160), Lake Ora (Q06/165), and Pukenui Forest (Q07/022). However, most of this area is found in the uplands, and very little significant natural habitat is low lying.
These ecological areas are important in that they provide habitat for threatened and regionally significant species. Some sites also contain uncommon (riverine forest) and nationally rare (volcanic broadleaf forest) vegetation types. There are also several wetland areas, including Lake Ora, a rare mineralised wetland at Church Road, and one uniquely situated within a volcanic cone (Rotomate Road). The Rotomate Road Volcanic Cones and Hurupaki Cone are also geo-preservation sites of regional importance. Potential kiwi presence is identified in parts of the Kamo node, near the boundary with Pukenui Forest.
Around 210ha or 6% of the nodal area is formally protected by Department of Conservation reserve, Council reserve, esplanade reserve or private covenanting. This includes 147ha (28%) of PNA areas (areas of ecological significance). Thirty-nine percent of the total node area (1,353ha) is classified as acutely or chronically threatened (<20% indigenous vegetation cover remaining).
A break down of acutely and chronically threatened environments within the PNAs, and the amount and type of formal protection in these is shown in Table 66. Most of the acutely and chronically threatened environments are located in low lying areas, and contain only small bush fragments, mainly beside streams. Only a small amount of this critical ecosystem is protected in some form, whether privately or publicly.
The main uses of land in the area are for lifestyle purposes (46%), pastoral farming (15%), and residential use (12%). Dairying occupies 8% of the land area, whilst horticultural uses occupy 5%. These primary uses do not discount or preclude the use of lifestyle land for the growth of crops, but instead reflect the primary purpose to which the land is being used. As the population grows, the land occupied by residential purposes will also grow. This is likely to be at the expense of land occupied by lifestyle and pastoral purposes, and perhaps horticultural. It is noted that some small orchards can be found in the area, especially in the vicinity of Church Road, but their existence likely reflects effort undertaken by settlers to remove stones from the fields in order to enable high intensity horticultural uses.
It is important to note that the future productive potential of intensive horticulture and orcharding will rely on the continued availability of highly versatile soils. Sporadic residential and lifestyle blocks need to be limited by strong planning provisions if this resource is to be retained for future productive use.
Water ResourcesKamo contains several hilly areas, many of which are the source for streams that flow into Whangarei City. Parakiore is the main source, as are parts of the Pukenui Forest. The main streams are Finlayson Stream, Waiarohia Stream, Waitaua Stream, and Waikoropupu Stream. The Kamo node contains approximately 46km of streams, some of which either flow into the Hikurangi swamp basin from the northern/eastern slopes of Parakiore or Three Mile Bush, whilst the rest flow into the Whangarei Harbour via the Waitaua (then Hatea) or Waiarohia Streams. The Kamo node encompasses three catchment areas, the Hatea, Waiarohia and Lower Purua Catchment areas.
The streams in the Kamo section of the Hatea Catchment area flow through light industry, lifestyle blocks, and some pastoral land near Springs Flat/Vinegar Hill, before passing into the Tikipunga area. The Waitaua Stream is the main waterway, and is predominantly rural. Some riparian vegetation remains along many of the smaller streams that feed into the Waitaua, whilst the Waitaua itself has fragments of riparian cover. The Waitaua Stream eventually joins the Hatea River and eventually drains into the Whangarei Harbour.
The Waiarohia Catchment area within the Kamo node flows through a mixture of native bush, lifestyle blocks and pastoral uses. Sources include the Pukenui Forest, and to a smaller extent, Lake Ora. The upper reaches of the Waiarohia Stream drain into the Whau Valley water supply reservoir before flowing downstream. This stream catchment drains in a southerly direction before joining the Raumanga Stream and then discharging into lower reaches of the Hatea River. A section of the Kamo area, away from the main residential area, is situated within the Lower Purua Catchment area which flows though dairy country westwards into the Northern Wairoa River and eventually the Kaipara Harbour.
The Northland Regional Council has identified an aquifer within the study area, which has a high actual or potential risk from demand for water extraction. Parts of this aquifer are located in areas that have experienced much lifestyle block development in recent years.
Natural HazardsKamo has few major natural hazards that may constrain future development. Areas of natural hazard risk are located mainly on the fringes of the steep sided hills and alongside streams running throughout the area. A very low proportion of Kamo node is regarded as being flood susceptible (around 185ha or 5% of the total land area), much of which is located around Springs Flat. Despite the small area of flood susceptible land, a large proportion of land parcels (20%) are fully or partially located on flood susceptible land. These land parcels include both commercial

136: Whangarei District Growth Strategy
PAR
T D
: SU
STA
INA
BLE
FU
TUR
E 30
/50
The median age of residents in Kamo is 40.5 years, which is slightly higher than the district median age of 38.4 years. Approximately 30% of the population was under the age of 20 in 2006, and this is expected to decline significantly over time. In 2006, 18% of the population was aged 65 and over. This is projected to rise significantly, with approximately 32% of the population being over 65 by 2041, and 37% by 2061. By 2061, approximately 6,500 people in the Kamo node will be over the age of 65 years, up significantly from the present number of around 1,800 people. This equates to a 262% increase (or around 5% increase per annum), and suggests that a larger number of health and community services will be needed for the Kamo population.
Residential Land RequirementsEstimating future residential land requirements in Kamo is complex, with various factors such as increased population and declining household sizes needing to be taken into account. This is further compounded by an expected consolidation of urban patterns. Any assessment needs to take into account both demand and supply factors.
Demand, in this case, needs to take into account the declining household size (from 2.6 to 2.4) and a probable small increase in consolidation to more urban dwellings. The present split between households within the Living Environments and outside of the Living Environments is 72/28, with around 2,700 households within the Living Environments, and around 1,000 households outside them. Over time, a target split of 80/20 by 2061 is achievable, which would result in around 5,900 households inside the urban area, and around 1,500 households outside of the main urban area. Notably, there appears to be a likely shortfall in existing vacant lots in the Living Environments in the near future.
Projected Population and Household Residential DemandTable 67:
2006 (Census)
2011 (projected)
2041 (projected)
2061 (projected)
Existing vacant lots
Existing vacant lot
shortfall (year)
Population 10,155 10,960 14,940 17,737 - -Total households (lots) 3,789 4,089 5,976 7,390 523 -Households (Living 1,2,3) 2,732 2,948 4,602 5,912 233 2011Households (rural/residential) 1,057 1,141 1,374 1,478 290 2031
The average Living Environment lot size in Kamo is 0.1ha, whilst the average rural residential parcel size outside of the Living Environments is 0.7ha. Based upon a continuation of the average residential lot sizes and the preferred split, this would equate to around 350ha of new urban land being required, and around 295ha of rural residential land being taken up outside of the Living Environments. Some of the demand for rural residential properties may be met by the existing vacant lots outside of the Living Environments.
Residential Land Area Required to Meet Projected DemandTable 68:
2006 (estimate) 2011 (projected)
2041 (projected)
2061 (projected)
Total urban residential land area(ha) 300 324 506 650New urban residential land area (ha) - 24 206 350Total rural/residential land area (ha) 740 799 962 1,035New rural/residential land (ha) - 59 222 295
Supply, in this case, refers to the availability of actual or potential vacant lots to accommodate projected future population growth and the capacity to undertake subdivision should future growth patterns warrant it.
Significant Natural Areas and Formal Protection of These Within Acutely and Table 66: Chronically Threatened Environments
Area of PNA within Acutely or Chronically Threatened Environment (ha)
Area of Formal Protection within Area of PNA that is Acutely or Chronically Threatened (ha)Conservation Covenant
QEII Esplanade DoC WDC Park/ Reserve
Total (ha) Proportion Protected
47.20 1.06 0.50 0.04 3.60 7.19 12.40 26%
Source: Whangarei District Council, Department of Conservation, Land Environments New Zealand.
Landscape/Natural CharacterA heritage landscape dominates rural areas in the Kamo node, including Three Mile Bush. This landscape is comprised of strong cultural and historical associations, both European and Maori. Maori heritage is evident by pa sites on the volcanic cones in the area, and the extensive dry stone walling imparts a European heritage. This is further reinforced by scattered thorn hedgerows, copses, and historic homesteads. The volcanic cones of Hurupaki and Ngararatunua also provide a sense of place, and they act as landmarks in an otherwise flat/rolling landscape.
A small area of the Kamo node at the Pukenui foothills is regarded as notable landscape in the District Plan (Landscape Sensitivity 6). However, a large proportion (73%) of the node is regarded as significant (Landscape Sensitivity 5) according to an initial landscape study of the district. This land is deemed significant because of the cultural heritage landscapes in the area. The Kamo node contains the highest numbers of Outstanding Natural Features and Geological Sites of National or Regional Importance. These include Hurupaki Scoria Cone, Kamo Hot Springs, Kamo Limestone Pinnacles, Kamo No 3 Coal Mine Relics, Ngararatunua Volcanic Cone, and the Rawhitiroa Scoria Cone.
Ecosystem ServicesThe main ecosystem services generated within the area include small amounts of food and fibre, contributions to air quality, and contributions to water quality and quantity. Demand for pest regulation, pollination, nutrient cycling and soil formation would also be of increased importance, especially with the increased population in the area. Air quality services will also become more important over time, especially with an increase in industrial activity. The largest impact on the rest of the district’s well being would be the ecosystem services relating to the provision of water quality and quantity in terms of the Whau Valley Reservoir, with its upper watershed in the Pukenui Forest, along with flood attenuation. With increased population, the capacity of the node to generate ecosystem services will be reduced as land is converted to residential use.
Climate ChangeFew major specific risks in terms of climate change are evident for Kamo node, apart from general changes or risks expected across the wider district. There may be some localised increases in slope instability risk and there may also be an increase in the intensity of flooding events in the vicinity of small streams. But overall, the increase in risk is not high.
Society3.1.2
The median household income of $52,500 is one of the highest in the district, and around 20% greater than the district’s median income of $43,900. Despite the high median household income, about 42% of the population is more deprived under the Deprivation Index. These differences suggest there are pockets of deprivation within the area.

Whangarei District Growth Strategy :137
PAR
T D:
SUSTA
INA
BLE FU
TUR
E 30/50
Hospital. There are also three medical centres and one chemist found in the area. In addition, other types of medical practitioners are established in the surrounding area, including dental surgeons, chiropractors and physiotherapists. At present, about 40% of the local population is located within 500m of a medical facility, and Kamo has reasonable access to Whangarei Hospital at a distance of 7.5km along a direct route.
As Kamo is projected to grow to around 18,000 people, it is expected that additional medical facilities will be required in the area, some of which may use a different delivery model to that used previously. The Government is currently working with District Health Boards to establish Integrated Family Health Centres to provide comprehensive primary care in one location. Integrated Family Health Centres could be a suitable option for larger populations in urban villages, with the centres being the main providers of comprehensive primary care. By offering some of the services currently provided by Whangarei Hospital, these centres could relieve some of the pressure placed on the hospital by a growing population, and provide a healthcare service that is more accessible to the local community (particularly the elderly).
There are five rest home/retirement village facilities located in the area. As the number of people aged 65 and over is expected to increase significantly over the next 50 years, it is expected that there will be a substantial increase in the number of these facilities. The ageing population will place additional demands on health care services, particularly an increased demand for rest home, hospital and dementia beds. An ageing population is also more likely to be located within easy access to facilities, i.e. in towns and urban centres. Thus, it is likely that more rest home/retirement village facilities will be required close to Kamo services and shops in the future.
Emergency services in the Kamo area include a volunteer fire station and a local police station. The number of police officers/support staff required at the Kamo Police Station is likely to increase over the next 30/50 years. Given the projected increase in population for the Kamo node, an expanded police station may also become necessary. Any increase in demand for fire services may result in increased capacity at the local fire station.
Kamo VillageFigure 98:
Sense of Place/Urban DesignIn terms of natural surroundings, the urban Kamo backdrop is dominated by Parakiore, Hurupaki and Pukenui Forest. The topography and terrain within the Kamo node is much varied, with
Capacity Under the Whangarei District Plan and Applicable Structure PlanTable 69:
District Plan Living 1,2,3 (maximum)
District Plan Living 1,2,3
(constrained)
Structure Plan Living 1,2,3 (maximum)
Structure Plan Living 1,2,3
(constrained)Population 12,547 8,640 17,185 12,147Maximum households (lots) 5,228 3,600 7,160 5,061Potential for new lot creation (2011) 2,047 419 3,980 1,880Projected year capacity exhausted 2048 2017 2085 2045
Present development potential under the Whangarei District Plan and the Kamo Structure Plan is noted in Table 69. Two types of estimates for capacity are given for both District Plan and Structure Plan. The first estimate is the theoretical maximum number of lots that can be created based upon all available land being utilised. Present lots that are too small to subdivide are excluded from this calculation, as are those sites which are designated in the District Plan.
The second type takes into account biophysical constraints that may reduce potential capacity. In this calculation the factors of flood susceptibility, significant natural habitat, and high land stability were applied, in addition to the exclusion of small lots and designated land. The final number of households or lots is likely to be between the two estimates, as no constraint is absolute. In Kamo’s case, constraints have a significant impact on the capacity to create new lots in the near future.
Overall, considering the recent and potential future growth of population in this area, there doesn’t appear to be excess capacity of Living Environment lots at present, and Council may need to rezone land in the area within 10 years to meet projected demand. This could involve the release of some Living Environments identified in the Kamo Structure Plan through rezoning in the District Plan.
Education, Health, and SafetyKamo plays a key role in the local education system. There are seven schools in the Kamo node, including both private and public. The school role across the area is substantial, with 3,168 students in 2009. This is the second highest school roll amongst the various nodes. Approximately 70% of the population is located within 500m of a school. Schools include Hurupaki Primary, Kamo Primary, Kamo Intermediate, Kamo High School, Excellere College, Breakthrough Education Centre, Kaurihohore School, and Whangarei Adventist Christian School. There are also a number of pre-schools in the area, as well as two Kohanga Reo. School deciles range from 4-8.
Draft projections from the Ministry of Education indicate that existing schools in the Whangarei District have sufficient capacity to cope with the predicted increase in population over the next 20 years. Although there is capacity, future planning for population growth will have to take the provision of services, including schools, into account, particularly as, beyond a 20 year timeframe, more schools may be required. If further schools are required, suitable areas of land need to be set aside in advance of further development, to ensure the schools are optimally located. Over the next 50 years the Kamo node will most likely require an additional primary school, and possibly a secondary school, as the population approaches 18,000 in 2061.
Kamo is the location of Northland Polytech’s campus for primary industries, focusing on horticultural courses. Facilities at the Kamo campus would most likely need expanding as the nodal population grows to a projected 18,000 by 2061. This is particularly so as future growth is anticipated in the horticulture industry.
Kamo has good access to health services, including hospital level rest home facilities at Jane Mander Retirement Village, Oakhaven Hospital, Potter Home, and Puriri Court Rest Home and

138: Whangarei District Growth Strategy
PAR
T D
: SU
STA
INA
BLE
FU
TUR
E 30
/50
summer rugby clubs. There are a number of scenic and local purpose reserves in this area that cater for passive recreation.
Kamo is relatively distant to any of the main recreational surf beaches, with Ocean Beach over 40km away, Sandy Bay around 34km away, Matapouri 35km away, and Pataua North the closest at 33km from the centre of Kamo.
Kamo LibraryFigure 99:
Historic/Cultural HeritageThe settlement of Whangarei began with the Ngapuhi tribe, descended from voyagers in the Mamari Canoe that arrived at the Hokianga to establish the tangata whenua of the north, including establishment around Kamo. An important main centre for present day activity is the Ngararatunua Marae that overlooks the Hikurangi swamp basin.
In 1858, a block of land called Kamo, consisting of 296 acres (approximately 120ha), was purchased from Ngapuhi on behalf of the Crown. In 1859, early colonists were granted land in Kamo by the Government. The discovery of coal in the Whau Valley Stream saw the beginning of coal mining in the Whangarei District, and provided an impetus to local European settlement.
In 1865, the Whau Valley Coal mine opened, and continued operating for three years. Around this time, the Government set about forming a road from Kamo northwards. While excavations were taking place, more coal was discovered in 1875. The Kamo Coal Mine opened, and Kamo experienced booming growth with miners arriving, cottages and shops being built and roads constructed. Mining continued, on and off, until 1955. Following the final closure of the mine in 1955, Kamo continued to progress, this time as a business, farming and residential area.
In the 1880s, gum diggers settled along Three Mile Bush Road. The place became known both as ‘Rowdy Town’ or ‘Gum Town’ right up to the early 1900s. The Three Mile Bush area was recognised as containing fertile farmland, and pastoral farming and horticulture became the predominant land use. The Three Mile Bush area is characterised by stone walls made from volcanic rocks that were collected and cleared from the land to allow farming, with the earliest walls dating back to 1850 (but some being built in the mid twentieth century). The Three Mile Bush area has approximately 31km of stone walls, which accounts for 20% of the stone walls located in
low-lying flats on former swamps, steep sided and bush clad hills, several relatively flat plateau areas, and many small hills featuring residential housing.
Various areas and structures within Kamo help to foster a sense of history, with mining and railway cottages providing links to the past. Several character areas can be found within Kamo, based on aesthetic coherency, age and overall feel. These include the Kamo Village and associated business district, the rural feel of Whau Valley, Kamo East that mixes lower cost housing and old mining cottages, Three Mile Bush with its combination of new housing and old stone walls, Kamo West with attractive older housing stock, and Fairway Drive which primarily consists of housing stock dating from the 1980s.
Kamo Village, itself, has a main street area, which has seen some signs of beautification in recent years, and has a range of shops and services available within its confines. Much of recent residential growth has been near and above the golf course on Mount Denby. As well as this development, there has been extensive low density development found across the Three Mile Bush area, especially around the areas noted for their stone walls. The Kamo node also contains some light industrial activities within Springs Flat. Springs Flat is an unusual location, combining a mix of light industrial areas with small amounts of affordable housing, and development of rural lifestyle areas to the east of State Highway 1.
A large proportion of Kamo’s building stock was built between 1960 and 1969 (26%) and since 2000 (19%). The average age of dwellings in this area is approximately 38 years. There have been few major peaks and troughs in the overall building rate, and it is unlikely that large scale peaks in refurbishment or replacement will be required. However, given the large numbers of buildings constructed between 1960-69, one would expect major refurbishment over the next 20 years of some buildings from this period, or perhaps replacement before 2061.
Culture3.1.3
Tangata Whenua Kamo is located within the rohe of Ngapuhi, and the hapu groups in the area are Ngati Kahu o Torongare, Ngati Hine, Te Parawhau, Ngai Tahuhu and Te Uriroroi. The Ngararatunua Marae is located in the area. At present, around 12% of land in the node (419ha) is Maori land, particularly close to the marae.
A burial ground of significance to Maori is identified in the District Plan located in the node, as are other important features including Te Rauponga, Soda Springs, Thermal Springs, Maunga Parikiore, Maunga Hurupaki, Ketenikau Papakainga and Urupa, Lake Ora and Papakainga, Pukemiro Papakainga, wahi tapu (bush area near Holman Homestead), and Puriri Tree – Grant Street (Te Kamo). Further sites of significance to Maori may be identified in future, particularly with the development of Iwi Management Plans. Archaeological sites of Maori association in the node include two artefact finds, one burial site, seven pa sites, one historic-domestic site, and 12 pit/terraces – a total of 23. Further archaeological sites may be uncovered in future.
Arts, Culture and Civic AmenitiesDespite the large population, Kamo appears to have a modest level of civic amenities. Kamo contains its own branch of Council’s library service. This library may need to be upgraded over the next fifty years. The node contains four playgrounds, two community halls, one golf club, two public toilets, and a bowling club. Twelve churches can be found within the confines of Kamo, and are scattered throughout the area. The Kamo Sports Park is located off Three Mile Bush Road, Lillian Street and Butler Street. The sports park contains cricket, rugby, soccer, tennis, bowls and
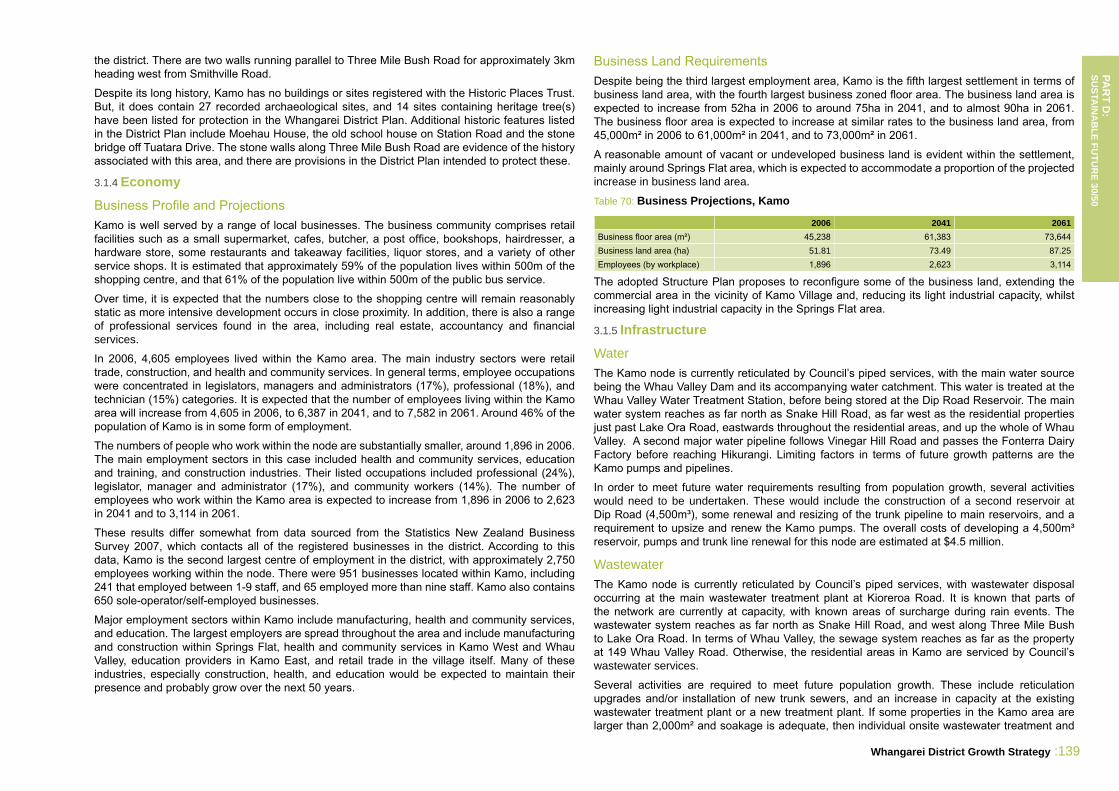
Whangarei District Growth Strategy :139
PAR
T D:
SUSTA
INA
BLE FU
TUR
E 30/50
Business Land RequirementsDespite being the third largest employment area, Kamo is the fifth largest settlement in terms of business land area, with the fourth largest business zoned floor area. The business land area is expected to increase from 52ha in 2006 to around 75ha in 2041, and to almost 90ha in 2061. The business floor area is expected to increase at similar rates to the business land area, from 45,000m² in 2006 to 61,000m² in 2041, and to 73,000m² in 2061.
A reasonable amount of vacant or undeveloped business land is evident within the settlement, mainly around Springs Flat area, which is expected to accommodate a proportion of the projected increase in business land area.
Business Projections, Kamo Table 70:
2006 2041 2061Business floor area (m²) 45,238 61,383 73,644Business land area (ha) 51.81 73.49 87.25Employees (by workplace) 1,896 2,623 3,114
The adopted Structure Plan proposes to reconfigure some of the business land, extending the commercial area in the vicinity of Kamo Village and, reducing its light industrial capacity, whilst increasing light industrial capacity in the Springs Flat area.
Infrastructure3.1.5
WaterThe Kamo node is currently reticulated by Council’s piped services, with the main water source being the Whau Valley Dam and its accompanying water catchment. This water is treated at the Whau Valley Water Treatment Station, before being stored at the Dip Road Reservoir. The main water system reaches as far north as Snake Hill Road, as far west as the residential properties just past Lake Ora Road, eastwards throughout the residential areas, and up the whole of Whau Valley. A second major water pipeline follows Vinegar Hill Road and passes the Fonterra Dairy Factory before reaching Hikurangi. Limiting factors in terms of future growth patterns are the Kamo pumps and pipelines.
In order to meet future water requirements resulting from population growth, several activities would need to be undertaken. These would include the construction of a second reservoir at Dip Road (4,500m³), some renewal and resizing of the trunk pipeline to main reservoirs, and a requirement to upsize and renew the Kamo pumps. The overall costs of developing a 4,500m³ reservoir, pumps and trunk line renewal for this node are estimated at $4.5 million.
WastewaterThe Kamo node is currently reticulated by Council’s piped services, with wastewater disposal occurring at the main wastewater treatment plant at Kioreroa Road. It is known that parts of the network are currently at capacity, with known areas of surcharge during rain events. The wastewater system reaches as far north as Snake Hill Road, and west along Three Mile Bush to Lake Ora Road. In terms of Whau Valley, the sewage system reaches as far as the property at 149 Whau Valley Road. Otherwise, the residential areas in Kamo are serviced by Council’s wastewater services.
Several activities are required to meet future population growth. These include reticulation upgrades and/or installation of new trunk sewers, and an increase in capacity at the existing wastewater treatment plant or a new treatment plant. If some properties in the Kamo area are larger than 2,000m² and soakage is adequate, then individual onsite wastewater treatment and
the district. There are two walls running parallel to Three Mile Bush Road for approximately 3km heading west from Smithville Road.
Despite its long history, Kamo has no buildings or sites registered with the Historic Places Trust. But, it does contain 27 recorded archaeological sites, and 14 sites containing heritage tree(s) have been listed for protection in the Whangarei District Plan. Additional historic features listed in the District Plan include Moehau House, the old school house on Station Road and the stone bridge off Tuatara Drive. The stone walls along Three Mile Bush Road are evidence of the history associated with this area, and there are provisions in the District Plan intended to protect these.
Economy3.1.4
Business Profile and ProjectionsKamo is well served by a range of local businesses. The business community comprises retail facilities such as a small supermarket, cafes, butcher, a post office, bookshops, hairdresser, a hardware store, some restaurants and takeaway facilities, liquor stores, and a variety of other service shops. It is estimated that approximately 59% of the population lives within 500m of the shopping centre, and that 61% of the population live within 500m of the public bus service.
Over time, it is expected that the numbers close to the shopping centre will remain reasonably static as more intensive development occurs in close proximity. In addition, there is also a range of professional services found in the area, including real estate, accountancy and financial services.
In 2006, 4,605 employees lived within the Kamo area. The main industry sectors were retail trade, construction, and health and community services. In general terms, employee occupations were concentrated in legislators, managers and administrators (17%), professional (18%), and technician (15%) categories. It is expected that the number of employees living within the Kamo area will increase from 4,605 in 2006, to 6,387 in 2041, and to 7,582 in 2061. Around 46% of the population of Kamo is in some form of employment.
The numbers of people who work within the node are substantially smaller, around 1,896 in 2006. The main employment sectors in this case included health and community services, education and training, and construction industries. Their listed occupations included professional (24%), legislator, manager and administrator (17%), and community workers (14%). The number of employees who work within the Kamo area is expected to increase from 1,896 in 2006 to 2,623 in 2041 and to 3,114 in 2061.
These results differ somewhat from data sourced from the Statistics New Zealand Business Survey 2007, which contacts all of the registered businesses in the district. According to this data, Kamo is the second largest centre of employment in the district, with approximately 2,750 employees working within the node. There were 951 businesses located within Kamo, including 241 that employed between 1-9 staff, and 65 employed more than nine staff. Kamo also contains 650 sole-operator/self-employed businesses.
Major employment sectors within Kamo include manufacturing, health and community services, and education. The largest employers are spread throughout the area and include manufacturing and construction within Springs Flat, health and community services in Kamo West and Whau Valley, education providers in Kamo East, and retail trade in the village itself. Many of these industries, especially construction, health, and education would be expected to maintain their presence and probably grow over the next 50 years.

140: Whangarei District Growth Strategy
PAR
T D
: SU
STA
INA
BLE
FU
TUR
E 30
/50
Place Bush Reserve, Hodges Park Esplanade Reserve, Kamo Cemetery, and Bonselaar Bush Reserve. In total, Kamo contains approximately 65ha of reserve land. In terms of the wider area, parts of Kamo abut the Pukenui Forest Reserve.
An analysis of ‘Neighbourhood’, ‘Sports’ and ‘Other’ parks found -5.52ha, -0.35ha and -27.50ha of capacity respectively. It is this last figure which is of concern, as it suggests a relative paucity of passive recreational opportunities in the area. Whilst there have been previous plans to develop a central small reserve within the village which would contribute to the Kamo identity and attractiveness of the business area, these plans have been put on hold in the short term. However, they will need to be reconsidered over the longer term.
It is anticipated that more land is required for further parks and reserves to meet existing service levels as well as population growth. Such activities would include the purchase of a further 15ha of local parks, some 7ha of sports fields, 10ha for a destination reserve and approximately 24ha of green space or natural areas. As well as the land, it is expected that other facilities will be constructed within present and future reserve areas. The cost for these works is estimated at $23.1 million over 50 years. This is a substantial level of future park requirements to meet present service levels.
Kamo Sports FieldFigure 100:
Summary3.1.6
Kamo has been one of the fastest growing urban areas in Whangarei District, and this growth looks set to continue. A continuation of recent levels of growth would mean that Kamo remains the second highest population centre over the timeframe of the Growth Strategy. Within Kamo, there are a high number of existing vacant lots. There is also some capacity for further subdivision development under the District Plan. Structure Plan options enhance this potential considerably. Constraints will have a limited impact on the subdivision development potential, except for the areas of higher class soils west of Kamo, which will require careful planning if they are to be protected from residential and rural residential development. Further actions to improve Kamo’s prospects include enhancement of the local reserve network and commercial areas to meet the needs of a larger population.
disposal systems may prove acceptable with a subsequent reduction in the cost and need for council to upgrade its assets. However, given the lower growth in households outside of the Kamo urban area, the final cost estimate is not expected to reduce greatly. The overall estimate of cost for wastewater growth related works is approximately $16 million.
StormwaterThe stormwater network is sufficient to service a 1 in 5 year rainfall event, with some property flooding occurring during more extreme events. Reticulation will require renewal/rehabilitation as necessary. In alignment with current best practice, future stormwater management is envisaged to be a continuation of current stormwater policies (through the Environmental Engineering Standards). Under these policies, a developer is required to undertake onsite attenuation and treatment of stormwater generated by their development. This generally results in little impact to the existing Council stormwater network. Upgrades required are undertaken by the developer with possible Council contribution where an existing asset has limited remaining life. Under this approach Council does not itself undertake projects involving creation of new stormwater infrastructure.
Several stormwater management plans are relevant to Kamo, including the Waiarohia Stream Catchment Drainage Plan (1998), and the Waitaua Stream Catchment Drainage Plan (1995), with the Waitaua Plan in the process of being reviewed and updated.
TransportationThe Kamo node is currently serviced by a roading network that can cater for close to 50,000 vehicle movements per day. The vehicle movements are projected to rise to approximately 85,000 per day by 2061. There are no known backlog requirements in the node that cannot be met under existing programmes. Little in the way of major additional works are required for meeting Kamo’s future roading needs, apart from activities that are already underway, including the upgrade of the Kamo Bypass. Overall, growth related costs are estimated at $5.2 million.
Kamo has a reasonably high number of road types and lengths within its boundaries. These include 6km of State Highway 1, 10km of arterial routes to cater for higher traffic flows, 14km of collector roads, and 39km of public roads mainly serving the residential population.
Stage 2 of the Kamo Bypass involves extending the length of the bypass to the south, with the southern connection extending to the existing State Highway at Western Hills Drive. In conjunction with the Spedding Road Link, the bypass is anticipated to provide greater capacity for north-south traffic on State Highway 1, reducing travel times through Whangarei and also drawing through traffic away from the local road network and residential areas. Further, with the implementation of the bypass, greater opportunity exists for implementing walking/cycling measures on the portion of Kamo Road that will be bypassed. Both the bypass and the Spedding Road Link are listed as priority 1 projects in the Statement of Intent produced by the New Zealand Transport Agency for State Highway 1 in Whangarei. The project has been allocated $7.7 million in 2009/10 and $7.9 million in 2010/11.
Parks and ReservesSurprisingly, parks and reserves are few in number and small in size within the Kamo node, with Kamo Sports Ground and the adjacent park being the main areas. Other parks located within the node include: Taylor Street Reserve, Charles Street Reserve, Escalona Street Reserve, Mariposa Place Reserve, Eden Terrace Reserve, Sequoia Place Bush Reserve, Hodges Park, Te Paka Crescent Reserve, Brunner Terrace Reserve, Fisher Terrace Reserve, Grant Street Reserve, Pebble Beach Berm and Reserve Area, Tait Street Reserve/Playground and Wetland, Granfield
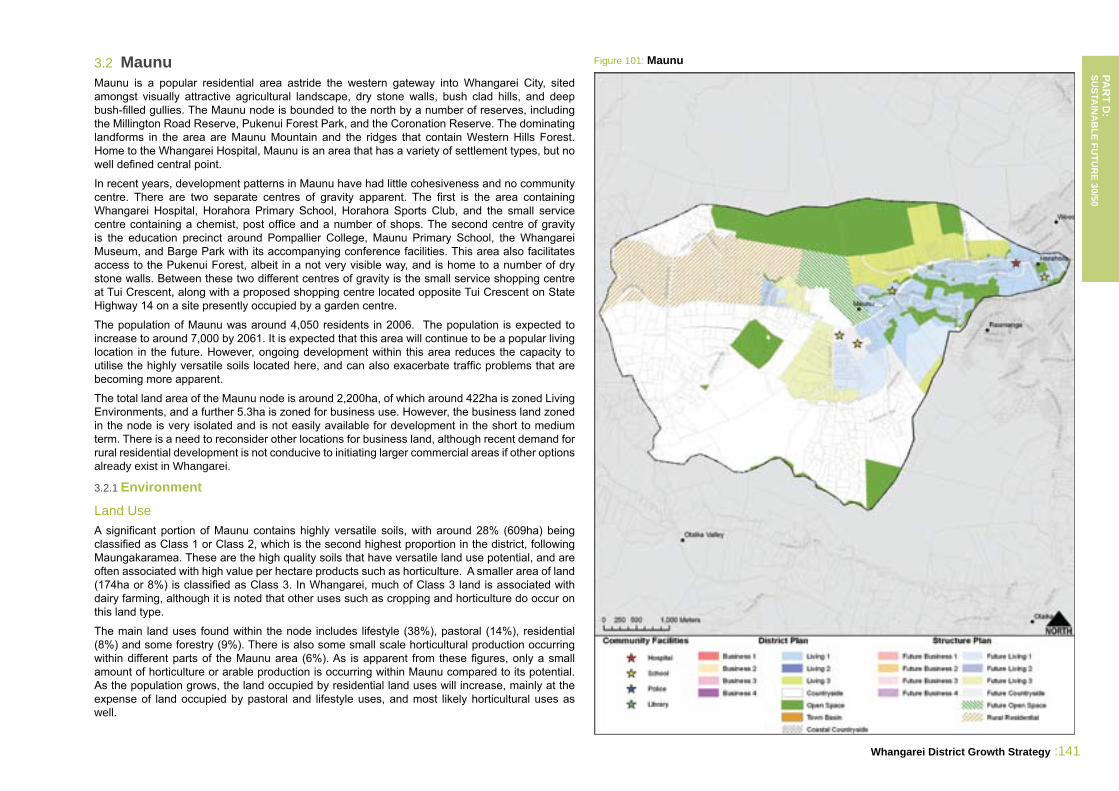
Whangarei District Growth Strategy :141
PAR
T D:
SUSTA
INA
BLE FU
TUR
E 30/50
MaunuFigure 101: Maunu3.2 Maunu is a popular residential area astride the western gateway into Whangarei City, sited amongst visually attractive agricultural landscape, dry stone walls, bush clad hills, and deep bush-filled gullies. The Maunu node is bounded to the north by a number of reserves, including the Millington Road Reserve, Pukenui Forest Park, and the Coronation Reserve. The dominating landforms in the area are Maunu Mountain and the ridges that contain Western Hills Forest. Home to the Whangarei Hospital, Maunu is an area that has a variety of settlement types, but no well defined central point.
In recent years, development patterns in Maunu have had little cohesiveness and no community centre. There are two separate centres of gravity apparent. The first is the area containing Whangarei Hospital, Horahora Primary School, Horahora Sports Club, and the small service centre containing a chemist, post office and a number of shops. The second centre of gravity is the education precinct around Pompallier College, Maunu Primary School, the Whangarei Museum, and Barge Park with its accompanying conference facilities. This area also facilitates access to the Pukenui Forest, albeit in a not very visible way, and is home to a number of dry stone walls. Between these two different centres of gravity is the small service shopping centre at Tui Crescent, along with a proposed shopping centre located opposite Tui Crescent on State Highway 14 on a site presently occupied by a garden centre.
The population of Maunu was around 4,050 residents in 2006. The population is expected to increase to around 7,000 by 2061. It is expected that this area will continue to be a popular living location in the future. However, ongoing development within this area reduces the capacity to utilise the highly versatile soils located here, and can also exacerbate traffic problems that are becoming more apparent.
The total land area of the Maunu node is around 2,200ha, of which around 422ha is zoned Living Environments, and a further 5.3ha is zoned for business use. However, the business land zoned in the node is very isolated and is not easily available for development in the short to medium term. There is a need to reconsider other locations for business land, although recent demand for rural residential development is not conducive to initiating larger commercial areas if other options already exist in Whangarei.
Environment3.2.1
Land UseA significant portion of Maunu contains highly versatile soils, with around 28% (609ha) being classified as Class 1 or Class 2, which is the second highest proportion in the district, following Maungakaramea. These are the high quality soils that have versatile land use potential, and are often associated with high value per hectare products such as horticulture. A smaller area of land (174ha or 8%) is classified as Class 3. In Whangarei, much of Class 3 land is associated with dairy farming, although it is noted that other uses such as cropping and horticulture do occur on this land type.
The main land uses found within the node includes lifestyle (38%), pastoral (14%), residential (8%) and some forestry (9%). There is also some small scale horticultural production occurring within different parts of the Maunu area (6%). As is apparent from these figures, only a small amount of horticulture or arable production is occurring within Maunu compared to its potential. As the population grows, the land occupied by residential land uses will increase, mainly at the expense of land occupied by pastoral and lifestyle uses, and most likely horticultural uses as well.

142: Whangarei District Growth Strategy
PAR
T D
: SU
STA
INA
BLE
FU
TUR
E 30
/50
around Te Hihi Stream are also rare habitats within the Whangarei Ecological District. A large area of the Maunu node is also identified as kiwi habitat (Pukenui Forest).
Around 443ha or 20% of the nodal area is formally protected by Department of Conservation reserve, Council reserve, esplanade reserve or private covenanting. This includes 305ha (60%) of PNA areas (areas of ecological significance). Thirty-three percent of the total node area (733ha) is classified as acutely or chronically threatened (<20% indigenous vegetation cover remaining). A break down of acutely and chronically threatened environments within the PNAs, and the amount and type of formal protection in these is shown in Table 71. This table suggests that there are limited bush fragments remaining in Maunu, but of those that exist, 44% are legally protected, mainly in Council reserves.
Significant Natural Areas and Formal Protection of These Within Acutely and Table 71: Chronically Threatened Environments
Area of PNA within Acutely or Chronically Threatened Environment (ha)
Area of Formal Protection within area of PNA that is Acutely or Chronically Threatened (ha)Conservation Covenant
QEII Esplanade DoC WDC Park/ Reserve
Total (ha) Proportion Protected
40.14 2.63 1.52 0.06 13.31 17.51 44%
Source: Whangarei District Council, Department of Conservation, Land Environments New Zealand.
Landscape/Natural CharacterThe landscape in Maunu is highly regarded, particularly for an urban node, and accounts for much of its recent popularity as a place to live. Approximately one third (31%) of the node around Pukenui Forest and Maunu Mountain is regarded as notable landscape as identified in the District Plan (Landscape Sensitivity 6). These areas provide a native bush backdrop to the node, with little or no development, and impart a high degree of naturalness to the surrounding landscape.
Much of Maunu is also considered to be an attractive pastoral and bush landscape with cultural heritage values (Landscape Sensitivity 5). Extensive dry stone walling imparts a European heritage, which is reinforced by scattered thorn hedgerows, copses, and historic homesteads including Clarke Homestead. Maunu Mountain also provides a sense of place, and acts as a landmark in an otherwise flat/rolling landscape. It is the only Outstanding Natural Feature and Geological Site in the node.
Ecosystem ServicesWater recharge of the aquifers, and the role of biodiversity in cleansing the water, is probably the most important ecosystem service in terms of the wider node. Other ecosystem services of some importance in the node include food and fibre provision, erosion control, pest regulation, flood attenuation, limited pollination, and nutrient cycling.
As the population grows, the potential for food and fibre services will reduce. However, as present land uses do not reflect the potential of this land, this may not be of significance to the wider community. Offsetting this, the growth of lifestyle properties in Maunu has enabled habitat restoration in some circumstances, creating more potential for the generation of ecosystem services. Conversely, growth in lifestyle blocks can have an impact on groundwater and streams, both in terms of quantity and quality, and fragmentation of bush on the edge of Pukenui Forest will reduce generation of some ecosystem services.
Many of the elite soils in Maunu have experienced subdivision activity as larger blocks are turned into small titles for urban land use and rural lifestyle blocks. The retention of this scarce land resource for primary production for the foreseeable needs of future generations is a valid land use issue. If this land is not protected from residential and lifestyle development, this valuable resource will be lost within a relatively short space of time.
Water ResourcesMany small streams flow through the Maunu node, approximately 35km in total. These streams include Nihotetea Stream, Kirikiri Stream, Raumanga Stream, Te Hihi Stream, and Waiponamu Stream. Maunu is comprised of three water catchment areas including Kirikiri, Otaika, and Raumanga Catchments. The portion of Maunu in the Otaika Catchment rises in a small amount of indigenous and exotic forest in the upper reaches between Cemetery Road and Otaika Valley Bush, then flows into residential areas, and on through industrial areas before reaching the harbour.
The Kirikiri Catchment area is a very small system, rising in the Pukenui Forest, and making its way into Whangarei Harbour. The Kirikiri Catchment area contains three main land uses, these being forestry, mining/quarrying, and residential development in the lowest part of the catchment. The Raumanga Catchment is the most mixed catchment in terms of land use, with residential, horticulture, lifestyle, pastoral, and reserves all being found within its catchment area. It rises near the southern ridges of Pukenui Falls and as far west as Millington Road. Most of the Maunu node is contained within this catchment area.
Northland Regional Council has identified an aquifer within the study area that has a high actual or potential risk of demand for water extraction. This is called the Maunu Aquifer, which is shared with Maungatapere. Ongoing residential development poses a risk to this aquifer, in regards to both water quality and water quantity, especially as much recharge comes directly from rainfall.
Natural HazardsA small portion of the Maunu node is regarded as being flood susceptible (around 95ha or 4% of the total area of the node). However, a large proportion of land parcels (19% of the total) are found in flood susceptible areas, especially in the Kirikiri Catchment area. This illustrates the ongoing attractiveness of living close to waterways. However, it is noted that whilst this area is not often affected by flooding, it does have an influence of the scale and extent of flooding elsewhere in the Whangarei City, especially in those areas used for commercial or light industry uses.
BiodiversityA large proportion of the Maunu area is regarded as significant natural habitat, encompassing around 510ha or 23% of the total nodal area. This is the highest proportion of the five urban nodes. Significant habitat in the vicinity includes Millington Road Remnants (Q07/055), Cemetery Road Remnants (Q07/056), Te Hihi Stream (Q07/060), Raumanga Valley Stream (Q07/048), Pukenui Forest (Q07/022) and Otaika Valley Bush (Q07/023). Bordering the node boundary is Maunu Mountain, also a significant ecological site and geo-preservation site of regional importance (volcanic cone). These ecological areas are important in that they provide habitat for threatened and regionally significant species.
Pukenui Forest is also the largest remaining contiguous area of forest left in the Whangarei Ecological District, and provides the catchment area for the Whau Valley Dam. The volcanic broadleaf forest remnants on Cemetery and Millington Roads are examples of a nationally rare forest type, and the riverine forest remnants of Raumanga Valley wetland and swamp forest

Whangarei District Growth Strategy :143
PAR
T D:
SUSTA
INA
BLE FU
TUR
E 30/50
of existing vacant lots outside of the Living Environments could meet demand over the medium term.
Residential Land Area Required to Meet Projected DemandTable 73:
2006 (estimate) 2011 (projected) 2041 (projected) 2061 (projected)Total urban residential land area(ha) 148 157 225 288New urban residential land area (ha) - 9.5 77 140Total rural/residential land area (ha) 193 205 243 250New rural/residential land (ha) - 12 50 57
Supply, in this case, refers to the availability of actual or potential vacant lots to accommodate future population growth and the capacity to undertake subdivision should future growth patterns warrant it.
Capacity Under the Whangarei District Plan and Applicable Structure PlanTable 74:
District Plan Living 1,2,3 (maximum)
District Plan Living 1,2,3
(constrained)
Structure Plan Living 1,2,3 (maximum)
Structure Plan Living 1,2,3
(constrained)Population 7,027 3,776 13,152 7,469Maximum households (lots) 2,928 1,573 5,480 3,112Potential for new lot creation (2011) 1,472 117 4,024 1,656Projected year capacity exhausted 2090 2020 2223 2100
Present development potential under the Whangarei District Plan and the Maunu Structure Plan is noted in Table 74. Two types of estimates for capacity are given for both District Plan and Structure Plan. The first estimate is the theoretical maximum number of lots that can be created based upon all available land (by land area) being utilised. Present lots that are too small to subdivide are excluded from this calculation, as are those sites which are designated in the District Plan. The second type takes into account biophysical constraints that may reduce potential capacity. In this calculation the factors of flood susceptibility, significant natural habitat, and high land stability were applied, in addition to the exclusion of small lots and designated land. The final number of households or lots is likely to be between the two estimates, as no constraint is absolute.
The main concern for Maunu, at the present time, is a lack of capacity for developing Living 1, 2 or 3 lots, especially under the constrained capacity. The popularity of Maunu would suggest that existing vacant lots would be exhausted within the next 10 years, and the potential for more to be created under the present zoning, taking account of existing constraints, is low. More Living Environment land identified in the Maunu Structure Plan may need to be rezoned in the District Plan within the next 10 years.
Education, Health, and SafetyThere are four schools located within the Maunu node – Horahora and Maunu Primary Schools, Northland Health Camp School and Pompallier College. School deciles range from 1-9, and the school roll across all schools was 861 in 2009. Approximately 60% of the Maunu population is within 500m of a school (including the Maunu Children’s Health Camp), reflecting the urban fringe location and lower residential densities.
Draft projections from the Ministry of Education indicate that the existing schools in the Whangarei District have sufficient capacity to cope with predicted increases in population over the next 20 years. Although there is capacity, future planning for population growth will have to take the provision of services, including schools, into account. If further schools are required, suitable areas of land need to be set aside in advance of further development, to ensure the schools are optimally located. At projected growth rates, it is unlikely any new schools in the Maunu node
Climate ChangeThere are no specific impacts of climate change projected for the Maunu area, except for potential influences on downstream flooding. In terms of natural hazards, exacerbation by climate change is not expected to have a major effect. However, the higher level of climate variability may create concerns around water security over the longer term, especially in terms of the Maunu-Maungatapere Aquifer and the irrigation systems already in place. Climate change may present opportunities for production of alternative food crops, but this may be limited as the population expands onto existing farmland.
Society3.2.2
The median household income in the node is $47,300, which is around 10% higher than the district average of $43,900. Around 24% of the population is categorised as more deprived under the Deprivation Index. This is one of the lower deprivation figures in the district.
The median age of residents within Maunu is 41.3 years, 2.9 years older than the average age in the Whangarei District. In 2006, approximately 26% of the population was 20 years or younger, which is the smallest proportion amongst the Whangarei urban areas. Nineteen percent of the population was aged 65 years and over in 2006. This proportion is expected to increase to 34% in 2041, and to 39% by 2061. By 2061, approximately 2,600 residents in the Maunu node will be over the age of 65 years, up from 750 people in 2006. This is equivalent to an increase of 247% (or around 4.5% per annum).
Residential Land RequirementsEstimating future residential land requirements in Maunu is complex, with various factors such as increased population and declining household sizes needing to be considered. This is further compounded by expected future consolidation of settlement patterns, as well as the potential for declining average lot sizes within Maunu’s urban environment. Having a high projected proportion of the population over 65 in Maunu is also a factor. Assessment needs to take into account both demand and supply factors. Demand, in this case, needs to take into account the declining household size (from 2.6 to 2.4), and a probable small increase in consolidation to more urban dwellings.
The present split between households in Maunu is 79/21, with around 1,300 households within the Living Environments, and 327 households outside them. Over time, a target split of 85/15 by 2061 is preferable, which would result in a doubling of households in the urban areas, and a small increase in households outside of the Living Environments.
Projected Population and Household Residential DemandTable 72:
2006 (Census)
2011 (projected)
2041 (projected)
2061 (projected)
Existing vacant lots
Existing vacant lot
shortfall (year)
Population 4,047 4,308 5,706 6,774 - -Total households (lots) 1,556 1,656 2,403 2,823 223 -Households (Living 1,2,3) 1,229 1,308 1,872 2,399 148 2016Households (rural/residential) 327 348 411 423 75 2036
The average Living Environment lot size in Maunu is 0.12ha, whilst the average rural residential parcel outside of the Living Environments is 0.59ha. Based upon existing average residential lot sizes, this would equate to 140ha of new urban land required by 2061, and 57ha of rural residential land taken up outside of the Living Environments. It is noted that the high number

144: Whangarei District Growth Strategy
PAR
T D
: SU
STA
INA
BLE
FU
TUR
E 30
/50
Culture3.2.3
Tangata Whenua Maunu is located within the rohe of Ngapuhi, and the hapu groups in the area are: Te Parawhau and Te Uriroroi. There are no marae recorded within the node area. Around 4% or 85ha of the Maunu area is classified as being Maori land.
There are two sites of significance to Maori identified in the District Plan in the node, included on a Maori reserve (wahi tapu). Other important features include Pukawakawa Pa (hospital area), Pa in the valley at the end of Puriri Park Road, the Limestone area above the hospital along Nikau Place and waterfall, and the Silverstream area. Significant landscapes include: Omaunu, Maungatapere, Te Umu Pāhaha, Te Wai o te Tuna, Ringa, Pukenui and Rua Whakautu. Further sites of significance to Maori may be identified in future, particularly with the development of Iwi Management Plans.
Archaeological sites of Maori association in the node include two artefact finds, two botanical evidence finds, two burial sites, five pa sites, four Maori horticulture finds, 14 midden/ovens and 41 pit/terraces – a total of 70. Further archaeological sites may also be found in future.
Arts, Culture and Civic AmenitiesMaunu node includes a number of civic amenities and recreational facilities, such as the Museum and Heritage Park, Barge Park Showgrounds which hosts the Whangarei Riding Therapy Centre and the Maunu Pony Club, the A and P Show and the Christmas in the Park event. The Horahora Rugby Union Football Club and the Sherwood Park Golf Club are also in this area. These features contribute to the relatively high amenity value in the node.
The Whangarei Museum and Kiwi House, incorporating the Clarke Homestead and other historical buildings and educational centres (i.e. Oruaiti Chapel, Whangarei Women’s Jail, Jane Mander Study and the Riponui Pah School, and Whangarei Native Bird Recovery Centre) are located at Heritage Park in Maunu. The Museum and Kiwi House is an important repository of local history popular with locals and visitors alike. The Museum contains collections of natural and human heritage reflecting the interaction between natural and human history in Northland. The expansion of Whangarei Museum and Kiwi House is currently underway.
Four churches are located within Maunu. The local bus service has a limited timetable, but 91% of the population is located within 500m of a bus stop. There is only one public toilet facility in the area, located in Barge Park. At present there is no local library, and a branch library would be required to meet services level for the anticipated levels of growth. However, this may not be a high priority due to the easy access to the central library. Maunu’s closest beaches are located around 30km to Ruakaka Beach and around 40km to Ocean Beach.
Historic/Cultural HeritageThe original settling of Whangarei began with Ngapuhi, descendants of the voyagers from the Mamari Canoe that arrived at the Hokianga Harbour. It is recorded that a Maori explorer, Tapere, with his lieutenant Maunu, first discovered and named the two close volcanic cones, Tapere and Maunu. A chain of Maori settlements developed from Raumanga to Poroti. Identified Maori heritage sites and archaeological sites illustrate the heritage and cultural values of the wider Maunu area.
The Maunu plateau was occupied by Europeans much later than some other rural areas around Whangarei. In the 1870s the first European settlers arrived. General farming and dairying were the main industries of early Maunu European settlers from the 1890s. Maunu is characterised by
will be required over the medium term. There may be a need for a new primary school over the longer term.
There are two medical centres and one chemist located in the Maunu area. The Whangarei Hospital is also located within the node, which is the regional medical facility for Northland. Hospital level aged care facilities are also available at Selwyn Park Rest Home. Approximately 68% of the population is within 500m of a medical centre or the hospital, with the rest being in the rural lifestyle areas.
The Northland District Health Board has undertaken extensive modelling work to plan for the future use and development of Whangarei Hospital. Given the projected population growth and demographic changes in the district, the Board is planning to ensure appropriate services will be in place to cope with future demands. Planning is for a 20 year time period, and as the hospital will be expanded and remodelled over this timeframe, a new hospital in the district is not envisaged over the next 30/50 years.
As suburban nodes, including Maunu, grow, there will be an increase in demand for medical care in these areas. The Government is currently working with District Health Boards to establish Integrated Family Health Centres to provide comprehensive primary care in one location. Integrated Family Health Centres could be a suitable option for larger populations in urban villages like Maunu. However, Maunu’s hosting of the Whangarei Hospital would suggest that a local Integrated Health Centre would not be a high priority for this node.
There are two rest home/retirement village facilities located in the area. The number of people aged 65 and over is expected to increase significantly over the next 30/50 years. The ageing population will place additional demands on health care services, particularly an increased demand for rest home, hospital and dementia beds. There is likely to be increased demand in the Maunu node for such services.
There are no police or fire facilities in the node. Given the proximity to the main Police District Headquarters and fire station in Whangarei City, it is likely there will be no need for separate facilities to be located within in Maunu over the next 30/50 years.
Sense of Place/Urban DesignMaunu has been developed in a linear type settlement pattern along the state highway, with physical barriers comprised of hills to the north and south. This means that access to other parts of the City is limited and is mostly via Maunu Road. Include in this settlement mix the highly productive land in some parts of the node, the deep unstable bush gullies and streams, stone walls and the Pukenui and Otaika Valley Bush backdrops, and a reasonably complex landscape emerges.
Over time, a series of quite different character areas have developed in Maunu. In Horahora, older villas and houses are predominant, and give the area a heritage ‘feel’. The second area is in the vicinity of Barge Park and Puriri Park, which tends to combine a feeling of spaciousness with many trees creating a strong park-like feel in an area that saw expansion in the 1980s. In addition, there is a reasonably new brick and tile area along Pompallier Estate that is yet to develop a strong identity. Outside of these areas, many large modern dwellings can be found in locations popular for lifestyle reasons.
There are two retail areas in Maunu, a reasonable sized group of seven shops at the corner of Westend Avenue and Maunu Road, and a smaller group of shops at the corner of Tui Crescent and Maunu Road. Although amenity value in these centres is not high, there is potential to incorporate good urban design and improve amenities.

Whangarei District Growth Strategy :145
PAR
T D:
SUSTA
INA
BLE FU
TUR
E 30/50
Business Land RequirementsIn terms of business land requirements, Maunu does present something of an anomaly. With two small retail centres already present, and plans for a third in the future, Maunu probably has enough commercial capacity over the foreseeable future to meet the population projections, especially as much of the residential growth has been low density residential development that is vehicle dependent, and may readily use central City services in preference to closer businesses. Within the 50 year time frame, there may be a need for a new commercial centre including a local supermarket. This is likely to be located on the present fringe of the urban area, around Austin Road.
High levels of growth in low density development has led to a large population catchment that extends to Kokopu that would potentially use local businesses, but growth in Maungatapere may also take this pressure off Maunu. This additional population catchment may be enough to secure a small supermarket, but even this may not be achievable under low population densities. A more likely scenario is that the central City areas will continue to be the main shopping area in the intermediate future.
There is currently around 5ha of business zoned land in the Maunu area, accommodating around 500m² of business floor area. The business land area is expected to double by 2041 to 10ha and increase to 12ha by 2061. Business floor area is expected to increase at similar rates to the business zoned land area, from over 500m² in 2006 to over 700m² in 2041, and to almost 900m² in 2061. This business area is small, and includes the 5ha of land zoned Business 3 near the eastern boundary of the node, which has been removed from the Maunu Structure Plan, and is likely to be removed from the District Plan.
Business Projections, MaunuTable 75:
2006 2041 2061Business floor area (m²) 534 725 893Business land area (ha) 5.32 10.13 12.03Employees (by workplace) 1,719 3,215 3,816
Infrastructure3.2.5
WaterLike other urban nodes, Maunu is currently reticulated by Council’s piped services. The main source of water for the node is Poroti Stream, from where it is then treated at the Poroti Water Treatment Plant. The main storage point is the Cemetery Road Reservoir. The water system runs throughout Maunu, including much of Austin and Cemetery Roads. In addition to the reticulated system, there are also some bores within the area taking advantage of the local aquifer. Additional raw water takes are found at Maunu Springs, which is treated at the Ruddles Water Treatment Plant, also found on Cemetery Road, but much of this water is used in the Otaika node. The main limiting factor within the area is local reticulation as opposed to the main trunk line.
In terms of meeting future population needs, only a limited amount of works are required to meet projected demand. The main activity would be the development of a new storage reservoir at an estimated cost of $1.5 million.
WastewaterThe Maunu node is reticulated by Councils’ piped services, with treatment occurring at the main Wastewater Treatment Plant at Kioreroa Road. The wastewater system is spread throughout most of the older residential areas of Maunu, but it only reaches as far as Pompallier Estate
dry stone walls made from the volcanic rocks that were collected and cleared from the land to allow for farming, with the earliest walls dating back to 1870.
The stone walls lining State Highway 14, and the roads branching off it, are an important factor in the amenity values across Maunu. Many of these stone walls were built by the Dalmatians during World War I and the Depression, when work ran out on the gum fields. There is approximately 22km of stone walls located in Maunu, which account for 14% of the stone walls located in the district.
Maunu School was opened in 1884, while St John’s Anglican Church dates back to the early 1900s. In 1894, Whangarei’s first hospital was built in Horahora. The current hospital stands on the same site, and has expanded quite considerably over the years. Maunu contains some strongly visible historic heritage values, with 74 archaeological sites and 18 heritage trees located within the node. As well as these sites, four buildings are registered on the Historic Places Trust Register, including Clarke Homestead, Carruth House, McDonald House, and the Oruaiti Chapel.
Economy3.2.4
Business Profile and ProjectionsTwo small retail areas are located within the node, one near West End Avenue, and the second at the corner of Tui Crescent and State Highway 14. The West End retail centre has the wider range of available services of these two centres. Around 70% of the Maunu population is located within 500m of at least one of these two shopping centres. These shopping centres are also important for the wider population catchment living alongside State Highway 14 on the way to Dargaville, and around Kokopu.
In 2006, around 1,935 employees lived within the Maunu area. The main industries of employment were health and community services, retail trade, and construction, with the top three occupations being professionals, managers/administrators, and technicians. It is expected that the number of employees living within the Maunu area will increase from 1,935 in 2006 to 2,617 in 2041 and to 3,108 by 2061. Approximately 48% of the population is presently in some form of employment.
There were 1,720 people who worked within the Maunu area in 2006. The main employment sectors included health and community services, education and professional services, with over half of these being employed as professionals. The number of people who work within the Maunu area is expected to increase from 1,720 in 2006 to 3,215 in 2041 and to 3,816 by 2061. Given that the health and community services industry is projected to grow, especially as an ageing population requires further services, it is expected that a great bulk of future jobs will be created in the health and services industry.
According to the Statistics New Zealand Business Survey 2007, approximately 2,240 jobs are found within this node, including self-employed operators. There were 326 employers recorded, 242 of which were sole-operator/self-employed, and 66 small businesses that employed 1-9 staff members. Only 18 employers employed more than nine employees. The health and community services industry sector dominates employment, according to this survey. Outside of the health industry and its suppliers, there are few larger employers evident apart from schools.
Overall, this is one of the few localities in Whangarei District that has more jobs than the total number of employees living within the area. Obviously the Maunu node is quite dependent on the continued presence of Whangarei Hospital, and can also be expected to benefit from any future expansion plans. Over time, and with the increasingly aged population, demand for more health related services would be expected to increase.

146: Whangarei District Growth Strategy
PAR
T D
: SU
STA
INA
BLE
FU
TUR
E 30
/50
Parks and ReservesOverall, Maunu is relatively well served by public reserves, with around 183ha of parks and reserves found in the area, although there are limited public sports fields. Much of this reserve land is contained within the Pukenui Reserve and Barge Park facilities, but there are smaller parks at Puriri Park and Horahora Sports Park. Other small reserves include Highfield Way Reserve, Ngahere Drive Reserve, and the Maunu Cemetery. There are also several step gully systems that are managed by the Parks Department, but are not easily accessible to the general public. There is a local sports club and the Sherwood Park Golf Club is also present in this study area.
An analysis of ‘Neighbourhood’, ‘Sports’ and ‘Other’ parks found 0.45ha, -1.45ha and 4.07ha of existing capacity, respectively. In order to meet future growth needs, it is anticipated that further purchases of around 7ha of green space or local parks is required, but also that 7ha of local sports park would also be required, some of which is to meet present service levels. It is noted that this node was very expensive for neighbourhood reserve development due to the popularity of the area for residential purposes. As well as the land, it is expected that other facilities would be constructed within present and future reserve areas. The estimated costs for these activities would be approximately $6.5 million over the next 50 years.
Display at the Summer Show 2006, Barge ParkFigure 102:
Summary3.2.6
Maunu is the western gateway into Whangarei City, and has seen high levels of population growth in recent years. There are medium to high numbers of existing vacant lots available in the area. Whilst there is existing capacity for increasing residential lot numbers under both the District Plan and Structure Plan, some of this land is constrained by natural hazards or is not easily accessible. Identifying additional opportunities for urban residential development appears prudent. However, given the high productive soil qualities in the areas, development needs to be carefully managed.
Another key issue in the area is the transportation network. Continued population growth in Maunu, and in localities further west, means that transport will need to be carefully managed over time. In effect, there is only one road into Whangarei City and at times it is already experiencing high traffic flows. There is also a lack of business land or community centre in the area. Both issues will need to be addressed at some point in the future.
Drive. Other dwellings outside of this reticulated area use a variety of other means of wastewater disposal. Parts of the network are currently at capacity with known areas of surcharge during rain events.
To meet future needs, it is expected that reticulation upgrades and/or installation of new trunk sewers, and an increase in capacity of existing wastewater treatment plant or a new treatment plant is required. If some properties are larger than 2,000m² and onsite soakage is adequate, then individual onsite wastewater treatment and disposal systems may prove acceptable with a subsequent reduction in the cost and need for Council asset upgrades. This is likely to occur outside of the urban area, but there are ongoing concerns over the possible impact of ill maintained septic tanks on groundwater resources. The estimate cost of the required works is $5.25 million over the next 50 years, mainly needed around 2036.
StormwaterThe stormwater network is generally sufficient to service a 1 in 5 year rainfall event, while some property flooding will occur in extreme events. Reticulation will require renewal/rehabilitation as necessary. In alignment with current best practice, future stormwater management is envisaged to be a continuation of current stormwater policies (through the Environmental Engineering Standards). Under these policies, a developer is required to undertake onsite attenuation and treatment of stormwater generated by their development. This generally results in little impact to the existing Council stormwater network. Upgrades required are undertaken by the developer with possible Council contribution where an existing asset has limited remaining life.
Under this approach, Council does not itself undertake projects involving creation of new stormwater infrastructure. However, it is also noted that there are plans to develop a retention dam within the Maunu node for the purpose of reducing flooding within the central City area, which may lead to different stormwater management in the area. Two stormwater catchment management plans are in existence, and include the Kirikiri Catchment Drainage Plan (2001) and the Raumanga Catchment Drainage Plan (1999).
TransportationMaunu provides the western gateway into the City along State Highway 14. Approximately 7km of state highway passes through the node. This connects with State Highway 1 on the very fringes of the node, which is a critical juncture and is subject to future redevelopment. The Maunu node is currently serviced by a roading network catering for just under 16,000 vehicles per day. There are no known backlog requirements in the node that cannot be met under existing programmes. In addition to the state highway, there is over 1km of collector roads, and around 17km of public roading found within the node. This is a relatively small amount of public road for an urban node, and reflects the fairly linear settlement pattern.
Future potential roading projects in the node include a State Highway 1/State Highway 14 (Maunu Road) bypass. This will be a new two lane road (with cycle facilities) from State Highway 1 near Quarry Road in the south through to Maunu Road (State Highway 14) in the northwest. The link will provide direct access to State Highway 1 for properties in the Maunu area. It will also remove traffic from the State Highway 14/State Highway 1 intersection which is one of the most critical in Whangarei. An upgrade of this intersection has been committed to, and has been allocated $2.32 million in 2009/2010 and $1.69 million in 2010/2011.
A link from Raumanga to Maunu is also proposed for the node in future, linking Raumanga Road to State Highway 14. This is expected to improve connectivity between Maunu and Raumanga and also take pressure off the state highway network by providing an alternate route for local traffic.

Whangarei District Growth Strategy :147
PAR
T D:
SUSTA
INA
BLE FU
TUR
E 30/50
OtaikaFigure 103: Otaika3.3 Otaika is the southern gateway to Whangarei City, with residential, commercial and industrial land spreading out on either side of State Highway 1. For much of its recent history, Otaika has been associated with low-cost housing, although there are significant views of Whangarei Harbour and surrounds from parts of the settlement.
In recent years, development within the area has switched focus from residential to commercial/industrial, with a substantial increase in the availability, and uptake, of industrial and commercial land. There is also potential to increase this business development further. The growth in business potential, combined with other development around Otaika and within the old Whangarei port area, means that transport remains a critical issue for ongoing development of the node.
The population of the Otaika area was over 5,000 people in 2006. This is projected to increase to almost 7,000 people by 2041, and to over 8,000 by 2061. The total land area of the Otaika node is around 1,300ha, of which 319ha is zoned Living 1, 2 or 3, and a further 135ha is zoned business (commercial and/or industrial). Otaika has seen a reasonably high level of growth and development in business land in recent years, and this is likely to continue. There may be some constraints around future residential development in the area, with instability a key natural hazard in the node, especially west of the Raumanga area.
Environment3.3.1
Land Use In terms of land capability, only very small pockets of highly versatile soil exist within the node, with around 140ha of Class 3 soils, and around 3ha of Class 1 and Class 2 soils being found. The main land uses within the node include lifestyle (25%), residential (17%), pastoral (11%), industrial/commercial (9%) and some forestry. Land occupied by quarrying use is significant at 11% of the total land area of Otaika. As the population grows, the land occupied by residential, industrial and commercial uses will grow. This is likely to be at the expense of lifestyle and pastoral use.
The majority of the land in Otaika is comprised of the Mangakahia and Motatau Complex that includes Whangarei Formation Mudstone, Omahuta Sandstone and Mahurangi Sandstone. Towards the west of the study area, Whangarei Limestone, Ruatangata Sandstone, as well as greywacke and argillite are present. Several deep-seated, ancient, large landslides have been identified in areas underlain by Whangarei Formation Mudstone or Omahuta Sandstone. This geology tends to result in widespread risk of land instability. The study area also contains alluvial estuarine deposits around the coastal fringes.
The Otaika Quarry, operated by Winstone Aggregates, is one of only two quarries in Northland that produces more than 500,000 tonnes of rock aggregate per year. It is also one of only five producing sealing chip, concrete aggregates and other high quality products. There are only a few of these quarries, in part due to the high cost of operating associated crushing equipment. Their location is generally dictated by market requirements, and they provide a distribution network that minimises trucking distance in supplying major sealed roads and other markets.
Future population increases, and subsequent growth in the demand for infrastructure will increase the demand for aggregate. Northland may become a strategic supplier to the Auckland Region, as its aggregate resources become compromised by residential development. Some aggregate is already transported from quarries in the south of Northland, and there is potential for more, including transport by barge.

148: Whangarei District Growth Strategy
PAR
T D
: SU
STA
INA
BLE
FU
TUR
E 30
/50
Around 221ha or 17% of the nodal area is formally protected by Department of Conservation reserve, Council reserve, esplanade reserve or private covenanting. This includes 147ha (64%) of PNA areas (areas of ecological significance). Sixteen percent of the total node area (204ha) is classified as acutely or chronically threatened (<20% indigenous vegetation cover remaining). A break down of acutely and chronically threatened environments within the PNAs, and the amount and type of formal protection in these is shown in Table 76.
Significant Natural Areas and Formal Protection of These Within Acutely and Table 76: Chronically Threatened Environments
Area of PNA within Acutely or Chronically Threatened Environment (ha)
Area of Formal Protection within area of PNA that is Acutely or Chronically Threatened (ha)Conservation Covenant
QEII Esplanade DoC WDC Park/ Reserve
Total (ha) Proportion Protected
0.17 0.01 0.15 0.16 96%
Source: Whangarei District Council, Department of Conservation, Land Environments New Zealand.
Landscape/Natural CharacterThe Otaika node transitions from an urban landscape to a rural one heading south along State Highway 1. Bordering part of the urban area close to the City is the Otaika Valley Forest, including the Otaika Valley Scenic Reserve. This bush clad hill country provides a scenic natural backdrop for this part of the node, and is considered notable landscape in the District Plan. Overall, approximately 20% of the node is considered to be notable landscape (Landscape Sensitivity 6). In addition to this, a small amount (7%) of significant landscape (Landscape Sensitivity 5), identified in an initial landscape study of the district, can be found within the node. This landscape is mainly around Toe Toe Road, which has experienced recent lifestyle development.
Heading south out of the City, the node transitions into rolling to steep pasture with pockets of scrub/bush and forestry (south west hill country). These landscapes are characterised by variability, and reflect differing land uses and vegetation between properties. Built development tends to be scattered, and the scattered distribution of vegetation provides limited opportunity for screening by existing trees.
Ecosystem ServicesOtaika has benefited from vegetation, both indigenous and exotic, in managing the high land instability risk and wider erosion potential. Other ecosystem services of importance include water purification and waste treatment. Population growth in the area will continue to rely on land stabilising qualities and flood attenuation. Ongoing growth in industry, and an increase in traffic movements, means that air quality services will become increasingly relevant in the future.
Climate ChangeMost potential impacts for Otaika are similar to those that will be experienced by Whangarei District as a whole. Parts of Otaika are low lying, and may be subject to issues relating to future sea level rise that changes water and tidal flows in the area. In addition, projected increases in rainfall intensity would mean that vegetation in the uplands is possibly more important for managing risks relating to land instability and flood susceptibility. The risk in terms of increased land instability could be exacerbated due to the increased prevalence of extreme weather events over time. Similarly, low lying properties may also see increased flooding risks.
Water ResourcesThe Otaika node is situated within two catchment areas: a small portion of the Raumanga Catchment, and a much larger portion of the Whangarei South Catchment area. Several larger streams flow through this node, including Limeburners Creek and Otaika Creek. The total length of waterways in Otaika node is approximately 14km. The drainage systems for all catchments are, for the most part, comprised of natural stream and tidal channels. The major constrictions to stream flow occur where the various streams flow through culverts and bridged waterways (usually road bridges).
Two streams form a large part of the Whangarei South Catchment area. The Otaika Creek is a small waterway running along the southern edges of the node along the Otaika Valley. The Limeburners Creek Catchment covers the remainder of the Raumanga, Otaika and Toetoe areas to the south, and across the state highway to Port Road in the east. The Raumanga Stream flows beyond the northern boundaries of this node, but some of its catchment area is sourced from Raumanga. Three tributaries, the Hihi, Nihotetea and Waiponamu Streams, join the Raumanga Stream at Raumanga Valley Road.
Natural HazardsA large proportion of the Otaika area is flood susceptible, with about 210ha or 16% of the total land area being susceptible to flooding, and 30% of land parcels are found within flood susceptible areas. These parcels include both residential and commercial land.
Otaika also has substantial areas of land that have a high risk of instability. This risk covers 760ha of land, or nearly 60% of the node. Around 60% of land parcels are found in areas with a high risk of land instability, indicating difficulties in developing this area for residential use. This is also reflected in the ‘Residential Land Requirements’ section of this chapter. Much of the population of Otaika may be vulnerable to natural hazards, as resources are limited across much of the node.
BiodiversityThe significant natural areas within this node equate to approximately 230ha or 18% of the total area. There are a few larger areas of native forest around the south west of the node leading into the Otaika Valley Scenic Reserve, as well as smaller pockets scattered around the area. The southern boundary of the study area borders the Otaika Valley Bush, which is a diverse and large area of forest. It provides habitat for a number of threatened bird species, including kiwi, and fresh water fish species.
The north west corner of the Otaika node borders Raumanga Valley, which contains riverine vegetation and Kowhai – Karaka forest. Significant habitat in the vicinity also includes parts of Whangarei Harbour (Q07/058), Raumanga Stream (Q07/048), and Otaika Valley Bush (Q07/023). It is noted that significant amounts of exotic vegetation and weeds can also be found within the wider node.
These ecological areas are important in that they provide habitat for threatened and regionally significant species. Some sites also contain uncommon vegetation types (e.g. riverine forest) and may be the only record within the Ecological District. For example, the Raumanga Valley Forest is only one of two sites in the Ecological District where the regionally significant Hard Beech occurs. Whangarei Harbour is a particularly important habitat and breeding site for wading birds, including the nationally critical Fairy Tern and White Heron, and the mangrove forests bordering the harbour act as an important buffer from land use activities. Parts of the Otaika node area are also identified as being kiwi habitat.

Whangarei District Growth Strategy :149
PAR
T D:
SUSTA
INA
BLE FU
TUR
E 30/50
Residential Land Area Required to Meet Projected DemandTable 78:
2006 (estimate) 2011 (projected) 2041 (projected) 2061 (projected)Total urban residential land area(ha) 205 212 344 435New urban residential land area (ha) - 7 139 230Total rural/residential land area (ha) 68 70 104 103New rural/residential land (ha) - 2 36 35
Supply, in this case, refers to the availability of actual or potential vacant lots to accommodate future population growth and the capacity to undertake subdivision should future growth warrant it.
Capacity Under the Whangarei District Plan and Applicable Structure PlanTable 79:
District Plan Living 1,2,3 (maximum)
District Plan Living 1,2,3
(constrained)
Structure Plan Living 1,2,3 (maximum)
Structure Plan Living 1,2,3
(constrained)Population 8,007 4,594 8,119 4,594Maximum households (lots) 3,336 1,914* 3,383 1,914*Potential for new lot creation (2011) 1,759 337** 1,806 337**Projected year capacity exhausted 2073 - 2075 -
* Much of the population already lives in areas with high land instability risk. Overall, the present number of households exceeds the number of lots available without constraint. This calculation adds the present number of used and existing vacant lots to project the population at 2.4 people per household.
** The relatively large lot sizes in Otaika means that some existing lots don’t have any constraints and could be subdivided, which is why some potential remains, although it is questionable whether it will be feasible.
Present development potential under the Whangarei District Plan and the Otaika Structure Plan is noted in Table 79. Two types of estimates for capacity are given for both District Plan and Structure Plan. The first estimate is the theoretical maximum number of lots based upon all available land (by land area) being utilised. Present lots that are too small to subdivide are excluded from this calculation, as are those sites which are designated in the District Plan. The second type takes into account biophysical constraints that may reduce potential capacity. In this calculation the factors of flood susceptibility, significant natural habitat, and high land stability were applied, in addition to the exclusion of small lots and designated sites. The final number of households or lots is likely to be between the two estimates, as no constraint is absolute.
Otaika is one of three settlement nodes in the district in which natural hazards may be a limiting factor to large scale population growth over the long term. Much of the land with lower levels of natural hazard risks is being utilised for commercial and industrial uses. There is limited capacity to develop more lots without increasing the overall hazard risk.
Previously consented, but yet uncompleted, subdivisions allow for the creation of approximately 500 lots within the Otaika area. Beyond these, it is noted that most residential areas will expand onto locations with high levels of land instability, with continuing difficulties in enabling the level of growth indicated above. Some of the overflow population may have to locate to other areas such as Tikipunga. However, it is also noted that Otaika has one of the district’s older housing stocks, and there may be opportunities to develop new forms of residential development in the area that meet some of the population growth, as well potential development in rural residential areas near Toe Toe Road in the south of the node.
Education, Health, and SafetyNorthland Polytech is the region’s largest provider of tertiary education and the main campus is located within the Otaika node. There are also campuses and learning centres throughout
Society3.3.2
The median household income of Otaika node is $40,950, which is about 7% less than the district average of $43,900. However, of more importance is that a substantial proportion of the population is considered to be more deprived under the Deprivation Index, with Otaika being one of three locations in the district that has a deprivation rate over 80%. There also appears to be a high level of inequality in the area.
The population of Otaika is much younger than the rest of the Whangarei District. The median age in Otaika is 30.8 years, almost 8 years younger than the district’s median age. In 2006 the proportion of the population under 20 years of age was almost 40%, and 8% of the Otaika population was aged 65 years and over. The over 65 year age group is projected to increase to 15% by 2041, and to 17% by 2061. By 2061, it is expected that around 1,300 of Otaika’s residents will be over the age of 65, up from 417 people in 2006, which equates to an increase of 230% or 4% per annum.
Residential Land RequirementsEstimating future residential land requirements in Otaika is complex, with various factors such as population growth and declining household sizes needing to be considered. This is further compounded by expected future consolidation of settlement patterns as well as the potential for declining average lot sizes within the urban environment. Any assessment needs to take into account both demand and supply factors.
Demand, in this case, needs to take into account the declining household size (from 3.1 to 2.4) and a probable small increase in consolidation to more urban dwellings. The present split between households in Otaika is 89/11, with over 1,400 households within the Living Environments, and around 180 households outside of them. Over time, a target projection of 92/8 split by 2061 is preferable, which would result in over 3,100 households in the Living Environments and 270 households outside of the Living Environments.
There are limited numbers of existing vacant lots within the area, whether inside the urban area or outside of it and it is unlikely that the numbers will meet projected demand in the near future.
Projected Population and Household Residential DemandTable 77:
2006 2011 (projected)
2041 (projected)
2061 (projected)
Existing vacant lots
Existing vacant lot
shortfall (year)
Population 5,091 5,260 6,826 8,104 - -Total households (lots) 1,642 1,697 2,730 3,377 71 -Households (Living 1,2,3) 1,464 1,513 2,457 3,107 64 2012Households (rural/residential) 178 184 273 270 7 2012
The average size of a property zoned Living 1, 2 or 3 in Otaika is 0.14ha, whilst the average rural residential lot outside of the Living Environments is 0.4ha. Based upon existing average residential lot sizes, this would equate to over 230ha of new urban land being required, and 35ha of rural residential land being taken up outside of the Living Environments over the next 50 years.
Given the level of land instability constraints existing in this node, together with the expected expansion in business land, it may prove difficult to provide 230ha of land for new residential development.

150: Whangarei District Growth Strategy
PAR
T D
: SU
STA
INA
BLE
FU
TUR
E 30
/50
Otaika includes a number of valuable natural features such as Tarewa Park, Raumanga Falls and a number of important stream corridors. These features provide amenity values in the node. Otaika is the main entranceway corridor into Whangarei City from the south. Development of an attractive entranceway into Whangarei should include landscaping, lighting and appropriate signage. At the present time there is no well defined entrance to the City from the south.
Culture3.3.3
Tangata Whenua Otaika is located within the rohe of Ngapuhi, and the hapu groups in the area are: Te Parawhau, Uri o te Tangata, Te Uri o Hau and Te Uriroroi. The Northland Polytech marae (Te Puna O Te Matauranga) and the Toetoe Marae are located in the node, the Otaika Marae being just outside the node boundaries. About 7% of the node (93ha) is noted as being Maori land, and is located close to the estuary.
Two burial grounds are sites of significance to Maori located within the Otaika node. Also, Ruarangi Pa in Otaika Valley, and Raumanga Valley and waterfall are significant features to Maori. Significant landscapes include: Oruarangi, Toetoe, Tikorangi, Motu Kiwi, Onemama and Rewarewa. Further sites of significance to Maori may be identified in future, particularly with the development of Iwi Management Plans. Archaeological sites of Maori association in the node include one artefact find, two botanical evidence finds, three burial sites, three pa sites, five Maori horticulture sites, 27 midden/ovens, and 11 pit/terraces - a total of 52. Further archaeological sites may also be uncovered in future.
Arts, Culture and Civic AmenitiesThere are few civic amenities found in Otaika node. Two churches and two marae are within the node. The Visitor Information Centre situated in Tarewa Park provides amenity within the node. In addition, there is one community hall and two public toilets. It is about 2km from the Otaika shops to the CBD, which is very close. Approximately 83% of the population is within 500m of a bus stop.
Anticipated population growth may mean that a small branch library to meet community needs is required, but the close proximity to the CBD may mean that this is not a high priority. In terms of Otaika’s proximity to surf beaches, Otaika is over 25km from Ruakaka Beach, and over 35km from Ocean Beach.
Historic/Cultural HeritageThe area around Otaika, Toetoe, Raumanga, and Smeatons Drive has a long historical association with local iwi and hapu. Late in the eighteenth century (1700s), the great warrior chief, Tawhiro of Ngapuhi, occupied the pa at Motu-Kiwi. This area is just north of Portland on the west side of Whangarei Harbour and is also known as Tapu Point. The name Otaika is said to have come from the battle that was fought between Ngapuhi and Ngati-Maru from Hauraki. The pa fell to the invaders and many people were killed. The mouth of the Otaika River is close to the pa site and the river was supposedly crammed with bodies; so the battle was known as Otaika-timu, ‘the tide choked with bodies’. There are 53 known archaeological sites within the node.
Otaika and Raumanga were not sold to the Crown by Maori for European settlement, as these areas contained major longstanding Maori settlements. By the mid 1850s there were only a few settlers in the Otaika Valley to the south of the main node. However, the development of the kauri gum and timber industries changed this scenario as settlers came to harvest the gum, and timber was logged in the local forests. Land in and around Otaika and Raumanga was eventually bought by various settlers and the area became farm land over time. But little in the
Northland, and some courses are offered by flexible learning. A wide range of courses up to degree level are on offer, and one fifth of students are undertaking trade-related programmes. In 2008, 3,480 Equivalent Full Time Students were enrolled in the Polytech throughout Northland. It is unlikely that the Government will view the Whangarei District as a viable area to build a new university in the future, with Auckland being in close proximity. Northland Polytech will continue to be the primary tertiary institution for Northland. There is considerable opportunity to expand student numbers and upgrade the existing Otaika campus over the next 30/50 years.
There are two schools within the node, including He Mataariki School for Teen Parents and Manaia View School (formed in 2002 from the integration of Raumanga Primary and Intermediate Schools). The roll across both schools was 372 in 2009. Approximately 65% of the population is located within 500m of an educational facility.
Within the Otaika node, there is one medical centre and one chemist. Approximately 54% of the population is located within 500m of the medical centre. Most Otaika residents live in close proximity to the Whangarei Hospital, which is 2.5km from the Otaika shops using the state highway network. Integrated Family Health Centres could be a suitable option for larger populations in urban villages like Otaika. However, the close proximity of the hospital would probably mean that Otaika would not be a priority for hosting such a centre.
There is one respite care facility for elderly people located in the area. The number of people aged 65 and over is expected to increase, but at a lesser rate in Otaika than the rest of the district. It is likely that more rest home/retirement village facilities will be required within Otaika, but to a lesser degree than other areas. There are no police or urban fire services located within the Otaika node. The Rural Fire, Forest Protection Services are located within the node, but may not be able to provide urban fire fighting services, if required. Given the proximity to the main police, and fire stations in Whangarei City, it is unlikely there will be a need for separate facilities to be located within in this node over the next 30/50 years.
Sense of Place/Urban DesignIn the early 1960s the southern areas of the node close to Whangarei City became increasingly desirable for residential development, due to the proximity to the local abattoir for employment. However, Raumanga Valley was very swampy and required extensive drainage and stormwater control to be suitable for residential development. Residential development in the Raumanga Valley area continued into the 1970s, with Tennyson Street and Collingwood Street areas being developed at this time. State housing was also built further down State Highway 1 in the area locals now refer to as Smeatons Drive. Subdivisions continue to appear on a regular basis in the area, but they are now on a much smaller scale than occurred during the sixties and seventies.
The peak of house building in Otaika occurred in 1960-69 (29%) and in 1970-79 (33%). The average age of dwellings in this area is approximately 41.5 years, which is one of the older housing stocks in the Whangarei District. Notably, only about 11% of the housing stock was built since 1990, which is the lowest in the district. There is some older attractive housing located in parts of Raumanga near Northland Polytech, and on Raumanga Heights Drive.
Otaika has some important amenity values and contains areas of visual and ecological significance. To the west it is bounded by the uplands associated with Otaika Valley, and to the east by the mangroves and mud flats of the Whangarei Harbour. The northern portion of the area comprises mixed residential, retail and industrial development, whilst the southern portion is largely rural in character. Overall, the area is characterised as a modified agricultural, residential and commercial landscape and has been largely cleared of native bush, except in the upland areas. There is potential to develop the Otaika Shopping Centre to improve its amenity values. However, there are constraints to overcome because of the state highway running through the centre.

Whangarei District Growth Strategy :151
PAR
T D:
SUSTA
INA
BLE FU
TUR
E 30/50
Infrastructure3.3.5
WaterThe Otaika node is currently reticulated by Council’s piped services. The reticulated system runs throughout the node, and reaches as far south as Portland, and up Otaika Valley Road. The main water source is from Maunu Springs, from which water is transported to the Ruddles Water Treatment Plant, and then to the Anzac Reservoir before use. Limiting factors in Otaika are local reticulation and the Ruddles raw water line. A small amount of the node is also serviced by water sourced from Poroti, especially around Raumanga Heights. A few minor works are required to meet water infrastructural services levels for the projected future population growth, at an estimated cost of $0.2 million over the next 50 years.
WastewaterThe Otaika node is reticulated by Council’s piped services, with treatment occurring at the main Wastewater Treatment Plant at Kioreroa Road. The wastewater system covers much of the residential and industrial areas, and reaches as far south as Quarry Road. Parts of the network are currently at capacity with known areas of surcharge during rain events. A variety of upgrades are required to meet future population growth. Anticipated works include reticulation upgrades and/or installation of new trunk sewers, and an increase in capacity of existing waste water treatment plant or new plant. If some lots are larger than 2,000m² and soakage is adequate then individual onsite wastewater treatment and disposal systems may prove acceptable with a subsequent reduction in the cost and need for council asset upgrades. The cost estimate for this node is $6.2 million over the next 50 years.
StormwaterThe stormwater network is generally sufficient to service a 1 in 5 year rainfall event, with some property flooding occurring in more extreme events. Reticulation will require renewal/rehabilitation as necessary. In alignment with current best practice, future stormwater management is envisaged to be a continuation of current stormwater policies (through the Environmental Engineering Standards). Under these policies a developer is required to undertake onsite attenuation and treatment of stormwater generated by their development. This generally results in little impact to the existing Council stormwater network. Upgrades required are undertaken by the developer with possible Council contribution where an existing asset has limited remaining life. Under this approach Council does not itself undertake projects involving creation of new stormwater infrastructure.
Several stormwater catchment management plans have been prepared for the area, and include the Raumanga Catchment Drainage Plan (1999) and the Limeburners Catchment Drainage Plan (1995). The Limeburners Catchment Drainage Plan is in the process of being reviewed and updated.
TransportationThe roading network is an important issue in the Otaika node. As the southern gateway to both Marsden Point and Auckland, and being an area that has seen an increase in manufacturing and big-box retailing, there are multiple works and improvements needed within the area to meet anticipated growth. The Otaika node is currently serviced by a network catering for approximately 35,000 vehicles per day. This is projected to increase to approximately 60,000 vehicles per day in the future. In terms of actual road lengths and types of road found in Otaika, they consist of the following: around 9km of state highway; 2km of arterial roads; 5km of collector for medium levels of traffic; and 14km of public road used for residential purposes.
way of residential settlement occurred at this stage. It was not until the 1960s that this area saw increased development due to the opening of local abattoirs. No historic places are noted in the District Plan, or on the Historic Places Trust Register.
Economy3.3.4
Business Profile and ProjectionsThere is a small retail centre located within the area, and about 50% of the residential population is located within 500m of this centre. Many of the other businesses in the area are geared towards manufacturing, or are regional in their focus. There are a couple of large retail stores around Rewa Rewa and Tauroa Roads, such as Bunnings Warehouse and Harvey Norman. The key role played by Otaika is that it is a growing employment hub in the south of Whangarei.
In 2006, around 1,900 employees lived within the Otaika area. The people living in the Otaika area were primarily involved in retail trade, health and community services, and manufacturing. Their occupations were primarily identified as labourers, professionals, and technicians. Only 37% of the population is presently in some form of employment, which is one of the lowest proportions in the district. It is anticipated that the number of employees living in Otaika will increase from 1,900 in 2006, to around 2,200 in 2041 and to over 2,600 by 2061.
In 2006, 1,100 people were employed in the Otaika area. Their key industries were slightly different from those employees living in Otaika, being education, manufacturing, and wholesale trade. The number of employees who work within the Otaika area is expected to increase substantially from 1,100 in 2006 to over 3,200 in 2041 and to 3,800 in 2061, meaning that Otaika is the fourth largest employment centre, larger than Maunu but smaller than Marsden Point/Ruakaka and Kamo.
Statistics New Zealand Business Survey (2007) had a slightly higher number of employees in the node, with around 1,450 being recorded. Approximately 280 employers are noted within the area, with 178 being sole-operator/self-employed, and 73 enterprises employing 1-9 employees. This is one of the smallest numbers of small businesses amongst the various nodes. However, the other 28 employers with more than nine employees are relatively substantial enterprises. The largest employers in the area were involved in the manufacturing, education, retail trade, wholesale trades, and electricity sectors.
Business Land RequirementsIt is expected that the Otaika business district will grow rapidly in the future. Otaika has the third largest area of business zoned land in the Whangarei District. It is anticipated that this will increase from 136ha in 2010 to 260ha in 2041, and to 310ha in 2061. There may be some difficulties in providing this amount of business land, given constraints throughout the node, but the likely areas for business growth don’t have the same level of constraints as residential areas.
In terms of business floor area, Otaika has around 110,000m² of business zoned floor area, the third largest area of business floor in the Whangarei District. Otaika’s business floor area is expected to increase from 110,000m² in 2006 to around 150,000m² in 2041, and to a total of 196,000m² in 2061. Otaika also has over 100ha of business zoned land, which is expected to triple over the next 50 years.
Business Projections, OtaikaTable 80:
2006 2041 2061Business floor area (m²) 109,239 148,226 196,203Business land area (ha) 135.82 260.63 309.43Employees (by workplace) 1,383 3,235 3,840

152: Whangarei District Growth Strategy
PAR
T D
: SU
STA
INA
BLE
FU
TUR
E 30
/50
Parks and ReservesOtaika has a limited number of parks and reserves contained within its bounds, with approximately 30ha of council reserves being found. Most of this is contained within the Otaika Sports Ground and Raumanga Falls Reserve. Otaika also has four playgrounds within its bounds. Other parks and reserves found within the area include: Tarewa Park, Murdoch Crescent Reserve, Anzac Park Reserve, Hedley Place Reserve, Tauroa Street Reserve, Awatea Street Reserve, and Kioreroa Cemetery.
An analysis of ‘Neighbourhood’, ‘Sports’ and ‘Other’ parks found -0.09ha, -3.60ha and -2.75ha of existing capacity respectively. In order to meet projected future population needs, it is anticipated that a further 20ha of new local parks and natural areas are required. This is estimated to cost approximately $2 million. As well as the land, it is expected that other facilities would be constructed within present and future reserve areas.
Entrance to Tarewa Park PlaygroundFigure 104:
Summary3.3.6
Otaika is the main entranceway into Whangarei City. Recent years have seen an expansion of industrial and commercial development in the area, and this expansion is expected to continue. The biggest constraint facing development in Otaika is the transportation network and its connections to changing land use in the area. Efforts are being made to address traffic issues in the area, and these efforts will continue over the future.
In terms of residential development, however, it appears that population growth may be constrained by the presence of natural hazards, particularly risks from land instability. Much of the present residential area is located in areas already subject to hazard risks, and potential expansion areas are also constrained by natural hazard risk. Capacity for further residential subdivision development is therefore limited by existing risks. These constraints may mean that some of the projected population will need to be accommodated elsewhere in the Whangarei urban area.
Some of these roads are expected to be upgraded to meet increased vehicle movements in the area. The overall cost for the substantial level of works will require an estimated $45 million of additional Whangarei District Council administered roading expenditure. There is a known backlog in roading works that will need to be met in order to provide for current traffic movements, along with future works to cater for the increase in traffic movements over the next 30/50 years.
State Highway 1 through Whangarei plays a very important role in the transport network. There are several upgrades planned for the near future and further projects identified to improve traffic flow and safety through the City. These include improvements from Murdoch Crescent to Maunu Road (State Highway 14), including the widening of State Highway 1 from two lanes to four lanes from Murdoch Crescent to Maunu Road (State Highway 14); the signalisation of the State Highway 1/Tarewa Road intersection; and an upgrade of the Maunu Road (State Highway 14) signalised intersection. Tarewa Road intersection improvements and four laning of State Highway 1 have been allocated $0.7 million in 2009/10, $0.58 million in 2010/11, $3.27 million in 2011/12, and $4.51 million in 2012/13. State Highway 14 intersection improvements have been allocated $2.32 million in 2009/10 and $1.69 million in 2010/11.
It is proposed to upgrade the existing signalised seagull intersection at State Highway 1/Rewa Rewa Road to a more traditional signalised intersection. As a result of the current seagull configuration there is a traffic weave created by those vehicles turning right out of Rewa Rewa Road who then turn into Tauroa Street. Full traffic signals would remove this weave and improve overall safety, as well as capacity, at this intersection.
A new link road is proposed that will connect land uses west of State Highway 1 to Tauroa Street through “Southdale” land at Southend Avenue. This new link, in combination with the State Highway 1/Southend Avenue signals, will provide a high quality link to State Highway 1 for development and existing residents to the west of State Highway 1. It is also proposed to restrict movements to ‘left in’ and ‘left out’ of Tauroa Street, or to implement a complete closure of Tauroa Street at State Highway 1. This project is part of the Southdale/Tauroa/State Highway 1 link project and is complementary to the signalisation of the State Highway 1/Southend Avenue intersection.
The State Highway 1/State Highway 14 bypass will be a new two lane road (with cycle facilities) from State Highway 1 near Quarry Road in the south through to Maunu Road (State Highway 14) in the northwest. This link will provide direct access to State Highway 1 for Maunu residents. It will also remove traffic from the State Highway 14/State Highway1 intersection, one of the most critical intersections in the Whangarei state highway network.
A new two lane road is proposed (with cycle lanes and the possibility for 4 lanes in the future) linking the Port Nikau area to State Highway 1 near Quarry Road (in the same location as the proposed State Highway 1/State Highway 14 bypass). It also includes a link from the new highway through to Kioreroa Road. This link is needed to provide efficient access to the Port Nikau area where significant growth is expected to occur in the future.
The State Highway 1/Port Nikau Highway/State Highway 1/State Highway14 Bypass Interchange comprises a new grade separated interchange at the intersection of State Highway 1 and the new roads linking to Port Nikau and the State Highway 1/State Highway 14 bypass. This intersection connects both the State Highway 1/State Highway 14 bypass and the Port Nikau Highway to the State Highway Network. A grade separated interchange is proposed as it is a high capacity intersection and provides users the ability to cross the state highway and connect communities without having to use the state highway.
A connection from Raumanga Road to State Highway 14 is proposed for the future. This will improve connectivity between Maunu and Raumanga and also take pressure off the state highway network by providing an alternate route for local traffic.

Whangarei District Growth Strategy :153
PAR
T D:
SUSTA
INA
BLE FU
TUR
E 30/50
OnerahiFigure 105: Onerahi3.4 Onerahi is a harbour-side settlement, located between central Whangarei and the coastal route towards Parua Bay and Whangarei Heads. Of the five urban nodes, Onerahi is the most separated from the rest of urban Whangarei, with mangrove estuaries, reclaimed land and causeways occupying the spaces between it and the rest of Whangarei City. This separation has allowed Onerahi to develop its own identity and sense of place.
Today, Onerahi is a flourishing suburb of Whangarei with a village atmosphere and an active community. It has a busy shopping centre and many residential areas with attractive harbour views. The present population of over 7,000 residents is projected to increase to approximately 11,500 by 2061. The total land area is around 2,790ha, which is relatively large and includes many lifestyle blocks. The area of Living 1, 2, 3 within the node is around 350ha. The amount of business land in Onerahi is quite limited, at around 20ha. This area excludes the land used by the airport, which is around 60ha in area, and an important part of local transport infrastructure.
Environment3.4.1
Land UseOnerahi is bounded to the south by the harbour, to the west by the elevated forested area of Parihaka, and in the east by Waikaraka Stream and the Mount Tiger Road ridgeline. Overall, there is little highly versatile soil found in the vicinity of Onerahi, with only 2ha of Class 3 being found in the node.
The geology of the study area is dominated by six geological units. These are Waipapa Terrane; Te Kuiti Group Rocks comprising Ruatangata Sandstone and Whangarei Limestone; Northland Allochthon, including Whangarei Formation and Omahuta Sandstone, and Kerikeri Volcanic Group; Quaternary Sedimentary Deposits; and typically alluvium adjacent to the inland coast. In addition, there are some reclaimed areas comprising man-made fill (e.g. William Fraser Memorial Park/Pohe Island).
The main land uses in the area include forestry (35%), rural residential (21%), pastoral (15%) and residential (11%). As the population grows, the land occupied by residential and rural residential uses will both grow. It is likely that this will be at the expense of land occupied by pastoral and perhaps forestry purposes. However, given the amount of land with high instability risk in the area, the make up of land uses may not change much over time. A major land use in the node is the Whangarei Airport, occupying around 60ha of the land area.
Water ResourcesSeveral small streams and creeks flow through Onerahi node, with around 35km of waterways in total. The major waterways include Awaroa Creek, Waikaraka Stream, Waimahanga Stream, and Waioneone Creek. These stream channels generally follow natural morphology and are heavily vegetated with indigenous riparian bush. Thus, a significant portion of the area is vegetated either with native bush or with plantation forestry. Onerahi is situated across the boundaries of two major catchment areas, these being the Whangarei South and the Whangarei/Tutukaka Catchment areas. The lower reaches of all waterways are tidal in nature.
The boundaries of these catchments are hard to define within the Onerahi node. The Awaroa Stream Catchment is divided across the two catchment areas. The upper section, near Abbey Caves, is considered part of the Whangarei/Tutukaka Catchment area, as is the waterway to the west of Onerahi (the Waikaraka sub-catchment). The area around Cartwright Road/Sherwood Rise is also considered part of the Whangarei/Tutukaka Catchment.
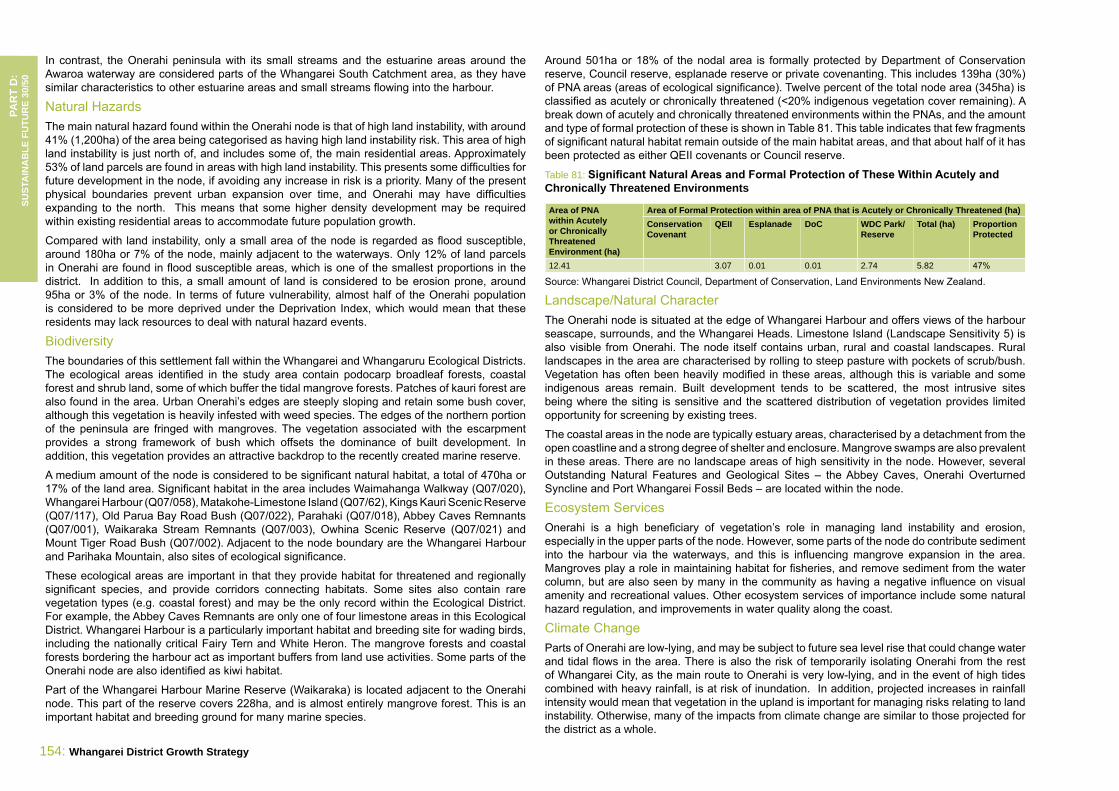
154: Whangarei District Growth Strategy
PAR
T D
: SU
STA
INA
BLE
FU
TUR
E 30
/50
Around 501ha or 18% of the nodal area is formally protected by Department of Conservation reserve, Council reserve, esplanade reserve or private covenanting. This includes 139ha (30%) of PNA areas (areas of ecological significance). Twelve percent of the total node area (345ha) is classified as acutely or chronically threatened (<20% indigenous vegetation cover remaining). A break down of acutely and chronically threatened environments within the PNAs, and the amount and type of formal protection of these is shown in Table 81. This table indicates that few fragments of significant natural habitat remain outside of the main habitat areas, and that about half of it has been protected as either QEII covenants or Council reserve.
Significant Natural Areas and Formal Protection of These Within Acutely and Table 81: Chronically Threatened Environments
Area of PNA within Acutely or Chronically Threatened Environment (ha)
Area of Formal Protection within area of PNA that is Acutely or Chronically Threatened (ha)Conservation Covenant
QEII Esplanade DoC WDC Park/ Reserve
Total (ha) Proportion Protected
12.41 3.07 0.01 0.01 2.74 5.82 47%
Source: Whangarei District Council, Department of Conservation, Land Environments New Zealand.
Landscape/Natural CharacterThe Onerahi node is situated at the edge of Whangarei Harbour and offers views of the harbour seascape, surrounds, and the Whangarei Heads. Limestone Island (Landscape Sensitivity 5) is also visible from Onerahi. The node itself contains urban, rural and coastal landscapes. Rural landscapes in the area are characterised by rolling to steep pasture with pockets of scrub/bush. Vegetation has often been heavily modified in these areas, although this is variable and some indigenous areas remain. Built development tends to be scattered, the most intrusive sites being where the siting is sensitive and the scattered distribution of vegetation provides limited opportunity for screening by existing trees.
The coastal areas in the node are typically estuary areas, characterised by a detachment from the open coastline and a strong degree of shelter and enclosure. Mangrove swamps are also prevalent in these areas. There are no landscape areas of high sensitivity in the node. However, several Outstanding Natural Features and Geological Sites – the Abbey Caves, Onerahi Overturned Syncline and Port Whangarei Fossil Beds – are located within the node.
Ecosystem ServicesOnerahi is a high beneficiary of vegetation’s role in managing land instability and erosion, especially in the upper parts of the node. However, some parts of the node do contribute sediment into the harbour via the waterways, and this is influencing mangrove expansion in the area. Mangroves play a role in maintaining habitat for fisheries, and remove sediment from the water column, but are also seen by many in the community as having a negative influence on visual amenity and recreational values. Other ecosystem services of importance include some natural hazard regulation, and improvements in water quality along the coast.
Climate ChangeParts of Onerahi are low-lying, and may be subject to future sea level rise that could change water and tidal flows in the area. There is also the risk of temporarily isolating Onerahi from the rest of Whangarei City, as the main route to Onerahi is very low-lying, and in the event of high tides combined with heavy rainfall, is at risk of inundation. In addition, projected increases in rainfall intensity would mean that vegetation in the upland is important for managing risks relating to land instability. Otherwise, many of the impacts from climate change are similar to those projected for the district as a whole.
In contrast, the Onerahi peninsula with its small streams and the estuarine areas around the Awaroa waterway are considered parts of the Whangarei South Catchment area, as they have similar characteristics to other estuarine areas and small streams flowing into the harbour.
Natural HazardsThe main natural hazard found within the Onerahi node is that of high land instability, with around 41% (1,200ha) of the area being categorised as having high land instability risk. This area of high land instability is just north of, and includes some of, the main residential areas. Approximately 53% of land parcels are found in areas with high land instability. This presents some difficulties for future development in the node, if avoiding any increase in risk is a priority. Many of the present physical boundaries prevent urban expansion over time, and Onerahi may have difficulties expanding to the north. This means that some higher density development may be required within existing residential areas to accommodate future population growth.
Compared with land instability, only a small area of the node is regarded as flood susceptible, around 180ha or 7% of the node, mainly adjacent to the waterways. Only 12% of land parcels in Onerahi are found in flood susceptible areas, which is one of the smallest proportions in the district. In addition to this, a small amount of land is considered to be erosion prone, around 95ha or 3% of the node. In terms of future vulnerability, almost half of the Onerahi population is considered to be more deprived under the Deprivation Index, which would mean that these residents may lack resources to deal with natural hazard events.
BiodiversityThe boundaries of this settlement fall within the Whangarei and Whangaruru Ecological Districts. The ecological areas identified in the study area contain podocarp broadleaf forests, coastal forest and shrub land, some of which buffer the tidal mangrove forests. Patches of kauri forest are also found in the area. Urban Onerahi’s edges are steeply sloping and retain some bush cover, although this vegetation is heavily infested with weed species. The edges of the northern portion of the peninsula are fringed with mangroves. The vegetation associated with the escarpment provides a strong framework of bush which offsets the dominance of built development. In addition, this vegetation provides an attractive backdrop to the recently created marine reserve.
A medium amount of the node is considered to be significant natural habitat, a total of 470ha or 17% of the land area. Significant habitat in the area includes Waimahanga Walkway (Q07/020), Whangarei Harbour (Q07/058), Matakohe-Limestone Island (Q07/62), Kings Kauri Scenic Reserve (Q07/117), Old Parua Bay Road Bush (Q07/022), Parahaki (Q07/018), Abbey Caves Remnants (Q07/001), Waikaraka Stream Remnants (Q07/003), Owhina Scenic Reserve (Q07/021) and Mount Tiger Road Bush (Q07/002). Adjacent to the node boundary are the Whangarei Harbour and Parihaka Mountain, also sites of ecological significance.
These ecological areas are important in that they provide habitat for threatened and regionally significant species, and provide corridors connecting habitats. Some sites also contain rare vegetation types (e.g. coastal forest) and may be the only record within the Ecological District. For example, the Abbey Caves Remnants are only one of four limestone areas in this Ecological District. Whangarei Harbour is a particularly important habitat and breeding site for wading birds, including the nationally critical Fairy Tern and White Heron. The mangrove forests and coastal forests bordering the harbour act as important buffers from land use activities. Some parts of the Onerahi node are also identified as kiwi habitat.
Part of the Whangarei Harbour Marine Reserve (Waikaraka) is located adjacent to the Onerahi node. This part of the reserve covers 228ha, and is almost entirely mangrove forest. This is an important habitat and breeding ground for many marine species.

Whangarei District Growth Strategy :155
PAR
T D:
SUSTA
INA
BLE FU
TUR
E 30/50
Supply, in this case, refers to the availability of actual or potential vacant lots to accommodate future population needs, and the capacity to undertake subdivision should future growth patterns warrant it.
Capacity Under the Whangarei District Plan and Applicable Structure PlanTable 84:
District Plan Living 1,2,3 (maximum)
District Plan Living 1,2,3
(constrained)
Structure Plan Living 1,2,3 (maximum)
Structure Plan Living 1,2,3
(constrained)Population 8,567 6,580* 8,868 6,580*Maximum households (lots) 3,570 2,742* 3,695 2,742Potential for new lot creation (2011) 831 3** 957 3**Projected year capacity exhausted 2037 ** 2041 **
*Much of the population already lives in areas with high land instability risk. Overall, the present number of households exceeds the number of lots available without constraint. This calculation adds the present number of used and existing vacant lots to project the population at 2.4 people per household.
** The relatively small lot sizes in Onerahi means that few existing lots without any constraints are of a size that can be subdivided. Whilst some potential to create new lots remain, it is very limited.
Present development potential under the Whangarei District Plan and the Onerahi Structure Plan is noted in Table 84. Two types of estimates for capacity are given for both District Plan and Structure Plan. The first estimate is the theoretical maximum number of lots based upon all available land (by land area) being utilised. Present lots that are too small to subdivide are excluded from this calculation, as are those sites which are designated in the District Plan. The second type takes into account biophysical constraints that may reduce potential capacity. In this calculation the constraints of flood susceptibility, significant natural habitat, and high land stability were applied, in addition to the exclusion of small lots and designated sites. In some cases, good engineering solutions can be found that can alleviate the risk of new developments. The final number of households or lots is likely to be between the two estimates, as no constraint is absolute.
These figures appear to suggest that there are significant difficulties in expanding the Living Environments in Onerahi. Given the large band of high land instability to the north, it is unlikely that some parts of this land can be used for medium intensity housing development, without increasing local risks. Thus, it is difficult to envisage Onerahi reaching maximum projected growth. Therefore, some of the projected population will need to be accommodated elsewhere. Such areas could include Tikipunga in the north, and Parua Bay to the east. A suitable development alternative may be the increased use of the proposed Urban Transition Environment in several locations, such as along Abbey Caves Road.
Education, Health, and SafetyOnerahi has limited education and health services, despite being an urban node. At present, Onerahi contains two primary schools - Onerahi Primary School, and Raurimu Avenue Primary School, deciles 4 and 2 respectively. The roll across the two schools was 530 in 2009. A relatively low 40% of the population is located within 500m of either of these two schools.
Given projected population growth in the wider area, including the area out to Whangarei Heads, over the next 30/50 years, there is a possibility that a new secondary school might be required in the vicinity of Parua Bay or Onerahi by 2061. A population of around 10,000 at Onerahi, plus 5,000 at Parua Bay and growth at Whangarei Heads, is likely to be sufficient for a new secondary school. However, this will need to be assessed in conjunction with the Ministry of Education.
Society3.4.2
The median income within the node is $47,000, which is around 10% higher than the district’s average of $43,900. However, over 46% of Onerahi’s population is considered to be more deprived under the Deprivation Index. This suggests that disparity in income and resources exists in Onerahi.
The median age at present is 39.5 years, over one year older than the median age of the district. In 2006, 33% of the residential population was under 20, which is a reasonably high proportion of young people, and approximately 16% of the population was aged 65 and over. The over 65 year age group is projected to reach 28% by 2041 and 33% by 2061, which is quite similar to the district as a whole. By 2061, this would mean that 3,746 residents are over the age of 65 within the node, up from the present 1,125. This equates to an increase of 233%, and will require some investment in services and facilities for a more aged population.
Residential Land RequirementsEstimating future residential land requirements in Onerahi is complex, with various factors such as increased population and declining household sizes needing to be taken into account. This is further compounded by expected slow future consolidation of settlement patterns as well as the potential for declining average lot sizes within the urban environment. Any assessment needs to take into account both demand and supply factors.
Demand, in this case, needs to take into account the declining household size (from 2.6 to 2.4) and a probable small increase in consolidation to more urban dwellings. The present split between households in Onerahi is 89/11, with 2,512 households within the Living Environments, and 296 households outside them. Over time, a target split of 92/8 by 2061 is preferable. This is a small level of consolidation, over time, reflecting the relatively high level of urbanisation already found in the area. This would result in 4,401 households in the Living Environments, and 383 households outside of them.
Projected Population and Household Residential DemandTable 82:
2006 2011 (projected)
2041 (projected)
2061 (projected)
Existing vacant lots
Existing vacant lot
shortfall (year)
Population 7,161 7,436 9,669 11,480 - -Total households (lots) 2,808 2,916 3,868 4,783 154 -Households (Living 1,2,3) 2,512 2,608 3,481 4,401 130 2016Households (rural/residential) 296 308 387 383 24 2016
The average Living Environment lot in Onerahi is 0.1ha, whilst the average rural residential lot outside of the Living Environments is 0.3ha. Based upon existing average residential lot sizes, this would equate to 189ha of new urban land being required, and 28ha of rural residential land being taken up outside of the Living Environments. This assumes that the present 89/11 settlement pattern split is consolidated into a 92/8 split over the 50 year period.
Residential Land Area Required to Meet Projected DemandTable 83:
2006 (estimate) 2011 (projected) 2041 (projected) 2061 (projected)Total urban residential land area(ha) 251.2 260.8 348.1 440.1New urban residential land area (ha) - 9.6 96.9 188.9Total rural/residential land area (ha) 94.7 98.6 123.8 122.6New rural/residential land (ha) - 3.9 29.1 27.9

156: Whangarei District Growth Strategy
PAR
T D
: SU
STA
INA
BLE
FU
TUR
E 30
/50
A large proportion of Onerahi’s housing stock was built before 1960 (19%) and between 1970-79 (28%). The average age of dwellings in this area is approximately 40 years, which is the same as the district average. Only about 21% of the housing stock has been built since 1990, which is one of the slower building rates in the district, with other areas being more popular. Some refurbishment of buildings would be expected over the next 50 years.
Culture3.4.3
Tangata Whenua Onerahi is located within the rohe of Ngapuhi, and the hapu group in the area is Te Parawhau. There are no marae located within the node. Very little of the Onerahi node is Maori land, with only 1% (17ha) of the area being classified as such.
There is one site of significance to Maori identified in the District Plan located within the node, being a pa site with pits and midden. Other important features include Owhiua Pa, Stephans and Kaiwaka Point, the Airport and surrounding area, Pa (Cartwright Road), Stone Adze Quarry - Onerahi Foreshore, Matakohe Island, Motuotaua Island, Onemana Pa, and Motukiwi – Tapu Point. Further sites of significance to Maori may be identified in future, particularly with the development of Iwi Management Plans. Archaeological sites of Maori association in the node include two burial sites, 12 pa sites, two Maori horticulture sites, 31 midden/ovens, 46 pit/terraces, two unclassified sites and two working areas - a total of 97. Further archaeological sites may also be uncovered in future.
Arts, Culture and Civic AmenitiesAs an established urban village, Onerahi is provided with some services and civic amenities. These include three churches, a community hall, three playgrounds, the Onerahi Library, and the retail centre with a wide range of services. The library may need to be upgraded over the next 50 years. There are also three public toilets found within Onerahi. Onerahi is 30km to Ocean Beach, which is the closest surf beach. Matakohe/Limestone Island is also popular with residents and visitors for its natural and historical values, and is used as a resource by local community groups and schools.
Historic/Cultural HeritageThe history of Onerahi, both Maori and European, is significant, as the presence of old buildings and Maori gardens on Matakohe/Limestone Island attest. The name Onerahi is said to have come from the nearby beach named Onerahi-rahi (the beach of quick overhearing), where two women who became the forbears of Ngapuhi stopped on their journey. Another explanation is that Onerahi means noisy beach and may refer to the noise of waves on the stones along the shore. There are 100 known archaeological sites and six sites containing heritage trees found within the node.
Similar to most European coastal settlements in Whangarei District, the early beginnings of Onerahi relied upon timber milling, and the use of coastal transport around Northland. European settlers first knew the Onerahi area as Grahamtown, but as this created confusion with a town of the same name near Paeroa, Grahamtown became Onerahi. During the 1800s, the Onerahi-Waikaraka-Tamaterau area yielded a large amount of kauri gum and native timber. Settlers dammed the creeks and floated logs down to the harbour from where they were shipped to mills for processing as far away as Auckland. Onerahi was also a gum field and many people made their living from digging gum out of the ground and selling it to dealers in Whangarei and Auckland.
In Onerahi, there is a local medical centre, a local chemist, and the hospital is around 9km from the Onerahi Shopping Centre. Approximately 36% of the nodal population is located within 500m of the medical centre.
The Government is currently working with District Health Boards to establish Integrated Family Health Centres to provide comprehensive primary care in one location. These centres would provide services from a range of health professionals, including GPs, primary care nurses, visiting specialists, midwives, pharmacists, podiatrists, oral health professionals, etc. An Integrated Family Health Centre could be a suitable option for the residents in Onerahi. The more isolated nature of Onerahi, when combined with a moderately aged population and population growth further out toward Whangarei Heads, would highlight Onerahi as a suitable location. Parua Bay is an alternative location.
There are no retirement villages or rest home facilities located in the area, which is surprising given that it is one of the main urban nodes. The closest are located in Whangarei City or Parua Bay. The number of people aged 65 and over is expected to increase over time. The ageing population will place additional demands on health care services, particularly an increased demand for rest home, hospital and dementia beds. An ageing population is also more likely to be located within easy access to facilities, i.e. in town centres and villages. Thus, it is likely that more rest home/retirement village facilities will be required within the node in future.
There is a volunteer fire station located in the node, along with a small police station. Growth in the node, and increased demand for theses facilities over the next 30/50 years, is likely to result in the expansion of these facilities. The Onerahi Police Station is likely to require extra police officers/support staff by 2061 to provide cover for the increased population at Onerahi and along the Whangarei Heads harbour coast. However, population growth in Parua Bay could mean that police services in that node has a higher priority.
Sense of Place/Urban DesignIn some respects, Onerahi Township’s main role is as a service centre through which traffic to Parua Bay and Whangarei Heads passes, leading to the wide range of rural, coastal and marine experiences along Whangarei’s eastern seaboard. The hub of the community is split between two adjacent junctions: where Whangarei Heads Road meets Church Street and Onerahi Road, and the nearby junction of Cartwright Road and Raumati Crescent with Onerahi Road. The village centre has an array of shops, a supermarket, library, police station, extensive medical centre, Post Shop and Kiwibank, reflecting the more isolated nature of Onerahi.
It is important to develop and enhance the seaside suburb theme of Onerahi in a sustainable way. The commercial hub is not without its challenges, particularly with regard to future expansion and a perceived lack of parking. In response to the parking issue, an additional parking area has been created in Commins Road in front of the recent library extension, as part of the Onerahi Shopping Centre upgrade. The upgrade will enhance the physical environment (e.g. creating an inviting atmosphere through parking areas, signs, sidewalks and landscaping), assist business creation and development, and increase employment and local business investment. The upgrade will help in identifying and reinforcing the unique identity of Onerahi as a seaside suburb.
Onerahi has one of the most mixed residential areas of any urban settlement. These character areas range from the pockets of older buildings in historic parts that overlook the harbour, such as Edge Street, and to the east of the airport overlooking Matakohe-Limestone Island, larger modern villas overlooking the upper harbour opposite the old Whangarei port, to the more affordable housing options near Raurimu Avenue.

Whangarei District Growth Strategy :157
PAR
T D:
SUSTA
INA
BLE FU
TUR
E 30/50
Business Projections, OnerahiTable 85:
2006 2041 2061Business floor area (m²) 23,702 32,161 38,900Business land area (ha) 19.21 24.01 28.50Employees (by workplace) 708 814 966
Local light industrial capacity is found outside the node, around the boat building sheds and small marina along Riverside Drive. With the development of the second harbour crossing, the distance to the Port Road/Okara Road area from Onerahi will reduce by approximately three kilometres, without the necessity of travelling through the Town Basin/CBD area. This is expected to reduce the need for light industrial land in the vicinity of Onerahi.
Infrastructure3.4.5
WaterThe Onerahi node is currently reticulated. In general terms, the reticulation system runs throughout the built up area. In the east it connects onto a pipeline serving Whangarei Heads. In the western parts of the node, the water system travels up Mackesy Road to Tawhai Place. It also follows the whole of Memorial Drive. The main source of water for Onerahi is the Whau Valley Reservoir, from which water is transported to the main City water treatment plant on Whau Valley Road. The water is then transported to the Onerahi Reservoir. Some lifestyle properties in parts of the node are not reticulated and rely on alternative water sources.
In order to meet future population growth, there are some infrastructural requirements that are necessary to ensure supply. These include an upgrade of the Onerahi Trunk Line, and upgrading the Onerahi Reservoir capacity. This has been estimated to cost approximately $5 million over the next 50 years.
WastewaterThe Onerahi node is reticulated to the main Whangarei wastewater system, with all wastewater transported to the main Wastewater Treatment Plant at Kioreroa Road. Like the water system, the sewerage system coverage basically reflects the extent of the built up urban area. In the east, a pipeline connects onto the Whangarei Head Sewerage Scheme. In the west, the wastewater system travels up Mackesy Road to Tawhai Place. The waste water system also goes up Memorial Drive, as far as the connection onto Old Parua Bay Road. Parts of the network are currently at capacity with known areas of surcharge during rain events.
Some works are required to enable the wastewater capacity to meet anticipated population growth. These works include reticulation upgrades and/or installation of new trunk sewers, and an increase in capacity of existing waste water treatment plant or new plant. If some lots are larger than 2,000m² and soakage is adequate then individual onsite wastewater treatment and disposal systems may prove acceptable with a subsequent reduction in the cost and need for Council asset upgrades. This may be possible for some of the future dwellings outside of the main urban area. The estimated cost for these works is approximately $8.5 million.
StormwaterThe stormwater network is generally sufficient to service a 1 in 5 year rainfall event. Some property flooding occurs in more extreme events. Reticulation will require renewal/rehabilitation as necessary. In alignment with current best practice, future stormwater management is envisaged to be a continuation of current stormwater policies (through the Environmental Engineering Standards). Under these policies a developer is required to undertake onsite attenuation and
From the 1890s onwards, Onerahi grew rapidly, mainly because of the development of the Limestone Cement Works on Limestone Island. These days, Limestone Island/Matakohe is an important wildlife sanctuary with important historical buildings and structures also located there. The development in 1910-1911, of a 400m wharf at Onerahi to ship timber and coal, and a railway bridge linking Onerahi to Whangarei, made Onerahi far more accessible to other parts of Whangarei District. Onerahi became a busy rail head and port for cargo and passenger ships.
Onerahi had to wait until the 1920s before higher quality roads were built connecting Onerahi to Whangarei and within Onerahi itself. These roads include Beach Road which was built on land that was, in some places, below the high tide mark and therefore required a stone sea wall. Its construction left an unusual feature and scenic route along the shoreline of Onerahi. In the early 1920s, the railway line connecting Auckland to Whangarei was completed. This led to the closure of the Onerahi line, and the Onerahi wharf was also dismantled and re-erected at Kioreroa, where it helped establish the main port of Whangarei.
Although there are no places or buildings registered on the Historic Places Trust Register, there are three buildings registered within the District Plan. These are the Old Onerahi Post Office, Eureka House on Tanekaha Drive, and Colonial House on Domain Road.
Economy3.4.4
Business Profile and ProjectionsOnerahi has a wide variety of shops and services within the node, including restaurants, a small supermarket, hardware store, and gift shops. Onerahi is also approximately 7km from the Whangarei CBD. However, only 37% of the node’s population is found within 500m of the shopping centre, although 92% of the population is found within 500m of a bus stop.
Onerahi has a large population of workers living in the area (3,237), with the largest industries of employment for these employees being health care, retail trade, and manufacturing industries. They listed their occupations primarily as professionals, technicians, and managers. Approximately 45% of the population was in some form of employment in 2006. Employees living in Onerahi are projected to reach 4,200 by 2041, and 4,987 by 2061.
In terms of local employment, Onerahi has 708 local employees according to the 2006 Census. The main occupations of local employees changes a little, with many people employed as professionals, sales workers, or managers. The biggest employers in the node were involved within the retail trade, government administration, and education industries. The numbers of local employees are expected to rise to 814 by 2041, and 966 by 2061.
From the Statistics New Zealand Business Survey (2007), the Onerahi area is estimated to contain 520 employees and 435 employers. Of the employers, 338 are sole-operator/self-employed or small businesses (1-9 employees). This means that only 12 businesses employed more than nine staff in the area. In terms of these larger employers, retail trade, education, transport and storage, and government administration were included.
Business Land RequirementsIn terms of business area, there is only a small amount of land presently used or projected to be used in Onerahi. The business floor areas is expected to increase from 23,000m² in 2006 to 32,000m² in 2041, and 39,000m² in 2061. The present business land area zoned within the node is approximately 19ha. This land is primarily used for commercial purposes, and is expected to reach 24ha in 2041 and 29ha by 2061.

158: Whangarei District Growth Strategy
PAR
T D
: SU
STA
INA
BLE
FU
TUR
E 30
/50
Other parks in use or in development are far smaller in extent and include William Fraser Park, Onerahi Sports Park, Onerahi Airport, Panorama Drive Reserve, Tawhai Place Reserve, George Point Road Reserve, Nottingham Road Reserve, Ross Street Reserve, Sherwood Park, Lockheed Place Reserve, Raurimu Avenue Reserve, Memorial Drive Reserve, Panorama Drive Reserve, George Point Road Reserve, Ormiston Road Reserve, Abbey Caves Scenic Reserve, Pah Road Reserve, Onerahi Cemetery, Goodwin Street Reserve, Mason Street Reserve, and Ormiston Road Accessway.
An analysis of ‘Neighbourhood’, ‘Sports’ and ‘Other’ parks found 0.8ha, -2.9ha and -10.3ha of existing capacity respectively. There is a general shortfall in capacity with limited space for neighbourhood parks. To meet future population growth, and meet present service levels, it is anticipated that approximately 17ha of local parks/destination reserves/natural areas, and 2ha of sports fields are required. As well as the land, it is expected that other facilities would be constructed within present and future reserve areas. These works are estimated to cost around $15 million over the next 50 years.
View of Onerahi Including Whangarei AirportFigure 106:
Summary3.4.6
Onerahi is an attractive harbourside settlement with more limited growth potential when compared with other urban nodes in the district. The potential capacity for further residential development is available, especially in terms of the Structure Plan, but there are considerable natural hazard constraints for urban development. This may represent a limit on population growth. If Onerahi is to accommodate projected population growth, it may need to use different methods to accommodate growth. This could include intensification strategies in appropriate areas. Transport planning that meets the demands of the additional people living in Parua Bay and the Whangarei Heads is also important to the future of Onerahi. Of additional importance will be the future impact of the second harbour crossing on local businesses and residential development. The bridge may act as a catalyst for development at Onerahi.
treatment of stormwater generated by their development. This generally results in little impact to the existing Council stormwater network. Upgrades required are undertaken by the developer with possible Council contribution where an existing asset has limited remaining life. Under this approach, Council does not itself undertake projects involving creation of new stormwater infrastructure.
Two stormwater catchment management plans have been prepared for this node. These include the Onerahi Stormwater Management Plan, and the Awaroa Catchment Drainage Plan.
TransportationOnerahi is currently serviced by a roading network catering for just over 30,000 vehicles per day. There are no known backlog requirements in the node that cannot be met under existing programmes. Various types and lengths of road include 6km of arterial road, 18km of collector road, and 32km of public road for residential purposes. At this point, it is not anticipated that any additional works are required to meet future population needs. However, additional traffic through Onerahi as a result of increased population at Parua Bay and Whangarei Heads may necessitate the construction of the Onerahi Bypass in the future.
The Lower Hatea River Crossing project involves construction of a two lane road and bridge connecting Riverside Drive to Port Road across Pohe Island. Cycle lanes and footpaths are proposed on each side of the bridge. Roundabouts are proposed at the intersections of Riverside Drive and Port Road as well as an upgrade of the Port Road/Okara Drive intersection (south) from priority controlled to roundabout controlled. This project is predicted to remove traffic from the lower CBD and, in particular, traffic from Onerahi to the south of Whangarei. The link will also provide an alternative route to/from the airport, and also from Riverside to the Okara area rather than travelling through the CBD. Funding has been allocated at $1.6 million in 2009/2010, $32 million in 2010/11, and $0.46 million in 2011/12.
The Onerahi Bypass is proposed to extend from east of the intersection of Riverside Drive/Awaroa River Road to connect with Whangarei Heads Road near Waikaraka Road. The bypass has been modelled with a roundabout connection at Riverside Drive. However, further analysis may be required in order to determine whether signals would be more appropriate. The bypass is predicted to remove a significant proportion of traffic from Onerahi Road, decreasing delays for intersections along Onerahi Road and also decreasing travel times for traffic to/from the Whangarei Heads. With the construction of the bypass there will be opportunity to investigate improved cycle/pedestrian facilities along Onerahi Road. Funding for the design has been allocated at $0.05 million in 2010/11, $0.4 million in 2011/12, $0.4 million in 2012/13, and $0.5 million in 2013/14.
Riverside Drive proposals include cross section upgrades of the existing four lane section and four-laning of the section that extends south to Awaroa River Road. Seagull intersections are proposed at most intersections, with signals proposed at Ewing Road. The upgrading of Riverside Drive will result in increased capacity, and also decreased travel times, enabling Riverside Drive to better fulfil its function as an arterial route. However, the works along the western section of this route may need to be revisited when the Lower Hatea Crossing is implemented, as this will reduce traffic demands on Riverside Drive (west). Funding has been allocated at $0.06 million in 2009/2010, $2.9 million in 2014/15, and $3 million in 2015/2016.
Parks and ReservesOnerahi contains a variety of parks and reserves, which equate to approximately 387ha of land throughout the wider area, including Department of Conservation reserves. A large part of this reserves area is contained within the Parihaka Reserve, and is actually distant from much of Onerahi’s population.

Whangarei District Growth Strategy :159
PAR
T D:
SUSTA
INA
BLE FU
TUR
E 30/50
TikipungaFigure 107: Tikipunga3.5 Tikipunga is an important urban node located on the farming plains and low hills to the northeast of Whangarei City. In recent years, Tikipunga has seen a modest level of growth around locations like Bushhaven Drive, near the golf course, and lifestyle development around Vinegar Hill and Glenbervie.
Within Tikipunga node there is a series of different features and characters, ranging from high quality horticultural areas, farming and lifestyle development, areas of affordable housing, and an earlier developed area around Tikipunga School. The bulk of Tikipunga’s population is found in a relatively compact locality, and there is much scope to develop the node in a well managed consolidated manner.
Tikipunga was settled and developed as a farming and market gardening district. The Whangarei Falls have been developed as a park, with walkways allowing visitors to view the Whangarei Falls from different vantage points. Today, the Whangarei Falls remain a popular tourist attraction. In addition, Tikipunga is on the main route to the Tutukaka coast. Of note was the opening of the private Huanui College in 2010, in a similar location to a school which opened in 1893.
The present population of Tikipunga is 6,351. This is projected to reach 10,027 in 2041, and 11,904 by 2061. The total land area of the Tikipunga node is 3,544ha, of which Living 1, 2 and 3 Environments constitute around 465ha. In addition, there is a further 23ha zoned as business land, mainly around the supermarket and another, smaller shopping centre.
Environment3.5.1
Land UseThe geology of the area is dominated by five geological units. These are the Waipapa Terrane; Te Kuiti Group; Northland Allochthon; Kerikeri Volcanic Group; and Quaternary Sedimentary Deposits. In terms of soil qualities, Class 3 land constitutes just over a third of the node, mainly along the lower slopes of Vinegar Hill and around Glenbervie. A small pocket of Class 1 and Class 2 soils are found within the node as well, once again, on the fringes near Glenbervie.
The main land uses in the area include lifestyle (46%), pastoral (22%) and residential (9%). About 13% of the node is zoned residential, but some is presently being used for limited pastoral farming activities, especially near Corks Road. As the population grows, the land occupied by residential uses will grow, and is likely to be at the expense of land occupied by pastoral and lifestyle uses, and possibly horticultural uses. The retention of this scarce land resource for primary production for the foreseeable needs of future generations is a valid land use issue. If this land is not protected from rural residential and lifestyle development, this valuable resource will be lost within a relatively short space of time. Dickson’s Quarry is also located within the node providing aggregate for local roading and construction.
Water ResourcesSeveral streams rise within the node, some of which flow eventually into Whangarei Harbour, whilst others flow into the Ngunguru River. Mangakino, Waitaua, Paranui, Putanui and Otangarei Streams are the more prominent waterways found within the area. Approximately 60km of waterways can be found within the node.
As a large diverse area, Tikipunga is contained within several catchment areas, the most important of which are Hatea, Horahora, and the Lower Purua Catchment areas. At the northern extent of the area, the main boundary between the Lower Purua Catchment and the Hatea/Horahora Catchment areas is across the Vinegar Hill Road ridge.

160: Whangarei District Growth Strategy
PAR
T D
: SU
STA
INA
BLE
FU
TUR
E 30
/50
break down of acutely and chronically threatened environments within the PNAs, and the amount and type of formal protection in these is shown in Table 86. Much of the significant natural habitats in acutely or chronically threatened environments consist of multiple small fragments of bush, especially near the waterways. Increasing protection of other fragments may become increasingly important as the population grows.
Significant Natural Areas and Formal Protection of These Within Acutely and Table 86: Chronically Threatened Environments
Area of PNA within Acutely or Chronically Threatened Environment (ha)
Area of Formal Protection Within Area of PNA that is Acutely or Chronically Threatened (ha)Conservation Covenant
QEII Esplanade DoC WDC Park/ Reserve
Total (ha) Proportion Protected
112.55 3.32 2.58 0.66 12.08 18.65 17%
Source: Whangarei District Council, Department of Conservation, Land Environments New Zealand.
Landscape/Natural CharacterLandscapes in Tikipunga are mainly comprised of heritage aspects and rural rolling to steep pasture land with pockets of vegetation. Heritage landscapes are comprised of strong cultural and historical associations, both European and Maori. Glenbervie (Maruata) cone is a site of significance to Maori and the extensive dry stone walling around the Glenbervie area imparts a European heritage.
A large portion of Tikipunga (23%) is rated as significant (Landscape Sensitivity 5) in an initial landscape study of the district, associated with the heritage values in the area. There is one Outstanding Natural Feature and Geological Site of Regional Importance in the area – Glenbervie (Maruata) cone. The Whangarei Falls are also located in the Tikipunga node, and are an important landmark and feature in the landscape.
Ecosystem ServicesThe Tikipunga area provides several ecosystem services, especially food in the pastoral areas, fibre in the Glenbervie Forest, and some water quality and quantity provision. Future population growth will see an increased demand for services such as natural hazard regulation, air quality regulation, erosion regulation, and in terms of local production, pollination, nutrient cycling and soil formation could be important. Some of these services are important for Whangarei City which is downstream from Tikipunga.
Climate ChangeThe main concern for the Tikipunga area, apart from those impacts that affect the whole of the district, is an increased risk around inundation in the vicinity of the waterways, and the influences on downstream flooding. There may be effects of changing weather and climate patterns on agricultural practices and possible effects from climate change on the Glenbervie Aquifer.
Society3.5.2
The median household income in the node is $46,700, which is above the district average of $43,900. In terms of deprivation, Tikipunga has one of the higher levels of deprivation, with about 63% of the node being more deprived under the Index of Deprivation. This suggests that there are substantial levels of inequality across Tikipunga.
The median age in the node is 33 years, which is the second youngest in the district. Approximately 34% of the population was under 20 years, which is the third highest proportion in the district.
These parts of the catchment areas are mostly rural in nature, with large areas covered in exotic forest and some regenerating native bush. The part of Tikipunga node located in the Lower Purua Catchment is quite small, and consists mainly of lifestyle and pastoral uses, with a small area of industrial development.
The eastern part of Tikipunga node is within the Horahora Catchment area, and wider land uses are primarily comprised of lifestyle, pastoral and some forestry (indigenous and exotic). This part of the catchment area also includes some horticulture. The largest part of Tikipunga node is located within the Hatea Catchment. The main land uses in this segment are forestry in the upper catchment, lifestyle and a small area of pastoral land in the middle catchment, and a large amount of residential use and some indigenous forest in the lower part of the catchment.
To the east of the study area, mainly in the Glenbervie area, the Northland Regional Council has identified an aquifer that has a high risk of actual or potential demand for water extraction.
Natural HazardsA portion of the node (about 394ha or 11% of the land area) is susceptible to flooding, mainly the area in proximity to Waitaua Stream and Mangakino Stream, particularly where they meet near Balmoral Road. An additional area of flood susceptibility is the low lying land to the north of Harris Road. Approximately 17% of the total land parcels in Tikipunga are located in flood susceptible areas. Whilst high, this is still lower than the proportion across the whole of the urban areas of Whangarei, which is approximately 24%.
About 10% (357ha) of the node is identified as having a risk of high land instability, mostly on the bounds of Glenbervie Forest and above Sands Road. Some pockets of land instability risk also exist in different parts of Vinegar Hill. Approximately 23% of the total land parcels in Tikipunga are located on areas subject to high land instability risk, especially on some steeper slopes overlooking the Hatea River Valley. Only 1.5ha of land is noted as being erosion prone.
There is a high level of deprivation in the Tikipunga node, which means increased vulnerability to natural hazard shocks. However, whilst Tikipunga is also ageing, the rate at which the population ages is less than in many other parts of the district. Retirement villages are increasingly popular in Tikipunga, and therefore vulnerability to natural hazard risk will still increase.
BiodiversityA small proportion of the node has significant natural habitat, with a total of 261ha (7.4%) across the area. Notable locations include: Whangarei Falls (Q06/166), Ngunguru Volcanic Hill Reserve (Q06/167) on the very edge of the node, Puketotara Hill Bush (Q06/168), Mangakino Stream Q06/169, Vinegar Hill Road Bush (Q06/153), Waitaua Stream (Q06/158) and Tikipunga Golf Course (Q06/157). Adjacent to the node boundary are the Abbey Caves Remnants and Parihaka Mountain, also sites of ecological significance.
These ecological areas are important in that they provide habitat for threatened and regionally significant species. Some sites also contain uncommon (riverine forest) and nationally rare (volcanic broadleaf forest) vegetation types, and may be the only record within the Ecological District. For example, the Vinegar Hill Road Bush has the only recorded instance of fernland in this Ecological District. The Whangarei Falls, Ngunguru Volcanic Reserve and Puketotara Hill all include geo-preservation sites of regional significance.
Around 212ha or 6% of the nodal area is formally protected by Department of Conservation reserve, Council reserve, esplanade reserve or private covenanting. This includes 68ha (26%) of PNA areas (areas of ecological significance). Fifty-two percent of the total node area (1,838ha) is classified as acutely or chronically threatened (<20% indigenous vegetation cover remaining). A
Whangarei District Growth Strategy :161
PAR
T D:
SUSTA
INA
BLE FU
TUR
E 30/50
In this calculation, the constraints of flood susceptibility, significant natural habitat, and high land stability were applied, in addition to the exclusion of small lots and designated sites. The final number of households or lots is likely to be between the two estimates, as no constraint is absolute.
Capacity Under the Whangarei District Plan and Applicable Structure PlanTable 89:
District Plan Living 1,2,3 (maximum)
District Plan Living 1,2,3
(constrained)
Structure Plan Living 1,2,3 (maximum)
Structure Plan Living 1,2,3
(constrained)Population 13,176 7,608 23,616 13,780Maximum households (lots) 5,490 3,170 9,840 5,742Potential for new lot creation (2011) 3,247 927 7,597 3,498Projected year capacity exhausted 2105 2033 2239 2112
Overall, Tikipunga appears to have significant capacity for residential growth under both the District Plan and the Structure Plan. However, the limited number of existing vacant lots suggests that the potential to accommodate growth is not being realised, and actions may be required to promote growth in Tikipunga. However, constraints in both Otaika and Onerahi may limit the rate of development in those areas, which may mean that development in Tikipunga becomes more attractive.
Education, Health, and SafetySix schools are found within the Tikipunga node. These include Glenbervie Primary School, Te Kura Kaupapa Maori O Te Rawhiti Roa, Tikipunga Primary School, Tikipunga High School, Totara Grove Primary School, and Huanui College. School deciles range from 1-7, and the roll across all schools was 1,153 in 2009. Approximately 65% of the population lives within 500m of a school.
Draft projections from the Ministry of Education indicate that the existing schools in the Whangarei District have sufficient capacity to cope with the predicted increase in population over the next 20 years. Tikipunga, with its various schooling options, would appear to have excess capacity at present and it is unlikely new schools would be required over the next 30/50 years.
Tikipunga is reasonably well served by medical facilities, with a medical centre, two chemists and other health-related services located in the node, including the North Haven Hospice. At present, about 18% of the population is within 500m of the medical centre, and Tikipunga is located about 7km from Whangarei Hospital. It is also reasonably close to facilities in Kamo and Kensington. As Tikipunga grows, there will be an increased demand for medical care, especially with an increase in the population over 65 years. The Government is currently working with District Health Boards to establish Integrated Family Health Centres to provide comprehensive primary care in suburban locations. Tikipunga may be suitable for such a centre over the next 30/50 years.
There are two rest home/retirement village facilities located in the node. The number of people aged 65 years and over is expected to increase over time. The ageing population will place additional demands on health care services, particularly an increased demand for rest home, hospital and dementia beds. An ageing population is also more likely to be located within easy access to facilities, i.e. in towns and suburban centres. Thus it is likely that more rest home/retirement village facilities will be required within a location like Tikipunga. It is a process that already appears to be happening, with expansion in retirement homes already occurring since the last census in 2006.
There are currently no fire or police services located within the node, the closest being in Kamo or Whangarei City. Although it is difficult to predict the future infrastructure needs for police and fire services, an increasing population will broadly create demand for more of these services. As
Approximately 14% of the population was aged 65 years and over in 2006. This is expected to reach 25% by 2041, and 29% by 2061, but this is below the district average over that period. By 2061, this would mean that 3,481 residents within the node are over the age of 65 years, up from the present 1,059. This equates to an increase of 229%. Some additional services would be required to meet the needs of the aged population, but this is less than most other urban nodes, Marsden Point/Ruakaka and Whangarei City.
Residential Land RequirementsEstimating future residential land requirements in Tikipunga is complex, with various factors such as increased population and declining household sizes needing to be taken into account for future projections. This is further compounded by expected future consolidation of settlement patterns as well as the potential for declining average lot sizes within the urban environment. Any assessment needs to take into account both demand and supply factors.
Demand, in this case, needs to take into account the declining household size (from 2.9 to 2.4) and a probable small increase in consolidation to more urban dwellings. The present split between households in Tikipunga is 78/22, with 2,061 households within the Living Environments, and 577 households outside them. Over time, a target split of 84/16 by 2061 is preferable. This would double the number of households in the Living Environments, but also allow for an increase in the number of households outside of the Living Environments.
Projected Population and Household Residential DemandTable 87:
2006 2011 (projected)
2041 (projected)
2061 (projected)
Existing vacant lots
Existing vacant lot
shortfall (year)
Population 6,351 7,764 10,027 11,904 - -Total households (lots) 2,638 2,724 4,011 4,960 208 -Households (Living 1,2,3) 2,061 2,128 3,249 4,166 115 2012Households (rural/residential) 577 596 762 794 93 2016
The average Living Environment lot size in Tikipunga is 0.13ha, whilst the average size of a rural residential lot outside of the Living Environments is 0.7ha. Based upon existing average residential lot sizes, this would equate to 274ha of new urban land being required and 152ha of rural residential land outside the Living Environments by 2061. Little of this additional demand can be met by existing vacant lots.
Residential Land Area Required to Meet Projected DemandTable 88:
2006 (estimate) 2011 (projected) 2041 (projected) 2061 (projected)Total urban residential land area(ha) 267.9 276.6 422.4 541.6New urban residential land area (ha) - 8.7 154.5 273.7Total rural/residential land area (ha) 403.9 417.2 533.4 555.8New rural/residential land (ha) - 13.3 129.5 151.9
Supply, in this case, refers to the availability of actual or potential vacant lots to accommodate future population, and the capacity to undertake subdivision should future growth patterns warrant it.
Present development potential under the Whangarei District Plan and the Tikipunga Structure Plan is noted in Table 89. Two types of estimates for capacity are given for both District Plan and Structure Plan. The first estimate is the theoretical maximum number of lots based upon all available land (by land area) being utilised. Present lots that are too small to subdivide are excluded from this calculation, as are those sites which are designated in the District Plan. The second estimate takes into account biophysical constraints that may reduce potential capacity.

162: Whangarei District Growth Strategy
PAR
T D
: SU
STA
INA
BLE
FU
TUR
E 30
/50
Arts, Culture and Civic AmenitiesTikipunga is relatively well served by civic amenities. Within the confines of Tikipunga, seven churches, two retail centres, and one community hall are located. Tikipunga also has a community library. Two public toilets can also be found within the Tikipunga node. Tikipunga is located about 5km from the City CBD. In terms of the closest beaches, Pataua North is 30km, Matapouri 31km, and Ocean Beach is 41km from Tikipunga.
The areas of Tikipunga, Glenbervie and Vinegar Hill contain quite a number of scenic walks and reserves, including Whangarei Falls and AH Reed Reserve with elevated boardwalks through a grove of Kauri trees. The Whangarei Golf Club also has open space characteristics and serves a recreation need, but this facility is a private commercial business.
Historic/Cultural HeritageTikipunga was originally developed by European settlers as a farming district, but since the Second World War has developed into a suburb of Whangarei and now contains busy commercial shopping centres, primary and secondary schools, and a mix of urban and rural land uses. The first school in the area was the Huanui School, which opened in 1893. The school was moved to its present site on the land donated by the Douglas family in 1914, and was renamed Glenbervie School. Tikipunga and the wider area around Glenbervie were heavily influenced by mining, especially coal mining in Kiripaka. The Kiripaka Mine officially opened in May 1893 and the Hikurangi mines in June 1894, producing a reported 150 tonnes a day.
Glenbervie has always been a farming and fruit growing area, with Huanui Orchards as one of the early orchards still thriving in the area. Parts of the Glenbervie area are characterised by historic stone walls. These walls are made from volcanic rock that was collected and cleared from the land to allow for farming, with the earliest walls dating back to 1850. These stone walls still strengthen and define the distinct landscape patterns of the area. Glenbervie has approximately 24km of stone walls, which account for 15% of the stone walls located in the district. There is a continuous wall running from the Huanui Orchards along Ngunguru Road until Ngunguru Ford Road. Part of this wall is heavily overgrown and not visible from the road.
There are nine known archaeological sites, and nine sites containing heritage tree(s) within the Tikipunga node. In addition, there are 24 sites registered on the New Zealand Historic Places Trust Register, and within the Whangarei District Plan. These include the old Hutchinson Farmhouse and accompanying barn and stone stable, the Douglas Stone Barn, and Mitchell House on Vinegar Hill Road. Glenbervie has other historic places registered on the Historic Places Trust, which are mainly burial sites, middens, pits and terraces located in the Glenbervie Forest.
Economy3.5.4
Business Profile and ProjectionsTikipunga has a small local business community. It is well served by a selection of shops and businesses, including a major supermarket, butchery, bakery, general store, greengrocers, post office and liquor stores, but doesn’t have many other wider services. Approximately 54% of the population lives within 500m of one of the two retail centres, and 80% of the population lives within 500m of the bus service.
In 2006, 3,045 employees lived in the node. Their main industries of employment were construction, retail trade, and healthcare. Most identified themselves as technicians, clerical workers, or managers and administrators. In terms of employees living within the node, the projections suggest 3,894 workers living in the node by 2041, and 4,606 by 2061.
the population in Tikipunga grows to around 10,000 people, it is possible that a local police station will be required over the next 30/50 years. This could also provide support to settlements on the Tutukaka coast. Given the proximity to fire services in other nodes, there may be no need for extra facilities in Tikipunga over 30/50 years.
Sense of Place/Urban DesignTikipunga contains a range of residential, recreational, commercial and rural land uses, whose character and distinctiveness is provided by the combination of natural and rural landscapes. This is particularly apparent for the rural Glenbervie area, where the gentle undulating countryside is characterised by historic stone walls and patches of bush, but also occurs in locations that look out onto places such as Vinegar Hill Road and the Hatea River Valley. The Whangarei Falls, Waitaua and Mangakino Streams divide Tikipunga from Glenbervie. The landscape of Tikipunga, Glenbervie and Vinegar Hill, is made up largely of pastoral land uses, contributing to its rural character.
The Paramount Plaza Shopping Centre, and the other retail shops near the Kiripaka Road roundabout are important focal points for the residential areas. Although there are a range of activities provided in Paramount Parade, more facilities could be developed in this centre, such as a cinema. Urban design elements, such as streetscape, walkability, mixed use development and sustainable design could also be applied to improve the shopping centre in the future. A design that is complementary to the neighbourhood and prioritises pedestrian access could provide both an inviting setting and create a thriving community centre with associated benefits for both developers and the community.
Glenbervie, Harris Road, and Vinegar Hill Road are all popular lifestyle areas, whilst locations near Gillingham Road, near the Countdown supermarket, and around Balmoral Drive are all more affordable housing locations. Therefore, a wide variety of urban characteristics emerge in Tikipunga.
Large proportions of Tikipunga’s housing stock were built in 1960-69 (28%) and 1970-79 (25%). The average age of dwellings in this area is approximately 38 years, which is close to the district average of 40 years. Of note is that only 9% of the housing stock in Tikipunga was built before 1960. There are likely to be some peaks in refurbishment or replacement of some dwellings over the next 50 years.
Culture3.5.3
Tangata Whenua Tikipunga is located within the rohe of Ngapuhi, and the hapu groups in the area are Ngati Hau, Te Parawhau and Te Waiariki. The Pehiaweri Marae (Te Reo o te Iwi) is located in the area. About 7% of the nodal area (251ha) is Maori land.
There are two sites of significance to Maori identified in the District Plan in the node, including the marae, urupa and church, and Puketotara Maunga, a wahi tapu. Also located in the node and important to Maori are the Otuihau (Whangarei) Falls, Paranui Falls, Tawatawhiti Papakainga (Mairtown area) and Puna on land next to the golf club. Further sites of significance to Maori may be identified in future, particularly with the development of Iwi Management Plans. Archaeological sites of Maori association in the node include one Maori horticulture find, one midden/oven, and five pit/terraces - a total of seven. Further archaeological sites may also be uncovered in future.

Whangarei District Growth Strategy :163
PAR
T D:
SUSTA
INA
BLE FU
TUR
E 30/50
Infrastructure3.5.5
WaterThe Tikipunga node is currently reticulated. In general terms, water reticulation reflects the extent of the residential areas, with the main water pipes reaching just past Whangarei Falls Bridge in an eastward direction, and also following the main residential roads to the north. One line follows Vinegar Hill Road, and connects Hikurangi to the reticulated system. Not all properties are connected to the reticulated water system, with many in the countryside area relying on other sources of water.
The main raw water source in the area is the Whau Valley Dam, but there is also raw water taken from the Hatea River. This water is treated at the Whau Valley Treatment Plant before storage at the Fairway Drive Reservoir. Water is then pumped to the Vinegar Hill Reservoir via the reservoir on Dip Road. Limiting factors of the water system include the Station Road Main Trunk, the Dip Road Reservoir, the Vinegar Hill Reservoir, Kamo Pump Lines, Kamo Pumps and local reticulation.
Some water works are required to meet projected population growth in the area. These anticipated works include increasing storage at Vinegar Hill and Trunk Line renewals/upsizing, at an estimated cost of $2.8 million.
WastewaterMuch of Tikipunga is reticulated. In general terms, the wastewater reticulation system parallels the extent of the residential areas. However the main wastewater lines extend further than the main water supply pipes, in this case as far as Glenbervie School in the east and the Waitaua Stream in the north. Parts of the network are currently at capacity with known areas of surcharge during rain events. The system is reticulated to the main Whangarei Waste Water Treatment Plant.
Further wastewater works are required to meet future demand. These include reticulation upgrades and/or installation of new trunk sewers and developing an increase in capacity of existing waste water treatment plant or new plant. If some lots are larger than 2,000m² and soakage is adequate then individual onsite wastewater treatment and disposal systems may prove acceptable with a subsequent reduction in the cost and need for Council asset upgrades. The estimated cost for the anticipated growth is $8.7 million.
StormwaterThe stormwater network is generally sufficient to service a 1 in 5 year rainfall event. Some property flooding occurs in more extreme events. Reticulation will require renewal/rehabilitation as necessary. In alignment with current best practice, future stormwater management is envisaged to be a continuation of current stormwater policies (through the Environmental Engineering Standards). Under these policies a developer is required to undertake onsite attenuation and treatment of stormwater generated by their development. This generally results in little impact to the existing Council stormwater network. Upgrades required are undertaken by the developer with possible Council contribution where an existing asset has limited remaining life. Under this approach, Council does not itself undertake projects involving creation of new stormwater infrastructure.
Stormwater catchment management plans in existence include the Waitaua Stream Catchment Drainage Plan (1995), and the Hatea River Catchment Drainage Plan (1997). The Waitaua Plan is being reviewed and updated.
Work options within the node are more limited, with 972 people working in Tikipunga in 2006. The main employment sectors were retail trade, manufacturing, and education and training. The occupations were professionals, sales workers, and managers and administrators. Around 42% of the population is presently in some form of employment. Local employment options are projected to rise to 1,349 by 2041, and 1,596 by 2061.
In the Statistics New Zealand Business Survey 2007, a total of 640 employees were found within the node. Employer numbers were put at 258, of which 187 were sole-operator/self-employed. In addition, a further 56 small businesses were located within the area (1-9 employees). Fifteen employers in the area employed more than nine people. Tikipunga west, around the supermarket, contained the most employees and the largest employers in the node. Other larger employers were in education and health and community services.
Boardwalk in AH Reed Memorial ParkFigure 108:
Business Land RequirementsIn terms of business area, there is a small amount of business land zoned in Tikipunga, mainly used in the commercial centre on Paramount Parade.
Business Projections, TikipungaTable 90:
2006 2041 2061Business floor area (m²) 9,505 12,897 16,229Business land area (ha) 22.64 31.76 37.56Employees (by workplace) 972 1,349 1,596
The business floor projections increase from 9,500m² in 2006 to 13,000m² in 2041, and 16,000m² in 2061. The amount of business land area to meet demand is expected to rise from 23ha, to 32ha in 2041, and 38ha by 2061. Much of this land would likely be used in commercial services as opposed to industrial uses, which are more likely to be located in the Kamo node around Springs Flat.

164: Whangarei District Growth Strategy
PAR
T D
: SU
STA
INA
BLE
FU
TUR
E 30
/50
Whangarei FallsFigure 109: TransportationThe Tikipunga node is currently serviced by a network catering for just over 30,000 vehicles per day. This is projected to rise to just over 49,000 vehicles per day in 2061. There are no known backlog requirements in the node that cannot be met under existing programmes. Various roading works are required to meet anticipated population growth in Tikipunga, as well as increased populations along the Tutukaka coast. The total amount of road types and lengths within the node include 0.6km of State Highway, 5.5km of arterial roads, 19km of collector roads, and 22km of public roads for residential use. Roading upgrades will require an estimated $2.5 million of additional Council expenditure to meet population growth.
The Spedding Road Link is to be built in conjunction with the Kamo Bypass. The Spedding Road Link involves the construction of a new link between Spedding Road and the Kamo Bypass Stage 2. A connection will be provided from the Spedding Road Link to the community of Otangarei, just to the south. New signals will also be installed at the Kamo Bypass Stage 2/Spedding Road Link intersection. The link will provide a more direct access to/from State Highway 1 for the communities of Tikipunga and Otangarei, facilitating reduced travel times and better community connectivity. The project includes walking and cycling connections to Tikipunga and Otangarei. Construction is planned to start in early 2010 and has been estimated at $1 million in 2009/10 and $2 million in 2010/11.
Parks and ReservesThere are several parks and reserves in the node, some of which are quite important for sporting and tourism reasons, including the Whangarei Falls Reserve, AH Reed Memorial Reserve and the Tikipunga Sports Park. Reserves constitute an area of 91ha, and also include three playground facilities. Other small reserves include Amber Drive Reserve, Cobham Place Reserve, Heretaunga Street Reserve, Haruru Place Reserve, Korau Road Reserve and Takahe Street Reserve. The Whangarei Golf Club is located within the node.
An analysis of ‘Neighbourhood’, ‘Sports’ and ‘Other’ parks found 1.32ha, 0.56ha and -11.73ha of existing capacity respectively. Good neighbourhood and sports field provision is present in this node but ‘other’ parks (i.e. natural reserves) are limited. To meet present service levels, it is anticipated that a further 32ha of local parks or natural area reserve is required to meet population growth. As well as the land, it is expected that other facilities would be constructed within present and future reserve areas. The estimated cost for parks and reserves within the node is $11 million.
Summary3.5.6
Tikipunga is a large urban residential area located in the north-east of Whangarei City, which has seen moderate levels of recent growth. A visible commercial core, centred around a large supermarket, has begun to provide a central focus for increased business opportunities. There are substantial opportunities to increase residential development. Despite this high capacity, residential development in the area has not been as rapid as other locations. There may need to be increased efforts to encourage the uptake of residential land opportunities. Efforts to connect the various parts of Tikipunga could be an important element of future planning in the node. The Spedding Road extension will provide an alternative route to other parts of the City, which should alleviate some of the existing traffic flow problems along Kiripaka Road.
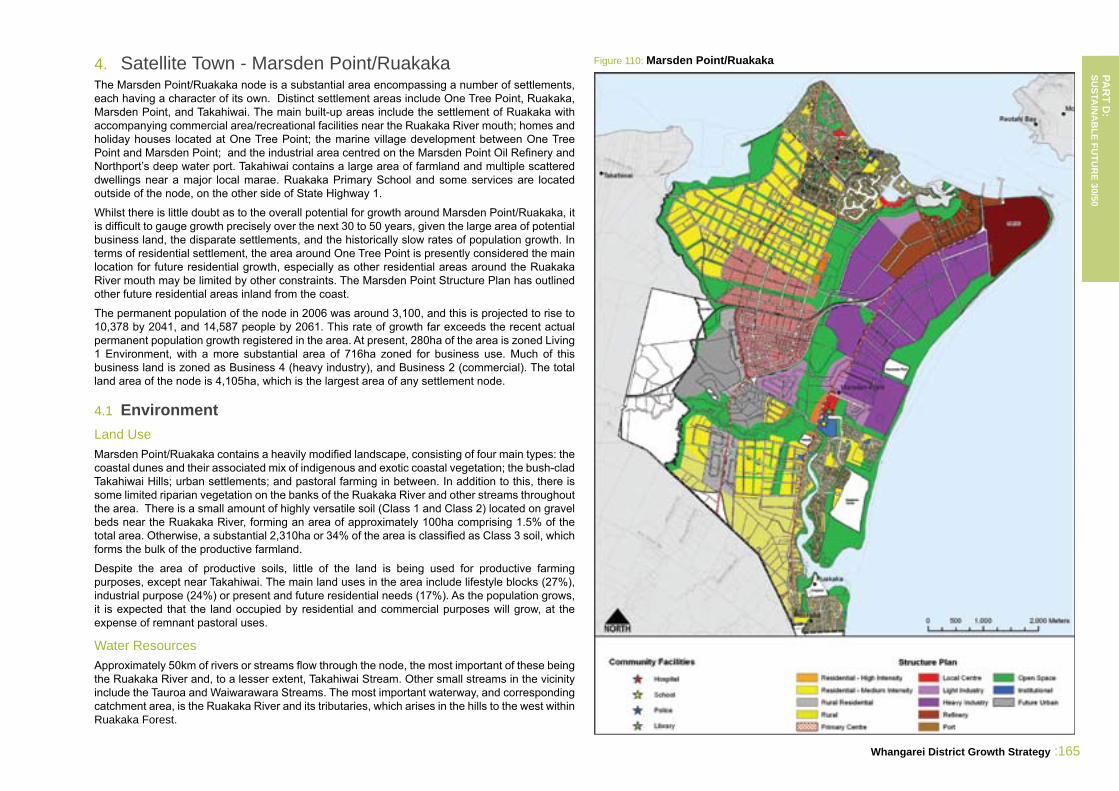
Whangarei District Growth Strategy :165
PAR
T D:
SUSTA
INA
BLE FU
TUR
E 30/50
Marsden Point/RuakakaFigure 110: Satellite Town - Marsden Point/Ruakaka4. The Marsden Point/Ruakaka node is a substantial area encompassing a number of settlements, each having a character of its own. Distinct settlement areas include One Tree Point, Ruakaka, Marsden Point, and Takahiwai. The main built-up areas include the settlement of Ruakaka with accompanying commercial area/recreational facilities near the Ruakaka River mouth; homes and holiday houses located at One Tree Point; the marine village development between One Tree Point and Marsden Point; and the industrial area centred on the Marsden Point Oil Refinery and Northport’s deep water port. Takahiwai contains a large area of farmland and multiple scattered dwellings near a major local marae. Ruakaka Primary School and some services are located outside of the node, on the other side of State Highway 1.
Whilst there is little doubt as to the overall potential for growth around Marsden Point/Ruakaka, it is difficult to gauge growth precisely over the next 30 to 50 years, given the large area of potential business land, the disparate settlements, and the historically slow rates of population growth. In terms of residential settlement, the area around One Tree Point is presently considered the main location for future residential growth, especially as other residential areas around the Ruakaka River mouth may be limited by other constraints. The Marsden Point Structure Plan has outlined other future residential areas inland from the coast.
The permanent population of the node in 2006 was around 3,100, and this is projected to rise to 10,378 by 2041, and 14,587 people by 2061. This rate of growth far exceeds the recent actual permanent population growth registered in the area. At present, 280ha of the area is zoned Living 1 Environment, with a more substantial area of 716ha zoned for business use. Much of this business land is zoned as Business 4 (heavy industry), and Business 2 (commercial). The total land area of the node is 4,105ha, which is the largest area of any settlement node.
Environment4.1
Land UseMarsden Point/Ruakaka contains a heavily modified landscape, consisting of four main types: the coastal dunes and their associated mix of indigenous and exotic coastal vegetation; the bush-clad Takahiwai Hills; urban settlements; and pastoral farming in between. In addition to this, there is some limited riparian vegetation on the banks of the Ruakaka River and other streams throughout the area. There is a small amount of highly versatile soil (Class 1 and Class 2) located on gravel beds near the Ruakaka River, forming an area of approximately 100ha comprising 1.5% of the total area. Otherwise, a substantial 2,310ha or 34% of the area is classified as Class 3 soil, which forms the bulk of the productive farmland.
Despite the area of productive soils, little of the land is being used for productive farming purposes, except near Takahiwai. The main land uses in the area include lifestyle blocks (27%), industrial purpose (24%) or present and future residential needs (17%). As the population grows, it is expected that the land occupied by residential and commercial purposes will grow, at the expense of remnant pastoral uses.
Water ResourcesApproximately 50km of rivers or streams flow through the node, the most important of these being the Ruakaka River and, to a lesser extent, Takahiwai Stream. Other small streams in the vicinity include the Tauroa and Waiwarawara Streams. The most important waterway, and corresponding catchment area, is the Ruakaka River and its tributaries, which arises in the hills to the west within Ruakaka Forest.

166: Whangarei District Growth Strategy
PAR
T D
: SU
STA
INA
BLE
FU
TUR
E 30
/50
Blacksmith’s Creek Estuary (Q07/144), Takahiwai Stream Estuary (Q07/143), Ruakaka Dunelands (Q07/128), McEwan Road Wetland (Q07/131), Ruakaka Racecourse Dune Lake (Q07/129), Ruakaka River Estuary (Q07/130), and Simes Road Wetland (Q07/141). Locations just outside the main node, but being habitat of importance, include places such as Doctors Hill Road Wetland (Q07/127), Ruakaka River Forest Remnants (Q07/119) and Takahiwai Forest (Q07/124).
These ecological areas are important in that they provide habitat for a wide range of threatened and regionally significant species and provide links with other habitats. In this coastal location, much of the vegetation acts as a protective buffer between land and sea. The Ruakaka Dunelands comprise the largest continuous stretch of duneland habitat in the Waipu Ecological District, and are an important breeding and wintering site for the Variable Oystercatcher. The Ruakaka Racecourse contains the only dune lake in this Ecological District and is one of only five natural coastal wetlands remaining in the Waipu Ecological District. Blacksmith’s Creek Estuary is the third-largest estuarine habitat in this Ecological District and it contains a diverse range of estuarine, freshwater and terrestrial vegetation and provides a protective buffer to the coastal fringe. The Ruakaka River Forest Remnants are recognised as a corridor, linking the Ruakaka Forest, Takahiwai Forest and Mangapai Caves Road Forest and Shrubland. There are two coast care groups operating in the area – the Bream Bay Coastal Care Trust and the Pyle Family Coastcare Group.
Around 390ha or 10% of the nodal area is formally protected by Department of Conservation reserve, Council reserve, esplanade reserve or private covenanting. This includes 565ha (51%) of PNA areas (areas of ecological significance). Sixty-nine percent of the total node area (2,846ha) is classified as acutely or chronically threatened (<20% indigenous vegetation cover remaining). A break down of acutely and chronically threatened environments within the PNAs, and the amount and type of formal protection in these is shown in Table 91. Most of Marsden Point/Ruakaka is categorised as an acutely or chronically threatened environment, and only about 128ha of habitat fragments remain, half of which is protected.
Significant Natural Areas and Formal Protection of These Within Acutely and Table 91: Chronically Threatened Environments
Area of PNA within Acutely or Chronically Threatened Environment (ha)
Area of Formal Protection Within Area of PNA that is Acutely or Chronically Threatened (ha)Conservation Covenant
QEII Esplanade DoC WDC Park/ Reserve
Total (ha) Proportion Protected
128.34 45.83 20.77 66.60 52%
Source: Whangarei District Council, Department of Conservation, Land Environments New Zealand.
Landscape/Natural CharacterIconic of the Marsden Point/Ruakaka node, is the expansive and exposed beach at Bream Bay. The flat and open topography brings a sense of spaciousness to the shore, and the breadth of the open sea and continuity of the horizon is emphasised. Also, due to the openness and spaciousness of the beach, the Whangarei Heads across the harbour are strikingly visible from this node. The settlement of Ruakaka is located behind the dune sequence, and does not intrude into the landscape here. The oil refinery is visible, however,
Further inland, land use turns rural in nature, characterised by a landscape of farmed coastal flats. A regular paddock and shelterbelt pattern dominates, and gives a controlled production atmosphere to the area. Housing is quite visible in these areas, and poorly integrated with the landscape.
The other catchment area, Marsden Point Catchment area, rises in the Takahiwai hills, flows through Takahiwai, and reaches Whangarei Harbour. It also includes smaller streams throughout Marsden Point, One Tree Point, and Takahiwai.
The Marsden Point/Ruakaka node overlies the Marsden Point/Ruakaka Aquifer which is the largest in the district (just under 9,000ha in extent). This aquifer system stretches from Marsden Point to Waipu, between the coast and State Highway 1. The actual number of bores relative to the size of the area is very low, and the presence of a reticulated water system means that future local dependence on bore water may remain low.
Air QualityAir quality at Marsden Point/Ruakaka is largely influenced by the presence of heavy industry in the area. The Refinery and Carter Holt Harvey LVL Plant account for 100% of Sulphur Dioxide (SO2) emissions, 99% of Nitrogen Dioxide (NO2) emissions and 98% of PM10 (particulate matter smaller than 10 microns in diameter) emissions. The area has also been identified as an airshed where air pollutants may come close to, or exceed, national standards for air quality at times. In addition to Marsden Point and Ruakaka, the airshed area covers the McLeod Bay, Taurikura and Parua Bay settlements across the harbour. The main pollutant of concern in the area is SO2, but PM10 may also become more of an issue with increasing domestic and industrial development over time.
Under government regulations, if an air quality standard is breached within an airshed, the regional authority must develop a path to compliance by 2013. If the standard is breached after this time, no new air discharge consents for that pollutant may be granted. Modelling by NIWA has shown that predictions of SO2 levels approach standards for this pollutant in the immediate vicinity of the oil refinery, and that the airshed may be close to capacity for SO2 at this location. Given the potential for both significant residential and industrial development over the next 30/50 years, as signalled in the Marsden Point/Ruakaka Structure Plan, air quality may well become a serious constraint for development in the area.
Natural HazardsA substantial proportion of the node is regarded as being flood susceptible - about 1,180ha or 17% of the node. The flood susceptible land is located across the whole of the area, especially around, but not limited to, the Ruakaka River. Other areas are near small streams or are areas where ponding occurs. In addition, approximately 28% of the total parcels of land available for development in the area are located within flood susceptible areas. It is noted that engineering solutions can alleviate flood susceptibility risk in some areas. Most transport routes are potentially affected by flood risk.
Coastal hazards are an important consideration in Marsden Point/Ruakaka. Coastal hazards can include coastal erosion and coastal inundation. The Bream Bay Coast and the harbour shoreline are both identified as coastal hazard areas in the District Plan.
The population of Marsden Point/Ruakaka is projected to have an overall increase in exposure to flood susceptibility risk over time, mainly due to increasing population, an ageing population, and the large number of holiday dwellings and temporary residents. A small amount of land (196ha or 3% of the total area) is erosion prone.
BiodiversitySome significant natural habitat (760ha or 17%) is contained within this node, most of which is located along the coast and includes some estuarine areas. Little remains of significant vegetation remnants elsewhere. The listed significant areas include Whangarei Harbour (Q07/058),

Whangarei District Growth Strategy :167
PAR
T D:
SUSTA
INA
BLE FU
TUR
E 30/50
Over the longer term (and the scope of this strategy), sea level rise could cause some issues in the vicinity of the industrial areas, present and future, as well as changes in water flow patterns along Ruakaka River. If sea level rise was to occur more swiftly than presently predicted, there may be more concerns relating to flooding risk in the long term. In addition, sea level rise is likely to exacerbate existing coastal erosion problems. However, the exact nature and scale of increased coastal erosion is uncertain.
Society4.2 The median household income within Marsden Point/Ruakaka area is $45,000, which is just above the district average of $43,900. However, about 49% of the population are more deprived under the Deprivation Index. This suggests a wide diversity in income and resources across the area. The median age of permanent residents within the node was 42.3 years in 2006. About 30% of the population was under 20 years of age in 2006, and this is projected to decline as a proportion over time, but actual numbers increase as resident numbers increase. In 2006, approximately 16% of the population was aged 65 years and over. This is projected to reach 29% by 2041, and 34% by 2061. By 2061, this would mean that 4,971 residents over the age of 65 years would live within the node, up from the present 510. This equates to an increase of 16% per annum, which suggests a significant need for accommodation and services suited to an older population.
Residential Land RequirementsEstimating future residential land requirements in Marsden Point/Ruakaka is complex, with factors such as increased population and declining household sizes needing to be taken into account. This is further compounded by an expected future consolidation of settlement patterns as well as the potential for declining average lot sizes within the urban environment. Any assessment needs to take into account supply and demand factors.
Demand, in this case, needs to take into account the declining household size (from 2.6 to 2.4) and a probable small increase in consolidation to more urban dwellings. The present split between urban and non-urban households in Marsden Point/Ruakaka is 79/21, with 946 households within the Living Environments, and 259 households outside of them. Over time, a target split of 79/21 by 2061 has been used. This preferred split is the same as the present level, which differs from most of the other nodes. This split was used because of the major difficulties in estimating future population and the substantial size of the nodal area. It is also close to a preferred theoretical split for planning purposes.
In terms of demand, Marsden Point/Ruakaka is categorised as a future satellite town, with a projected future population of 10,378 in 2041, or 4,151 households. In 2061, the population is projected to reach 14,586 people, or just over 6,000 households. If the target split is achieved then this would result in 4,774 households located within Living Environments, and 1,304 outside the Living Environments. As can be seen from the table below, there are a substantial number of existing vacant lots available in Marsden Point/Ruakaka, enough to meet increased levels of demand over the next ten years based on projections for the area.
Projected Population and Household Residential DemandTable 92:
2006 2011 (projected)
2041 (projected)
2061 (projected)
Existing vacant lots
Vacant lot shortfall
(year)Population 3,108 3,713 10,378 14,586 - -Total households (lots) 1,205 1,439 4,151 6,078 843 -Households (Living 1,2,3) 946 1,130 3,260 4,774 630 2021Households (rural/residential) 259 309 891 1,304 213 2026
A small proportion of notable landscape (Landscape Sensitivity 6), as identified in the District Plan, is located in the node – mainly around the coastal dunelands. An even smaller portion is regarded as significant (Landscape Sensitivity 5) according to an initial landscape study of the district. This land is associated with attractive production lands. There is one Outstanding Natural Feature and Geological Site of National Importance in the node – the One Tree Point Interglacial Beach and Dune Deposits.
Ecosystem ServicesIn terms of ecosystem services, dunelands along the coast play an important role in buffering wave action along the coast behind which is located low lying land. The vegetation in the upper hills of the Ruakaka Catchment and the Takahiwai Hills provides high quality water, water recharge, and flood attenuation services. However, in the face of expanded residential demand, increased use and restoration of vegetation for the purposes of flood attenuation is likely to be necessary alongside waterways throughout the area, a point reflected in the design of the Marsden Point/Ruakaka Structure Plan. Air quality regulation is also important, given potential industrial development in the wider area.
Ruakaka BeachFigure 111:
Climate ChangeIn the medium term, potential climate change impacts within Marsden Point/Ruakaka are expected to be similar to those that may affect the district as a whole. These impacts consist mainly of concerns around increased inundation along areas that are already flood susceptible, and increases in extreme weather patterns. Evidence from other coastal locations around the globe suggests that coastal aquifers can be at risk from salt-water intrusion, especially during periods of low flow. Sea level change can have an impact on the local water table through changes in pressure, and may exacerbate the risk of saltwater intrusion. Despite this, in the medium term, sea level change is not projected to be a significant constraint to future development.
168: Whangarei District Growth Strategy
PAR
T D
: SU
STA
INA
BLE
FU
TUR
E 30
/50
Expansion of Bream Bay College may be an option, but if this is limited an alternative may be to build a new secondary school in the One Tree Point Area. Re-establishing a ferry service from Parua Bay/Whangarei Heads area may also be an option, allowing easier access to secondary school facilities for students from these areas. If further schools are required, suitable areas of land need to be set aside in advance of development, to ensure the schools are optimally located.
The minimum land area required for primary schools is approximately four hectares (allowing for sports fields), and for secondary schools approximately 10ha are needed (including sports fields). Schools generally need to be situated near main public transport routes and safe walking/cycling networks. In addition, they would ideally be situated adjacent to open space and away from industrial areas. A potential limiting factor to available land is the expected increase in industry within this node over the next 30/50 years, increasing potential reverse sensitivity effects. The Council needs to liaise with the Ministry of Education to enable efficient future planning for schools in the area over the next 30/50 years.
Marsden Point/Ruakaka has two medical centres and one chemist facility located in the node. Notably, none of the population lives within 500m of the medical centre, which reflects the relative isolation of the residents from the local shopping areas. Ruakaka shopping village is approximately 30km to the Whangarei Hospital, whilst One Tree Point is approximately 36km to the Hospital. A small St. John ambulance station is located at Bream Bay, and employs two (FTE) ambulance officers along with 16 volunteers.
If the population at Marsden Point/Ruakaka grows to around 15,000, it is estimated that around 10 or 11 GPs would be needed (a minimum ratio of 1 GP to 1,400 people is recognised in the Health and Disability Services Act 1993). There is likely to be a demand for an after hours emergency service, which could also provide care for Waipu and other surrounding areas. With an increasing proportion of elderly people, an accessible after hours service is particularly important.
Government is currently working with District Health Boards to establish Integrated Family Health Centres to provide comprehensive primary care in one location. These centres would provide services from a range of health professionals, including GPs, primary care nurses, visiting specialists, midwives, pharmacists, podiatrists, oral health professionals, etc. This could be an option in the area, and if the centre provided basic diagnostic services (e.g. x-rays) and treatment, it could take pressure off the Emergency Department at Whangarei Hospital, although serious cases would still need to be transferred to the hospital. Another option is to have a health centre/community hospital, which has a small number of inpatient beds for elderly/continuing care/low risk maternity patients, which are cared for by local GPs and midwives. Outpatient clinics and a variety of community services could also be provided at this facility.
There are no retirement villages or rest home facilities in the Marsden Point/Ruakaka node, with the nearest being located at Waipu. The number of people aged 65 years and over is expected to increase significantly and it is expected that retirement facilities and rest homes will be needed in the area. The ageing population will place additional demands on health care services, particularly an increased demand for rest home, hospital and dementia beds. An ageing population is also more likely to be located within easy access to facilities, i.e. in towns and villages. Thus locations near Ruakaka Village and other future shopping centres would be preferred sites.
There is currently a small police station and volunteer fire station located within the node. The police station currently has four police officers/support staff. The number of police officers/support staff required for Marsden Point/Ruakaka would increase significantly if the population approaches 15,000 over the next 50 years. A larger station is likely to be required at Ruakaka to accommodate
The average Living Environment lot in Marsden Point/Ruakaka is 0.08ha, whilst the average rural residential lot outside of the Living Environments is 0.56ha. If these average lot sizes remained consistent over time, and the preferred split is achieved, then Table 93 gives an estimate of the amount of land required for residential purposes only. This would equate to 306ha of new urban land being required, and 585ha of rural residential land required outside of the Living Environments.
Residential Land Area Required to Meet Projected DemandTable 93:
2006 (estimate) 2011 (projected) 2041 (projected) 2061 (projected)Total urban residential land area(ha) 75.7 90.4 260.8 381.9New urban residential land area (ha) - 14.7 185.1 306.2Total rural/residential land area (ha) 145 173 499.0 730.2New rural/residential land (ha) - 28 354 585.2
Capacity refers to the availability of present or potential lots available to accommodate future population and the capacity to undertake subdivision should future growth patterns warrant it.
Capacity Under the Whangarei District Plan and Applicable Structure PlanTable 94:
District Plan Living 1,2,3 (maximum)
District Plan Living 1,2,3
(constrained)
Structure Plan Living 1,2,3 (maximum)
Structure Plan Living 1,2,3
(constrained)Population 8,756 4,804 40,162 22,136Maximum households (lots) 3,648 2,002 16,734 9,223Potential for new lot creation (2011) 1,888 241 14,974 7,463Projected year capacity exhausted 2045 2023 2222 2121
Present development potential under the Whangarei District Plan and the Marsden Point/Ruakaka Structure Plan is noted in Table 94. Two types of estimates for capacity are given for both District Plan and Structure Plan. The first estimate is the theoretical maximum number of lots based upon all available land (by land area) being utilised. Present lots that are too small to subdivide are excluded from this calculation, as are those sites which are designated in the District Plan. The second type takes into account biophysical constraints that may reduce potential capacity. In this calculation the factors of flood susceptibility, significant natural habitat, and high land stability were applied, in addition to the exclusion of small lots and designated sites. The final number of households or lots is likely to be between the two estimates, as no constraint is absolute.
It is apparent that there is ample land zoned in the node under the District Plan at this point in time to meet projected growth over the next 20 years or so. Under the Structure Plan, there is a significant over-supply of both residential and business land indicated for future zoning. Based on projected growth there is capacity in the Structure Plan for growth over the next 100-200 years.
Education, Health, and SafetyThree schools, including one secondary school, are located within the settlement or on its edges. These include Bream Bay College, One Tree Point Primary School and Ruakaka Primary School, all decile 4 schools. Approximately 29% of the population is located within 500m of a school. The school roll across these schools was 640 in 2009.
If there is significant growth in the Marsden Point/Ruakaka area (up to 15,000 people over the next 50 years), it is likely that more primary schools, and potentially another secondary school will be required. Expansion of the current primary schools would be the first step to accommodating growth in the area, as these have yet to reach their allocated capacity. One, possibly two, new primary schools will be required, in addition to more pre-schools and kohanga reo as the population climbs towards 15,000.

Whangarei District Growth Strategy :169
PAR
T D:
SUSTA
INA
BLE FU
TUR
E 30/50
Understanding with Council in 2004 and produced an Environmental Plan in 2007. These should be taken into account when undertaking planning functions in the area. Notably, no Maori land is recorded as being within the Marsden Point/Ruakaka boundaries, although there is Maori land located to the west of Takahiwai Marae.
Significant features to Maori prominently viewable from the node include Bream Head and Mount Manaia; no sites of sites of significance to Maori are identified in the node in the Whangarei District Plan. However, further sites of significance to Maori may be identified in future. Archaeological sites of Maori association in the node include two artefact finds, six pa sites, 99 midden/oven sites (reflecting the coastal location), seven pit/terraces, and two unclassified – a total of 116. Further archaeological sites may also be uncovered in future.
Arts, Culture and Civic AmenitiesRuakaka node has one community library and one community hall within its confines, both of which are at Ruakaka Village. In addition, there is also a Whangarei District Council Service Centre located at Ruakaka. Sports club grounds can be found in Ruakaka Village, including football fields and bowling greens. There are five public toilets scattered across the area. As well as this, there are seven churches in the node. The Ruakaka Racecourse is located in the node along with a motor camp at the mouth of the Ruakaka River. To meet future population growth, a branch library may be necessary to meet community needs. The distance from Ruakaka to the CBD is 30km, whilst One Tree Point is around 36km from the CBD of Whangarei. This has contributed to the range of services available in the area.
Historic/Cultural HeritageThe multiple different settlements reflect the differing early settlement types around the Bream Bay area, with settlements established at Ruakaka, One Tree Point, Marsden Point, and the long standing Maori settlement at Takahiwai. Whilst land blocks had been purchased in the area prior to 1839, European settlement didn’t advance until after 1862, at which time the records suggest only seven farmers lived near Marsden Point. Marsden Point/Ruakaka is rich in archaeological sites, with 118 known sites being recorded in the area. However, there is little visible built heritage in the node.
In the early years following European settlement, Takahiwai supplied flax for flax mills around Whangarei, but land use later changed to dairy and beef farming. One Tree Point’s initial significance was based around the availability of a jetty for the supply and delivery of goods, but later character evolved around holiday homes. Whilst some development, such as the estate of Belle Vue, occurred early (1865), overall there wasn’t a high level of population growth in the area. Marsden Bay and Marsden Point’s origins include the development of a small port which was used from 1850, with a permanent wharf built in 1865, which was later destroyed. An attempt was made to build a replacement wharf in 1888.
Other community assets, such as schools, emerged much later than others in the district, with different periods for each settled area. The first school was at Ruakaka in 1898, the second in 1899 at Takahiwai, Marsden Point School in 1914, and One Tree Point School in 1972. The first general store was in Ruakaka operating from 1910-17, and then the Marsden store in the 1920s. The first post office was established at Marsden Point in 1888, then Ruakaka in 1896-1901, and Takahiwai in 1913-1963. In 1920, the Ruakaka Domain was developed, and a number of holiday homes were built during 1930-1950. Despite these developments, overall there has always been a lack of growth in the area which resulted in the distribution of pamphlets in the 1880’s to attract more settlers to the area. This lack of growth, despite its potential, contributes to the uncertainty around future population growth.
increased staff levels in future. In addition, the fire and ambulance stations will need expanding if the population increased to 15,000.
Sense of Place/Urban DesignMarsden Point/Ruakaka is characterised by a sweeping expanse of beach, which brings a sense of spaciousness to the area. The expanse of the sea and the continuity of the horizon in the distance is emphasised within this area that differs significantly from the rocky bays and estuaries to the north and south. Settlements in Ruakaka tend to be nestled in the shelter of the dune sequence and consequently don’t intrude significantly into the beach environment, although some dwellings at One Tree Point are situated very close to the harbour. However, industrial elements break up the view, with the chimneys and industrial structures of Marsden B Power Station and Marsden Point Oil Refinery at the northern end of the beach.
The main settlement areas have different qualities. One Tree Point tends to be dominated by a mix of older baches and, increasingly, substantial holiday homes and permanent residences. Ruakaka Village also has a mix of dwellings, with substantial areas of older state housing dating to large scale construction projects in the area, some permanent dwellings from the 1980s, and an increase in larger holiday houses since around 2000. Many of the newer structures are located in areas with significant views of the coastal environment and near the Ruakaka River Mouth.
Large proportions of the node’s housing stock was built between 1970 and 1979 (23%) and since 2000 (28%). The average age of dwellings in this area is approximately 31 years, which is amongst the lowest in the district. This reflects some of the recent building activity, especially in houses for non-permanent residents. Very little of the housing stock was built before 1960, with only about 6% of the stock dating from that period, the lowest in the Whangarei District, and reflects a lack of built heritage across the wider area.
Contributing to the ‘marine’ sense of place of the node was the recent construction of the marine village in Marsden Bay, featuring canal side residential development along with some associated commercial development including restaurants, shops, bars, etc. This development has encompassed high quality design features, and when completed will add considerably to the aesthetic and amenity values of the node and contribute to the area’s sense of place as a marine recreational centre.
With the development of the Marsden Point/Ruakaka Structure Plan, the Marsden Point/Ruakaka area has a significant opportunity to be developed as a healthy, safe and attractive place where business, social and cultural life can flourish. A well designed and well managed public realm will contribute to community pride and identity for the Marsden Point/Ruakaka area, in conjunction with strong and diversified employment opportunities. In doing so, one of the most important components of creating a sustainable town is to identify and promote development of a primary mixed use centre in Marsden Point. The primary centre can integrate a hierarchy of density, diversity of residences, and a mix of uses, within a well connected and coherent public transport, walking and cycling network. There is considerable opportunity to ensure a centre of high aesthetic and amenity value by employing high quality urban design in planning and development processes.
Culture4.3
Tangata Whenua Marsden Point/Ruakaka is located within the rohes of Ngatiwai and Ngati Whatua; the hapu groups in the area are Patuharakeke, Te Koiwi, Te Parawhau and Ngati Tu. The Takahiwai Marae (Rangiora) is located in the area. Patuharakeke Te Iwi Trust Board signed a Memorandum of

170: Whangarei District Growth Strategy
PAR
T D
: SU
STA
INA
BLE
FU
TUR
E 30
/50
Currently, 344ha of business zoned land is unoccupied by a building, and is therefore considered vacant. Around 372ha of business zoned land is occupied by a building used for business purposes.
Given the scattered location of businesses and the largely undeveloped nature of business land in Marsden Point/Ruakaka, future business land requirements have been based on the average employee density for Whangarei District. Research shows that the average employee density for the Whangarei District is representative of industrial employee densities for New Zealand (McDermott Consultants, 2006). Therefore, based on the employee projections for Marsden Point/Ruakaka and an employee density of 17, there is no necessity to increase business zoned land in Marsden Point/Ruakaka over the next 50 years. Any future business land requirements could be met by developing existing vacant business land. As mentioned earlier there may be a need for further commercial/retail land to be zoned over the medium term.
Infrastructure4.5
WaterThe Marsden Point/Ruakaka node is currently reticulated over much of the area. The main source of water is Wilson’s Dam. Water is transported from Wilson’s Dam to the Ruakaka Water Treatment Station for treatment before storage in the Ruakaka Reservoir. Several large pipelines then connect to various settlements in Marsden Point/Ruakaka from this initial source. Small reticulation pipes are spread throughout the residential settlements, and a large pipeline connects southwards to Waipu. A second raw water take occurs from the Ruakaka River, but this is of limited quantity.
Overall, the main limiting factor to water supply across the area is the reticulation line between reservoir and the various settlements. To meet future population needs, some of this work would require the reconfiguration of trunk lines around the Water Treatment Plant, reservoirs and McCathie Road. It has also been projected that an extra storage reservoir at Sergeants Hill is required. In addition, upgrades to the Port Marsden Highway Water Main, the Ruakaka Reservoirs Three and Four, and stage two upgrades to the Ruakaka Water Treatment Plant are required. The estimated cost for improvements is around $16 million.
WastewaterMuch of the Marsden Point/Ruakaka area is reticulated. In general terms, the main sewage system follows the settlements along the coast, connecting as far south as Ata-Mahina Way near the Ruakaka River Mouth. From there it passes along Marsden Point Road, parts of the Marsden Highway, Marsden Point, and across to the residential areas in One Tree Point. Outside of these areas, other options such as septic tanks are being used. Treatment of wastewater is undertaken at the Ruakaka Wastewater Treatment Plant, which has recently been upgraded.
Reticulation is sufficient to service existing demand but will require renewal/rehabilitation as necessary. However, the substantial level of projected growth means that other works will be required to meet new demands. These works range from reticulation upgrades and/or installation of new trunk sewers and an increase in capacity of the existing wastewater treatment plant or a new plant. Based on current cost estimates for future wastewater treatment plant upgrades, the cost estimate for this node is $128 million.
StormwaterThe stormwater network is generally sufficient to service a 1 in 5 year rainfall event, with some property flooding occurring in more extreme events. Reticulation will require renewal/rehabilitation
Economy4.4
Business Profile and ProjectionsMarsden Point/Ruakaka has a reasonably sizable commercial community, especially when compared with the size of the permanent population. Two small local business centres are located in the node; one being the existing primary centre at Ruakaka, and the other is the existing/proposed extended centre near the One Tree Point residential area. These centres are the most important commercial areas in the south of the district apart from Waipu, and the distance from the Whangarei CBD necessitates additional services to be provided. In addition, Marsden Point/Ruakaka has a large summer population, and this requires more goods and services to be available. Notably, very few people live within 500m of the main shopping centre, and there is no public transport available within the area.
In 2006, a total of 1,356 employees lived in node, many of whom were employed in manufacturing, construction, and health industry sectors. The main occupations of these workers were identified as managers or professionals. Around 42% of the population is presently in some form of employment. Those employees who work within the node are generally technicians or professionals. Jobs within the node are more limited, with around 1,100 jobs being noted. The main industry sectors are manufacturing, financial services, and education and training.
From the Statistics New Zealand Business Survey (2007), 300 businesses were identified within the node, including 194 self-employed/sole-operators, as well as 84 small businesses employing between one to nine employees, and only 22 businesses employing more than nine people. Many of these larger employers are involved in the manufacturing, construction, and transport and storage sectors. According to these figures, Marsden Point/Ruakaka is the biggest employment area outside of Whangarei and Kamo, with around 1,330 employees in total. In addition, there is a small group of people working in financial services.
The numbers of employees working in the node is projected to rise from around 1,100 in 2006 to 3,285 in 2041, and 4,617 in 2061. This estimate would see Marsden Point/Ruakaka becoming the second largest employment area in Whangarei District, outpacing Kamo, but would still contain less than 25% of the employment in Whangarei City. This estimate also indicates a need for transport options for employees living in Marsden Point/Ruakaka to Whangarei City, and vice versa, depending on how job creation eventuates.
Business Land RequirementsOverall, it is clear that a significant amount of business land is available within the Marsden Point/Ruakaka node, much of which is zoned for industrial purposes. However, there is limited land presently zoned for commercial and retail purposes within the wider area. Future projections, based upon business floor area assumptions in the Whangarei District Growth Model (2008), suggest a continuing demand for business land in Marsden Point /Ruakaka.
Business Projections, Marsden Point/Ruakaka Table 95:
2006 2041 2061Business Floor Area (m²) 326,497 1,088,095 1,529,403Business Land Area (ha)* 63 165 233Employees (by Workplace) 1,071 2,813 3,953
* Business area includes land zoned Business 1, 2, 3, 4 and Port Industrial, and does not include the Port or Marsden Point Oil Refinery.
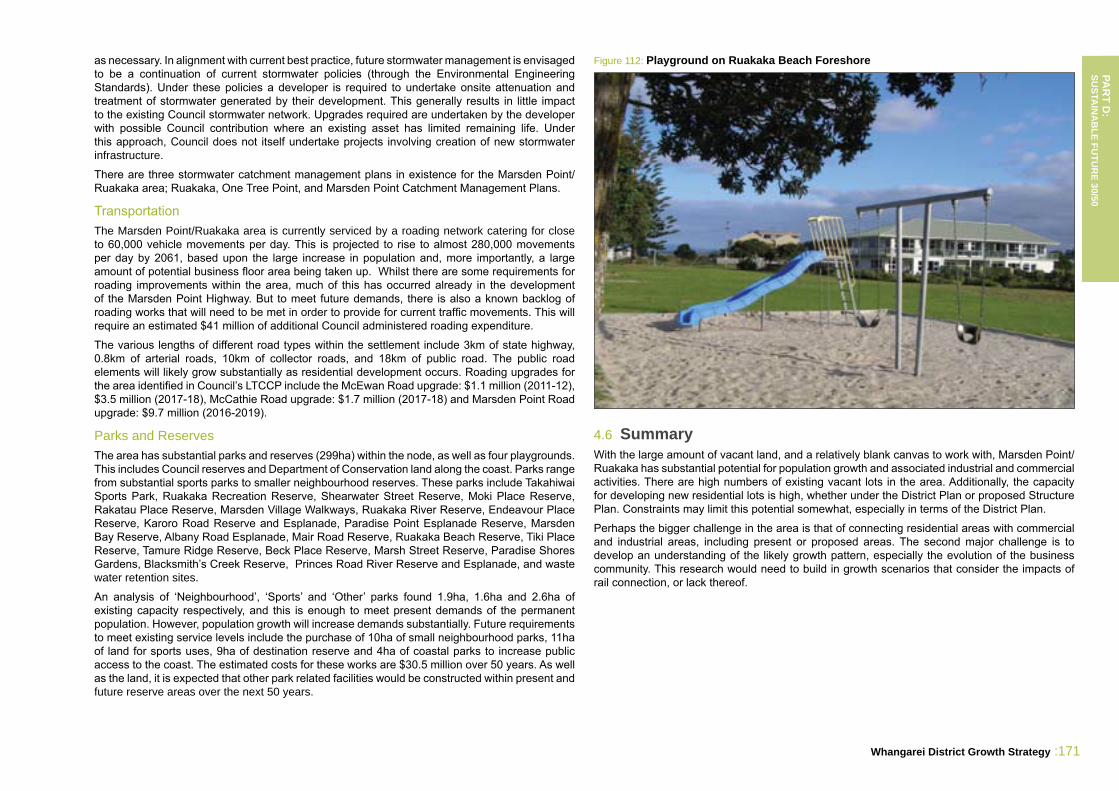
Whangarei District Growth Strategy :171
PAR
T D:
SUSTA
INA
BLE FU
TUR
E 30/50
Playground on Ruakaka Beach ForeshoreFigure 112:
Summary4.6 With the large amount of vacant land, and a relatively blank canvas to work with, Marsden Point/Ruakaka has substantial potential for population growth and associated industrial and commercial activities. There are high numbers of existing vacant lots in the area. Additionally, the capacity for developing new residential lots is high, whether under the District Plan or proposed Structure Plan. Constraints may limit this potential somewhat, especially in terms of the District Plan.
Perhaps the bigger challenge in the area is that of connecting residential areas with commercial and industrial areas, including present or proposed areas. The second major challenge is to develop an understanding of the likely growth pattern, especially the evolution of the business community. This research would need to build in growth scenarios that consider the impacts of rail connection, or lack thereof.
as necessary. In alignment with current best practice, future stormwater management is envisaged to be a continuation of current stormwater policies (through the Environmental Engineering Standards). Under these policies a developer is required to undertake onsite attenuation and treatment of stormwater generated by their development. This generally results in little impact to the existing Council stormwater network. Upgrades required are undertaken by the developer with possible Council contribution where an existing asset has limited remaining life. Under this approach, Council does not itself undertake projects involving creation of new stormwater infrastructure.
There are three stormwater catchment management plans in existence for the Marsden Point/Ruakaka area; Ruakaka, One Tree Point, and Marsden Point Catchment Management Plans.
TransportationThe Marsden Point/Ruakaka area is currently serviced by a roading network catering for close to 60,000 vehicle movements per day. This is projected to rise to almost 280,000 movements per day by 2061, based upon the large increase in population and, more importantly, a large amount of potential business floor area being taken up. Whilst there are some requirements for roading improvements within the area, much of this has occurred already in the development of the Marsden Point Highway. But to meet future demands, there is also a known backlog of roading works that will need to be met in order to provide for current traffic movements. This will require an estimated $41 million of additional Council administered roading expenditure.
The various lengths of different road types within the settlement include 3km of state highway, 0.8km of arterial roads, 10km of collector roads, and 18km of public road. The public road elements will likely grow substantially as residential development occurs. Roading upgrades for the area identified in Council’s LTCCP include the McEwan Road upgrade: $1.1 million (2011-12), $3.5 million (2017-18), McCathie Road upgrade: $1.7 million (2017-18) and Marsden Point Road upgrade: $9.7 million (2016-2019).
Parks and ReservesThe area has substantial parks and reserves (299ha) within the node, as well as four playgrounds. This includes Council reserves and Department of Conservation land along the coast. Parks range from substantial sports parks to smaller neighbourhood reserves. These parks include Takahiwai Sports Park, Ruakaka Recreation Reserve, Shearwater Street Reserve, Moki Place Reserve, Rakatau Place Reserve, Marsden Village Walkways, Ruakaka River Reserve, Endeavour Place Reserve, Karoro Road Reserve and Esplanade, Paradise Point Esplanade Reserve, Marsden Bay Reserve, Albany Road Esplanade, Mair Road Reserve, Ruakaka Beach Reserve, Tiki Place Reserve, Tamure Ridge Reserve, Beck Place Reserve, Marsh Street Reserve, Paradise Shores Gardens, Blacksmith’s Creek Reserve, Princes Road River Reserve and Esplanade, and waste water retention sites.
An analysis of ‘Neighbourhood’, ‘Sports’ and ‘Other’ parks found 1.9ha, 1.6ha and 2.6ha of existing capacity respectively, and this is enough to meet present demands of the permanent population. However, population growth will increase demands substantially. Future requirements to meet existing service levels include the purchase of 10ha of small neighbourhood parks, 11ha of land for sports uses, 9ha of destination reserve and 4ha of coastal parks to increase public access to the coast. The estimated costs for these works are $30.5 million over 50 years. As well as the land, it is expected that other park related facilities would be constructed within present and future reserve areas over the next 50 years.