part : financial statements - department of finance · perfonnance and cash flows for the year then...
TRANSCRIPT

Part 5: Financial statements
Independent auditor’s report
Statement by the Secretary and the Chief
Financial Officer
Glossary of terms—financial statements
Contents—financial statements

Auditor-General for Australia
INDEPENDENT AUDITOR'S REPORT
To the Minister for Finance Opinion
Australian National
Audit Office
In my opinion, the financial statements of the Department of Finance (Finance) for the year ended 30 June 2017: (a) comply with Australian Accounting Standards - Reduced Disclosure Requirements and
the Public Governance, Performance and Accountability (Financial Reporting) Rule2015;and
(b) present fairly the financial position of Finance as at 30 June 2017 and its financialperfonnance and cash flows for the year then ended.
The financial statements of Finance, which I have audited, comprise the following statements as at 30 June 2017 and for the year then ended: • Statement by the Secretary and Chief Financial Officer;• Statement of Comprehensive Income;• Statement of Financial Position;• Statement of Changes in Equity;• Cash Flow Statement;• Administered Schedule of Comprehensive Income;• Administered Schedule of Assets and Liabilities;• Administered Reconciliation Schedule;• Administered Cash Flow Statement; and• Notes to the financial statements, comprising a summary of significant accounting
policies and other explanatory infonnation.
Basis for Opinion I conducted my audit in accordance with the Australian National Audit Office Auditing Standards, which incorporate the Australian Auditing Standards. My responsibilities under those standards are further described in the Auditor's Responsibilities for the Audit of the Financial Statements section of my report. I am independent of Finance in accordance with the relevant ethical requirements for financial statement audits. These include the relevant independence requirements of the Accounting Professional and Ethical Standards Board's APES 110 Code of Ethics for Professional Accountants to the extent that they are not in conflict with the Auditor-General Act 1997 (the Code). I have also fulfilled my other responsibilities in accordance with the Code. I believe that the audit evidence I have obtained is sufficient and appropriate to provide a basis for my opinion.
88

89

90

91
As part of an audit in accordance with the Australian National Audit Office Auditing Standards, I exercise professional judgement and maintain professional scepticism throughout the audit. I also: • identify and assess the risks of material misstatement of the financial statements, whether
due to fraud or error, design and perfonn audit procedures responsive to those risks, andobtain audit evidence that is sufficient and appropriate to provide a basis for my opinion.The risk of not detecting a material misstatement resulting from fraud is higher than forone resulting from error, as fraud may involve collusion, forgery, intentional omissions,misrepresentations, or the override of internal control;
• obtain an understanding of internal control relevant to the audit in order to design auditprocedures that are appropriate in the circumstances, but not for the purpose of expressingan opinion on the effectiveness of the entity's internal control;
• evaluate the appropriateness of accounting policies used and the reasonableness ofaccounting estimates and relcited disclosures made by the Accountable Authority;
• conclude on the appropriateness of the Accountable Authority's use of the going concernbasis of accounting and, based on the audit evidence obtained, whether a materialuncertainty exists related to events or conditions that may cast significant doubt on theentity's ability to continue as a going concern. If I conclude that a material uncertaintyexists, I am required to draw attention in my auditor's report to the related disclosures inthe financial statements or, if such disclosures are inadequate, to modify my opinion. Myconclusions are based on the audit evidence obtained up to the date of my auditor'sreport. However, future events or conditions may cause the entity to cease to continue asa going concern; and
• evaluate the overall presentation, structure and content of the financial statements,including the disclosures, and whether the financial statements represent the underlyingtransactions and events in a manner that achieves fair presentation.
I communicate with those charged with governance regarding, among other matters, the planned scope and timing of the audit and significant audit findings, including any significant deficiencies in internal control that I identify during my audit. From the matters communicated with those charged with governance, I detennine those matters that were of most significance in the audit of the financial statements of the current period and are therefore the key audit matters. I describe these matters in my auditor's report unless law or regulation precludes public disclosure about the matter or when, in extremely rare circumstances, I detennine that a matter should not be communicated in my report because the adverse consequences of doing so would reasonably be expected to outweigh the public interest benefits of such c01mnunication.
Australian National Audit Office
Grant Hehir Auditor-General
Canberra
5 September 2017

92
Financial Statements
1
Department of FinanceFinancial Statements for the period ended 30 June 2017
Statement by the Secretary and Chief Financial Officer
In our opinion, the attached financial statements for the year ended 30 June 2017 comply with subsection 42(2) of the Public Governance, Performance and Accountability Act 2013 (PGPA Act), and are based on properly maintained financial records as per subsection 41(2) of the PGPA Act.
In our opinion, at the date of this statement, there are reasonable grounds to believe that the Department of Finance will be able to pay its debts as and when they fall due.

93
Glossary of termsAAS Australian Accounting Standards IBNER Claims incurred but not enough reportedAASB Australian Accounting Standards
BoardInvestment funds
Administered investment funds managed by the Future Fund Board of Guardians
AMT Adjusted Market Transactions IPEA Independent Parliamentary Expenses Authority
ANI Australian Naval Infrastructure Pty Ltd JPS Judges’ Pensions SchemeARR Asset Revaluation Reserve LSL Long Service LeaveASC ASC Pty Ltd LTCR Long Term Cost Report 2014AUD Australian dollar MOP(S)
Act Members of Parliament (Staff) Act 1984
BAF Building Australia Fund MPS Ministerial and Parliamentary ServicesBSSA Business Services Special Account MRFF Medical Research Future FundCEB Consumed Economic Benefits MRFFICs Medical Research Future Fund
Investment CompaniesCCEs Corporate Commonwealth Entities NBFs Nation Building FundsCRF Consolidated Revenue Fund NET Net AssetsCPCSA Coordinated Procurement Contracting
Special AccountOCI Other comprehensive income
CPI Consumer Price Index OPA Official Public AccountCSC Commonwealth Superannuation
CorporationPAES Portfolio Additional Estimate Statements
CSS Commonwealth Superannuation Scheme
PBS Portfolio Budget Statements
DAS Department of Administrative Services
PGPA Act Public Governance, Performance and Accountability Act 2013
DCAF DisabilityCare Australia Fund PM&C Department of the Prime Minister and Cabinet
DTA Digital Transformation Agency PCSS Parliamentary Contributory Superannuation Scheme
EIF Education Investment Fund PSS Public Sector Superannuation SchemeEUR Euro PSSap Public Sector Superannuation
accumulation plan FCCJDDS Federal Circuit Court Judges Death
and Disability SchemePWS Parliamentary Workflow System
FFMA Future Fund Management Agency RBA Reserve Bank of AustraliaFRR PGPA (Financial Reporting) Rule
2015RCN Replacement Cost of New Assets
FVPL Fair value through profit or loss SDO Service Delivery OfficeGBP British pound The Board Future Fund Board of GuardiansG-GPS Governor-General Pension Scheme USD United States dollarGST Goods and Services Tax VSA Volume sourcing arrangementsHHF Health and Hospitals Fund WACC Weighted average cost of capitalIBNCS Internet based network connection
serviceWoAG Whole of Australian Government
IBNR Claims incurred but not reported

94
Table of contents Departmental Primary Statements Statement of Comprehensive Income 96
Statement of Financial Position 97
Statement of Changes in Equity 98
Cash Flow Statement 99
Administered Primary Statements Administered Schedule of Comprehensive Income 100
Administered Schedule of Assets and Liabilities 102
Administered Reconciliation Schedule 103
Administered Cash Flow Statement 104
Notes to the financial statements A. About this report 106
B. Budgetary Variance Reporting 110
C. General Business Disclosures 113
C1: General insurance activities 113 C2: Investment funds 119 C3: Superannuation 129 C4: Restructuring 136
D. Operating Resources 138 D1: Financial instruments 138 D2: Managing financial risk 143 D3: Non-financial assets 145 D4: Other provisions 150

95
E. Our People 151 E1: Employee expenses 151 E2: Employee provisions 152 E3: Key management personnel remuneration 153 E4: Related parties 153
F. Funding 154 F1: Annual appropriations 154 F2: Special appropriations 156 F3: Special accounts 158
G. Managing Other Uncertainties 161 G1: Commitments 161 G2: Contingencies 162 G3: Subsequent events 162
H. Other Information 163 H1: Investments in joint ventures 163 H2: Other policies and disclosures 163

96
Department of Finance Departmental Primary StatementsSTATEMENT OF COMPREHENSIVE INCOMEfor the period ended 30 June 2017
The above statement should be read in conjunction with the accompanying notes
Actuals Budget30 June 30 June 30 June
2017 2016 2017Note ref $'000 $'000 $'000
NET COST OF SERVICESExpensesEmployee benefits E1 168,618 170,358 167,373Supplier expenses
Centralised procurement expense H2 B1 135,945 174,202 80,540Consultants and contractors 47,445 52,635 39,912Domestic property portfolio expenses B2 38,105 27,851 56,655Communication and information technology 42,196 35,065 41,834Property operating expenses 3,933 5,213 2,318Insurance claims C1.1 B3 163,993 94,295 132,090Other goods and services 21,875 20,904 25,510Operating lease rentals 14,066 6,034 9,675
Competitive neutrality H2 3,768 2,252 2,252Notional reinsurance expense C1.1 5,000 5,000 5,000Depreciation and amortisation D3.1 29,424 27,408 33,483Non-financial asset write downs 2,596 13,915 3,389Impairment of financial assets D1.3 4 826 -Other expenses 166 2,075 -Total expenses 677,134 638,033 600,031
Own-source incomeOwn-source revenuePremium revenue C1.1 140,290 125,149 136,722Reinsurance and other recoveries revenue C1.1 1,823 1,504 -Centralised procurement revenue H2 B1 135,978 176,917 81,340Rental income H2 67,678 72,119 75,322Resources received free of charge H2 1,398 2,030 1,385Rendering of services B4 65,372 54,019 49,971Interest revenue D1.3 8 6 -Other revenue 4,885 8,701 7,200Total own-source revenue 417,432 440,445 351,940
GainsGains B2 36,760 43,591 -Total gains 36,760 43,591 -Total own-source income 454,192 484,036 351,940
Net cost of services (222,942) (153,997) (248,091)
Revenue from Government 278,357 271,315 270,248Surplus/(deficit) before income tax on continuing operations 55,415 117,318 22,157Income tax expense H2 - 3,843 4,052Surplus/(deficit) after income tax on continuing operations 55,415 113,475 18,105
OTHER COMPREHENSIVE INCOMEItems not subject to subsequent reclassification to net cost of servicesChanges in asset revaluation reserves relating to
Land, building and leasehold improvements D3.1 B2 21,879 25,133 -Total comprehensive income/(loss) 77,294 138,608 18,105

97
Department of Finance Departmental Primary StatementsSTATEMENT OF FINANCIAL POSITIONas at 30 June 2017
The above statement should be read in conjunction with the accompanying notes
Actuals Budget30 June 30 June 30 June
2017 2016 2017Note ref $'000 $'000 $'000
AssetsFinancial assetsCash and cash equivalents
Cash and cash equivalents D1.1 10,780 3,321 5,000
Special Account cash held in OPA F3.1 B5 739,018 643,912 663,880Trade receivables D1.1 B1 74,299 69,969 27,934Accrued revenue D1.1 11,770 20,344 8,893
Appropriations receivableSpecial Account capital receivable F3.1 B5 58,891 82,420 -Other departmental undrawn F1.2 B5 152,956 172,670 110,162
Reinsurance and other recoveries C1.3 5,964 6,383 6,181Lease incentive assets 7,365 7,986 -Investments in joint ventures H1 3,611 4,898 6,112Other financial assets 2,643 3,434 9,917Total financial assets 1,067,297 1,015,337 838,079
Non-financial assetsLand D3.1 B2 387,641 413,298 396,320Buildings D3.1 B2 589,011 637,686 567,090Leasehold improvements D3.1 26,740 29,159 -Investment properties D3.1 B2 847,703 626,437 588,932Plant and equipment D3.1 30,867 28,673 51,668Intangible assets D3.1 B4 94,387 71,819 114,283Prepayments 9,443 11,274 8,552Assets held for sale D3.2 4,317 12,137 11,942Total non-financial assets 1,990,109 1,830,483 1,738,787
Total Assets 3,057,406 2,845,820 2,576,866
LiabilitiesTrade creditors and accruals D1.1 49,771 53,029 53,962Unearned revenue H2 B1 149,183 85,945 109,897Return of equity - special accounts H2 57,145 65,323 19,875Outstanding insurance claims C1.4 B3 438,663 352,587 329,005Employee provisions E2 58,403 61,549 67,743Finance leases D1.1 6,475 10,102 -Lease incentive liabilities 37,690 40,144 -Other provisions D4 B2 8,815 24,774 21,138Other payables 5,591 4,287 2,540
Total liabilities 811,736 697,740 604,160
Net Assets 2,245,670 2,148,080 1,972,706
EquityContributed equity/capital 1,638,593 1,618,297 1,653,311Retained earnings 407,936 352,521 167,266Asset revaluation reserves B2 199,141 177,262 152,129
Total Equity 2,245,670 2,148,080 1,972,706

98
Dep
artm
ent o
f Fin
ance
Dep
artm
enta
l Prim
ary
Stat
emen
tsST
ATEM
ENT
OF
CH
ANG
ES IN
EQ
UIT
Yfo
r the
per
iod
ende
d 30
Jun
e20
17
The
abov
e st
atem
ents
houl
d be
read
in c
onju
nctio
n w
ithth
eac
com
pany
ing
note
s
Actu
als
Ret
aine
d ea
rnin
gsAs
set r
eval
uatio
n re
serv
esC
ontr
ibut
ed e
quity
/cap
ital
Tota
l Equ
ity30
Jun
e30
Jun
e30
Jun
e30
Jun
e30
Jun
e30
Jun
e30
Jun
e30
Jun
e20
1720
1620
1720
1620
1720
1620
1720
16N
ote
ref
$'00
0$'
000
$'00
0$'
000
$'00
0$'
000
$'00
0$'
000
Ope
ning
bal
ance
Bala
nce
carri
ed fo
rwar
d35
2,52
123
9,04
617
7,26
215
2,12
91,
618,
297
1,67
2,19
32,
148,
080
2,06
3,36
8Ad
just
ed o
peni
ng b
alan
ce35
2,52
123
9,04
617
7,26
215
2,12
91,
618,
297
1,67
2,19
32,
148,
080
2,06
3,36
8
Com
preh
ensi
ve in
com
eSu
rplu
s/(d
efic
it) fo
r the
per
iod
55,4
1511
3,47
5-
--
-55
,415
113,
475
Oth
er c
ompr
ehen
sive
inco
me
--
21,8
7925
,133
--
21,8
7925
,133
Tota
l com
preh
ensi
ve in
com
e55
,415
113,
475
21,8
7925
,133
--
77,2
9413
8,60
8
Tran
sact
ions
with
ow
ners
Dis
trib
utio
ns to
ow
ners
Tran
sfer
of a
sset
s-
--
-(4
4,08
6)(1
36,2
53)
(44,
086)
(136
,253
)R
etur
n of
equ
ity -
spec
ial a
ccou
nts
H2
--
--
(57,
145)
(67,
662)
(57,
145)
(67,
662)
Ret
urn
of e
quity
-ot
her
--
--
(2,3
23)
(6,2
62)
(2,3
23)
(6,2
62)
Con
trib
utio
ns b
y ow
ners
Dep
artm
enta
l cap
ital b
udge
t-
--
--
--
-Eq
uity
inje
ctio
n -a
ppro
pria
tions
&
supp
lem
enta
tion
F1.1
& F
1.2
--
--
109,
808
157,
310
109,
808
157,
310
Res
truct
urin
gC
4-
--
-14
,042
(1,0
29)
14,0
42(1
,029
)To
tal t
rans
actio
ns w
ith o
wne
rs-
--
-20
,296
(53,
896)
20,2
96(5
3,89
6)C
losi
ng b
alan
ce40
7,93
635
2,52
119
9,14
117
7,26
21,
638,
593
1,61
8,29
72,
245,
670
2,14
8,08
0B
udge
t 30
June
201
7O
peni
ng b
alan
ce22
6,35
724
2,71
515
2,12
913
5,68
41,
577,
718
1,88
8,61
61,
956,
204
2,26
7,01
5To
tal c
ompr
ehen
sive
inco
me
18,1
0515
,135
--
--
18,1
0515
,135
Tota
l tra
nsac
tions
with
ow
ners
(77,
196)
594
--
75,5
93(1
70,0
59)
(1,6
03)
(169
,465
)C
losi
ng b
alan
ce16
7,26
625
8,44
415
2,12
913
5,68
41,
653,
311
1,71
8,55
71,
972,
706
2,11
2,68
5

99
Department of Finance Departmental Primary StatementsCASH FLOW STATEMENTfor the period ended 30 June 2017
The above statement should be read in conjunction with the accompanying notes
Actuals Budget30 June 30 June 30 June
2017 2016 2017Note ref $'000 $'000 $'000
OPERATING ACTIVITIESCash receivedRendering of services 273,407 152,999 206,905Revenue from Government 306,124 259,944 323,425Insurance premiums 140,301 125,149 136,722Reinsurance and other recoveries 2,266 1,302 -Interest and dividends 8 6 -Rent received 67,678 72,119 -Net GST received 415 3,415 -Other 8,515 5,332 7,200Total cash received 798,714 620,266 674,252
Cash usedEmployees 175,502 169,842 164,941Suppliers 337,210 326,138 261,551Insurance claims 76,726 70,713 132,090Net special account receipts transferred to OPA - - 77,196Total cash used 589,438 566,693 635,778
Net cash received/(used) for operating activities 209,276 53,573 38,474
INVESTING ACTIVITIESCash receivedProceeds from sale of land and buildings 18,725 8,257 42,215Proceeds from sale of financial investments 1,175 2,393 -Proceeds from sale of investment properties 2,905 - -Total cash received 22,805 10,650 42,215
Cash usedPurchase of plant and equipment 8,126 9,423 36,332Purchase of land and buildings 88,949 84,255 96,221Purchase of leasehold improvements 620 1,577 3,502Purchase of intangibles 18,830 11,901 19,664Purchase of investment properties 30,629 3,720 2,000Other 40,000 - -Total cash used 187,154 110,876 157,719
Net cash received/(used) for investing activities (164,349) (100,226) (115,504)
FINANCING ACTIVITIESCash receivedContributed equity 125,284 95,225 77,030Total cash received 125,284 95,225 77,030
Cash usedReturn of contributed equity H2 67,646 64,845 -Total cash used 67,646 64,845 -
Net cash received/(used) for financing activities 57,638 30,380 77,030
Net increase/(decrease) in cash held 102,565 (16,273) -
Cash and cash equivalents at the beginning of the reporting period 647,233 663,506 5,000Cash and cash equivalents at the end of the reporting period D1.1 749,798 647,233 5,000

100
Department of Finance Administered Primary SchedulesADMINISTERED SCHEDULE OF COMPREHENSIVE INCOMEfor the period ended 30 June 2017
The above schedule should be read in conjunction with the accompanying notes
Actuals Budget30 June 30 June 30 June
2017 2016 2017Note ref $'000 $'000 $'000
NET COST OF SERVICESExpensesEmployee benefits E1 B6 195,099 322,425 239,821Superannuation expense C3.1 B7 8,961,212 8,715,203 7,876,521Supplier expenses
Office expenses 38,106 38,893 46,039Travel expenses B6 43,534 61,392 70,719Operating lease rentals 39,842 38,015 33,038Communication and information technology 24,681 28,193 25,018Property operating expenses 11,565 13,061 7,935Outsource provider expenses 5,467 5,424 4,727Superannuation administration costs 9,924 10,451 10,280COMCAR operating expenses 3,171 3,321 3,260Other goods and services 16,598 12,288 23,343
Investment funds - other expenses C2.1 22,294 15,091 31,486Distribution to portfolio special accounts C2.1 B8 83,469 117,658 476,697Depreciation and amortisation D3.1 11,965 16,198 20,691Investment funds - foreign exchange losses C2.1 6,925 106,288 -Non-financial asset write downs D3.1 2,215 345 106Impairment of financial assets D1.3 13 2 -Grants 2,526 2,991 2,927Other expenses 1,578 2,301 5,274Total expenses administered on behalf of Government 9,480,184 9,509,540 8,877,882
IncomeNon- taxation revenueInterest D1.3 30,193 37,254 9,924Investment funds - interest on term deposits C2.1 91,566 98,946 476,419Dividends D1.3 19,700 16,100 12,700Investment funds - dividends C2.1 13,228 6,147 -Rendering of services 3,339 15,785 3,775Superannuation contributions C3.1 1,274,957 1,338,231 1,309,845Resources received free of charge H2 4,368 4,302 4,302Other revenue 18,230 5,428 9,636Total revenue 1,455,581 1,522,193 1,826,601
GainsGains from sale of financial assets D1.3 1 -Gains from sale of non-financial assets 2 36Investment funds - gains on financial investments C2.1 439,306 383,368 52,136Other gains 196 970Total gains 439,505 384,374 52,136Total income administered on behalf of Government 1,895,086 1,906,567 1,878,737
Net cost of services (7,585,098) (7,602,973) (6,999,145)
Surplus/(deficit) (7,585,098) (7,602,973) (6,999,145)

101
Department of Finance Administered Primary SchedulesADMINISTERED SCHEDULE OF COMPREHENSIVE INCOMEfor the period ended 30 June 2017
The above schedule should be read in conjunction with the accompanying notes
Actuals Budget30 June 30 June 30 June
2017 2016 2017Note ref $'000 $'000 $'000
OTHER COMPREHENSIVE INCOMEItems not subject to subsequent reclassification to net cost of servicesMovement in carrying amount of superannuation C3.1 21,728,419 (30,861,250) -Changes in asset revaluation reserves relating to
Infrastructure, plant and equipment D3.1 1,461 3,579 -Leasehold improvements D3.1 8,672 - -Makegood provisions - 36 -
Items subject to subsequent reclassification to net cost of servicesGains/(losses) on
Available for sale financial assets D1.3 77,963 22,347 -Total other comprehensive income/(loss) 21,816,515 (30,835,288) -
Total comprehensive income/(loss) 14,231,417 (38,438,261) (6,999,145)

102
Department of Finance Administered Primary SchedulesADMINISTERED SCHEDULE OF ASSETS AND LIABILITIESas at 30 June 2017
The above schedule should be read in conjunction with the accompanying notes
Actuals Budget30 June 30 June 30 June
2017 2016 2017Note ref $'000 $'000 $'000
AssetsFinancial assetsCash and cash equivalents D1.1 937,956 1,059,534 -Trade receivables D1.1 721 1,390 7,083Investment funds - loans and receivables C2.2 B8 6,501,484 4,259,529 -State and Territory Government loans D1.1 139,752 145,959 139,749Accrued revenue D1.1 2,213 1,533 -Government securities D1.1 1,472 1,472 921Commonwealth corporate entities D1.1 B9 573,417 400,454 378,108Investment funds - financial assets at FVPL C2.2 B8 16,190,822 12,494,544 18,446,501Lease incentive assets 58 21 -Other financial assets 14,119 11,304 51,595Total financial assets 24,362,014 18,375,740 19,023,957
Non-financial assetsLeasehold improvements D3.1 24,889 18,460 21,067Infrastructure D3.1 69,997 67,374 68,085Plant and equipment D3.1 4,157 8,255 -Intangible assets D3.1 1,071 1,517 2,033Prepayments 3,491 3,556 3,971Total non-financial assets 103,605 99,162 95,156
Total Assets 24,465,619 18,474,902 19,119,113
LiabilitiesTrade creditors and accruals D1.1 12,418 15,585 9,033Investment funds - financial liabilities C2.2 B8 99,915 21,859 -Investment funds - derivative liabilities C2.2 B8 13,405 26,314 -Overnight cash balance payable H2 1,422,029 1,560,747 -Employee provisions E2 B6 237,009 312,502 248,756Superannuation provisions C3.1 B7 172,352,268 189,367,538 111,015,312Other provisions D4 18,314 18,173 14,666Other payables 66,895 10,498 20,387
Total liabilities 174,222,253 191,333,216 111,308,154
Net Assets (149,756,634) (172,858,314) (92,189,041)

103
Department of Finance Administered Primary SchedulesADMINISTERED RECONCILIATION SCHEDULEfor the period ended 30 June 2017
The above schedule should be read in conjunction with the accompanying notes
Actuals30 June 30 June
2017 2016Note ref $'000 $'000
Opening assets less liabilities (172,858,314) (142,637,157)Net (cost of)/contribution by services (7,585,098) (7,602,973)Other comprehensive income/(loss) 21,816,515 (30,835,288)
Reserves transferred to Schedule of Comprehensive Income - -Transfers (to)/from the Australian GovernmentAppropriation transfers from OPA
Annual appropriations 298,706 296,509Administered assets and liabilities appropriations 1,779 1,149Special appropriations F2.1 6,560,096 6,218,020Transfers to OPA (3,475,849) (3,394,851)Transfers from OPA 109 894Equity (distribution)/injection 41,266 (1,462,997)Contributions from government to the investment funds F3.2 5,441,672 6,598,851
OPA WoAG transfersTransfers from other entities H2 633,491,286 610,652,954Transfers to other entities H2 (633,488,802) (610,693,425)
Closing assets less liabilities (149,756,634) (172,858,314)

104
Department of Finance Administered Primary SchedulesADMINISTERED CASH FLOW STATEMENTfor the period ended 30 June 2017
The above statement should be read in conjunction with the accompanying notes
Actuals Budget30 June 30 June 30 June
2017 2016 2017Note ref $'000 $'000 $'000
OPERATING ACTIVITIESCash receivedRendering of services 3,995 19,375 3,775Superannuation contributions - employers 1,270,538 1,377,495 1,431,477Superannuation funds contributions - members 2,132,494 1,953,089 1,892,741Net gains from sale of financial instruments 257,301 234,377 -Interest and dividends 148,429 153,092 493,652Realised exchange gains 208,954 - -Net GST received 802 - -Other 18,396 6,729 3,138Total cash received 4,040,909 3,744,157 3,824,783
Cash usedEmployees 268,977 264,538 239,759Suppliers 210,806 218,715 254,171Investment Funds distribution 83,469 117,658 476,697Superannuation payments 6,380,557 6,040,352 6,337,437Realised exchange losses - 106,288 -Grants 1,800 2,281 2,927Net GST paid - 377 -Other 612 655 7,376Total cash used 6,946,221 6,750,864 7,318,367
Net cash received/(used) for operating activities (2,905,312) (3,006,707) (3,493,584)
INVESTING ACTIVITIESCash receivedProceeds from sale of plant and equipment 17 40 -Proceeds from sale of financial investments 19,960,339 15,278,583 2,618,546Repayments of advances and loans 11,600 11,300 11,601Matured government securities - 699 -Proceeds from sale of non-financial assets - 5 -Total cash received 19,971,956 15,290,627 2,630,147
Cash usedPurchase of plant and equipment 1,405 2,556 4,822Purchase of leasehold improvements 5,756 4,221 10,320Purchase of infrastructure 1,352 - -Purchase of intangibles 57 - -Purchase of financial investments 25,866,742 20,515,947 5,724,176Total cash used 25,875,312 20,522,724 5,739,318
Net cash received/(used) for investing activities (5,903,356) (5,232,097) (3,109,171)

105
Department of Finance Administered Primary SchedulesADMINISTERED CASH FLOW STATEMENTfor the period ended 30 June 2017
The above statement should be read in conjunction with the accompanying notes
Actuals Budget30 June 30 June 30 June
2017 2016 2017Note ref $'000 $'000 $'000
FINANCING ACTIVITIESCash receivedContributed equity 7,575,945 8,553,089 7,154,993Total cash received 7,575,945 8,553,089 7,154,993
Cash usedEquity distribution 3,189 1,462,997 2,110,364Total cash used 3,189 1,462,997 2,110,364 Net cash received/(used) for financing activities 7,572,756 7,090,092 5,044,629
Net increase/(decrease) in cash held (1,235,912) (1,148,712) (1,558,126)
Cash and cash equivalents at the beginningof the reporting period 1,059,534 1,084,959 -
OPA (WoAG)Transfers to other entities (633,627,520) (610,697,150) -Transfers from other entities 633,491,395 610,653,848 -Total cash from/(to) OPA (136,125) (43,302) -
Finance administered transfersCash to OPA - appropriations (3,475,849) (3,394,851) (3,367,834)Cash from OPA - appropriations 4,726,308 4,561,440 4,925,960Total cash from/(to) OPA 1,250,459 1,166,589 1,558,126
Cash and cash equivalents at the end of the reporting period D1.1 937,956 1,059,534 -

106
Notes to and forming part of the financial statements A. About This Report
A. About This ReportThe Department of Finance (Finance) is an Australian Government controlled not-for-profit entity with its purposes for 2016-17 being:
budget and financial advice, management and reporting - support the Government to deliver its fiscal targets and policy objectives;
governance - foster leading public sector practice; transformation - innovate and improve public sector operations and reform the management and operations of public
assets; and services - manage efficient, cost-effective services to, and for, the Government.
Finance works collaboratively with the Department of Prime Minister and Cabinet (PM&C), the Department of the Treasury and the Australian Public Service Commission (APSC), to achieve these purposes.
Finance is structured to meet three outcomes per the 2016-17 PBS, with some amendments being applied in the 2016-17 PAES to reflect Machinery of Government Changes which occurred during the year. Comparatives have been amended for any changes in outcomes and programs.
Outcome/Program How outcomes are achieved Net contribution / (cost) of services 1
30 June 2017 30 June 2016
Outcome 1: Support sustainable Australian Government finances through providing high quality policy advice and operational support to the government and Commonwealth entities to maintain effective and efficient use of public resources.
1.1 Budget and Financial Management
Advising the Finance Minister and Expenditure Review Committee (ERC) on fiscal and economic policies and related matters;
Supporting the Finance Minister in meeting his financial reporting responsibilities; and
Supporting the delivery of the Budget.
Departmental ($84.5m)
Departmental ($81.2m)
Outcome 2: Support an efficient and high-performing public sector through providing leadership to Commonwealth entities in ongoingimprovements to public sector governance, including through systems, frameworks, policy, advice, and service delivery.
2.1 Public Sector Governance
Developing and maintaining the public sector resource management framework;
Improving the standard of governance, performance and accountability; and
Undertaking shareholder oversight of Government Business Enterprises (GBEs) and other commercial entities.
Administered $50.3mDepartmental ($33.1m)
Administered $46.6mDepartmental ($36.4m)
2.2 Transforming Government
Providing leadership and supporting decision making relating to the digital economy and use of technology in government operations; and
Scoping divestment opportunities and managing asset sales and any residual issues arising from previous asset sales.
Departmental ($46.7m)
Departmental ($49.4m)
2.3 Property and Construction
Providing policy advice, guidance and support on managing Commonwealth property, land and public works across the government; and
Managing specific major capital works projects and the government’s non-Defence property portfolio within Australia.
Departmental $20.0m
Departmental $29.5m
2.4 Insurance and Risk Management
Providing general insurance services and promoting risk management across the government through the Comcover Special Account.
Departmental ($35.0m)
Departmental $20.5m

107
Notes to and forming part of the financial statements A. About This Report
2.5 Procurement Services
Establishing WoAG arrangements for common goods and services to maximise market benefits for Commonwealth entities; and
Providing advice on advertising.
Departmental $2.9m
Departmental $5.8m
2.6 Service Delivery Office
Providing certain corporate services to client Australian Government entities.
Departmental ($4.7m)
N/A
2.7 Public Sector Superannuation
Advising the government on managing the Future Fund, the stability of the government’s unfunded superannuation liabilities and its associated administered expense items and superannuation arrangements for government employees. This includes the administration and management of superannuation arrangements for Parliamentarians, as well as current and former Governors-General, Federal Judges and Federal Circuit Court Judges.
Administered ($7.7b)
Departmental ($6.5m)
Administered ($7.4b)
Departmental ($4.9m)
2.8 Australian Government Investment Funds
Providing advice on investment mandates and governance arrangements for the government’s Investment Funds, to maximise the value of the funds to the Government. This includes advice on credit of amounts to the Funds and payments from the Funds.
Administered $431.4m
Administered $249.4m
Outcome 3: Support for Parliamentarians and others as required by the Australian Government through the delivery of, and advice on, entitlements and targeted assistance.
3.1 Ministerial and Parliamentary Services
Providing advice on, access to and payment of parliamentary and post-parliamentary entitlements and targeted assistance to entities.
Administered($376.4m) Departmental ($35.3m)
Administered($524.4m) Departmental ($37.8m)
1 Net cost of services includes depreciation and amortisation expense, the write-down and impairment of assets (or the reversal) and gains/losses from the sale of assets. It excludes revenue from government, income tax expense and other items recognised in other comprehensive income.
Finance’s activities are classified as either Departmental or Administered. Departmental activities involve the use of assets, liabilities, incomes and expenses controlled or incurred by Finance in its own right.
Administered items are controlled by the government and managed or overseen by Finance on behalf of the government. These items are distinguished from Departmental items using shading.
In some areas of this financial report, Departmental and Administered items are included in the same section, this is for presentation purposes only and these balances should not be compared.
The continued existence of Finance in its present form and with its present programs is dependent on government policy and on continued funding by Parliament.
Basis of preparation
Finance's financial statements are required by section 42 of the PGPA Act. The financial statements are general purpose financial statements that have been prepared in accordance with the PGPA (Financial Reporting) Rule 2015 (FRR) and Australian Accounting Standards (AAS) and Interpretations issued by the Australian Accounting Standards Board (AASB) that apply for the reporting period. Finance has applied the Reduced Disclosure Requirements issued by the AASB as a minimum and has included additional disclosures for financial instruments, fair value and superannuation as required under subsection 18(3) of the FRR.
Basis of accounting
The financial statements have been prepared on an accrual basis and are in accordance with the historical cost convention, except for certain assets and liabilities at fair value.
All assets have been assessed for impairment at the end of the reporting period, and no impairment indicators exist unless otherwise stated.

108
Notes to and forming part of the financial statements A. About This Report
How to read this report
The following pages set out the notes to the financial statements, which include further information required to understand the financial statements. This has been assessed against materiality and relevance to the operations, financial position and performance of Finance. All amounts are presented in Australian dollars (AUD) and are in whole dollars unless otherwise specified.
Key judgements and estimates
In applying Finance's accounting policies, management has made a number of judgements and applied estimates andassumptions to future events. Judgements and estimates that are material to the financial statements are found in the following notes:
C1: General insurance activitiesC2: Investment fundsC3: Superannuation D1: Financial instrumentsD3: Non-financial assetsE2: Employee provisions
With the exception of judgements and estimates applied in the above notes, no allowance is made for the effect of changing prices on the results or the financial position.
Prior Year Adjustments
Prior year Departmental appropriation receivable relating to special accounts (non-capital) has been reclassified to cash and cash equivalents ($643.9 million) as a result of a change in the FRR. The change impacts the Departmental Statement of Financial Position, Cash Flow Statement, Financial Instruments (Note D1.1), Managing Financial Risk –Credit Risk (Note D2.3), Special Account (Note F3.1) and Appropriations (Note F1.2 reconciliation table).
Other minor changes were made to the comparatives in both the Departmental and Administered financial statements as a result of the reclassification of some line items.
New Australian Accounting Standards (AAS)
Adoption of AAS requirements During 2016-17, Finance adopted all applicable AAS that became effective during 2016-17. The application of new standards did not materially impact the operations of Finance.
Future AAS requirementsThe AASB has issued a number of new standards, amendments to standards and interpretations that are effective for future reporting periods. These new standards are not expected to have an impact on Finance’s financial statements except for:
AASB 9 Financial Instruments represents the finalisation of the three phase project to replace AASB 139 Financial Instruments: Recognition and Measurement. It incorporates new principles for the requirements for recognition, impairment and measurement of financial assets and liabilities and their de-recognition and general hedge accounting. This is likely to impact on the categorisation, recognition and measurement of financial instruments particularly those currently held at fair value through profit or loss (FVPL) or categorised as available for sale. The new standard is effective from 1 January 2018. This will result in Finance reviewing classification and disclosure of items currently included in Note D1 against Finance’s business model for managing financial assets. Currently, Finance (Administered) manages investments funds (financial assets at FVPL) and has investments in Commonwealth corporate entities (available for sale financial assets).
AASB 16 Leases will require lessees to recognise a right-of-use asset and a lease liability for all leases with a term of more than 12 months, unless the underlying asset is of low value. Lessor accounting under AASB 16 remains substantially unchanged from the predecessor standard AASB 117 Leases. Accordingly, lessors will continue to classify leases as operating or finance, and account for those two types of leases differently. A lessor is not required to make any adjustments on transition and shall apply the new standard from the date of its initial

109
Notes to and forming part of the financial statements A. About This Report
application. The new standard is effective from 1 January 2019. For all leases where Finance is lessee, a right of use asset and liability will be recognised on the balance sheet. Currently, Finance (Departmental) has leases for vehicles (predominantly pool vehicles) and properties that Finance occupy. Finance (Administered) manages leases for office premises and private plated vehicles on behalf of Parliamentarians and vehicles for Comcar car-with-driver services provided to Parliamentarians. Disclosures relating to the domestic property portfolio that Finance manages as lessor will require amendment including improved information about risk exposure.

110
Notes to and forming part of the financial statements B. Budget Variance Reporting
B. Budgetary Variance ReportingThe following are explanations of events that have impacted on Finance's operations and activities for the year that were not provided for in the budget or otherwise included against relevant note disclosures. Users should note that a number of these items have been included in subsequent budgets. Budget numbers are sourced from Portfolio Budget Statements (PBS) for 2016-17 and are provided to the right of primary statements in italics to clearly distinguish them from actual results. Budgeted numbers are not audited.
Major variances are those deemed relevant to an analysis of Finance's performance by management and are not focussed merely on numerical differences between the actual and budgeted amounts. A note reference is included against the relevant primary statement/schedule line item which corresponds to the explanations provided below and elsewhere in the financial statements.
When providing explanations, Finance has identified the financial impact in relation to those key aggregates relevant to Finance's performance. Users should be aware that there will be consequential impacts on related statements i.e. a variance in the Statement of Comprehensive Income is likely to have consequential impacts in the Statement of Financial Position and the Cash Flow Statement.
The Statement of Financial Position budget for 2016-17 was prepared based on 2014-15 financial results, with adjustments for predicted or known movements at that time.
NoteReference
Affected line Items Variance Reporting
B1: Centralised Procurement
Centralised procurement expense and revenue
Unearned revenue
Trade receivables
Centralised procurement expense and revenue variances to budget are mainly due to contracts and variations relating to both VSA and IBNCS that were finalised after the budget was set.
Unearned revenue and trade receivables variances against budget are primarily due to the 2017-18 IBNCS agency invoices being issued one month earlier compared to prior financial years. This change of procedure was done to ensure a smooth transfer of the relevant components of Finance's CPCSA from Finance to DTA in 2017-18.
B2: Property Land
Buildings
Investment properties
Gains
Asset revaluation reserves
Domestic property portfolio expenses
Other provisions
Property revaluation movements for 2016-17 include:- Revaluation gains in land and buildings largely due to Commonwealth Law Courts. Land increases impacted the Asset Revaluation Reserve while building gains were taken to Net Cost of Services to reverse prior year reductions.
Other property movements during 2016-17 include:- Reclassification of John Gorton and Treasury land and buildings to investment property since Finance no longer occupies these premises.- Sale of properties as part of the divestment programme (net book value of assets disposed $18.9m) with related sale proceeds of $22.3m.
Domestic property portfolio expenses are lower than budget due toexpenses being classified as capital expenditure as well as budgeted works not undertaken on behalf of the Department of Immigration and Border Protection (DIBP) at Villawood.
Other provisions variance to budget is mostly due to recognition of expenses to remediate Cox Peninsula offset by increases in remediation provision to reflect latest forecasts of costs.

111
Notes to and forming part of the financial statements B. Budget Variance Reporting
B3: Insurance Insurance claims expense
Outstanding insurance claims liability
Variance to budget is due to an increase in the expected cost of a prior year liability claim, partially reduced by lower than expected new property claims for the current year.
Variance to budget is due to new claims liabilities, and changes in assumptions and experience for prior year claims, which exceeded claim payments.
B4: Restructure of administrative arrangements
Rendering of services revenue
Intangibles
During 2016-17, Finance had multiple restructure of administrative arrangement decisions that resulted in both functions assumed and functions relinquished. These restructures are not reflected in the PBS 2016-17 budget numbers. Please refer to Note C4: Restructuring for further details.
Finance assumed responsibility for shared services functions from the Education and Employment portfolio departments on 1 December, now called the Service Delivery Office (SDO) and the Parliamentary Workflow System (PWS). Included in this transfer were Intangible assets of $4.4m for the SDO and $7.4m for PWS.Since shared services functions are cost recovered, rendering of services revenue for Finance has increased.
B5:Appropriation receivables
Special Account cash held in the OPA
Special account capital receivable
Other departmental undrawn
Variance to budget is mainly due to project delays pushing expenditure to later years on major departmental projects, and an underspend relating to the Moorebank project not reflected in the 2016-17 budget. These funds are no longer required and are pending return to the Official Public Account (OPA).
B6: Ministerial &Parliamentary Services
Employee benefitsEmployee provisions
Travel expenses
Employee benefits and provisions variance to budget are chiefly dueto a significant reduction in the provision for parliamentary retirement travel (formerly Life Gold Pass), as a consequence of the Royal Assent of the Parliamentary Entitlements Legislation Amendment Act 2017. This amendment in legislation included significant changes to parliamentary retirement travel. In addition, the decrease in the current year is caused by the reduction in the provision for Former Prime Ministers entitlements resulting from actuarial movements. These adjustments could not be predicted and therefore no allowance was made in the budget.
Travel expenses variance to budget is mostly a result of the establishment of IPEA from 3 April 2017, with travel administration and processing one of the key functions that moved to IPEA.

112
Notes to and forming part of the financial statements B. Budget Variance Reporting
B7:Superannuation
Superannuation expenseSuperannuation provisions
The Long Term Cost Report (LTCR) discount rate of 6% is used for budget purposes to reduce the volatility that would occur from year to year if the long-term government bond rate was used. Consistent with Australian Accounting Standards, the long-term government bond rate as at 30 June is used to calculate the superannuation liability and expense for the purpose of financial reporting. Any change in these rates for budget and financial reporting purposes significantly impacts on the superannuation provisions and superannuation expense.
B8: Investment funds
Distribution to portfolio special accounts.
Net assets comprising: investment funds – loans and receivables and financial assets at FVPL offset by investment funds – financial liabilities and derivative liabilities
The DCAF net asset balance is higher than originally budgeted due to National Partnership Agreement (NPA) negotiations continuing and as a consequence payments are yet to be made to the states and territories or the Commonwealth.
B9: Investments in Commonwealth Corporate entities
Commonwealth corporate entities
In 2016-17, the ASC Group was restructured with critical infrastructure assets consolidated into Australian Naval Infrastructure Pty Ltd (ANI) with 100 per cent of the shareholding transferring to the Commonwealth in March 2017. Finance on behalf of the Commonwealth also made equity investments in both companies ASC Pty Ltd (ASC) and ANI in exchange for additional shares in 2016-17. More information on the valuation methodology applied is detailed in Note D1.1 under 'Key judgements and estimates'. These decisions and adjustments to investment values were not reflected in the budget.

113
Notes to and forming part of the financial statements C. General Business Disclosures
C. General Business DisclosuresThis section includes disclosures for operations which are significant in size and/or nature for Finance. In 2016-17, these areas include general insurance activities, the investment funds and superannuation.
C1 : General insurance activities
Finance provides insurance and risk management services to Australian General Government Sector entities. The classes of business cover include: Liability, Property, Motor Vehicle, and Personal Accident and Travel.
These services are funded from the Comcover Special Account (refer to Note F3.1).
Policy and measurement
Premium revenuePremium revenue includes amounts charged but excludes GST. Premiums are recognised as revenue over the period insured which is from 1 July to 30 June each year.
Notional reinsurance expenseFinance pays a notional reinsurance charge of $5.0 million to the OPA which is recognised as an expense when paid.
Reinsurance and other recoveriesReinsurance and other recoveries received or receivable in respect of gross claims paid and movements in reinsurance and other recovery assets are recognised as revenue in the year they occur.
Reinsurance and other recovery assets are actuarially assessed as the present value of the expected future receipts, calculated on the same basis as the outstanding claims liability.
Claims expense and outstanding claims liabilitiesClaims expense represents claims payments and the movement in the gross outstanding claims liability.
The outstanding claims liability is actuarially assessed and measured at the central estimate of the present value of expected future payments of claims incurred at the reporting date with an additional risk margin to allow for inherent uncertainty in the central estimate. The expected future payments include those in relation to unpaid reported claims; claims incurred but not reported (IBNR); claims incurred but not enough reported (IBNER); and indirect expenses that are expected to be incurred in settling these claims. Changes in claims estimates are recognised in the surplus/deficit in the year in which the estimates are changed.
Assets backing general insurance liabilitiesThe balance of the Comcover Special Account and receivables from insurance activities are held to back general insurance liabilities. For further information in relation to the Comcover Special Account refer to Note F3.1.
Key judgements and estimates
Finance takes all reasonable steps to ensure that it has appropriate information regarding its claims exposures. The claim estimates and judgements are regularly evaluated and updated based on historical experience and other factors. However, given the uncertainty in the estimation process, it is likely that the final outcome will prove to be different from the original liability established.
Finance’s activities are classified into two main categories: Property (Property, Motor Vehicle, and Personal Accident and Travel) and Liability. Different actuarial methods and assumptions are applied at a more granular level taking into account the characteristics of the class of business, claim type and the extent of the development of each past accident period.
The estimation of IBNR and IBNER are generally subject to a greater degree of uncertainty where claims notification and settlement may not happen for many years after the event giving rise to the claim. For this reason, Liability classes of business typically display greater variability between the initial estimates and final outcomes.

114
Notes to and forming part of the financial statements C. General Business Disclosures
Key actuarial assumptions
The key actuarial assumptions for the determination of the outstanding claims liabilities are set out in the table below:
30 June 2017 30 June 2016Property Liability Property Liability
Average discount rate 1.9% 2.0% 1.6% 1.7%Average inflation rate 2.2% 3.5% 2.2% 3.5%Average weighted term to settlement (years) 1.5 2.1 1.6 2.8Expense rate 1.8% 1.5% 1.9% 3.1%Risk margin 16.4% 13.4% 16.1% 19.6%
Process used to determine actuarial assumptions
Discount rate To allow for the time value of money, projected payments are discounted at a risk free rate derived from market yields on Commonwealth Government securities at the reporting date.
Inflation rate Claims inflation is incorporated into the resulting projected payments to allow for both expected levels of economic inflation and superimposed inflation. Economic inflation is based on economic indicators such as the consumer price index (CPI) and/or increases in average weekly earnings. Superimposed inflation is past claims inflation in excess of wage inflation. A review of past claims reveals no evidence of superimposed inflation.
Average weighted term to settlement
The average weighted term to settlement is based on historic payment patterns.
Expense rate Claims handling expenses are calculated by reference to Finance’s claims handling remuneration agreements for direct expenses and internal costs for indirect expenses.
Risk Margin The risk margin is assessed by examining the historical variability of the claims experience, considering industry studies and benchmarks, and applying actuarial judgement, especially in respect of uncertainties not reflected in the claims data. This assessment is performed for each class of business. Diversification benefit is allowed for, with consideration given to industry studies and benchmarks.
Sensitivity analysis
Finance has conducted a sensitivity analysis to quantify the impact of changes in the key underlying assumptions on the surplus/(deficit). The sensitivity analysis has been performed for each variable independently of all other changes and isnet of reinsurance and other recoveries. The table below describes how a change in each assumption will affect the surplus/(deficit).
30 June 2017 30 June 2016Property Liability Property Liability
Assumption Movement $'000 $'000 $'000 $'000
Average discount rate1% 1,607 6,776 1,716 6,635
-1% (1,647) (6,987) (1,788) (7,007)
Average inflation rate1% (1,627) (6,818) (1,777) (6,750)
-1% 1,618 6,744 1,740 6,528
Average weighted term to settlement (years)+ 1 years (291) (4,755) (985) (4,940)- 1 years 347 4,894 668 5,142
Expense rate1% 1,071 3,246 1,080 2,352
-1% (1,071) (3,246) (1,080) (2,352)
Risk margin1% (937) (2,907) (948) (2,028)
-1% 937 2,907 948 2,028
The movements are the absolute movement in the assumption (e.g. +1% increase in the expense rate for Property from 1.8% to 2.8%).

115
Notes to and forming part of the financial statements C. General Business Disclosures
Insurance risk managementFinance is exposed to insurance risk, which is discussed below.
Objectives, policies and processes for managing insurance riskFinance provides insurance and risk management services to deliver a net benefit to the Australian Government over the longer term. The transfer of insurance risk from participating general government sector entities offers the most comprehensive and cost effective approach to the management of risk exposures. The provision of a captive fund focuses on improving risk identification and management in entities and increases in transparency and accountability to the Australian Government and the public.
Key processes to manage insurance risk include: Detailed risk exposure surveys and benchmarking tools identifying insurable risks; Actuarial modelling of claims history, exposures and industry experience to provide an estimate of expected claims
costs for the insured year and to assist in the determination of the annual premium collection; Claim management and investigation processes; Appointment of an independent actuary for valuation services of the outstanding claims liability; WoAG policy development and risk management education to improve risk awareness and capability of fund
members; and Governance frameworks within Finance.
Concentration of insurance riskNo reinsurance policies were placed in 2016-17 (2015-16: nil), reflecting the capacity of the Australian Government to cost-effectively self-insure against infrequent large claims.
C1.1 Underwriting resultDepartmental
30 June 30 June2017 2016$'000 $'000
Direct premium revenuePremium revenue 140,290 125,149Premium revenue eliminated on consolidation 1,176 1,163Total direct premium revenue 141,466 126,312Notional reinsurance expense (5,000) (5,000)Net premium revenue 136,466 121,312
Net incurred claimsInsurance claims (163,993) (94,295)Reinsurance and other recoveries revenue 1,823 1,504Total net claims (162,170) (92,791)
Other underwriting expenses (9,248) (8,061)Underwriting result (34,952) 20,460Revenue from government 9,067 10,151Operating surplus/(deficit) (25,885) 30,611

116
Notes to and forming part of the financial statements C. General Business Disclosures
C1.2 Net claims incurred30 June 2017 30 June 2016
Current year
Prioryears Total
Current year
Prior years Total
$'000 $'000 $'000 $'000 $'000 $'000Gross claims incurred Undiscounted 103,563 59,764 163,327 111,006 (25,830) 85,176Discount and discount movement (5,658) 2,180 (3,478) (5,071) 10,356 5,285Gross claims incurred discounted 97,905 61,944 159,849 105,935 (15,474) 90,461
Reinsurance and other recoveriesUndiscounted (472) (1,380) (1,852) (372) (825) (1,197)Discount and discount movement 2 27 29 1 (308) (307)Reinsurance and other recoveries discounted (470) (1,353) (1,823) (371) (1,133) (1,504)
Net claims incurred 97,435 60,591 158,026 105,564 (16,607) 88,957Claims handling expense 4,144 3,834Total net claims 162,170 92,791
The $60.6 million increase in prior years net claims incurred is due to valuation increases arising from adverse claims experience in the Liability claims category exceeding favourable claims experience in the Property claims category.
C1.3 Reinsurance and other recoveries receivableDepartmental
30 June 30 June2017 2016$'000 $'000
Reinsurance and other recoveries Reinsurance and other recoveries 6,368 6,758Discount to present value (404) (375)Total reinsurance and other recoveries 5,964 6,383
C1.4 Outstanding claims liabilityDepartmental
30 June 30 June2017 2016$'000 $'000
Gross claims liability - undiscounted 393,671 301,843Discount to present value (15,363) (12,136)Gross claims liability - discounted 378,308 289,707Claims handling expense 6,062 7,875Gross central estimate 384,370 297,582Risk margin 54,293 55,005Outstanding claims liability 438,663 352,587
Risk margin adopted 14.1% 18.5%Probability of adequacy of the risk margin 75% 75%

117
Notes to and forming part of the financial statements C. General Business Disclosures
Reconciliation of the movement in discounted outstanding claims liability
30 June 2017 30 June2016
Property Liability Total Total$'000 $'000 $'000 $'000
Net outstanding claims liability at the beginning of the financial year 109,650 236,554 346,204 322,824
Incurred claims 35,801 61,634 97,435 105,564Claims payments (24,224) (47,307) (71,531) (65,577)Unwinding of discount 1,377 2,832 4,209 4,839Risk margin release (2,654) (7,718) (10,372) (9,260)Changes in assumptions and experience (11,280) 78,034 66,754 (12,186)
Net outstanding claims liability at the end of the financial year 108,670 324,029 432,699 346,204Reinsurance and other recoveries 368 5,596 5,964 6,383Gross outstanding claims liability at the end of the financial year 109,038 329,625 438,663 352,587

118
Notes to and forming part of the financial statements C. General Business Disclosures
C1.5 Claims development table
The following table shows the development of the estimated undiscounted outstanding claims relative to the ultimate expected claims for the 10 most recent accident years.
Prior 2008 2009 2010 2011 2012 2013 2014 2015 2016 2017 Total$'000 $'000 $'000 $'000 $'000 $'000 $'000 $'000 $'000 $'000 $'000 $'000
Estimate of net ultimate claims costs
At end of accident year 48,840 45,062 50,778 121,801 61,550 66,779 114,162 102,138 91,686 86,286One year later 47,451 43,312 48,922 108,067 70,345 63,441 106,114 119,144 87,813Two years later 45,204 48,191 47,317 100,453 67,843 65,399 96,653 218,627Three years later 48,962 45,043 70,257 91,789 68,396 62,028 89,631Four years later 46,215 46,681 65,808 84,123 67,312 58,498Five years later 47,361 47,758 65,956 82,395 62,705Six years later 45,257 44,336 51,423 80,279Seven years later 43,452 44,757 49,163Eight years later 42,922 44,909Nine years later 42,661
Estimate of net ultimate claims costs 42,661 44,909 49,163 80,279 62,705 58,498 89,631 218,627 87,813 86,286Cumulative payments (42,514) (44,654) (46,878) (76,972) (48,391) (44,963) (49,559) (52,168) (25,589) (9,486)Net claims liability -undiscounted 9,004 147 255 2,285 3,307 14,314 13,535 40,072 166,459 62,224 76,800 388,402Discount to present value (169) (3) (5) (61) (77) (365) (408) (1,731) (3,964) (3,565) (4,680) (15,028)Net claims liability -discounted 8,835 144 250 2,224 3,230 13,949 13,127 38,341 162,495 58,659 72,120 373,374Claims handling expense 6,062Net central estimate 379,436Net risk margin 53,263Total net outstanding claims liability 432,699Reinsurance and other recoveries 5,964Total gross outstanding claims liability 438,663
The claims development table discloses amounts net of reinsurance and other recoveries to give the most meaningful insight into the impact on surplus/(deficit).

119
Notes to and forming part of the financial statements C. General Business Disclosures
C2 : Investment funds
Finance provides advice on investment mandates and governance arrangements for the investment funds. This includes advice on the credit of amounts to and debits for payment from the investment funds. The Future Fund Board of Guardians (the Board), supported by the Future Fund Management Agency (FFMA), is responsible for the management and investment of the assets of the investment funds. The investment funds consist of the following:
Building Australia Fund (BAF) - an investment fund established by the Nation-building Funds Act 2008 to make payments in relation to the creation or development of transport, communication, eligible national broadband network, energy and water infrastructure. The BAF is to be closed by 31 December 2017, subject to the passage of legislation.
Education Investment Fund (EIF) - an investment fund established by the Nation-building Funds Act 2008 to make payments in relation to the creation or development of higher education, research, vocational education and training, and eligible education infrastructure and to make transitional Higher Education Endowment Fund payments. The EIF is to be closed by 31 December 2017, subject to the passage of legislation.
DisabilityCare Australia Fund (DCAF) - an investment fund established by the DisabilityCare Australia Fund Act2013 to reimburse the Commonwealth, States and Territories for costs incurred in relation to the National Disability Insurance Scheme Act 2013.
Medical Research Future Fund (MRFF) - a financial asset fund established under the Medical Research Future Fund Act 2015 to support medical research and innovation into the future. The MRFF commenced on 22 September 2015.
Key judgements and estimatesIn applying Finance's accounting policies, management has made a number of judgements and applied estimates and assumptions to future events. Judgements and estimates which are material to the financial statements are located throughout the investment funds disclosure.
Policy and measurementInvestment Mandates were issued by the responsible Ministers on 14 July 2009 for the BAF and EIF and on 1 July 2014 for the DCAF. The Investment Mandates set a target benchmark return of the Australian three month bank bill swap rate + 0.3% per annum calculated on a rolling 12 month basis (net of fees). The Investment Mandates also require the Board to invest in such a way as to minimise the probability of capital losses over a 12 month horizon.
The Investment Mandate for the MRFF was issued by the responsible minister on 8 November 2015. This mandate states that the Board is to adopt an average return of at least the Reserve Bank of Australia Cash Rate target + 1.5 to 2.0% per annum, net of investment fees, over a rolling 10 year term as the benchmark return on the Fund. In targeting the benchmark return, the Board must determine an acceptable but not excessive level of risk measured in terms such as the probability of losses in a particular year.
All investments are designated as financial assets through profit or loss (FVPL) on acquisition. Subsequent to initial recognition, all investments held at FVPL are measured at fair value with changes in their fair value recognised in the Schedule of Comprehensive Income each reporting date. Investments are recognised and derecognised on trade date where purchase or sale of an investment is under a contract whose terms require delivery of the investment within the timeframe established by the market concerned. Investments are initially measured at fair value, net of transaction costs that are directly attributable to acquisition or issue of the investment. Investments in collective investment vehicles are recorded at fair value on the date which consideration is provided to the contractual counterparty under the terms of the relevant subscription agreement. Any associated due diligence costs in relation to these investments are expensed when incurred.
The following methods are adopted by the investment funds in determining the fair value of investments:
Listed securities, exchange traded futures and options and investments in listed managed investment schemes are recorded at the quoted market prices on relevant stock exchanges.
Unlisted managed investment schemes and collective investment vehicles are re-measured by the investment funds based on the estimated fair value of the net assets of each scheme or vehicle at the reporting date. In determining the fair value of the net assets of unitised unlisted managed investment schemes and collective investment vehicles, reference is made to the underlying unit price provided by the manager (where available), capital account statements and the most recent audited financial statements of each scheme or vehicle.

120
Notes to and forming part of the financial statements C. General Business Disclosures
Manager valuation reports are reviewed to ensure the underlying valuation principles are materially compliant with AAS and applicable industry standards including International Private Equity and Venture Capital Valuation Guidelines as endorsed by the Australian Private Equity and Venture Capital Association Limited.
Derivative instruments including forward foreign exchange contracts, interest rate swaps, futures and forward contracts on mortgage backed securities are recorded at their fair value on the date the contract is entered into and are subsequently re-measured to their fair values at each reporting date. Further disclosures regarding the use of derivatives by the investment funds is presented in Note C2.3.
Asset backed securities, bank bills, negotiable certificates of deposit, mortgaged backed securities, government securities and corporate debt securities which are traded in active markets are valued at the quoted market prices. Securities for which no active market is observable are valued at current market rates using broker sourced market quotations and/or independent pricing services as at the reporting date.
MRFF Investment Companies (MRFFICs)Whilst all investments are held by the Board in respect of the relevant investment fund, some investments are indirectly held through wholly owned investment holding companies, MRFFICs. The MRFFICs are funded primarily via loan arrangements from the MRFF and each respective MRFFIC. These loans are designated as financial assets and measured at fair value with changes in their fair value recognised in the Schedule of Comprehensive Income each reporting date. Loan assets are repayable on demand. Interest rates are set on the loans having regard to the 10-year government bond rate in the market in which the underlying investment is made. As the MRFFICs hold a material portion of the investments of the investment funds, these are recorded on a net assets basis in Finance’s primary schedules. For risk management purposes these are disclosed by the underlying investment held by the MRFFICs as this provides users with more relevant information in relation to the investment portfolio and Finance’s exposure.

121
Notes to and forming part of the financial statements C. General Business Disclosures
C2.1 Investment funds operating resultsBAF EIF DCAF MRFF Total Total
30 June 30 June 30 June 30 June 30 June 30 June2017 2017 2017 2017 2017 2016$'000 $'000 $'000 $'000 $'000 $'000
RevenueGains on financial instruments at FVPLForeign exchange gains
Realised foreign exchange gains 30,858 44,286 86,971 46,840 208,955 -Net unrealised foreign exchange gains 6,930 12,140 28,986 - 48,056 93,134
Total foreign exchange gains 37,788 56,426 115,957 46,840 257,011 93,134Interest bearing securities
Bank bills and negotiable certificates of deposit 30,096 22,340 29,203 24,274 105,913 94,359Mortgage backed securities 9,903 9,144 16,692 7,502 43,241 45,098Corporate debt securities 13,282 17,015 34,187 16,904 81,388 78,197Government debt securities 468 738 1,002 2,263 4,471 5,051Asset backed securities 1,606 1,802 4,999 3,170 11,577 4,255MRFFICs loans - - - 5,084 5,084 488Other income 702 956 4,809 (842) 5,625 6,932
Total interest bearing securities 56,057 51,995 90,892 58,355 257,299 234,380
Realised gains (losses) 9,481 22,154 11,779 56,778 100,192 299,578Unrealised gains (losses) (34,048) (61,977) (92,202) 13,031 (175,196) (243,724)
Total gains on financial instruments at FVPL 69,278 68,598 126,426 175,004 439,306 383,368Interest 24,057 23,740 29,023 14,746 91,566 98,946Dividends and distribution income - - - 13,228 13,228 6,147
Total revenue 93,335 92,338 155,449 202,978 544,100 488,461
Expenses Net realised foreign exchange losses - - - - - 106,288Net unrealised foreign exchange losses - - - 6,925 6,925 -Suppliers expenses 3,625 3,825 4,718 10,126 22,294 15,091
Total expenses 3,625 3,825 4,718 17,051 29,219 121,379
Net investment funds return 89,710 88,513 150,731 185,927 514,881 367,082 Distributions to portfolio special accounts - 22,593 - 60,876 83,469 117,658
Net surplus 89,710 65,920 150,731 125,051 431,412 249,424

122
Notes to and forming part of the financial statements C. General Business Disclosures
C2.2 Investment funds financial positionBAF EIF DCAF MRFF Total Total
30 June 30 June 30 June 30 June 30 June 30 June2017 2017 2017 2017 2017 2016$'000 $'000 $'000 $'000 $'000 $'000
AssetsFinancial assets designated at FVPLInterest bearing securities
Bank bills - - - 185,648 185,648 138,146Negotiable certificates of deposit 1,468,548 1,199,830 4,320,250 1,077,549 8,066,177 4,513,442Corporate debt securities 636,224 802,671 1,212,185 248,802 2,899,882 3,723,831Mortgage backed securities 390,167 366,137 665,509 203,186 1,624,999 1,574,700Government debt securities 44,909 62,133 135,341 87,210 329,593 728,976Asset backed securities 104,920 136,913 440,733 205,102 887,668 629,208Other fixed income securities 35,027 50,908 38,529 77,305 201,769 272,537
Other investmentMRFFICs equities - - - 92,306 92,306 54,302MRFFICs loans - - - 404,765 404,765 259,450Listed equities and managed investment schemes - - - 436,821 436,821 114,396Collective investment vehicles - - 67,838 759,437 827,275 390,687Restricted cash 2,442 3,953 7,513 102,404 116,312 -
DerivativesCurrency contracts 15,994 24,665 54,169 22,045 116,873 90,385Interest rate swap agreements 249 482 - - 731 3,811Credit default swaps - - - 3 3 489Forward contracts on mortgage backed securities - - - - - 184
Total financial assets designated at FVPL 2,698,480 2,647,692 6,942,067 3,902,583 16,190,822 12,494,544Loans and receivables
Cash and cash equivalents 1,092,625 1,146,802 3,484,102 742,447 6,465,976 4,236,507Interest receivable 1,929 1,937 3,995 1,461 9,322 8,341Dividends and distribution receivables - - - 1,833 1,833 1,591Unsettled sales - - 9,576 10,833 20,409 11,607Imputation credits refundable - - - 3,944 3,944 1,483
Total loans and receivables 1,094,554 1,148,739 3,497,673 760,518 6,501,484 4,259,529Total assets 3,793,034 3,796,431 10,439,740 4,663,101 22,692,306 16,754,073
LiabilitiesFinancial liabilities designated at FVPLDerivatives
Currency contracts 655 1,438 2,397 3,984 8,474 20,544Interest rate swap agreements 423 807 - 75 1,305 3,687Credit default swaps - - - 3,626 3,626 2,083
Total financial liabilities designated at FVPL 1,078 2,245 2,397 7,685 13,405 26,314Financial liabilities measured at amortised cost
Trade creditors and accruals 953 1,037 1,373 2,533 5,896 5,470Unsettled purchases 5,815 7,256 36,885 44,063 94,019 16,389
Total financial liabilities measured at amortised cost 6,768 8,293 38,258 46,596 99,915 21,859
Total liabilities 7,846 10,538 40,655 54,281 113,320 48,173
Net assets 3,785,188 3,785,893 10,399,085 4,608,820 22,578,986 16,705,900

123
Notes to and forming part of the financial statements C. General Business Disclosures
Collective investment vehicles
The investment funds, directly and via the MRFFICs have committed to provide capital to various collective investment vehicles. The total of these commitments at balance date is $95 million (2016: $40 million). The investment fund’s commitments, being capital calls, are set out in the various underlying subscription documents. While the actual timing of the capital calls to be made by the managers of these vehicles is uncertain, as it is dependent on the managers sourcing suitable investment opportunities, the investment funds have recorded the commitments as being current in accordance with the underlying legal documents. The investment funds have appropriate liquidity planning in place to ensure a suitable allocation of resources will be available to cover these future commitments of capital.
The table below provides more detailed information on the commitments and outstanding calls of collective investment vehicles held directly by the MRFF, DCAF and via MRFFICs at balance date:
Description of underlying Strategy
Capital committed as at 30 June
2017 local currency
Outstanding commitments as at 30 June
2017 AUD equivalent
Net capital cost as at 30 June
2017 AUD equivalent
Fair value as at 30 June 2017
AUD equivalent$'000 $'000 $'000
Directly held by MRFF and DCAFDebt AUD 200,000,000 - 200,000 212,777Debt USD 40,000,000 31,289 21,108 21,184Alternatives AUD 615,000,000 - 616,004 593,314Total 31,289 837,112 827,275Via MRFFICsAlternatives AUD 75,000,000 - 81,073 73,533Alternatives USD 141,000,000 14,856 176,694 175,035Private equity AUD 36,275,000 16,591 19,684 20,552Private equity EUR 52,682,166 14,044 53,201 62,149Private equity USD 139,075,213 17,794 148,273 162,798Total 63,285 478,925 494,067
C2.3 Managing financial risk
The investment funds have entered into derivative contracts to manage their exposure to foreign exchange risk, interest rate risk, equity market risk and credit risk. The investment funds also use derivatives to gain indirect exposure to market risks. The use of derivative financial instruments by the investment funds is governed by the Nation-building Funds Act 2008, the DisabilityCare Australia Fund Act 2013 and the Medical Research Future Fund Act 2015.
C2.3.1 Market risk
Market risk is the risk of loss arising from movements in the prices of various assets flowing from changes in interest rates and foreign currency.

124
Notes to and forming part of the financial statements C. General Business Disclosures
Interest rate risk
Interest rate risk exposure
The investment funds are exposed to risk of loss arising from movement in the prices of various assets flowing through interest rate changes. The total exposure for each class of financial asset is set out below.
Financial assets exposed to interest rate riskFloating
interest rateFixed interest
rateNon-interest
bearing Total2017 $'000 $'000 $'000 $'000Cash and cash equivalents 6,465,976 - - 6,465,976Interest bearing securities 3,772,130 10,423,606 - 14,195,736Other financial assets - - 2,030,594 2,030,594Total investment 10,238,106 10,423,606 2,030,594 22,692,306Total interest rate swaps (notional amount)
Pay (245,922) (114,428) -Receive 114,428 245,922 -
2016Cash and cash equivalents 4,236,507 - - 4,236,507Interest bearing securities 4,335,503 7,245,337 - 11,580,840Other financial assets - - 936,726 936,726Total investment 8,572,010 7,245,337 936,726 16,754,073Total interest rate swaps (notional amount)
Pay (78,754) (168,092) -Receive 168,092 78,754 -
Interest rate derivative contracts
The investment funds had open positions in exchange traded interest rate futures contracts and interest rate swap agreements at reporting date. Interest rate derivatives contracts are used by the investment fund's managers to managethe exposure to interest rate risk and to ensure it remains within approved limits. The notional value of the open contracts and their fair value are set out below.
Notional value
Fair market value
Notional value
Fair market value
30 June 30 June 30 June 30 June2017 2017 2016 2016$'000 $'000 $'000 $'000
Open contractsBuy domestic interest rate futures contracts 243,344 (2,591) 420,405 1,784Sell domestic interest rate futures contracts (180,967) 443 (134,984) (115)Buy international interest rate futures contracts 1,221,606 (4,108) 509,630 (3,313)Sell international interest rate futures contracts (2,852,079) 79,650 (2,528,442) 49,096Receiver (fixed) interest rate swap agreements 245,922 (200) 78,754 3,811Payer (fixed) interest rate swap agreements (114,428) (374) (168,092) (3,687)Buy forward contracts on mortgage backedsecurities - - 63,833 187Sell forward contracts on mortgage backed securities - - (2,787) (3)
Total open contracts 72,820 47,760
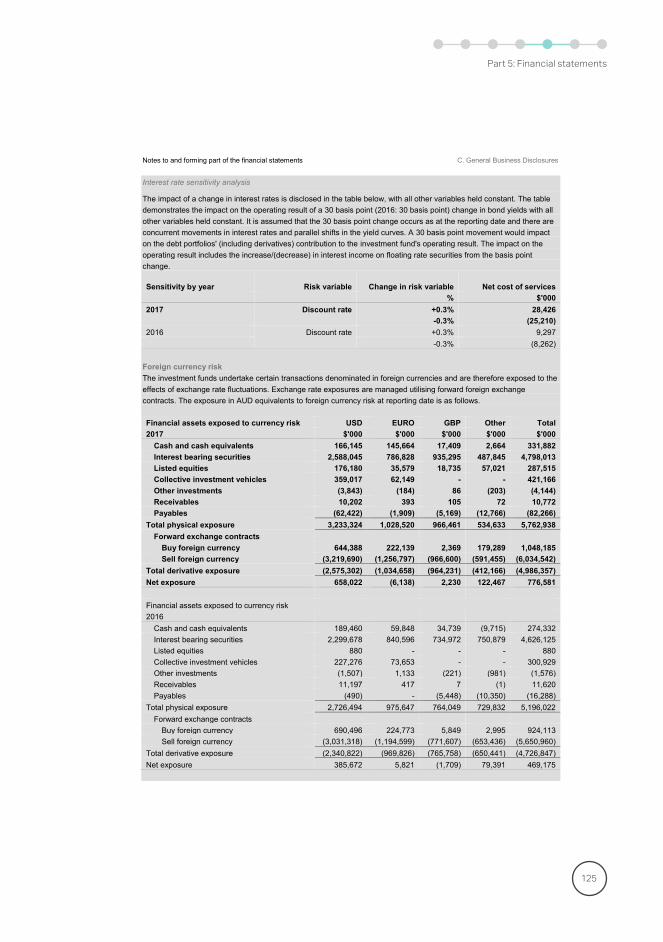
125
Notes to and forming part of the financial statements C. General Business Disclosures
Interest rate sensitivity analysis
The impact of a change in interest rates is disclosed in the table below, with all other variables held constant. The table demonstrates the impact on the operating result of a 30 basis point (2016: 30 basis point) change in bond yields with all other variables held constant. It is assumed that the 30 basis point change occurs as at the reporting date and there are concurrent movements in interest rates and parallel shifts in the yield curves. A 30 basis point movement would impact on the debt portfolios' (including derivatives) contribution to the investment fund's operating result. The impact on the operating result includes the increase/(decrease) in interest income on floating rate securities from the basis point change.
Sensitivity by year Risk variable Change in risk variable Net cost of services% $'000
2017 Discount rate +0.3% 28,426-0.3% (25,210)
2016 Discount rate +0.3% 9,297-0.3% (8,262)
Foreign currency riskThe investment funds undertake certain transactions denominated in foreign currencies and are therefore exposed to the effects of exchange rate fluctuations. Exchange rate exposures are managed utilising forward foreign exchange contracts. The exposure in AUD equivalents to foreign currency risk at reporting date is as follows.
Financial assets exposed to currency risk USD EURO GBP Other Total2017 $'000 $'000 $'000 $'000 $'000
Cash and cash equivalents 166,145 145,664 17,409 2,664 331,882Interest bearing securities 2,588,045 786,828 935,295 487,845 4,798,013Listed equities 176,180 35,579 18,735 57,021 287,515Collective investment vehicles 359,017 62,149 - - 421,166Other investments (3,843) (184) 86 (203) (4,144)Receivables 10,202 393 105 72 10,772Payables (62,422) (1,909) (5,169) (12,766) (82,266)
Total physical exposure 3,233,324 1,028,520 966,461 534,633 5,762,938Forward exchange contracts
Buy foreign currency 644,388 222,139 2,369 179,289 1,048,185Sell foreign currency (3,219,690) (1,256,797) (966,600) (591,455) (6,034,542)
Total derivative exposure (2,575,302) (1,034,658) (964,231) (412,166) (4,986,357)Net exposure 658,022 (6,138) 2,230 122,467 776,581
Financial assets exposed to currency risk2016
Cash and cash equivalents 189,460 59,848 34,739 (9,715) 274,332Interest bearing securities 2,299,678 840,596 734,972 750,879 4,626,125Listed equities 880 - - - 880Collective investment vehicles 227,276 73,653 - - 300,929Other investments (1,507) 1,133 (221) (981) (1,576)Receivables 11,197 417 7 (1) 11,620Payables (490) - (5,448) (10,350) (16,288)
Total physical exposure 2,726,494 975,647 764,049 729,832 5,196,022 Forward exchange contracts
Buy foreign currency 690,496 224,773 5,849 2,995 924,113Sell foreign currency (3,031,318) (1,194,599) (771,607) (653,436) (5,650,960)
Total derivative exposure (2,340,822) (969,826) (765,758) (650,441) (4,726,847)Net exposure 385,672 5,821 (1,709) 79,391 469,175

126
Notes to and forming part of the financial statements C. General Business Disclosures
Foreign currency sensitivity analysis
The sensitivity analysis table below demonstrates the impact on the operating result of a movement in the value of the AUD relative to the actual net exposures as at year end, with all other variables held constant.
Sensitivity by year Risk variable Change in risk variable Net cost of services% $'000
2017 Exchange rate +10.2% 168,120-10.2% (168,120)
2016 Exchange rate +10.5% 89,666-10.5% (89,665)
Other price risk The MRFF and MRFFICs are exposed to price risk arising from equity investments. The equity price risk is the risk that the value of the MRFF equity portfolio will decrease as a result of changes in the levels of equity indices and the price of individual stocks. The MRFF and MRFFICs are held at FVPL. The exposure to equity price risk at the reporting date was as follows:
30 June2017$'000
Domestic equities and managed investment schemes 149,310International equities and managed investment schemes 287,511
Total equity price risk exposure 436,821
Equity derivative contracts
Equity futures are used to manage the exposure to equity price risk. The notional value and fair value of the MRFF openpositions at 30 June 2017 are set out in the following table.
Notional valueFair market
value30 June 30 June
2017 2017$'000 $'000
Buy domestic equity futures contracts 1,553 (13)Buy international equity futures contracts 289,362 (523)
Total equity derivative contracts 290,915 (536)
Equity price sensitivity analysisThe analysis below demonstrates the impact on the MRFF and MRFFIC’s operating result of the following movement. +/- 20% on Australian equities +/- 15% on International equitiesThe sensitivity analysis has been performed to assess the direct risk of holding equity instruments. The analysis is undertaken on the base currency values of the underlying exposures.
30 JuneImpact on operating results 2017
$'00020% increase in Australian equities 36,49715% increase in International equities 150,914Total 187,411
20% decrease in Australian equities (36,498)15% decrease in International equities (150,981)Total (187,479)

127
Notes to and forming part of the financial statements C. General Business Disclosures
C2.3.2 Liquidity risk
Liquidity risk is the risk that the investment funds will not be able to meet their obligations as they fall due. The Nation Building Funds (NBFs) and DCAF are currently invested in cash and cash like instruments under the current Investment Mandate. Accordingly, the risk of these funds not being able to meet their obligations is low. The MRFF must be in a position to meet the distribution payments required of it up to the amount periodically declared as distributable by the Board, which is managed under the Short-term Liquidity Risk Policy. This includes a short-term crash test which is applied to the portfolio to ensure it is able to meet its immediate cash flow obligations under a plausible but very severe market dislocation.
C2.3.3 Credit risk management
Credit risk is the risk of loss that arises from a counterparty failing to meet their contractual commitments in full and on time, or from losses arising from the change in value of a traded financial instrument as a result of changes in credit risk on that instrument. The Board sets limits on the credit ratings of debt investments when appointing investment managers. These limits are reflected in the underlying investment mandates and are monitored by the FFMA with compliance reported to the Board. The investment fund's maximum exposure to credit risk at reporting date in relation to each class of recognised financial asset is the carrying amount of those assets as indicated in the investment fund’sfinancial position.
30 June 30 June As at 30 June 2017, the investment funds had an exposure of greater than 10% of its net assets to interest bearing securities issued by domestic banks and cash deposits held with banks. Exposures to individual counterparties greater than 5% of the net assets of the investment funds are identified in this table.
2017 2016Interest bearing securities issued by $'000 $'000Commonwealth Bank of Australia 5,129,916 4,383,243Westpac Banking Corporation 2,176,750 1,338,045National Australia Bank 2,329,367 1,628,136Australia and New Zealand Banking Group 4,066,284 1,609,695
Total 13,702,317 8,959,119
Credit exposure by credit rating30 June 30 June
The investment funds use Moody's and Standard & Poors credit rating scales to report exposure to credit risk. The long term credit risk exposures range from ‘AAA’ (extremely strong capacity to meet financial commitments) to ‘below investment grade/not rated’. The investments classified as below investment grade are held in debt mandates. This table provides information regarding the credit risk exposures of the debt instruments held by the investment funds at reporting date according to the credit ratings of the underlying debt instruments.
2017 2016$'000 $'000
Long-term rated securitiesAAA 2,412,711 2,183,656AA 6,719,131 5,080,944A 2,673,234 3,201,138BBB 48,901 237,124Below investment grade/not rated 300,483 292,349Short-term rated securitiesA-1+ 8,251,826 4,520,022Other
US Government Guaranteed 255,427 302,115Total debt securities held 20,661,713 15,817,348
Other non-debt financial assets 2,030,593 936,725Total financial assets 22,692,306 16,754,073

128
Notes to and forming part of the financial statements C. General Business Disclosures
Credit risk derivativesThe investment funds managers utilise credit default swaps to gain exposure to, and to hedge, credit risk. The investment funds transact in credit default swaps in the form of centrally cleared over-the-counter contracts. Centrally cleared transactions are cash margined at least daily. Managers are required to fully cash back all sold credit protection positions. Outstanding positions are marked to market and collateralisation of out of the money positions is required by the central clearing exchange.
Notional value Fair market value30 June 30 June
2017 2017$'000 $'000
The notional value of the open credit default swap positions, the impact on increasing or reducing credit exposures and their fair value are set out in this table for the MRFF.
Buy credit protection 87,139 (3,626)Sell credit protection 130 3Total 87,269 (3,623)

129
Notes to and forming part of the financial statements C. General Business Disclosures
C3 : SuperannuationC3.1 Overview of schemes
Finance administers the following defined benefit superannuation schemes on behalf of the government:
Commonwealth Superannuation Scheme (CSS), including the 1922 Scheme; Public Sector Superannuation Scheme (PSS); Parliamentary Contributory Superannuation Scheme (PCSS); Governor-General Pension Scheme (G-GPS); Judges' Pensions Scheme (JPS), and Federal Circuit Court Judges Death and Disability Scheme (FCCJDDS).
The CSS, PSS and PCSS are closed to new members.
Finance recognises an administered liability for the present value of the Australian Government's expected future payments arising from the PCSS, JPS, G-GPS and FCCJDDS and the unfunded components of the 1922 Scheme, CSS and PSS. These liabilities are based on an annual actuarial assessment. The funded components of these schemes are reported in the financial statements of the respective schemes. Finance also has the responsibility to record the Australian Government's transactions in relation to the above schemes.
Policy and measurement
Actuarial gains or losses are recognised in equity in the year in which they occur. Interest on the net defined benefit liability is recognised in the surplus/(deficit); the return on plan assets excluding the amount included in interest income is recognised in equity.
Superannuation liabilities are calculated annually as the present value of future benefit obligations less the fair value of scheme assets. The rate used to discount future benefits is determined by reference to the government bond rate at the reporting date.
Amounts recognised in the Schedule of Comprehensive Income and Schedule of Assets and LiabilitiesOther
CSS PSS PCSS G-GPS JPS FCCJDDS Total$'000 $'000 $'000 $'000 $'000 $'000 $'000
30 June 2017Revenues 102,724 1,171,578 655 - - - 1,274,957Expenses 2,449,306 6,381,040 40,642 577 88,722 925 8,961,212OCI 2,625,127 18,929,411 102,364 (851) 71,762 606 21,728,419Liabilities 82,539,357 87,317,499 1,138,463 22,036 1,333,185 1,728 172,352,268
30 June 2016Revenues 111,649 1,225,581 1,001 - - - 1,338,231Expenses 2,970,646 5,608,162 48,356 773 86,562 704 8,715,203OCI (9,730,040) (20,827,810) (181,590) (1,244) (121,172) 606 (30,861,250)Liabilities 86,124,618 100,612,550 1,242,850 22,168 1,363,326 2,026 189,367,538

130
Notes to and forming part of the financial statements C. General Business Disclosures
C3.2 Scheme information
The funding arrangements for the various schemes are as follows:
Scheme Funding arrangements
1922 Scheme Unfunded. There are no longer any members contributing under this Act. Benefits are paid to members from the Consolidated Revenue Fund (CRF).
CSS and PSS Partially funded. Contributions generally comprise basic member contributions and employer productivity (up to three per cent) contributions. Unfunded benefits are paid to members from the CRF.
PCSS Unfunded. Member contributions are a fixed percentage of: parliamentary allowance; salary for Ministers of State; and allowance by way of salary for office holders, which is paid into the CRF.Unfunded benefits are paid to members from the CRF.
G-GPS, JPS and FCCJDDS
Unfunded. Members are not required to contribute towards the cost of their benefit during their term of appointment. Unfunded benefits are paid to members from the CRF.
The nature of the benefits provided under the schemes are as follows:
Scheme Benefits Paid1922 Scheme • The benefit payable is a lifetime indexed pension (indexed in January and July) in line with changes
in the CPI. The payments and liabilities in respect of these members are included in the CSS amounts.
CSS • The types of benefits payable are a lifetime indexed pension (indexed in January and July) in line with changes in the CPI, a lifetime non-indexed pension and a lump sum payment. The main retirement benefit is the employer-financed indexed pension that is calculated by a set formula based on a member's age, years of contributory service and final salary.
• Where a member has preserved their benefit in the scheme, when the benefit becomes payable the employer financed indexed pension is calculated by applying age-based factors to the amount of two and a half times the member's accumulated basic member contributions and interest.
• Member’s basic contributions, employer productivity contributions and interest can be taken as a lump sum or an additional non-indexed lifetime pension. This benefit is determined by the value of contributions and investment returns, and in the case of the non-indexed pension by applying age-based factors.
PSS • The types of benefits payable are a lifetime indexed pension (indexed in January and July in line with changes in the CPI) and lump sum. On retirement a lump sum benefit is payable which is calculated based on the member’s length of contributory membership, their rate of member contributions and final average salary (average of a member’s superannuation salary on their last three birthdays).
• Where a member preserves their benefit in the scheme, generally the member’s lump sum benefit at that time is crystallised with the funded component of the benefit accumulating with interest and the unfunded component accumulating with changes in the CPI, until the benefit becomes payable.
• Generally members can convert 50 per cent or more of their lump sum to a lifetime indexed pension. The indexed pension is calculated by applying age-based factors to the amount of lump sum to be converted to a pension.
PCSS • The benefit payable is a lifetime pension or lump sum depending on length of service and additional offices held.
• Where a retiring member has sufficient parliamentary service to meet the pension qualification period for a lifetime pension (which is payable as set out in the Act), pension benefits are expressed

131
Notes to and forming part of the financial statements C. General Business Disclosures
as a percentage of the superannuation salary applicable for the PCSS and are indexed by movements in that superannuation salary.
• A PCSS member who qualifies for a pension can also elect to convert up to half of their benefit to a lump sum. Lump sum benefits are payable to PCSS members who do not have sufficient parliamentary service to qualify for a lifetime pension.
G-GPS • The benefit payable is a lifetime pension equal to 60% of the salary of the Chief Justice of the High Court of Australia.
• There is no minimum qualification period.
JPS • The benefit payable is a lifetime pension equal to 60% of the judicial salary, payable where a judge has 10 or more years’ service and is 60 years of age or older.
• Provisions are made for part pension (pro-rated based on length of service) where a judge retires on reaching the maximum retirement age with at least 6 years but less than 10 years service.
FCCJDDS • Federal Circuit Court Judges who retire due to permanent disability are provided with a pension equal to 60% of the salary the Judge would have received if they had not retired, and is payable until the earlier of the Judge attaining age 70, or his/her death.
• In addition, a Judge continues to receive employer superannuation contributions in respect of this pension until they reach age 65.
Generally, benefits may also be payable to any surviving eligible spouse and children on the death of a member or pensioner.
Regulatory Framework
The following table details the enabling legislation for each of the individually disclosed defined benefit schemes and whether the scheme must comply with the requirements of the Superannuation Industry (Supervision) Act 1993, as well as a number of other Acts.
Scheme Enabling Act Period open to new members Regulatory requirement
CSS Superannuation Act 1976 1 July 1976 to 30 June 1990 Compliance with the Superannuation Industry (Supervision) Act 1993 required for these schemes.PSS Superannuation Act 1990 1 July 1990 to 30 June 2005
1922Scheme Superannuation Act 1922 1 July 1922 to 30 June 1976
These schemes are exempt from Superannuation Industry (Supervision) Act 1993.
PCSS Parliamentary Contributory Superannuation Act 1948 Up to 8 October 2004
G-GPS Governor-General Act 1974 To presentJPS Judges’ Pensions Act 1968 To present
FCCJDDS Federal Circuit Court of Australia Act 1999 To present
Governance
The Commonwealth Superannuation Corporation (CSC) was established under the Governance of Australian Government Superannuation Schemes Act 2011 and is the trustee for the CSS and PSS. CSC is responsible for:
providing administration services for each scheme; management and investment of scheme assets; compliance with superannuation taxation and other applicable laws; and compliance with relevant legislation including the Governance of Australian Government Superannuation Schemes
Act 2011.
CSC is supported by a custodian and other specialist providers.
The trustee for the PCSS is established by the enabling Act and comprises five trustees, being two Senators, two members of the House of Representatives and the Finance Minister. Finance acts as adviser to the Trust. The Secretary of Finance also has certain powers under the Act in relation to administration of the PCSS.

132
Notes to and forming part of the financial statements C. General Business Disclosures
The enabling Acts for the ‘other’ defined benefit superannuation schemes confer certain powers to the Secretary of Finance in relation to administration of each scheme. Day-to-day administration of the schemes is undertaken by Finance.
C3.3 Risks and assumptions
The schemes are exposed to interest rate risk, investment risk, longevity risk and salary risk. The following pages identify and explain the amounts reported in these financial statements and detail the principal actuarial assumptions underpinning each of the major schemes, including an analysis of the sensitivity of changes in these assumptions to the amounts reported in the financial statements.
Composition of scheme assets
The fair value of scheme assets for CSS and PSS at 30 June 2017 is $20.4 billion (30 June 2016 was $19.6 billion). The assets are diversified in the following sectors: Australian equity 20%; International equity 23%; Property 10%; Private capital 6%; Infrastructure 3%; Corporate bonds 6%; Alternative strategies 14% and Cash and sovereign bonds 18%. This includes $287.1 million (2016: $465.9 million) of Commonwealth Government Bonds.
Key judgements and estimates
Principal actuarial assumptions are as follows:2017 2016
Discount rate1
CSS 3.0% 2.7%PSS and Other Schemes 3.5% 2.7%
Expected salary growth rate (CSS/PSS)2.0%pa to June 2019
3.5%pa thereafter+promotional increase
2.0%pa to June 20194%pa thereafter
+promotional increase
Expected pension increase rate (CPI) 2.5% 2.5%
1 The release of a 30 year bond during the year has provided the opportunity to improve the matching of the liability duration of the individual schemes and the duration of Commonwealth issued bonds. This has resulted in the use of a different discount rate for CSS compared to the other schemes.
Other material assumptionsCSS, PSS, and PCSSAssumptions have been made regarding rates of retirement, death (for active, preserved and pension members), mortality improvements, invalidity, resignation, retrenchment, retention and take up rates of pensions in the scheme. Assumptions have also been made for the ages of spouses and rates of member contributions. These assumptions are consistent to those used within the LTCR 2014.
Membership data as at 30 June 2016 has been rolled forward to 30 June 2017 by making allowance for estimated investment earnings, contributions, salary increases, benefit payments and benefit accruals, using the actuarial assumptions from the LTCR where other information is not available. The defined benefit obligation calculated is based on the rolled forward membership data that was then adjusted to reflect the difference between expected benefit payments and actual benefit payment to 30 June 2017.
The fair value of scheme assets as at 30 June 2017 (CSS and PSS only) were estimated using the unaudited net scheme assets available to pay benefits at 31 May 2017 rolled forward to 30 June 2017 with cash flow items provided by the CSC. An estimate of the actual rate of investment return earned by the scheme during June 2017 was used in determining the fair value of scheme assets.
Other Schemes – G-GPS, JPS and FCCJDDSMembership data as at 31 May 2017 has been rolled forward to 30 June 2017. Other actuarial assumptions are consistent to those used within the LTCR.

133
Notes to and forming part of the financial statements C. General Business Disclosures
Sensitivity analysis for significant actuarial assumptions
The impact of a change in the defined benefit obligation reported as at 30 June 2017 under several scenarios is presented below. The defined benefit obligation has been recalculated by changing the assumptions as outlined below, whilst retaining all other assumptions.
Impact on defined benefit obligation0.5% increase 0.5% decrease
Assumption Movement in $'000 Movement in $'000CSS PSS Other CSS PSS Other
Discount rate 1 (5,270,031) (9,791,412) (168,885) 5,854,364 11,320,490 188,754
Salary growth rate 139,506 2,363,395 181,433 (133,602) (2,211,991) (164,190)
Pension increase rate 4,839,188 7,430,954 n/a (4,419,636) (6,675,455) n/a
1 An increase in the discount rate between financial years generates a decrease in the provision and a gain in other comprehensive income. Conversely, a decrease in the discount rate between financial years causes an increase in the defined benefit obligation (liability) and a loss to other comprehensive income.
C3.4 Commonwealth Superannuation Scheme (CSS)
Employer productivity contributionsThe expected employer productivity contribution for 2018 is $12.3 million (2017 actual $14.0 million).
Maturity profile of defined benefit obligation
The weighted average duration of the defined benefit obligation is 13.2 years for CSS 1976 and 7.3 years for CSS 1922.
Reconciliation of the
Present value of the defined benefit
obligationFair value of the scheme assets
Net defined benefit liability
30 June 30 June 30 June 30 June 30 June 30 June2017 2016 2017 2016 2017 2016$'000 $'000 $'000 $'000 $'000 $'000
Value at beginning of the year 89,197,538 80,288,765 3,072,920 3,490,457 86,124,618 76,798,308Current service cost 177,183 192,944 - - 177,183 192,944Interest cost 2,344,345 2,898,414 - - 2,344,345 2,898,414Interest income - - 72,222 120,712 (72,222) (120,712)
Total expense 2,521,528 3,091,358 72,222 120,712 2,449,306 2,970,646Actual return on scheme assets less interest income - - 162,175 (82,340) (162,175) 82,340
Actuarial (gains) / losses adjusted in other comprehensive income arising fromChanges in demographic assumptions - - - - - -Changes in financial assumptions (3,031,074) 10,546,599 - - (3,031,074) 10,546,599Liability experience 568,122 (898,899) - - 568,122 (898,899)
Total other comprehensive income (2,462,952) 9,647,700 162,175 (82,340) (2,625,127) 9,730,040Contributions by scheme participants 56,426 61,993 56,426 61,993 - -Productivity contributions 14,041 17,265 14,041 17,265 - -Net appropriation from CRF - - 3,409,440 3,374,376 (3,409,440) (3,374,376)Benefits paid (3,993,754) (3,906,514) (3,993,754) (3,906,514) - -Taxes, premiums and expenses paid (2,200) (3,029) (2,200) (3,029) - -Value at end of the year 85,330,627 89,197,538 2,791,270 3,072,920 82,539,357 86,124,618

134
Notes to and forming part of the financial statements C. General Business Disclosures
The fair value of scheme assets relates to investments in the Pooled Superannuation Trust (PST). These are disclosed as level 2 in the fair value hierarchy, where the net market value is derived from observable inputs (other than quoted prices) such as prices or derived from prices.
C3.5 Public Sector Superannuation Scheme (PSS)
Employer productivity contributionsThe expected productivity contributions for 2018 is $167.9 million (2017 actual $172.8 million).
Maturity profile of defined benefit obligationThe weighted average duration of the defined benefit obligation is 20.3 years.
Reconciliation of the
Present value of the defined benefit
obligationFair value of the scheme assets
Net defined benefit liability
30 June 30 June 30 June 30 June 30 June 30 June2017 2016 2017 2016 2017 2016$'000 $'000 $'000 $'000 $'000 $'000
Value at beginning of the year 117,145,347 91,382,837 16,532,797 16,583,042 100,612,550 74,799,795Current service cost 3,672,212 2,864,799 - - 3,672,212 2,864,799Interest cost 3,147,248 3,351,821 - - 3,147,248 3,351,821Interest income - - 438,420 608,458 (438,420) (608,458)
Total expense 6,819,460 6,216,620 438,420 608,458 6,381,040 5,608,162Actual return on scheme assets less interest income - - 1,056,557 (382,259) (1,056,557) 382,259
Actuarial (gains) / losses adjusted in other comprehensive income arising fromChanges in demographic
assumptions - - - - - -Changes in financial assumptions (20,058,075) 21,274,332 - - (20,058,075) 21,274,332Liability experience 2,185,221 (828,781) - - 2,185,221 (828,781)
Total other comprehensive income (17,872,854) 20,445,551 1,056,557 (382,259) (18,929,411) 20,827,810Contributions by scheme participants 520,909 533,697 520,909 533,697 - -Productivity contributions 172,842 188,761 172,842 188,761 - -Net appropriation from CRF - - 746,680 623,217 (746,680) (623,217)Benefits paid (1,810,227) (1,586,172) (1,810,227) (1,586,172) - -Taxes, premiums and expenses paid (26,176) (35,947) (26,176) (35,947) - -Value at end of the year 104,949,301 117,145,347 17,631,802 16,532,797 87,317,499 100,612,550
The fair value of scheme assets relates to investments in the PST. These are disclosed as level 2 in the fair value hierarchy, where the net market value is derived from observable inputs (other than quoted prices) such as prices or derived from prices.

135
Notes to and forming part of the financial statements C. General Business Disclosures
C3.6 Other SchemesFor the purposes of disclosure, the smaller schemes have been grouped under "other":
PCSS G-GPS JPS FCCJDDS$'000 $'000 $'000 $'000
Expected benefit payments for 2018 42,903 1,572 49,924 518Years Years Years Years
Maturity profile of defined benefit obligation 15.8 9.3 15.1 2.0
Reconciliation of the
Present value of the defined benefit
obligationFair value of the scheme assets
Net defined benefit liability
30 June 30 June 30 June 30 June 30 June 30 June2017 2016 2017 2016 2017 2016$'000 $'000 $'000 $'000 $'000 $'000
Value at beginning of the year 2,630,370 2,280,245 - - 2,630,370 2,280,245Current service cost 61,087 53,685 - - 61,087 53,685Interest cost 69,779 82,710 - - 69,779 82,710
Total expense 130,866 136,395 - - 130,866 136,395
Actuarial (gains) / losses adjusted in other comprehensive income arising fromChanges in demographic assumptions - - - - - -Changes in financial assumptions (210,924) 317,749 - - (210,924) 317,749Liability experience 37,043 (14,349) - - 37,043 (14,349)
Total other comprehensive income (173,881) 303,400 - - (173,881) 303,400Net appropriation from CRF - - 91,943 89,670 (91,943) (89,670)Benefits paid (91,943) (89,670) (91,943) (89,670) - -Value at end of the year 2,495,412 2,630,370 - - 2,495,412 2,630,370

136
Notes to and forming part of the financial statements C. General Business Disclosures
C4 : Restructuring
Net assets received from or relinquished to another Australian Government entity under a restructuring of administrative arrangements are adjusted at their book value directly against contributed equity.
Finance assumed responsibility for shared services functions from the Education and Training and Employment portfolios following a restructure of administrative arrangements on 1 December 2016. Shared services functions transferred included financial and human resources services and the Parliamentary Workflow System.
Finance relinquished responsibility of functions associated with Whole of Australian Government Information and Communications Technology (WOAG ICT) policy, procurement and strategy-related functions to the Digital Transformation Agency (DTA) following a restructure of administrative arrangements on 27 October 2016. Relevant staff, appropriations, assets and liabilities were transferred in 2016-17; however, a final transfer of the relevant components of Finance's CPCSA will occur in 2017-18 following the establishment of the DTA ICT Coordinated Procurement Special Account.
Finance relinquished responsibility of functions associated with: auditing, reporting, providing advice and processing claims relating to travel expenses and allowances of parliamentarians and MOP(S) Act staff following a restructure of administrative arrangements on 3 April 2017. These functions were transferred to the Independent Parliamentary Expenses Authority (IPEA).
Prior year restructures included functions relinquished by Finance to PM&C and the DTA (formerly DTO) relating to the Gov 2.0 function (as part of restructure of administrative arrangements on 21 September 2015) and the transferring of the Boardlinks program to PM&C (following a restructure of administrative arrangements on 6 January 2016).
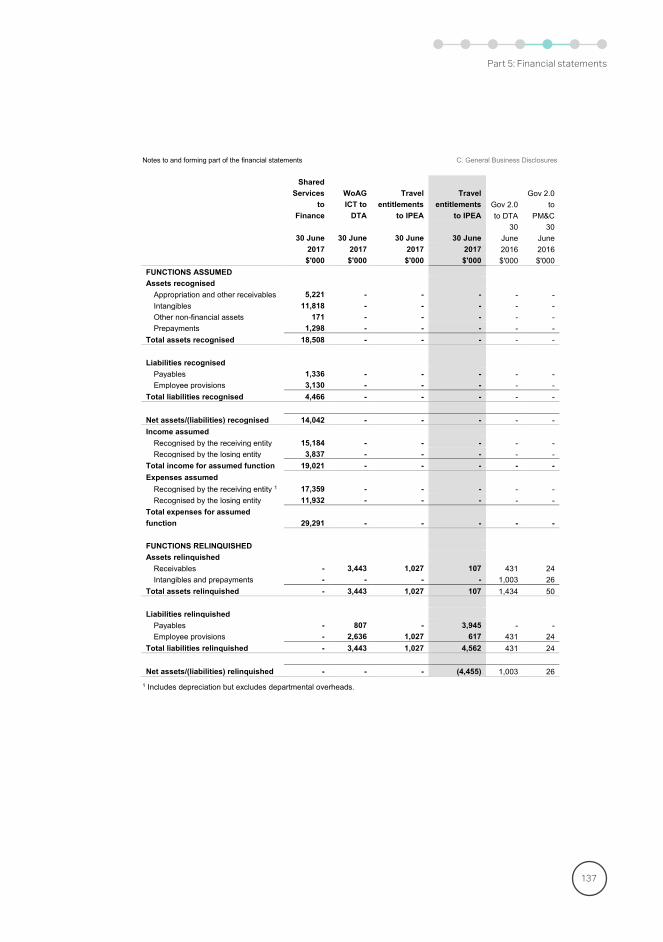
137
Notes to and forming part of the financial statements C. General Business Disclosures
Shared Services
toFinance
WoAG ICT to
DTA
Travel entitlements
to IPEA
Travel entitlements
to IPEAGov 2.0 to DTA
Gov 2.0 to
PM&C
30 June 30 June 30 June 30 June30
June30
June2017 2017 2017 2017 2016 2016$'000 $'000 $'000 $'000 $'000 $'000
FUNCTIONS ASSUMEDAssets recognised
Appropriation and other receivables 5,221 - - - - -Intangibles 11,818 - - - - -Other non-financial assets 171 - - - - -Prepayments 1,298 - - - - -
Total assets recognised 18,508 - - - - -
Liabilities recognisedPayables 1,336 - - - - -Employee provisions 3,130 - - - - -
Total liabilities recognised 4,466 - - - - -
Net assets/(liabilities) recognised 14,042 - - - - -Income assumed
Recognised by the receiving entity 15,184 - - - - -Recognised by the losing entity 3,837 - - - - -
Total income for assumed function 19,021 - - - - -Expenses assumed
Recognised by the receiving entity 1 17,359 - - - - -Recognised by the losing entity 11,932 - - - - -
Total expenses for assumed function 29,291 - - - - -
FUNCTIONS RELINQUISHEDAssets relinquished
Receivables - 3,443 1,027 107 431 24Intangibles and prepayments - - - - 1,003 26
Total assets relinquished - 3,443 1,027 107 1,434 50
Liabilities relinquishedPayables - 807 - 3,945 - -Employee provisions - 2,636 1,027 617 431 24
Total liabilities relinquished - 3,443 1,027 4,562 431 24
Net assets/(liabilities) relinquished - - - (4,455) 1,003 261 Includes depreciation but excludes departmental overheads.

138
Notes to and forming part of the financial statements D. Operating Resources
D. Operating ResourcesThis section provides further information about major assets and liabilities held or administered by Finance, significant estimates and judgements made and the management of risk in relation to these items.
D1 : Financial instrumentsPolicy and measurement
A financial instrument is a contract between entities that gives rise to a financial asset of one entity and a financial liability or equity instrument of the other entity. Generally, financial instruments are recognised and derecognised on 'trade date' which is the date that the risks and rewards of ownership are transferred to the 'buyer'. Finance classifies its financial instruments in the following categories:
Loans and receivable assets: includes cash and cash equivalents which are readily convertible to cash, trade receivables, loans and other receivables with fixed or determinable payments that are not quoted in an active market.
Held-to-maturity investments: non-derivative financial assets with fixed or determinable payments and fixed maturities that an entity has a positive intention and ability to hold to maturity.
Available-for-sale financial assets: non-derivative financial assets that are either designated in this category or are not classified in any other category.
Financial assets/liabilities at FVPL: assets and liabilities held for trading, or portions of an identified portfolio of financial instruments that are managed together and have a recent actual pattern of short term profit taking. Derivatives are classified as held for trading unless they are designated as hedges.
Financial liabilities held at amortised cost: includes suppliers and other payables with a fixed or determinable amount to be paid that are not quoted in an active market.
All financial assets and liabilities are initially recognised at fair value (usually transaction price). For financial instruments not at FVPL, transaction costs are also added to the initial value.
Measurement Type of financial instrument Impairment (assessed annually)At fair value, with all movements captured in the surplus/(deficit).
• Loans and receivables (short term).• Financial assets/liabilities at FVPL including any interest paid or earned.
N/A
At amortised cost using effective interest method, any valuation movement is recognised in the surplus/(deficit).
• Loans and receivables (long term).• Held-to-maturity investments.• Financial liabilities measured at amortised cost (supplier and other payables).• Interest and foreign exchange gains/losses on available for sale financial assets.
Impairment loss is measured as the difference between the carrying amount and the present value of discounted estimated future cash flows. Any asset impairment is shown as a reduction in the value of the asset by way of an allowance account, with the loss being recorded in the surplus/(deficit).
At fair value, with any valuation movement taken to equity (reserves).
• Available-for-sale financial assets, with the exception of interest and foreign exchange movements.
Any difference between the cost less principal repayments and amortisation, and the current fair value less any previous impairment loss, is transferred from equity to the surplus/(deficit).
In the following note disclosure, Departmental and Administered items are included together for presentation purposes only and these balances should not be compared.

139
Notes to and forming part of the financial statements D. Operating Resources
D1.1 Categories of financial instrumentsDepartmental Administered
30 June 30 June 30 June 30 June2017 2016 2017 2016
Note ref $'000 $'000 $'000 $'000Financial Assets
Loans and receivablesCash and cash equivalents H2
OPA balance H2 - - 936,797 1,058,038Special Account cash held by Finance F3.1 9,162 2,088 - -Operating cash balance 1,618 1,233 1,159 1,496Special Account cash held in OPA F3.1 739,018 643,912 - -
Trade receivables 74,299 69,969 721 1,390Investment funds - loans and receivables C2.2 - - 6,501,484 4,259,529State and Territory Government loans - - 139,752 145,959Accrued revenue 11,770 20,344 2,213 1,533
Total loans and receivables 835,867 737,546 7,582,126 5,467,945Held-to-maturity investments
Government securities - - 1,472 1,472Total held-to-maturity investments - - 1,472 1,472Available-for-sale financial assets
Commonwealth corporate entities - - 573,417 400,454Total available-for-sale financial assets - - 573,417 400,454Financial assets designated at FVPL
Investment funds - financial assets at FVPL C2.2 - - 16,190,822 12,494,544Total financial assets designated at FVPL - - 16,190,822 12,494,544
Total financial assets 835,867 737,546 24,347,837 18,364,415
Financial LiabilitiesFinancial liabilities measured at amortised cost
Trade creditors and accruals 49,771 53,029 12,418 15,585Investment funds - financial liabilities C2.2 - - 99,915 21,859Finance leases 6,475 10,102 - -
Total financial liabilities measured at amortised cost 56,246 63,131 112,333 37,444Financial liabilities designated at FVPL
Investment funds - derivative liabilities C2.2 - - 13,405 26,314Total financial liabilities designated at FVPL - - 13,405 26,314
Total financial liabilities 56,246 63,131 125,738 63,758

140
Notes to and forming part of the financial statements D. Operating Resources
Key judgements and estimates
Loans to state and territory governmentsConcessional loan balances receivable from states and territories are measured at amortised cost and no security is held for these. Repayments are based on a reducing balance method. The amortised cost differs from fair value which has been disclosed under Note D1.2.
Investments in Commonwealth corporate entities (CCEs)CCEs are 100% owned by the Commonwealth and managed by Finance on behalf of the Commonwealth. However, as the CCEs are not controlled by Finance the CCEs have been reported as investments and measured at fair value.
The following are details of all CCEs managed by Finance:
CSC is a trustee and administrator of Commonwealth superannuation schemes. The value of CSC has been measured using the net assets (NET) reported in its audited accounts and internal management accounts. A change in the net assets would result in an equal change in reported fair value. Further information about CSC is included in Note C3.2.
On 26 March 2017, the ASC Group was restructured, with the critical infrastructure assets consolidated intoAustralian Naval Infrastructure (ANI) Pty Ltd and 100 per cent of the shareholding of ANI transferred to the Commonwealth. The value of ANI has been measured using the net assets (NET) reported in the ANI 30 June 2017 balance sheet. A change in the net assets would result in an equal change in reported fair value.
ASC Pty Ltd (ASC) provides ongoing capability for the through life support of the Collins class submarine and shipbuilder for the Air Warfare Destroyers. ASC has been measured using reporting date value of the future cash flows of the company sourced from the 2017-22 Corporate Plan and an extended forecast model out to 2027 based on information in the ASC internal valuation. This forecasting also takes into account the separation of ANI. These cash flows have been discounted using the weighted average cost of capital (WACC). The WACC is calculated based on a number of inputs derived from either professional judgement or observable historical market data of comparable entities. The impact of WACC changes is included as part of Market Risk analysis in Note D2.1.

141
Notes to and forming part of the financial statements D. Operating Resources
D1.2 Fair value information by financial asset classThe following table sets out the fair value, valuation techniques and inputs used for Administered financial instruments. The techniques used to value financial instruments have not changed during the year.Financial instruments have been valued using inputs under the following fair value hierarchy:
• Level 1: quoted prices (unadjusted) in active markets for identical assets or liabilities that Finance can access at measurement date.
• Level 2: observable inputs that are derived from prices in active markets.• Level 3: inputs that are not observable and involve significant judgement.
Fair value measurements at the end of the reporting periodAdministered
30 June 30 June
LevelInputs
usedValuation technique
2017 2016$'000 $'000
Financial assetsState and Territory Government loans 2 N/A Income approach 231,180 244,520Investments in CCEs 3 NET Cost approach 318,616 38,181Investments in CCEs 3 WACC Income approach 254,801 362,273Investment funds - financial assets at FVPLInvestment funds- other investments 1 N/A Market approach 553,207 120,380Investment funds- interest bearing securities 2 PI1 Market approach 14,195,737 11,580,840Investment funds- derivative assets 2 N/A Market approach 117,607 94,869Investment funds- other investments 2 N/A Market approach 2,875 880Investment funds- other investments 3 NET Market approach 1,321,396 697,575Total financial assets 16,995,419 13,139,518
Financial liabilitiesInvestment funds - derivative liabilities 2 N/A Market approach 13,405 26,314Total financial liabilities 13,405 26,314 1Price Index (PI) values based on observable market data relating to prices, industry accepted pricing models and broker/dealer quotes
Movements of recurring level 3 financial assets
Administered30 June 30 June
2017 2016$'000 $'000
Opening balance of investments in CCEs 400,454 378,108Equity injections 95,000 -Total gains/(losses) recognised in other comprehensive income 77,963 22,346Closing balance of investments in CCEs 573,417 400,454
Opening balance of investment funds -financial assets at FVPL 697,575 -Purchase 656,697 693,734Sales (30,379) (6,219)Total gains/(losses) recognised in net cost of services (2,128) 10,060Transfers into level 3 (369) -Closing balance of investment funds - financial assets at FVPL 1,321,396 697,575

142
Notes to and forming part of the financial statements D. Operating Resources
D1.3 Net gains or losses on financial assetsDepartmental Administered
30 June 30 June 30 June 30 June2017 2016 2017 2016
Note ref $'000 $'000 $'000 $'000Loans and receivablesInterest revenue earned on:
OPA deposits - - 14,877 21,307Housing agreements - - 5,515 5,582State and Territory Government loans - - 9,707 10,245Other interest revenue 8 6 - -
Impairment of financial assets (4) (826) (13) (2)Net gains/(losses) on loans and receivables 4 (820) 30,086 37,132
Held-to-maturity investmentsInterest revenue earned on Government Securities - - 94 120Net gain/(losses) on held-to-maturity investments - - 94 120
Available-for-sale financial assetsDividends - - 19,700 16,100Investment funds - dividends C2.1 - - 13,228 6,147Gain/(loss) recognised in equity - - 77,963 22,347Gains from sale of financial assets
Sale proceeds - - 1 -Carrying value of asset sold - - - -Previous revaluation gains recognised in equity - - - -
Net gains/(losses) from available-for-sale financial assets - - 110,892 44,594
Financial assets designated as FVPLInvestment funds - foreign exchange losses C2.1 - - (6,925) (106,288)Investment funds - interest on term deposits C2.1 - - 91,566 98,946Investment funds - gains on financial investments C2.1 - - 439,306 383,368Net gains/(losses) on financial assets designated as FVPL - - 523,947 376,026Net gains/(losses) on financial assets 4 (820) 665,019 457,872
Policy and measurementForeign exchange gains/lossesAll foreign currency transactions during the period are brought to account using the exchange rate in effect at the date of the transaction. Foreign currency items at reporting date are translated at the exchange rate existing at reporting date. Exchange differences are recognised in the surplus/(deficit) in the period in which they arise.

143
Notes to and forming part of the financial statements D. Operating Resources
D2 : Managing financial risk
Finance is generally exposed to a low level of risk in relation to its financial instruments with the exception of the investment funds which are exposed to a moderate level of risk commensurate with the types of financial instruments held and the markets in which those instruments are traded. These risks are discussed as part of the investment funds (Note C2). Non-investment fund risks are discussed below.
D2.1 Market risk
Market risk refers to the risk that a change in market parameters will impact on assets held by Finance. Other than balances held by the investment funds, investments in CCEs and the OPA which are exposed to interest rate risk and foreign currency risk, Finance holds basic financial instruments that are not exposed to market risks. The following table discloses market risks in relation to the OPA and investments in CCEs. Disclosures in relation to the investment funds are included as part of Note C2.3.
Sensitivity analysis of interest rate risk exposure Effect on
2017 Risk variableChange in risk
variableSurplus/ (deficit) Equity
% $'000 $'000
Overnight cash deposits with the RBA Deposit rate+0.3% 3,521 --0.3% (3,521) -
Investments in CCEs Discount rate+0.3% - (2,313)-0.3% - 2,374
2016 % $'000 $'000
Overnight cash deposits with the RBA Deposit rate+0.3% 2,878 --0.3% (2,878) -
Investments in CCEs Discount rate+0.3% - (3,187)-0.3% - 3,235
D2.2 Liquidity risk
Liquidity risk is the risk that an entity will be unable to pay its debts when they fall due. As Finance is appropriation funded, the risk of Finance not meeting its obligations associated with financial liabilities is highly remote. Internal policies and procedures are also in place to ensure there are appropriate resources available to meet obligations. Finance's credit terms for goods and services are payment within 30 days. Disclosures in relation to the investment funds are included as part of Note C2.3.

144
Notes to and forming part of the financial statements D. Operating Resources
D2.3 Credit risk
Credit risk is the risk that entities owing debts to Finance will not pay those debts as and when they fall due. Finance is exposed to a moderate level of credit risk in relation to the investment fund's assets; all other financial assets are considered to be low risk. Trade and other receivables (excluding State and Territory Government loans) have standard 30 days terms. Additional disclosures for the investment funds credit risk are included in Note C2.3.
Gross exposure to all credit risk and credit quality of financial assetsDepartmental Administered
30 June 30 June 30 June 30 June2017 2016 2017 2016
Note ref $'000 $'000 $'000 $'000Financial assetsNot past due nor impaired
Cash and cash equivalents 749,798 647,233 937,956 1,059,534Trade receivables 47,265 68,417 182 815Investment funds - loans and receivables C2.2 - - 6,501,484 4,259,529Investment funds - financial assets at FVPL C2.2 - - 16,190,822 12,494,544State and Territory Government loans - - 139,752 145,959Accrued revenue 11,770 20,344 2,213 1,533Government securities - - 1,472 1,472
Total not past due nor impaired 808,833 735,994 23,773,881 17,963,386Past due or impaired
Trade receivables 27,034 1,552 539 575Total past due or impaired 27,034 1,552 539 575Total financial assets 835,867 737,546 23,774,420 17,963,961 Ageing of financial instrument assets that were past due or impaired
0 to 30 days 26,911 756 10 12431 to 60 days 18 456 8 3561 to 90 days 7 54 94 2290+ days 98 286 427 394
Total past due but not impaired 27,034 1,552 539 575
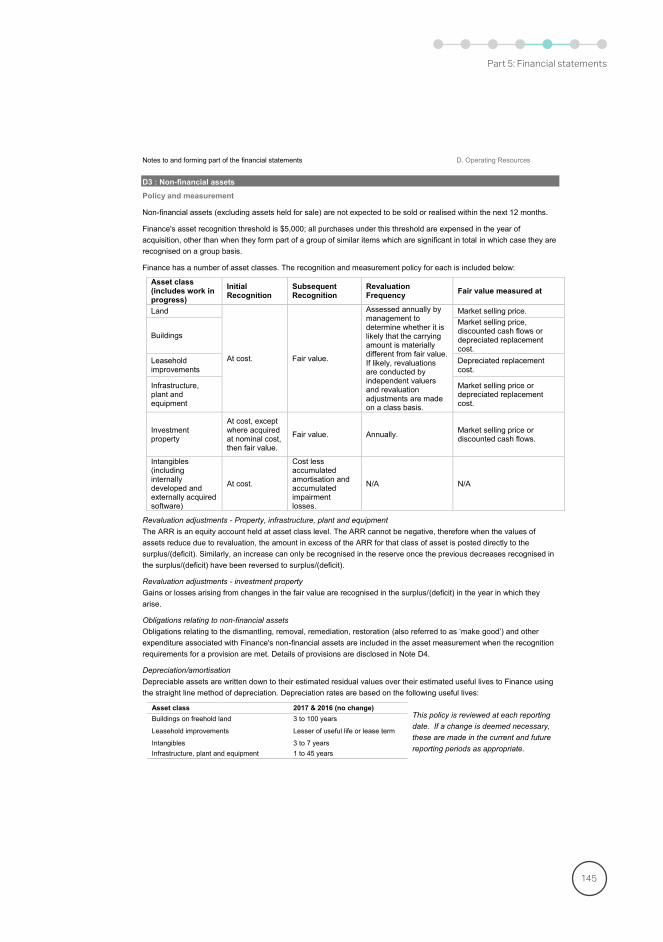
145
Notes to and forming part of the financial statements D. Operating Resources
D3 : Non-financial assetsPolicy and measurement
Non-financial assets (excluding assets held for sale) are not expected to be sold or realised within the next 12 months.
Finance's asset recognition threshold is $5,000; all purchases under this threshold are expensed in the year of acquisition, other than when they form part of a group of similar items which are significant in total in which case they are recognised on a group basis.
Finance has a number of asset classes. The recognition and measurement policy for each is included below:
Asset class(includes work in progress)
Initial Recognition
Subsequent Recognition
Revaluation Frequency Fair value measured at
Land
At cost. Fair value.
Assessed annually by management to determine whether it is likely that the carrying amount is materially different from fair value. If likely, revaluations are conducted by independent valuers and revaluation adjustments are made on a class basis.
Market selling price.
Buildings
Market selling price,discounted cash flows or depreciated replacement cost.
Leasehold improvements
Depreciated replacement cost.
Infrastructure, plant and equipment
Market selling price or depreciated replacement cost.
Investment property
At cost, except where acquired at nominal cost, then fair value.
Fair value. Annually. Market selling price or discounted cash flows.
Intangibles (including internally developed and externally acquired software)
At cost.
Cost less accumulated amortisation and accumulated impairment losses.
N/A N/A
Revaluation adjustments - Property, infrastructure, plant and equipmentThe ARR is an equity account held at asset class level. The ARR cannot be negative, therefore when the values of assets reduce due to revaluation, the amount in excess of the ARR for that class of asset is posted directly to the surplus/(deficit). Similarly, an increase can only be recognised in the reserve once the previous decreases recognised in the surplus/(deficit) have been reversed to surplus/(deficit).
Revaluation adjustments - investment propertyGains or losses arising from changes in the fair value are recognised in the surplus/(deficit) in the year in which they arise.
Obligations relating to non-financial assetsObligations relating to the dismantling, removal, remediation, restoration (also referred to as ‘make good’) and other expenditure associated with Finance's non-financial assets are included in the asset measurement when the recognition requirements for a provision are met. Details of provisions are disclosed in Note D4.
Depreciation/amortisationDepreciable assets are written down to their estimated residual values over their estimated useful lives to Finance using the straight line method of depreciation. Depreciation rates are based on the following useful lives:
Asset class 2017 & 2016 (no change)This policy is reviewed at each reporting date. If a change is deemed necessary, these are made in the current and future reporting periods as appropriate.
Buildings on freehold land 3 to 100 years
Leasehold improvements Lesser of useful life or lease term
Intangibles 3 to 7 yearsInfrastructure, plant and equipment 1 to 45 years

146
Notes to and forming part of the financial statements D. Operating Resources
Assets held for sale Assets held for sale includes properties that have been fully prepared for sale, are being actively marketed at fair value and are likely to settle within the next 12 months. Also included are properties that are currently under offer or contract (contract issued or exchanged but not yet settled) as at the end of the reporting period.
D3.1 Property, infrastructure, plant and equipment and intangiblesDepartmental
Land Buildings
Leasehold improve-
ments
Invest-ment
property
Plant and equip-
ment
Intang-ible
assets Total$’000 $’000 $’000 $’000 $’000 $’000 $’000
As at 1 July 2016Gross book value 413,298 637,686 29,159 626,437 40,574 123,160 1,870,314Accumulated depreciation, amortisation and impairment - - - - (11,901) (51,341) (63,242)Opening balance as at 1 July 2016 413,298 637,686 29,159 626,437 28,673 71,819 1,807,072Additions
Purchase or internally developed - 88,949 620 30,629 8,126 18,830 147,154Transfers from agencies - - 128 - 43 11,818 11,989
Items recognised in equityRevaluations 21,280 - (12) - 611 - 21,879
Items recognised in NCOSRevaluations - 29,343 - 5,227 - - 34,570Depreciation/amortisation expense - (11,681) (1,616) - (8,047) (8,080) (29,424)Transfers to assets held for sale (3,090) - - - - - (3,090)
DisposalsTransfers to agencies/restructuring - (4,086) - - - - (4,086)Write-offs (2,332) - - - (78) - (2,410)Reclassification (36,800) (151,200) (1,539) 188,000 1,539 - -Other disposals (4,715) - - (2,590) - - (7,305)
Closing balance as at 30 June 2017 387,641 589,011 26,740 847,703 30,867 94,387 1,976,349Total as at 30 June 2017 represented byGross book value
Fair value (gross) 387,641 499,195 28,300 847,703 30,623 - 1,793,462Internally developed software - - - - - 58,674 58,674Purchased software - - - - - 13,048 13,048Work in progress - at fair value - 89,816 36 - 244 - 90,096Work in progress - at cost - - - - - 76,514 76,514
Accumulated depreciation, amortisation and impairment - - (1,596) - - (53,849) (55,445)Total as at 30 June 2017 387,641 589,011 26,740 847,703 30,867 94,387 1,976,349
Further information
Domestic property portfolioFinance is responsible for the management of the Australian Government´s domestic non-defence property portfolio and the construction and delivery of domestic non-defence major capital works projects as directed by the government.
The government’s non-defence domestic property portfolio currently has approximately 100 Commonwealth-owned properties across Australia. These include office buildings, law courts, special purpose facilities, heritage assets, vacantland and contaminated sites that have been classified as either investment properties, land, buildings, or assets held for sale.

147
Notes to and forming part of the financial statements D. Operating Resources
Other assetsOther assets held by Finance include leasehold improvements, office equipment and information technology assetsrequired to support the delivery of Finance outcomes and finance lease assets in relation to the electronic work environment.
AdministeredLeasehold
improve-ments Infrastructure
Plant and equipment
Intangible assets Total
$’000 $’000 $’000 $’000 $’000As at 1 July 2016Gross book value 52,628 67,374 17,468 3,182 140,652Accumulated depreciation, amortisation and impairment (34,168) - (9,213) (1,665) (45,046)Opening balance as at 1 July 2016 18,460 67,374 8,255 1,517 95,606 Additions
By purchase 5,756 1,352 1,405 57 8,570Items recognised in equity
Revaluations 8,672 3,341 (1,880) - 10,133Items recognised in the surplus/(deficit)
Depreciation/amortisation expense (6,575) (2,070) (2,817) (503) (11,965)Disposals
Write-offs (1,424) - (791) - (2,215)Other disposals - - (15) - (15)
Closing balance as at 30 June 2017 24,889 69,997 4,157 1,071 100,114 Total as at 30 June 2017 represented byGross Book Value
Fair value (gross) 25,011 69,997 2,271 - 97,279Internally developed software - - - 165 165Purchased software - - - 72 72Work in progress - at fair value - - 1,886 - 1,886Work in progress - at cost - - - 3,002 3,002
Accumulated depreciation, amortisation and impairment (122) - - (2,168) (2,290)Total as at 30 June 2017 24,889 69,997 4,157 1,071 100,114
Further information
Administered non-financial assets include the Intra Government Communication Network (ICON), leasehold improvements and IT assets for electoral and state offices, and other information technology assets to support Administered outcomes.

148
Notes to and forming part of the financial statements D. Operating Resources
D3.2 Fair value information by non-financial asset class
Key judgements and estimates
Valuation of land, buildings and investment propertiesIndependent valuations are obtained annually as at 30 June for land, buildings and investment properties. Thesevaluations include calculations of estimated market cash flows which are adjusted to take into account physical, economic and external factors relevant to the asset under consideration. In relation to investment properties, allowances have been factored in for average vacancy periods and costs of establishing a new tenant, as leases become due for renewal and properties become vacant.
Valuation of leasehold improvements, plant and equipmentThe estimated cost to replace the asset has been calculated and then adjusted to take into account obsolescence and physical deterioration (accumulated depreciation). The obsolescence has been determined based on professional judgement regarding physical, economic and external factors relevant to the asset under consideration. Leasehold improvements for One Canberra Avenue were valued on acquisition in 2016. An independent valuation in relation to all other leasehold improvements and plant and equipment was undertaken as at 30 June 2017.
Valuation of infrastructureFinance manages a secure fibre network within the Australian Capital Territory known as the ICON. Replacement cost has been established based on contemporary technology and construction approaches. Significant judgement concerning the nature of the physical environment has been made to establish the adopted replacement cost. An independent valuation was undertaken as at 30 June 2017.
Highest and best use
Within the property portfolio, there are a small number of properties where the highest and best use differs from the current use, being:
7 vacant blocks which have a highest and best use of 'office buildings'; 1 vacant block which has a highest and best use of 'rural residential'; 1 property with an unusable building which has a highest and best use of 'community use'; and 1 property with an unusable building which has a highest and best use of ‘conservation’.
While the fair values for these properties has been measured in the financial statements using the highest and best use for each, they are not being utilised at their highest and best use as Finance is not in the business of development.
The following tables set out (by asset class) the valuation technique, inputs used, and the level of the fair value hierarchy per AASB 13 Fair Value Measurement.
Finance only holds non-financial assets that fall into the following two categories (or levels) of the fair value hierarchy:
Level 2: observable inputs (other than quoted prices in active markets) are used to calculate the fair value of the asset; and
Level 3: inputs used to calculate the fair value are not observable.

149
Notes to and forming part of the financial statements D. Operating Resources
Departmental
Technique / inputs used / level Land Buildings
Leasehold improve-
ments
Invest-ment
property
Plant and equip-
ment
Assets held for
sale Total$’000 $’000 $’000 $’000 $’000 $’000 $’000
Market Approach / AMT / 2 174,997 6,105 - 63,590 13,490 4,317 262,499Cost Approach / RCN; CEB / 3 - - 26,740 - 17,377 - 44,117Cost Approach / RCN / 2 - 284,706 - - - - 284,706Income Approach / AMT / 2 212,644 298,200 - 784,113 - - 1,294,957
Total assets at fair value 30 June 2017 387,641 589,011 26,740 847,703 30,867 4,317 1,886,279
Market Approach / AMT / 2 183,144 6,257 - 63,737 13,069 12,137 278,344Cost Approach / RCN; CEB / 3 - - 29,159 - 15,604 - 44,763Cost Approach / RCN / 2 - 220,429 - - - - 220,429Income Approach / AMT / 2 230,154 411,000 - 562,700 - - 1,203,854
Total assets at fair value 30 June 2016 413,298 637,686 29,159 626,437 28,673 12,137 1,747,390
Administered
Technique / inputs used / levelLeasehold
improvements InfrastructurePlant and
equipment Total$’000 $’000 $’000 $’000
Cost Approach / RCN;CEB / 3 24,889 69,997 - 94,886Market Approach / AMT / 2 - - 2,575 2,575Cost Approach / AMT;CEB / 3 - - 1,582 1,582
Total assets at fair value 30 June 2017 24,889 69,997 4,157 99,043 Cost Approach / RCN;CEB / 3 18,460 67,374 - 85,834Market Approach / AMT / 2 - - 6,598 6,598Cost Approach / AMT;CEB / 3 - - 1,657 1,657
Total assets at fair value 30 June 2016 18,460 67,374 8,255 94,089
Inputs used
Replacement Cost of New Assets (RCN): the amount a market participant would pay to acquire or construct a new substitute asset of comparable utility.
Consumed Economic Benefits (CEB): obsolescence of assets, physical deterioration, functional or technical obsolescence and conditions of the economic environment specific to the asset.
Adjusted Market Transactions (AMT): market transactions of comparable assets, adjusted to reflect differences in price sensitive characteristics.
Recurring level 3 fair value measurements reconciliation
The recurring level 3 fair value measurements reconciliation is not materially different to the property, infrastructure, plant and equipment and intangibles movement table for both Departmental and Administered, refer to Note D3.1.

150
Notes to and forming part of the financial statements D. Operating Resources
D4 : Other provisionsPolicy and measurement
Finance recognises a provision when it has a legal or constructive obligation to make a payment, it is probable that payment will be made and the amount to be paid can be reliably measured.
In the following note disclosure, Departmental and Administered items are included together for presentation purposes only and these balances should not be compared.
Departmental Administered30 June 30 June 30 June 30 June
2017 2016 2017 2016$'000 $'000 $'000 $'000
PropertyExcess lease space 203 682 1,513 154Provision for remediation costs 8,612 24,092 5,509 4,828
Other Act of Grace - - 9,825 11,533Same Sex Relationships Act - - 1,467 1,658
Total other provisions 8,815 24,774 18,314 18,173
Movements of other provisionsOpening balance 24,774 36,638 18,173 18,014
Additional provisions made 4,291 385 3,169 1,419Amounts used (20,250) (10,577) (2,832) (259)Amounts reversed - (1,672) (196) (1,001)
Closing balance 8,815 24,774 18,314 18,173
Further information
RemediationFinance currently has agreements for the leasing of premises which have provisions requiring Finance to restore the premises to their original condition at the conclusion of the lease.
The domestic property portfolio managed by Finance has a small number of properties with potential remediation issues that are currently the subject of further investigation. A provision has been raised in relation to remediation of two properties.
Excess lease spaceFinance has reviewed the leasing of all premises for surplus space and has recognised a provision in relation to sevenAdministered premises and one Departmental premise. Finance has made a provision to reflect the present value of this surplus space.
Act of GraceThe Act of Grace mechanism is a discretionary power found in section 65 of the PGPA Act, which allows payments to be made if it is appropriate and a decision maker considers there are special circumstances. In most cases these relate to pension payments to spouses of former members of the Commonwealth defined benefit superannuation schemes.
Same Sex Relationships ActThe Same Sex Relationships (Equal Treatment in Commonwealth Laws – General Reform) Act 2008 removes discrimination against same-sex couples and their dependent children from a wide range of Commonwealth laws and programs. These relate to pension payments to partners of former members of the Commonwealth defined benefitsuperannuation schemes.

151
Notes to and forming part of the financial statements E. Our People
E. Our PeopleThis section describes the employment and post-employment benefits provided to Finance employees engaged under the Department of Finance Enterprise Agreement 2015-2018 and Public Service Act 1999.
As part of its Administered operations, Finance facilitates payment of salary and related benefits to staff employed by current and former Members of Parliament under the Members of Parliament (Staff) Act 1984 (MOP(S) Act) as well as payment of post-employment benefits for former Parliamentarians and Prime Ministers under relevant legislation.
Superannuation payments made to former Commonwealth employees which are also administered by Finance on behalf of the Government are not included in the tables below. These are disclosed in Note C3.
In the following note disclosures, Departmental and Administered items are included together for presentation purposes only and these balances should not be compared.
E1 : Employee expensesPolicy and measurement
Personal leavePersonal leave is expensed in the year that it is taken.
Superannuation expenseFinance’s staff are members of the CSS, PSS, PSSap, or other non-government superannuation funds. The CSS and PSS are defined benefit schemes. The PSSap is a defined contribution scheme. Finance makes employer contributions to employees' defined benefit schemes at rates determined by an actuary to be sufficient to meet the current cost to the Government. Finance accounts for these amounts as if they were contributions to defined contribution plans.
Departmental Administered30 June 30 June 30 June 30 June
2017 2016 2017 2016$'000 $'000 $'000 $'000
Wages and salaries 127,734 122,179 187,882 185,062Superannuation expense
Defined contribution plans 13,991 14,136 30,247 29,784Defined benefit plans 10,714 10,297 7,562 6,870
Leave and other entitlements 12,538 20,422 17,870 14,805Increase (decrease) in post-employment benefits liability1 - - (75,596) 62,878Separations and redundancies 2,952 2,377 10,296 5,995Other employee expenses 689 947 16,838 17,031Total employee expenses 168,618 170,358 195,099 322,425
1 The Royal Assent of the Parliamentary Entitlements Legislation Amendment Act 2017 on 22 February 2017 included changes to parliamentary retirement travel resulting in a significant reduction to the provision for parliamentary retirement travel (formerly Life Gold Pass). The decrease in the current year is also caused by the reduction in the provision for former Prime Ministers entitlements following actuarial movements.
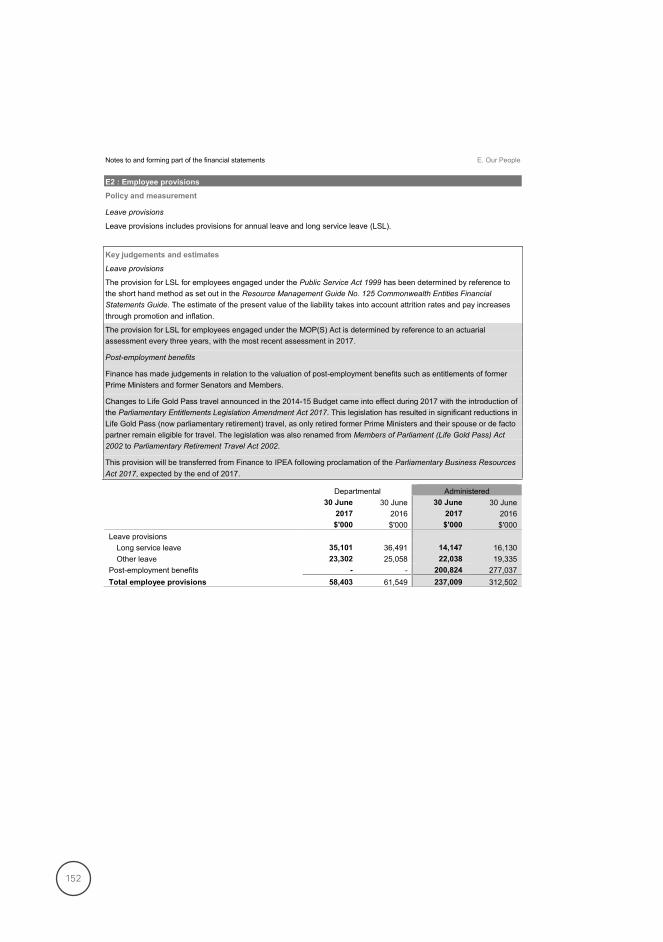
152
Notes to and forming part of the financial statements E. Our People
E2 : Employee provisionsPolicy and measurement
Leave provisions
Leave provisions includes provisions for annual leave and long service leave (LSL).
Key judgements and estimatesLeave provisions
The provision for LSL for employees engaged under the Public Service Act 1999 has been determined by reference to the short hand method as set out in the Resource Management Guide No. 125 Commonwealth Entities Financial Statements Guide. The estimate of the present value of the liability takes into account attrition rates and pay increases through promotion and inflation.
The provision for LSL for employees engaged under the MOP(S) Act is determined by reference to an actuarial assessment every three years, with the most recent assessment in 2017.
Post-employment benefits
Finance has made judgements in relation to the valuation of post-employment benefits such as entitlements of former Prime Ministers and former Senators and Members.
Changes to Life Gold Pass travel announced in the 2014-15 Budget came into effect during 2017 with the introduction ofthe Parliamentary Entitlements Legislation Amendment Act 2017. This legislation has resulted in significant reductions in Life Gold Pass (now parliamentary retirement) travel, as only retired former Prime Ministers and their spouse or de factopartner remain eligible for travel. The legislation was also renamed from Members of Parliament (Life Gold Pass) Act 2002 to Parliamentary Retirement Travel Act 2002.
This provision will be transferred from Finance to IPEA following proclamation of the Parliamentary Business Resources Act 2017, expected by the end of 2017.
Departmental Administered30 June 30 June 30 June 30 June
2017 2016 2017 2016$'000 $'000 $'000 $'000
Leave provisionsLong service leave 35,101 36,491 14,147 16,130Other leave 23,302 25,058 22,038 19,335
Post-employment benefits - - 200,824 277,037Total employee provisions 58,403 61,549 237,009 312,502

153
Notes to and forming part of the financial statements E. Our People
E3 : Key management personnel remuneration
Key management personnel (KMP) are those persons having authority and responsibility for planning, directing and controlling the activities of Finance. Finance has determined the KMP to be the Finance Minister, the Special Minister of State and the members of the Finance Executive Board which includes the Secretary, Deputy Secretaries, Chief Financial Officer and the First Assistant Secretaries of the Corporate Services and Information Technology and Workplace divisions. KMP remuneration is reported in the table below.
Departmental30 June
2017$
Short-term employee benefitsSalary 2,392,122Executive vehicle scheme 197,523Other benefits 7,520
Total short-term employee benefits 2,597,165Post-employment benefits
Superannuation 427,551Total post-employment benefits 427,551Other long-term benefits
Annual leave 266,823Long service leave 225,281
Total other long-term benefits 492,104Total termination benefits -Total key management personnel remuneration1 3,516,820
Number of key management personnel included in the table above2 10
1 The above KMP remuneration excludes the remuneration and other benefits of the Finance Minister and the Special Minister of State whose remuneration and other benefits are set by the Remuneration Tribunal and are not paid by Finance.2 This number includes staff who have been engaged by Finance for part of the year and therefore more than oneindividual may have filled a single position over the course of the year.
E4 : Related parties
Finance is an Australian Government controlled entity. Related parties to Finance are KMP including the Minister for Finance, the Special Minister of State, the Finance Executive Board and other Australian Government entities. KMP remuneration for members of the Executive Board is disclosed in Note E3.
Transactions with related parties
Finance undertakes a number of functions on behalf of the Australian government, as detailed in the financial statements. In performing these functions, Finance transacts with all other Australian Government controlled entities fornormal day-to-day business operations provided under normal terms and conditions or on a cost recovery basis. This includes the payment of workers compensation and insurance premiums and collection of rental income. They are not considered significant individually to warrant separate disclosure as related party transactions.

154
Notes to and forming part of the financial statements F. Funding
F. FundingAmounts appropriated for Departmental appropriations for the year (adjusted for any formal additions and reductions) are recognised as revenue from Government when Finance gains control of the appropriation. Appropriations receivable is recognised at the nominal amounts.
Administered appropriations are not recognised as revenue in the Schedule of Comprehensive Income. They areincluded in the Administered Reconciliation Schedule once they are recognised which is the date the amounts are drawn down to Finance’s bank account for payment against the appropriation for annual and special appropriations or the date stated in the determination for other Administered amounts.In the following note disclosure, Departmental and Administered items are included together for presentation purposes only and these balances should not be compared.
F1 : Annual appropriationsF1.1 Annual appropriations ('recoverable GST exclusive')
Departmental Administered30 June 30 June 30 June 30 June
2017 2016 2017 2016$'000 $'000 $'000 $'000
Ordinary annual servicesAnnual Appropriation
Ordinary annual services 283,961 271,152 304,384 287,148Capital budget - - 4,919 4,832Section 74 receipts of PGPA Act 56,305 58,956 2,952 312Section 75 transfers of PGPA Act1 614 (837) (9,221) -
Total 340,880 329,271 303,034 292,292Appropriation applied2 (351,978) (319,077) (298,468) (296,821)Variance (11,098) 10,194 4,566 (4,529)
Other servicesAnnual appropriation
Equity injection 69,808 157,310 - -Assets and liabilities - - 1,890 1,759
Total 69,808 157,310 1,890 1,759Appropriation applied2 (127,968) (59,374) (1,779) (1,149)Variance3 (58,160) 97,936 111 610
1 Amount of $2.4 million was transferred to the DTA under a section 75 determination following the Administrative Arrangements Order of 27 October 2016. Amount of $2.2 million was transferred to IPEA under a section 75 determination following its establishment commencing 3 April 2017. Amount of $5.2 million was transferred from Departments of Education and Employment for the Shared Services Centre function commencing at Finance on 1 December 2016. For further information, refer to Note C4.
1 Amount of $9.2 million was transferred to IPEA under a section 75 determination following its establishment commencing 3 April 2017.2 Appropriation applied includes cash payments made from current and prior year appropriations.
3 The negative variance is due primarily to prior year appropriations being spent in the current year.
The following entities spent money from the CRF on behalf of Finance: CSC, Department of Defence and theDepartment of Parliamentary Services (DPS). The money spent has been included in the table above.
Departmental and Administered capital budgets are appropriated through Appropriation Acts (No.1, 3, 5). They form part of ordinary annual services, and are not separately identified in the Appropriation Acts.

155
Notes to and forming part of the financial statements F. Funding
F1.2 Unspent annual appropriations ('recoverable GST exclusive')Departmental Administered
30 June 30 June 30 June 30 June2017 2016 2017 2016$'000 $'000 $'000 $'000
Appropriation Act (No. 2) 2012-13 90 90 847 847Appropriation Act (No. 2) 2013-141 1,246 1,246 8,153 8,153Appropriation Act (No. 2) 2014-15 - 4,900 16 451Appropriation Act (No. 2) 2015-16 7,260 107,508 218 1,562Supply Act (No. 2) 2016-17 20,207 n/a 697 n/aAppropriation Act (No. 2) 2016-17 40,969 n/a 975 n/aAppropriation Act (No. 4) 2012-134 - - 5,000 5,000Appropriation Act (No. 4) 2014-15 - 14,189 - -Appropriation Act (No. 4) 2015-16 2,226 2,226 153 153Appropriation Act (No. 4) 2016-17 n/a n/a 218 n/aAppropriation Act (No. 1) 2013-142,5 7,064 7,064 480 480Appropriation Act (No. 1) 2014-156 - 85,711 174 174Appropriation Act (No. 1) 2015-166 3,168 17,291 105 35,579Appropriation Act (No. 1) 2016-173 100,006 n/a 24,653 n/aAppropriation Act (No. 3) 2013-14 - 4,345 - -Appropriation Act (No. 3) 2014-156 - - 2,720 2,720Appropriation Act (No. 3) 2015-166 - 2,186 1,847 2,125Appropriation Act (No. 3) 2016-17 2,955 n/a 11,194 n/aAppropriation Act (No. 1) 2014-15 - Capital6 - 8,810 3,166 3,166Appropriation Act (No. 1) 2015-16 - Capital6 - - 3,189 3,189Supply Act (No.1) 2016-17 - Capital 474 n/a 1,602 n/aAppropriation Act (No.1) 2016-17 - Capital 474 n/a 2,869 n/aTotal unspent appropriations 186,139 255,566 68,276 63,599
Reconciliation to appropriations receivableThe above unspent appropriations balance includes quarantined amounts and amounts reported elsewhere in the financial statements which are not considered to be available to Finance. In order to reconcile to the closing appropriations receivable balance, unspent amounts considered unavailable to Finance have been removed below:
Departmental30 June 30 June
2017 2016$'000 $'000
Total unspent appropriations 186,139 255,566Adjustments:Moorebank reallocation and terminated superannuation reforms measure (405) (405)Strategic Reviews hand back (802) (802)Cash at bank - 30 June (1,560) (1,597)Expected GST refund outstanding at year end (1,588) (1,718)Recorded against special accounts receivable in ledger (3,675) -Recorded against capital receivable for special account in ledger (58,891) (73,112)Transfer of function to PM&C (withheld under s. 51 of the PGPA Act) (6,262) (6,262)Supplementation 40,000 1,000Closing appropriations receivable balance 152,956 172,670
Other quarantined amounts and adjustmentsThese balances meet the definition of a receivable and therefore do not need to be adjusted out of unspent appropriations to reconcile to appropriations receivable.
1 Balance includes quarantines for $0.4 million for Moorebank Unit Relocation and a terminated superannuation reforms measure.2 Balance includes a quarantine for $0.8 million for Strategic Reviews hand back.3 Balance includes cash at bank as at 30 June 2017 of $1.1 million plus expected GST refund of $1.6 million(2016: cash at bank $1.1 million, GST refund $1.7 million).4 Balance includes a quarantine for $5.0 million for Moorebank Unit Relocation.

156
Notes to and forming part of the financial statements F. Funding
5 Balance includes a quarantine for $0.5 million as a result of a net appropriation decrease at additional estimates.6 The balances remaining in these appropriations have been withheld under s.51 of the PGPA Act as they are 2014-15 and 2015-16 Administered appropriations that are no longer required (the former s.11 process).
Note: Balances unspent against 2012-13 and 2013-14 appropriations are scheduled for repeal in 2017-18. Appropriations from 2014-15 onwards are part of the revised repeal process where appropriations will automatically repeal after 3 years (on 1 July each year).
F2 : Special appropriationsF2.1 Special appropriations ('recoverable GST exclusive')
Appropriation Applied30 June 30 June
2017 2016$'000 $'000
AdministeredMedibank Private Sale Act 2006 (474) (152)Superannuation Act 1922 (81,985) (90,133)Superannuation Act 1976 (4,291,400) (4,210,930)Superannuation Act 1990 (1,936,684) (1,697,599)Governance of Australian Government Superannuation Schemes Act 2011 (1,208) (634)Parliamentary Contributory Superannuation Act 1948 (42,665) (44,038)Parliamentary Superannuation Act 2004 (6,932) (6,039)Members of Parliament (Life Gold Pass) Act 2002 (564) (788)Parliamentary Entitlements Act 1990 (162,243) (170,960)Governor-General Act 1974 (1,561) (1,503)Judges' Pensions Act 1968 (47,101) (43,602)Federal Circuit Court of Australia Act 1999 (616) (527)Public Governance, Performance and Accountability Act 2013 (PGPA Act) (109) (894)Same-Sex Relationships (Equal Treatment in Commonwealth Laws – Superannuation) Act 2008 (60) (59)Commonwealth of Australia Constitution Act s.66 (Ministers of State Act 1952 s.5) (5,016) (4,900)
Total special appropriations applied1 (6,578,618) (6,272,758)
1The difference between ‘total special appropriations applied’ above and the special appropriations reported in the Administered Reconciliation Schedule represents superannuation payments made that are yet to be reimbursed by entities who adopt a reimbursement basis to the Australian Government.
Superannuation Act 1976 and Superannuation Act 1990: Payments include amounts that are not an additional cost to the Australian Government and are funded through a special capital appropriation from a return of superannuation benefit funded component associated with retirements of scheme members and reimbursements from entities who adopt a reimbursement basis.
Governor-General Act 1974: Administered by Finance and PM&C.
Same-Sex Relationships (Equal Treatment in Commonwealth Laws – Superannuation) Act 2008 and Federal Circuit Court of Australia Act 1999: Administered by Finance and the Attorney General’s Department.
Commonwealth of Australia Constitution Act s.66 (Minister of State Act 1952 s.5): For the 2016-17 reporting period this appropriation was limited to $5.5 million and the unspent balance of $0.5 million has lapsed.
CSC drew from the special appropriation authorised by the Superannuation Act 1922, the Superannuation Act 1976, the Superannuation Act 1990, the Governance of Australian Government Superannuation Schemes Act 2011, PGPA Act,s.77 and the Same-Sex Relationships (Equal Treatment in Commonwealth Laws - Superannuation) Act 2008. The money spent has been included in the table above.
The Department of the House of Representatives and the Department of the Senate drew from the special appropriation authorised by the Parliamentary Superannuation Act 2004 and Commonwealth of Australia Constitution Act s.66(Ministers of State Act 1952) salaries. The money spent has been included in the table above.
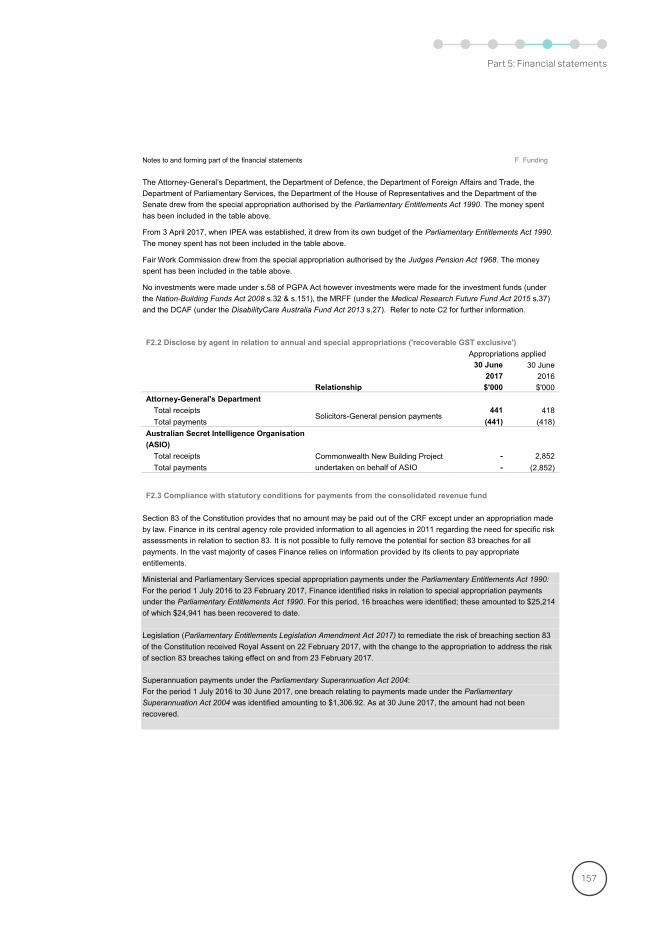
157
Notes to and forming part of the financial statements F. Funding
The Attorney-General’s Department, the Department of Defence, the Department of Foreign Affairs and Trade, the Department of Parliamentary Services, the Department of the House of Representatives and the Department of the Senate drew from the special appropriation authorised by the Parliamentary Entitlements Act 1990. The money spent has been included in the table above.
From 3 April 2017, when IPEA was established, it drew from its own budget of the Parliamentary Entitlements Act 1990.The money spent has not been included in the table above.
Fair Work Commission drew from the special appropriation authorised by the Judges Pension Act 1968. The money spent has been included in the table above.
No investments were made under s.58 of PGPA Act however investments were made for the investment funds (under the Nation-Building Funds Act 2008 s.32 & s.151), the MRFF (under the Medical Research Future Fund Act 2015 s.37)and the DCAF (under the DisabilityCare Australia Fund Act 2013 s.27). Refer to note C2 for further information.
F2.2 Disclose by agent in relation to annual and special appropriations ('recoverable GST exclusive')Appropriations applied
30 June 30 June2017 2016
Relationship $'000 $'000Attorney-General's Department
Total receiptsSolicitors-General pension payments
441 418Total payments (441) (418)
Australian Secret Intelligence Organisation (ASIO)
Total receipts Commonwealth New Building Project undertaken on behalf of ASIO
- 2,852Total payments - (2,852)
F2.3 Compliance with statutory conditions for payments from the consolidated revenue fund
Section 83 of the Constitution provides that no amount may be paid out of the CRF except under an appropriation made by law. Finance in its central agency role provided information to all agencies in 2011 regarding the need for specific risk assessments in relation to section 83. It is not possible to fully remove the potential for section 83 breaches for all payments. In the vast majority of cases Finance relies on information provided by its clients to pay appropriate entitlements.
Ministerial and Parliamentary Services special appropriation payments under the Parliamentary Entitlements Act 1990:For the period 1 July 2016 to 23 February 2017, Finance identified risks in relation to special appropriation payments under the Parliamentary Entitlements Act 1990. For this period, 16 breaches were identified; these amounted to $25,214of which $24,941 has been recovered to date.
Legislation (Parliamentary Entitlements Legislation Amendment Act 2017) to remediate the risk of breaching section 83 of the Constitution received Royal Assent on 22 February 2017, with the change to the appropriation to address the risk of section 83 breaches taking effect on and from 23 February 2017.
Superannuation payments under the Parliamentary Superannuation Act 2004:For the period 1 July 2016 to 30 June 2017, one breach relating to payments made under the Parliamentary Superannuation Act 2004 was identified amounting to $1,306.92. As at 30 June 2017, the amount had not been recovered.
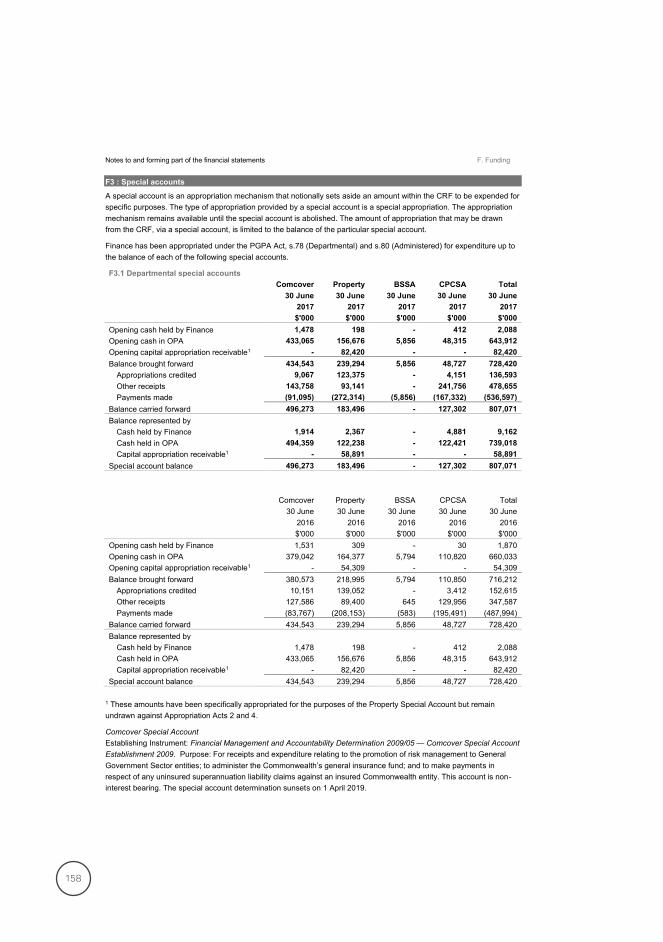
158
Notes to and forming part of the financial statements F. Funding
F3 : Special accounts
A special account is an appropriation mechanism that notionally sets aside an amount within the CRF to be expended for specific purposes. The type of appropriation provided by a special account is a special appropriation. The appropriation mechanism remains available until the special account is abolished. The amount of appropriation that may be drawn from the CRF, via a special account, is limited to the balance of the particular special account.
Finance has been appropriated under the PGPA Act, s.78 (Departmental) and s.80 (Administered) for expenditure up to the balance of each of the following special accounts.
F3.1 Departmental special accountsComcover Property BSSA CPCSA Total
30 June 30 June 30 June 30 June 30 June2017 2017 2017 2017 2017$'000 $'000 $'000 $'000 $'000
Opening cash held by Finance 1,478 198 - 412 2,088Opening cash in OPA 433,065 156,676 5,856 48,315 643,912Opening capital appropriation receivable1 - 82,420 - - 82,420Balance brought forward 434,543 239,294 5,856 48,727 728,420
Appropriations credited 9,067 123,375 - 4,151 136,593Other receipts 143,758 93,141 - 241,756 478,655Payments made (91,095) (272,314) (5,856) (167,332) (536,597)
Balance carried forward 496,273 183,496 - 127,302 807,071Balance represented by
Cash held by Finance 1,914 2,367 - 4,881 9,162Cash held in OPA 494,359 122,238 - 122,421 739,018Capital appropriation receivable1 - 58,891 - - 58,891
Special account balance 496,273 183,496 - 127,302 807,071
Comcover Property BSSA CPCSA Total30 June 30 June 30 June 30 June 30 June
2016 2016 2016 2016 2016$'000 $'000 $'000 $'000 $'000
Opening cash held by Finance 1,531 309 - 30 1,870Opening cash in OPA 379,042 164,377 5,794 110,820 660,033Opening capital appropriation receivable1 - 54,309 - - 54,309Balance brought forward 380,573 218,995 5,794 110,850 716,212
Appropriations credited 10,151 139,052 - 3,412 152,615Other receipts 127,586 89,400 645 129,956 347,587Payments made (83,767) (208,153) (583) (195,491) (487,994)
Balance carried forward 434,543 239,294 5,856 48,727 728,420Balance represented by
Cash held by Finance 1,478 198 - 412 2,088Cash held in OPA 433,065 156,676 5,856 48,315 643,912Capital appropriation receivable1 - 82,420 - - 82,420
Special account balance 434,543 239,294 5,856 48,727 728,420
1 These amounts have been specifically appropriated for the purposes of the Property Special Account but remain undrawn against Appropriation Acts 2 and 4.
Comcover Special AccountEstablishing Instrument: Financial Management and Accountability Determination 2009/05 — Comcover Special Account Establishment 2009. Purpose: For receipts and expenditure relating to the promotion of risk management to General Government Sector entities; to administer the Commonwealth’s general insurance fund; and to make payments in respect of any uninsured superannuation liability claims against an insured Commonwealth entity. This account is non-interest bearing. The special account determination sunsets on 1 April 2019.

159
Notes to and forming part of the financial statements F. Funding
Property Special Account 2014Establishing Instrument: PGPA Act (Property Special Account 2014 – Establishment) Determination 04. Purpose: Facilitates the management of the Commonwealth's non-Defence domestic property portfolio. This account is non-interest bearing. The special account determination sunsets on 1 April 2025.
Business Services Special Account (BSSA)Establishing Instrument: Financial Management and Accountability Determination 2006/64 — Business Services Special Account Establishment 2006. Purpose: For expenditure relating to sentencing and disposing of records associated with the former Department of Administrative Services (DAS), managing and settling any personal injury and other legal claims arising from activities associated with the former DAS, and to conclude any other activity arising from the former DAS. This account is non-interest bearing. The special account ceased on 1 April 2017.
Coordinated Procurement Contracting Special Account (CPCSA)Establishing Instrument: Financial Management and Accountability Determination 2008/08 — Coordinated Procurement Contracting Special Account Establishment 2008. Purpose: For expenditure relating to the Whole of Australian Government (WoAG) contract for providing fleet management and leasing services, centralised government advertising activities, and other co-coordinated procurement contracts for the benefit of government entities. The account is non-interest bearing. The special account determination sunsets on 1 October 2018.
F3.2 Administered special accountsBAF EIF HHF DCAF MRFF Total
30 June 30 June 30 June 30 June 30 June 30 June2017 2017 2017 2017 2017 2017$'000 $'000 $'000 $'000 $'000 $'000
Balance brought forward - - - - - -Increase
Contribution from Government - - - 4,164,314 1,277,358 5,441,672Investment realised 3,149,128 4,175,785 - 7,697,048 5,584,742 20,606,703Other receipts 120,755 142,409 - 217,805 176,708 657,677
Total increase 3,269,883 4,318,194 - 12,079,167 7,038,808 26,706,052Decrease
Purchase of investment (3,266,263) (4,291,746) - (12,073,738) (6,968,436) (26,600,183)Other payments (3,620) (26,448) - (5,429) (70,372) (105,869)
Total decrease (3,269,883) (4,318,194) - (12,079,167) (7,038,808) (26,706,052)Balance carried forward - - - - - -
BAF EIF HHF DCAF MRFF Total30 June 30 June 30 June 30 June 30 June 30 June
2016 2016 2016 2016 2016 2016$'000 $'000 $'000 $'000 $'000 $'000
Balance brought forward - - - - - -Increase
Contribution from Government - - - 3,449,500 3,149,351 6,598,851Investment realised 3,444,840 4,018,017 1,859,077 4,272,238 2,663,546 16,257,718Other receipts 154,968 170,789 61,815 120,383 18,228 526,183
Total increase 3,599,808 4,188,806 1,920,892 7,842,121 5,831,125 23,382,752Decrease
Purchase of investment (3,589,595) (4,129,347) (401,400) (7,839,207) (5,829,632) (21,789,181)Other payments (10,213) (59,459) (1,519,492) (2,914) (1,493) (1,593,571)
Total decrease (3,599,808) (4,188,806) (1,920,892) (7,842,121) (5,831,125) (23,382,752)Balance carried forward - - - - - -

160
Notes to and forming part of the financial statements F. Funding
Building Australia Fund (BAF) Special AccountEstablishing Instrument: Nation-building Funds Act 2008, s.13. Purpose: For making payments in relation to transport infrastructure, communications infrastructure (including the National Broadband Network), energy infrastructure and water infrastructure. The balance of the special account is invested by the Future Fund Board of Guardians. The Future Fund Board of Guardians may invest amounts standing to the credit of the special account in any financial assets, although the special account itself is non-interest bearing.
Education Investment Fund (EIF) Special AccountEstablishing Instrument: Nation-building Funds Act 2008, s.132. Purpose: For making payments in relation to higher education infrastructure, research infrastructure, vocational education and training infrastructure, and any other eligible education infrastructure. The balance of the special account is invested by the Future Fund Board of Guardians. The Future Fund Board of Guardians may invest amounts standing to the credit of the special account in any financial assets, although the special account itself is non-interest bearing.
Health and Hospitals Fund (HHF) Special AccountEstablishing Instrument: Nation-building Funds Act 2008, s.215. Purpose: For making payments in relation to health infrastructure. The Future Fund Board of Guardians may invest amounts standing to the credit of the special account in any financial assets, although the special account itself is non-interest bearing. This special account ceased 29 October2015.
DisabilityCare Australia Fund (DCAF) Special AccountEstablishing Instrument: DisabilityCare Australia Fund Act 2013, s.11. Purpose: For making reimbursements to State, Territory and Commonwealth Governments in relation to expenditure incurred under the National Disability Insurance Scheme Act 2013. The balance of the special account is invested by the Future Fund Board of Guardians. The Future Fund Board of Guardians may invest amounts standing to the credit of the special account in any financial assets, although the special account itself is non-interest bearing.
Medical Research Future Fund (MRFF)Establishing instrument: Medical Research Future Fund Act 2015, s.14. Purpose: For making payments in relation to medical research and medical innovation. The balance of the special account is invested by the Future Fund Board of Guardians. The Future Fund Board of Guardians invests amounts standing to the credit of the special account, although the special account itself is non-interest bearing.
The following Special Accounts have not been used during the current and comparative years:
Lands Acquisition Special AccountEstablishing Instrument: Lands Acquisition Act 1989, s.89A. Purpose: For the holding of amounts of compensation due to be paid to a person in respect of compulsory acquisition of interests in land where the amount of compensation payable to the person has been determined under the Lands Acquisition Act 1989 but after three months has lapsed the amountremains unpaid due to default or delay on the part of the claimant. To date there have not been any transactions through this account.
Services for Other Entities and Trust Moneys (SOETM) Special Account – Department of FinanceEstablishing Instrument: Financial Management and Accountability (Establishment of SOETM Special Account –Finance) Determination 2012/08. Purpose: For the receipt of moneys temporarily held in trust for other persons other than the Commonwealth and for the payment to a person other than the Commonwealth, on behalf of the Government that are not PGPA Act agencies, or as permitted by an Act. The account is non-interest bearing. This special account was established on 26 June 2012 and the determination will sunset on 1 October 2022.

161
Notes to and forming part of the financial statements G. Managing Other Uncertainties
G. Managing Other UncertaintiesThis section includes additional information about commitments and other events that may have an impact on future financials. These amounts have not been recorded elsewhere in the statements.
In the following disclosures, Departmental and Administered items are included together for presentation purposes only and these balances should not be compared.
G1 : CommitmentsCommitments are defined as:
a) Intentions to create liabilities or assets for the receiving entity, as evidenced by undertakings or agreements to make/obtain future payments to/from other entities; and
b) Are executory contracts that are not recognised under AASB 137 Provisions, Contingent Liabilities and Contingent Assets (i.e. not onerous); but
c) Do not include future appropriations.Commitments are disclosed per requirements of AASB 117 Leases, AASB 138 Intangible Assets and AASB 116Property, Plant and Equipment.
Departmental Administered30 June 30 June 30 June 30 June
2017 2016 2017 2016$'000 $'000 $'000 $'000
BY TYPECommitments receivable
Domestic property portfolio - rent receivable1 983,098 954,950 - -Subleasing - rent receivable2 11,170 12,587 - -Net GST recoverable 38,512 46,869 12,730 12,325
Total commitments receivable 1,032,780 1,014,406 12,730 12,325Commitments payable3
Capital commitmentsLand and buildings4 40,206 107,539 105 500Intangible assets development 5,089 10,350 - -Infrastructure, plant & equipment 1,215 2,661 - 144
Total capital commitments 46,510 120,550 105 644Other commitments
Operating leases5 377,122 386,288 140,125 135,168Finance leases6 7,075 11,433 - -Net GST payable 89,373 86,814 - -
Total other commitments 473,570 484,535 140,125 135,168Total commitments payable 520,080 605,085 140,230 135,812Net commitments by type 512,700 409,321 (127,500) (123,487)
BY MATURITYCommitments receivable
Within 1 year 78,114 81,338 3,271 3,385Between 1 to 5 years 397,162 365,459 7,725 6,886More than 5 years 557,504 567,609 1,734 2,054
Total commitments receivable 1,032,780 1,014,406 12,730 12,325Commitments payableCapital commitments
Within 1 year 38,911 105,387 105 644Between 1 to 5 years 7,599 15,163 - -
Total capital commitments 46,510 120,550 105 644Operating lease commitments
Within 1 year 17,482 21,134 36,059 36,820Between 1 to 5 years 90,864 102,450 84,988 75,749More than 5 years 268,776 262,704 19,078 22,599
Total operating lease commitments 377,122 386,288 140,125 135,168Finance lease commitments
Within 1 year 3,190 3,267 - -Between 1 to 5 years 3,885 8,166 - -
Total finance lease commitments 7,075 11,433 - -

162
Notes to and forming part of the financial statements G. Managing Other Uncertainties
Departmental Administered30 June 30 June 30 June 30 June
2017 2016 2017 2016$'000 $'000 $'000 $'000
Other commitmentsWithin 1 year 6,461 6,191 - -Between 1 to 5 years 34,440 31,334 - -More than 5 years 48,472 49,289 - -
Total other commitments 89,373 86,814 - -Total commitments payable 520,080 605,085 140,230 135,812Net commitments by maturity 512,700 409,321 (127,500) (123,487)
1 Domestic property portfolio rent receivable includes rent to be received from the Australian Government’s non-DefenceCommonwealth owned property portfolio within Australia. 2 Subleasing rent receivable arrangements exist with the Department of Human Services for One Canberra Avenue.3 Commitments relating to goods and services contracts for current and prior years are not required to be disclosed. 4Land and buildings mainly represent outstanding contractual commitments for construction projects.5 Operating leases mainly comprise office accommodation for Finance business operations (Departmental) and electorate offices for parliamentarians, Commonwealth Parliament Offices and COMCAR depots (Administered).6Finance leases represent outstanding contractual commitments relating to IT equipment and software.
G2 : Contingencies
Contingent liabilities and contingent assets are not recognised in the Statement of Financial Position but are reported in the notes. They may arise from uncertainty as to the existence of a liability or asset, or represent a liability or an asset in respect of which the amount cannot be reliably measured. Contingent assets are disclosed when settlement is probable but not virtually certain, and contingent liabilities are recognised when settlement is greater than remote.
Finance does not have any significant quantifiable contingent assets or liabilities, nor does it have any unquantifiable contingent assets.
Unquantifiable contingent liabilities
In the normal course of business (including the Property and Insurance functions), Finance has a number of matters that are unquantifiable or subject to litigation. At the date of this report, Finance does not consider the outcome of any such matters likely to have a significant effect on its operations or financial position.
G3 : Subsequent events
There were no subsequent events after the reporting period.

163
Notes to and forming part of the financial statements H. Other Information
H. Other InformationThis section includes additional financial information which is considered relevant to assist users in understanding the financial statements.
H1 : Investments in joint ventures
Departmental2017 2016$'000 $'000
Thurgoona Industrial Estate (Finance owns 86.07%) 1,791 3,079Baranduda Industrial Park (Finance owns 77.40%) 1,820 1,819Total investments in joint ventures 3,611 4,898Cash distributions (Equity returns) received from joint ventures: $1.2m (2015-16: $1.4m)
Investments in joint ventures are not expected to be sold or fully realised within the next 12 months.
Finance's investment in joint ventures is accounted for using the 'Equity Method' which means the investment asset is carried at cost adjusted for post-acquisition changes in Finance's share of net assets of the joint ventures. Finance has equity in two joint arrangements, one with the City of Albury (Thurgoona Industrial Estate) and one with the City of Wodonga (Baranduda Industrial Park). These joint arrangements involve the development and sale of industrial lots in separate precincts situated within the local government boundaries of Albury and Wodonga.
Equity contributions involve land, estate development costs, rates, maintenance and selling costs. Development works have been completed and finished lots are currently being marketed.
The terms of each agreement provide that the "rights, duties, obligations, and liabilities of the parties shall be several and not joint nor joint and several". This means that the arrangements are not partnerships.
H2 : Other policy and disclosures
This section of the report provides additional information in relation to line items in the primary statements that do not have specific disclosures in the preceding notes. They are additional disclosures directed at the interests of particular users and their needs.
Centralised procurement
Finance develops and manages procurement arrangements for common goods and services to maximise market benefits for Commonwealth entities. The largest arrangements are VSA and IBNCS.
VSAFinance manages a number of Volume Sourcing Arrangements and a number of custom support agreements with Microsoft to provide software licensing and custom support benefits to related Commonwealth entities. The arrangements are funded on a user pays basis and includes an administration fee.
IBNCSFinance manages telecommunications services to related Commonwealth entities. This arrangement is funded on a user pays basis. These services include Network Carriage Services, Virtual Connection Management Services, Internet Protocol Carriage Services and Major Internet Connection Services.
Other activitiesFinance manages other centralised procurement arrangements including WoAG travel, fleet monitoring, campaign advertising and major office machines. The Coordinated Procurement Contracting Special Account is detailed at Note F3.1.
VSA, IBNCS and Strategic Sourcing functions of the Centralised Procurement Contracting Special Account hastransferred to DTA post 30 June as a result of Machinery of Government changes, further information is detailed in the Restructuring Note at C4.

164
Notes to and forming part of the financial statements H. Other Information
Competitive neutrality (including income tax expense)
Finance is exempt from all forms of taxation except Fringe Benefits Tax and GST.
Finance applies the Australian Government's Competitive Neutrality Policy Statement (June 1996) to properties in the portfolio that are leased and managed in a competitive environment. The taxation equivalent regime is applied as a competitive neutrality charge (shown as competitive neutrality and income tax expense in the Statement of Comprehensive Income) and a notional payment is calculated quarterly to cover indirect taxes such as payroll tax, council rates, stamp duty and land tax and income tax based upon accounting income; as if they have been applied to these properties. These amounts have been paid or are payable by Finance to the OPA.
Rental income
Rental income includes rent received from tenants occupying buildings that are part of the Australian Government’s non-Defence property portfolio. It also includes revenue received from sub-leasing arrangements with other entities for non-Commonwealth owned properties.
Resources received free of charge
Resources free of charge are recognised as revenue when, and only when, a fair value can be reliably determined and the services would be purchased if they had not been donated. Use of the resources is recognised as an expense. Resources received free of charge are recorded as either revenue or gains depending on their nature. Resources received free of charge predominantly relate to Australian National Audit Office audit fees for Finance’s financial statements and WoAG financial statements (2017: $1.4 million). Resources received free of charge also includes a small portion for the recognition of land transferred from the NSW Government in the current year.
Resources received free of charge for Administered includes rent received free of charge for office space in the Ministerial Wing of Parliament House.
Resources provided free of charge
As outlined in the Restructuring Note at C4, IPEA was established effective 3 April 2017, with some functions from Finance transferring. Finance has continued to provide corporate services to IPEA free of charge. No separate disclosures are required.
Cash and cash equivalents
Cash and cash equivalents include cash on hand, cash held with outsiders, cash in special accounts and demand deposits in bank accounts with an original maturity of three months or less that are readily convertible to known amounts of cash and subject to an insignificant risk of changes in value. Cash is recognised at its nominal amount. Cash or cash equivalent balances that are held for investment purposes are classified as investments.
Unearned revenue
Mainly relates to amounts received in advance for goods and services yet to be rendered by Finance to related Commonwealth entities for centralised procurement and domestic property and construction activities. Revenues are recognised in relation to these items when the relevant good or service has been provided.
Return of equity - special accounts
A provision is raised annually for the estimated balance of surplus funds to be returned to the OPA in the following year for the Property Special Account. In any year, the level of this provision reflects the estimated surplus funds arising from Finance’s property operations and gross divestment proceeds. The variance to budget for the cash return is due to the budget being based on the 2014-15 provision.
Official Public Account (OPA)
Collections of revenue to the Government are transferred to the OPA which is administered by Finance. Conversely, cash is drawn from the OPA to make payments under Parliamentary appropriation on behalf of the Government. These transfers to and from the OPA are adjustments to the administered cash held by Finance on behalf of the Government and reported as such in the Administered Cash Flow Statement and the Administered Reconciliation Schedule. OPA balances are disclosed in the Administered Schedule of Assets and Liabilities under cash and cash equivalents and the overnight cash balance payable. Given the fluctuation in daily balances, no budget is prepared for these items. The OPA balance is disclosed at Note D1.1.