part i information required for … · ... to measure its underlying financial performance....
TRANSCRIPT

Noble Group LimitedFull Year Financial Statements And Dividend Announcement
Financial statements for the year ended 31 December 2017These figures have been audited
PART IINFORMATION REQUIRED FOR ANNOUNCEMENTS OF QUARTERLY (Q1, Q2, Q3), HALF YEAR AND FULL YEAR RESULTS
1(a)(i) An income statement (for the group) together with a comparative statement for the corresponding period of theimmediately preceding financial year
Year ended Year ended Increase/31 Dec 2017 31 Dec 2016 (Decrease)
Note US$'000 US$'000 %(restated)
CONTINUING OPERATIONSREVENUE 6,433,788 8,666,501 (26)
Cost of sales and services (8,879,817) (8,154,320) 9
Operating income/(loss) from supply chains (2,446,029) 512,181 N/A
Profit/(loss) on supply chain assets, net (927,049) 143,930 N/A Share of profits and losses of:
Joint ventures (5,825) (26,036) (78) Associates (7,345) (54,857) (87)
TOTAL OPERATING INCOME/(LOSS) (3,386,248) 575,218 N/A
Other income net of other expenses 3,213 2,009 60 Selling, administrative and operating expenses (352,870) (411,737) (14)
PROFIT/(LOSS) BEFORE INTEREST AND TAX (3,735,905) 165,490 N/A
Finance income 32,321 46,970 (31) Finance costs (211,599) (191,979) 10
PROFIT/(LOSS) BEFORE TAX FROM CONTINUING OPERATIONS (3,915,183) 20,481 N/A
Taxation 29,264 (68,575) N/A
LOSS FOR THE YEAR FROM CONTINUING OPERATIONS (3,885,919) (48,094) 7,980
DISCONTINUED OPERATIONSPOST-TAX PROFIT/(LOSS) FOR THE YEAR
FROM DISCONTINUED OPERATIONS (G) (1,053,435) 56,231 N/A
PROFIT/(LOSS) FOR THE YEAR (4,939,354) 8,137 N/A
Attributable to:Equity holders of the parent (4,938,234) 8,653 N/A Non-controlling interests (1,120) (516) 117
(4,939,354) 8,137 N/A
EARNINGS/(LOSS) PER SHARE ATTRIBUTABLE TO ORDINARY EQUITY HOLDERS OF THE PARENT (see paragraph 6)
2017 2016 2017 2016 2017 2016US$ US$ US$ US$ US$ US$
(restated) (restated) (restated)
Basic (2.9858) (0.0661) (0.8046) 0.0519 (3.7904) (0.0142)Diluted (2.9858) (0.0661) (0.8046) 0.0519 (3.7904) (0.0142)
Continuing operations GroupDiscontinued operations
1
Noble Group Limited
Full Year Financial Statements And Dividend Announcement
1(a)(i) An income statement (for the group) together with a comparative statement for the corresponding period of the
immediately preceding financial year (cont'd)
Notes:
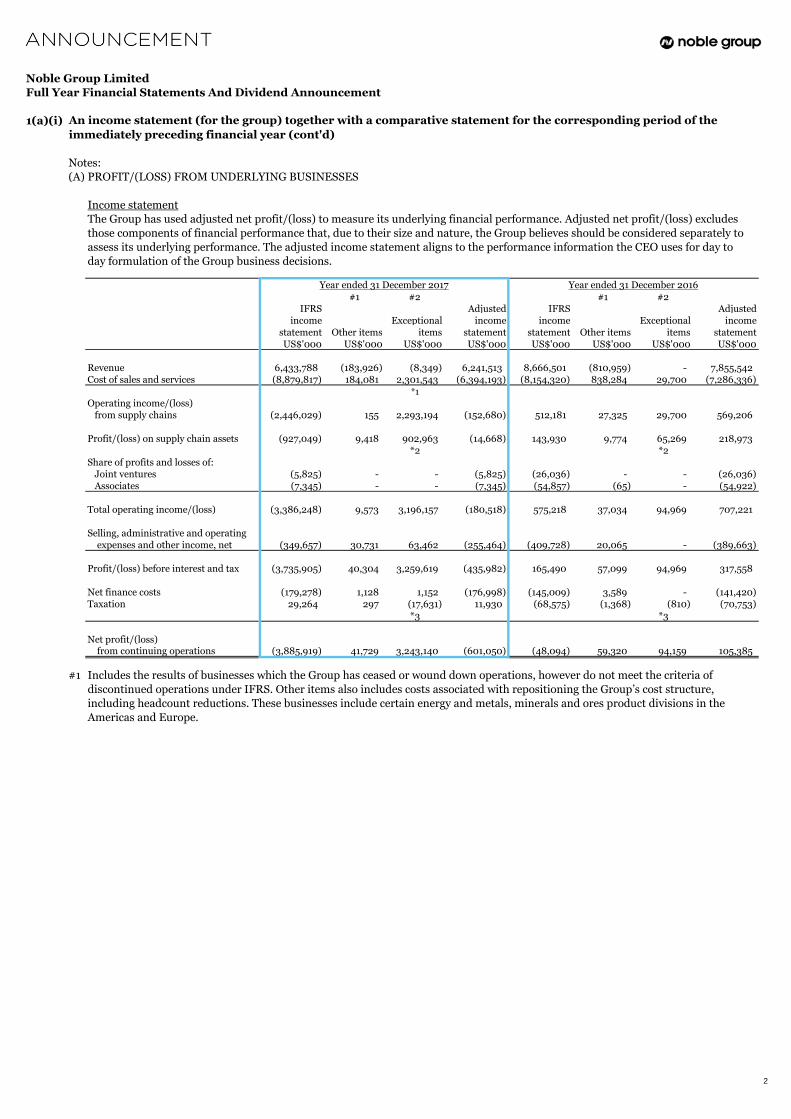
(A) PROFIT/(LOSS) FROM UNDERLYING BUSINESSES
Income statement
The Group has used adjusted net profit/(loss) to measure its underlying financial performance. Adjusted net profit/(loss) excludes
those components of financial performance that, due to their size and nature, the Group believes should be considered separately to
assess its underlying performance. The adjusted income statement aligns to the performance information the CEO uses for day to
day formulation of the Group business decisions.
#1 #2 #1 #2IFRS Adjusted IFRS Adjusted
income Exceptional income income Exceptional incomestatement Other items items statement statement Other items items statementUS$'000 US$'000 US$'000 US$'000 US$'000 US$'000 US$'000 US$'000
Revenue 6,433,788 (183,926) (8,349) 6,241,513 8,666,501 (810,959) - 7,855,542 Cost of sales and services (8,879,817) 184,081 2,301,543 (6,394,193) (8,154,320) 838,284 29,700 (7,286,336)
*1
Operating income/(loss) from supply chains (2,446,029) 155 2,293,194 (152,680) 512,181 27,325 29,700 569,206
Profit/(loss) on supply chain assets (927,049) 9,418 902,963 (14,668) 143,930 9,774 65,269 218,973 *2 *2
Share of profits and losses of: Joint ventures (5,825) - - (5,825) (26,036) - - (26,036) Associates (7,345) - - (7,345) (54,857) (65) - (54,922)
Total operating income/(loss) (3,386,248) 9,573 3,196,157 (180,518) 575,218 37,034 94,969 707,221
Selling, administrative and operating expenses and other income, net (349,657) 30,731 63,462 (255,464) (409,728) 20,065 - (389,663)
Profit/(loss) before interest and tax (3,735,905) 40,304 3,259,619 (435,982) 165,490 57,099 94,969 317,558
Net finance costs (179,278) 1,128 1,152 (176,998) (145,009) 3,589 - (141,420) Taxation 29,264 297 (17,631) 11,930 (68,575) (1,368) (810) (70,753)
*3 *3
Net profit/(loss) from continuing operations (3,885,919) 41,729 3,243,140 (601,050) (48,094) 59,320 94,159 105,385
#1 Includes the results of businesses which the Group has ceased or wound down operations, however do not meet the criteria of
discontinued operations under IFRS. Other items also includes costs associated with repositioning the Group’s cost structure,
including headcount reductions. These businesses include certain energy and metals, minerals and ores product divisions in the
Americas and Europe.
Year ended 31 December 2017 Year ended 31 December 2016
2
Noble Group LimitedFull Year Financial Statements And Dividend Announcement
1(a)(i) An income statement (for the group) together with a comparative statement for the corresponding period of the
immediately preceding financial year (cont'd)
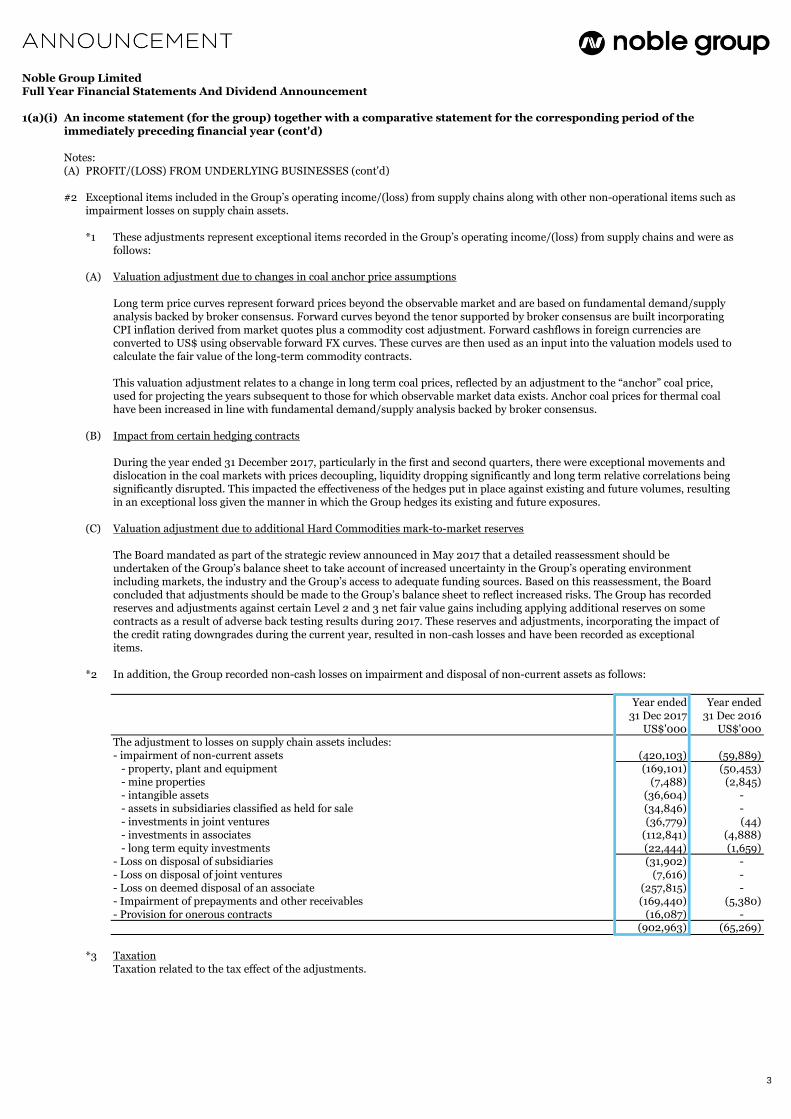
Notes:(A) PROFIT/(LOSS) FROM UNDERLYING BUSINESSES (cont'd)
#2 Exceptional items included in the Group’s operating income/(loss) from supply chains along with other non-operational items such asimpairment losses on supply chain assets.
*1 These adjustments represent exceptional items recorded in the Group’s operating income/(loss) from supply chains and were asfollows:
(A) Valuation adjustment due to changes in coal anchor price assumptions
Long term price curves represent forward prices beyond the observable market and are based on fundamental demand/supplyanalysis backed by broker consensus. Forward curves beyond the tenor supported by broker consensus are built incorporatingCPI inflation derived from market quotes plus a commodity cost adjustment. Forward cashflows in foreign currencies areconverted to US$ using observable forward FX curves. These curves are then used as an input into the valuation models used tocalculate the fair value of the long-term commodity contracts.
This valuation adjustment relates to a change in long term coal prices, reflected by an adjustment to the “anchor” coal price,used for projecting the years subsequent to those for which observable market data exists. Anchor coal prices for thermal coalhave been increased in line with fundamental demand/supply analysis backed by broker consensus.
(B) Impact from certain hedging contracts
During the year ended 31 December 2017, particularly in the first and second quarters, there were exceptional movements anddislocation in the coal markets with prices decoupling, liquidity dropping significantly and long term relative correlations beingsignificantly disrupted. This impacted the effectiveness of the hedges put in place against existing and future volumes, resultingin an exceptional loss given the manner in which the Group hedges its existing and future exposures.
(C) Valuation adjustment due to additional Hard Commodities mark-to-market reserves
The Board mandated as part of the strategic review announced in May 2017 that a detailed reassessment should beundertaken of the Group’s balance sheet to take account of increased uncertainty in the Group’s operating environmentincluding markets, the industry and the Group’s access to adequate funding sources. Based on this reassessment, the Boardconcluded that adjustments should be made to the Group’s balance sheet to reflect increased risks. The Group has recordedreserves and adjustments against certain Level 2 and 3 net fair value gains including applying additional reserves on somecontracts as a result of adverse back testing results during 2017. These reserves and adjustments, incorporating the impact ofthe credit rating downgrades during the current year, resulted in non-cash losses and have been recorded as exceptionalitems.
*2 In addition, the Group recorded non-cash losses on impairment and disposal of non-current assets as follows:
Year ended Year ended31 Dec 2017 31 Dec 2016
US$'000 US$'000The adjustment to losses on supply chain assets includes:- impairment of non-current assets (420,103) (59,889) - property, plant and equipment (169,101) (50,453) - mine properties (7,488) (2,845) - intangible assets (36,604) - - assets in subsidiaries classified as held for sale (34,846) - - investments in joint ventures (36,779) (44) - investments in associates (112,841) (4,888) - long term equity investments (22,444) (1,659) - Loss on disposal of subsidiaries (31,902) - - Loss on disposal of joint ventures (7,616) - - Loss on deemed disposal of an associate (257,815) - - Impairment of prepayments and other receivables (169,440) (5,380) - Provision for onerous contracts (16,087) -
(902,963) (65,269)
*3 TaxationTaxation related to the tax effect of the adjustments.
3
Noble Group LimitedFull Year Financial Statements And Dividend Announcement
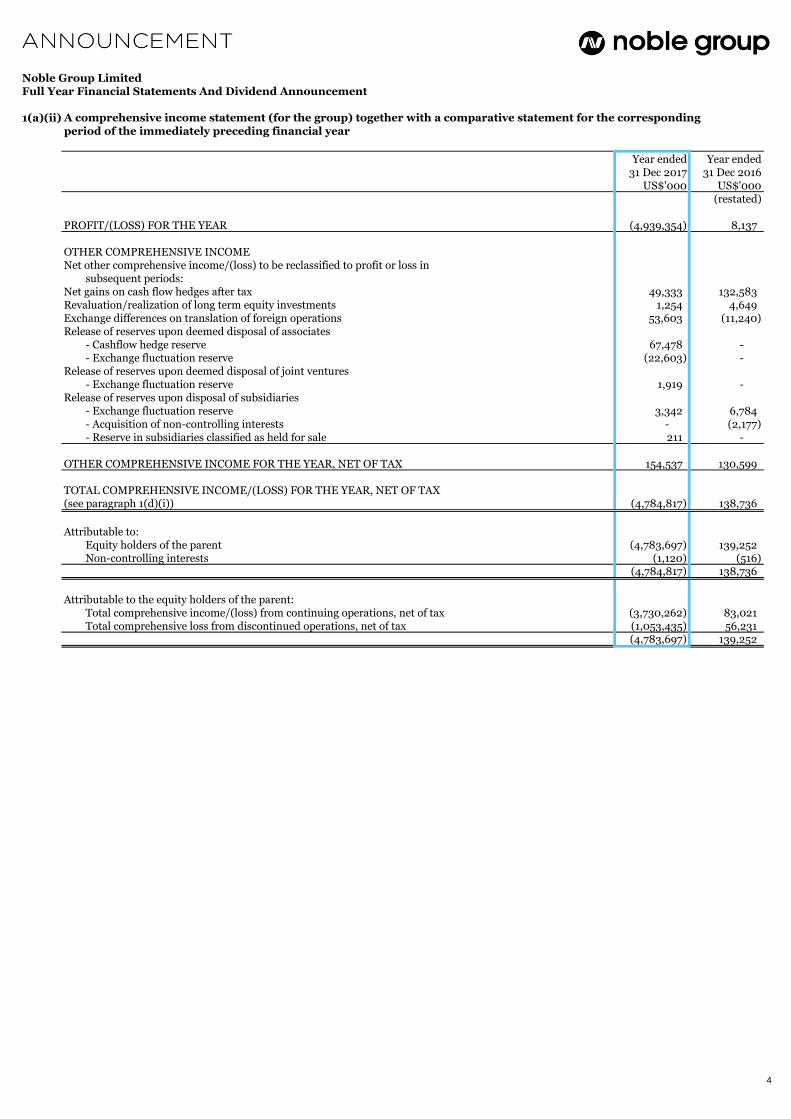
1(a)(ii) A comprehensive income statement (for the group) together with a comparative statement for the corresponding
period of the immediately preceding financial year
Year ended Year ended31 Dec 2017 31 Dec 2016
US$'000 US$'000(restated)
PROFIT/(LOSS) FOR THE YEAR (4,939,354) 8,137
OTHER COMPREHENSIVE INCOMENet other comprehensive income/(loss) to be reclassified to profit or loss in
subsequent periods:Net gains on cash flow hedges after tax 49,333 132,583 Revaluation/realization of long term equity investments 1,254 4,649 Exchange differences on translation of foreign operations 53,603 (11,240) Release of reserves upon deemed disposal of associates
- Cashflow hedge reserve 67,478 - - Exchange fluctuation reserve (22,603) -
Release of reserves upon deemed disposal of joint ventures- Exchange fluctuation reserve 1,919 -
Release of reserves upon disposal of subsidiaries- Exchange fluctuation reserve 3,342 6,784 - Acquisition of non-controlling interests - (2,177) - Reserve in subsidiaries classified as held for sale 211 -
OTHER COMPREHENSIVE INCOME FOR THE YEAR, NET OF TAX 154,537 130,599
TOTAL COMPREHENSIVE INCOME/(LOSS) FOR THE YEAR, NET OF TAX (see paragraph 1(d)(i)) (4,784,817) 138,736
Attributable to:Equity holders of the parent (4,783,697) 139,252 Non-controlling interests (1,120) (516)
(4,784,817) 138,736
Attributable to the equity holders of the parent:Total comprehensive income/(loss) from continuing operations, net of tax (3,730,262) 83,021 Total comprehensive loss from discontinued operations, net of tax (1,053,435) 56,231
(4,783,697) 139,252
4

Noble Group LimitedFull Year Financial Statements And Dividend Announcement
1(b)(i) A statement of financial position (for the issuer and group), together with a comparative statement as at the end of theimmediately preceding financial year
Group Company
As at As at As at As at 31/12/2017 31/12/2016 31/12/2017 31/12/2016
Notes US$'000 US$'000 US$'000 US$'000
NON-CURRENT ASSETSProperty, plant and equipment 411,591 759,752 - -
Mine properties - 12,823 - - Intangible assets 2,548 125,077 - - Investments in subsidiaries - - 1,236,875 3,301,307 Investments in joint ventures 157,145 196,258 - - Investments in associates 40,176 461,346 - 13,441 Long term equity investments 94,175 28,436 126 610 Long term loans 264,070 288,738 - - Deferred tax assets 92,507 241,872 - 22,100
Total non-current assets 1,062,212 2,114,302 1,237,001 3,337,458
CURRENT ASSETSCash and cash equivalents (A) 492,012 1,170,471 120,098 302,249 Due from subsidiaries - - 2,177,737 4,174,522 Trade receivables 665,128 2,407,412 - - Prepayments, deposits and other receivables (B) 398,577 867,010 55,890 40,466 Fair value gains on commodity and other
derivative financial instruments (C) 513,315 3,780,517 104 103 Inventories (D) 166,422 1,643,046 - - Tax recoverable 14,627 61,927 - -
2,250,081 9,930,383 2,353,829 4,517,340
Assets in subsidiaries classified as held for sale (E) 1,403,182 239,950 - - Non-current assets classified as held for sale (F) 94,000 - - -
Total current assets 3,747,263 10,170,333 2,353,829 4,517,340
CURRENT LIABILITIESDue to subsidiaries - - 797,503 424,851 Trade and other payables and accrued liabilities (I) 942,664 3,151,299 272,761 182,864 Fair value losses on commodity and other derivative financial instruments (C) 160,414 1,004,098 2,791 4,648 Bank debts 1,189,586 1,293,425 1,153,401 784,270
Senior notes (J) 378,815 - 378,815 - Tax payable 11,572 23,693 - -
2,683,051 5,472,515 2,605,271 1,396,633
Liabilities in subsidiaries classified as held for sale (E) 913,690 12,525 - - Liabilities related to held for sale subsidiaries (E) - 64,449 - -
Total current liabilities 3,596,741 5,549,489 2,605,271 1,396,633
NET CURRENT ASSETS/(LIABILITIES) 150,522 4,620,844 (251,442) 3,120,707
TOTAL ASSETS LESS CURRENT LIABILITIES 1,212,734 6,735,146 985,559 6,458,165
NON-CURRENT LIABILITIESBank debts 98,125 1,194,119 - 1,137,753
Senior notes (J) 1,915,520 1,555,309 1,915,520 1,555,309 Deferred tax liabilities - 6,154 - -
Total non-current liabilities 2,013,645 2,755,582 1,915,520 2,693,062
NET ASSETS/(LIABILITIES) (800,911) 3,979,564 (929,961) 3,765,103
5
Noble Group LimitedFull Year Financial Statements And Dividend Announcement
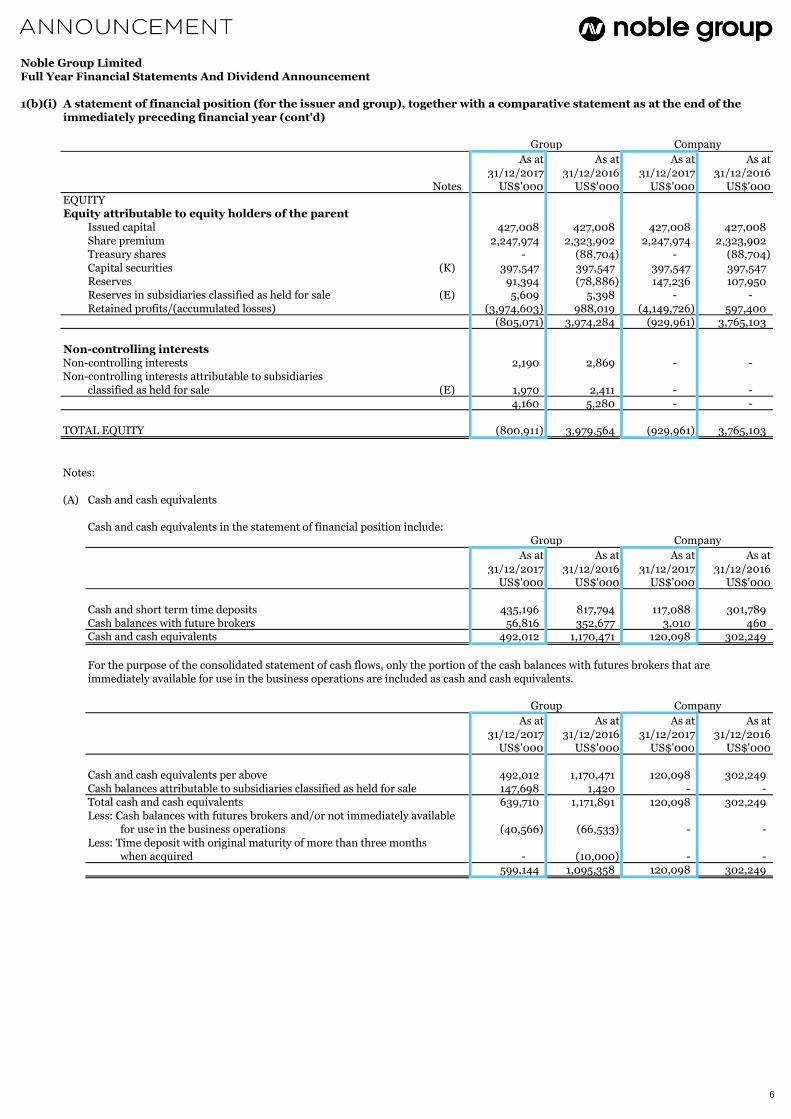
1(b)(i) A statement of financial position (for the issuer and group), together with a comparative statement as at the end of theimmediately preceding financial year (cont'd)
Group Company
As at As at As at As at 31/12/2017 31/12/2016 31/12/2017 31/12/2016
Notes US$'000 US$'000 US$'000 US$'000EQUITYEquity attributable to equity holders of the parent
Issued capital 427,008 427,008 427,008 427,008
Share premium 2,247,974 2,323,902 2,247,974 2,323,902 Treasury shares - (88,704) - (88,704) Capital securities (K) 397,547 397,547 397,547 397,547 Reserves 91,394 (78,886) 147,236 107,950 Reserves in subsidiaries classified as held for sale (E) 5,609 5,398 - - Retained profits/(accumulated losses) (3,974,603) 988,019 (4,149,726) 597,400
(805,071) 3,974,284 (929,961) 3,765,103
Non-controlling interestsNon-controlling interests 2,190 2,869 - - Non-controlling interests attributable to subsidiaries
classified as held for sale (E) 1,970 2,411 - - 4,160 5,280 - -
TOTAL EQUITY (800,911) 3,979,564 (929,961) 3,765,103
Notes:
(A) Cash and cash equivalents
Cash and cash equivalents in the statement of financial position include:Group Company
As at As at As at As at 31/12/2017 31/12/2016 31/12/2017 31/12/2016
US$'000 US$'000 US$'000 US$'000
Cash and short term time deposits 435,196 817,794 117,088 301,789 Cash balances with future brokers 56,816 352,677 3,010 460 Cash and cash equivalents 492,012 1,170,471 120,098 302,249
For the purpose of the consolidated statement of cash flows, only the portion of the cash balances with futures brokers that are
immediately available for use in the business operations are included as cash and cash equivalents.
Group Company
As at As at As at As at 31/12/2017 31/12/2016 31/12/2017 31/12/2016
US$'000 US$'000 US$'000 US$'000
Cash and cash equivalents per above 492,012 1,170,471 120,098 302,249 Cash balances attributable to subsidiaries classified as held for sale 147,698 1,420 - - Total cash and cash equivalents 639,710 1,171,891 120,098 302,249 Less: Cash balances with futures brokers and/or not immediately available for use in the business operations (40,566) (66,533) - - Less: Time deposit with original maturity of more than three months when acquired - (10,000) - -
599,144 1,095,358 120,098 302,249
6
Noble Group LimitedFull Year Financial Statements And Dividend Announcement
1(b)(i) A statement of financial position (for the issuer and group), together with a comparative statement as at the end of theimmediately preceding financial year (cont'd)
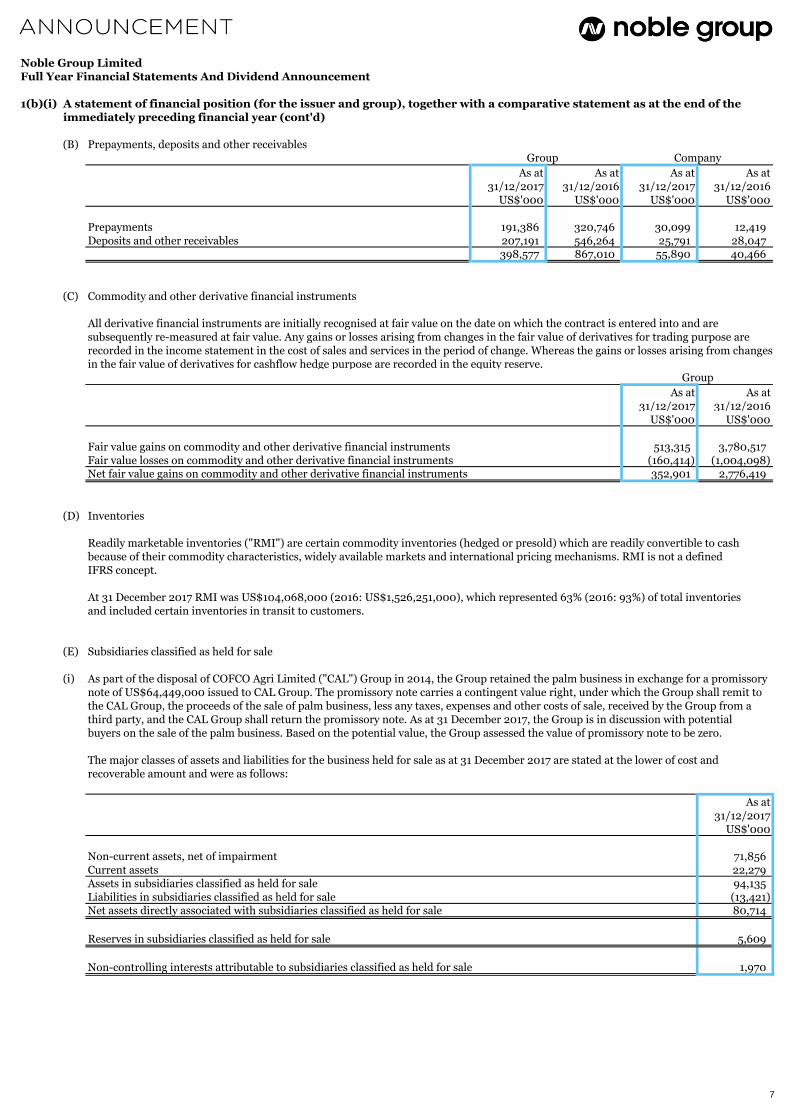
(B) Prepayments, deposits and other receivables Group Company
As at As at As at As at 31/12/2017 31/12/2016 31/12/2017 31/12/2016
US$'000 US$'000 US$'000 US$'000
Prepayments 191,386 320,746 30,099 12,419
Deposits and other receivables 207,191 546,264 25,791 28,047 398,577 867,010 55,890 40,466
(C) Commodity and other derivative financial instruments
All derivative financial instruments are initially recognised at fair value on the date on which the contract is entered into and aresubsequently re-measured at fair value. Any gains or losses arising from changes in the fair value of derivatives for trading purpose arerecorded in the income statement in the cost of sales and services in the period of change. Whereas the gains or losses arising from changesin the fair value of derivatives for cashflow hedge purpose are recorded in the equity reserve.
As at As at 31/12/2017 31/12/2016
US$'000 US$'000
Fair value gains on commodity and other derivative financial instruments 513,315 3,780,517
Fair value losses on commodity and other derivative financial instruments (160,414) (1,004,098) Net fair value gains on commodity and other derivative financial instruments 352,901 2,776,419
(D) Inventories
Readily marketable inventories ("RMI") are certain commodity inventories (hedged or presold) which are readily convertible to cashbecause of their commodity characteristics, widely available markets and international pricing mechanisms. RMI is not a definedIFRS concept.
At 31 December 2017 RMI was US$104,068,000 (2016: US$1,526,251,000), which represented 63% (2016: 93%) of total inventoriesand included certain inventories in transit to customers.
(E) Subsidiaries classified as held for sale
(i) As part of the disposal of COFCO Agri Limited ("CAL") Group in 2014, the Group retained the palm business in exchange for a promissorynote of US$64,449,000 issued to CAL Group. The promissory note carries a contingent value right, under which the Group shall remit tothe CAL Group, the proceeds of the sale of palm business, less any taxes, expenses and other costs of sale, received by the Group from athird party, and the CAL Group shall return the promissory note. As at 31 December 2017, the Group is in discussion with potentialbuyers on the sale of the palm business. Based on the potential value, the Group assessed the value of promissory note to be zero.
The major classes of assets and liabilities for the business held for sale as at 31 December 2017 are stated at the lower of cost andrecoverable amount and were as follows:
As at 31/12/2017
US$'000
Non-current assets, net of impairment 71,856Current assets 22,279Assets in subsidiaries classified as held for sale 94,135
Liabilities in subsidiaries classified as held for sale (13,421) Net assets directly associated with subsidiaries classified as held for sale 80,714
Reserves in subsidiaries classified as held for sale 5,609
Non-controlling interests attributable to subsidiaries classified as held for sale 1,970
Group
7

Noble Group LimitedFull Year Financial Statements And Dividend Announcement
1(b)(i) A statement of financial position (for the issuer and group), together with a comparative statement as at the end of theimmediately preceding financial year (cont'd)
(E) Subsidiaries classified as held for sale (cont'd)
(ii) Disposal of Noble Americas Corp.
On 23 October 2017, the Group announced it had entered into a purchase agreement with Vitol US Holding Co. and Euromin Inc. inconnection with the proposed sale of all of the issued and outstanding capital stock (the "Sale Shares") of Noble Americas Corp.(“NAC”).
Consideration for the Proposed Disposal comprises: i) base consideration; ii) plus net working capital of NAC and its subsidiaries on theday immediately preceding the closing date; and iii) minus any indebtedness of NAC and its subsidiaries on the day immediatelypreceding the closing date.
Subsequent to the balance sheet date, on 12 January 2018, the disposal of NAC was completed.
The major classes of assets and liabilities for the business held for sale as at 31 December 2017 are stated at the lower of cost andthe estimated recoverable amount and were as follows:
As at 31/12/2017
US$'000
Non-current assets, net of impairment 136,718Current assets 1,152,541
Assets in subsidiaries classified as held for sale 1,289,259Liabilities in subsidiaries classified as held for sale (884,183) Net assets directly associated with subsidiaries classified as held for sale 405,076
In accordance with IFRS 5, assets held for sale with a carrying amount of US$519 million were written down to their fair valueof US$405 million, resulting in a loss of US$114 million, which was included in profit or loss for the year.
(iii) The Group has signed a term sheet in September 2017, for sale of Territory Resources Limited at book value of its assets.
(F) Non-current assets classified as held for sale
The four dry bulk carrier vessels are categorised as held for sale and written down to estimated recoverable amount as at 31 December2017, resulting in an impairment charge of US$36,604,000 against goodwill previously recorded.
8

Noble Group LimitedFull Year Financial Statements And Dividend Announcement
1(b)(i) A statement of financial position (for the issuer and group), together with a comparative statement as at the end of theimmediately preceding financial year (cont'd)
(G) Discontinued operations
The Group has substantially completed the monetisation of its Global Oil Liquids and North American Gas & Power businesses. Themonetisation plan has been enacted over the past several months via three separate processes:
1) Sale of the North American Gas & Power business. The North American Gas & Power business was conducted through NobleAmericas Gas & Power Corp and was a subsidiary of NAC;
2) Sale of NAC, a United States incorporated wholly-owned subsidiary of the Group. The Global Oil Liquids business wasprimarily conducted through NAC; and
3) Wind-down of certain remaining Global Oil Liquids working capital balances within Noble Clean Fuels Limited ("NCFL"),a UK incorporated wholly-owned subsidiary of the Group. The NCFL borrowing base facility was fully repaid and cancelledon 11 December 2017. Following the completion of the wind-down process, the Group will retain its existing Liquefied Natural Gas and Asia-focused distillates businesses, which operate under NCFL and which remain complimentary to the HardCommodities businesses.
The post-tax loss for the year ended 31 December 2017 from the discontinued Global Oil Liquids and North American Gas & Poweroperations is presented below:
Year ended Year ended31 Dec 2017 31 Dec 2016
US$'000 US$'000
Revenue 27,987,009 37,861,837 Cost of sales and services (28,283,323) (37,703,768) Operating income/(loss) from supply chains (296,314) 158,069 Loss on supply chain assets, net* (371,268) (9,705) Share of profits and losses of joint ventures/associates (2,878) 9,374 Total operating income/(losses) (670,460) 157,738 Other income net of other expenses 1,158 1,774 Selling, administrative and operating expenses (227,501) (249,911) Net finance costs (15,041) (12,785) Loss before tax (911,844) (103,184) Taxation (141,591) 159,415 Net profit/(loss) for the year from the discontinued operations (1,053,435) 56,231
* Included impairment of US$114 million on proposed disposal of NAC, US$144 million loss on sale of Noble Americas Gas &Power Corp. and US$61 million loss on sale of Noble Americas South Bend Ethanol LLC.
The net cash flows incurred by discontinued operations for the year ended 31 December 2017 are as follows:
Year ended Year ended31 Dec 2017 31 Dec 2016
US$'000 US$'000
Operating activities 78,507 (713,001) Investing activities (15,216) (10,827) Financing activities (202,055) 776,694 Net foreign exchange differences 1,231 3,584 Net cash inflow/(outflow) (137,533) 56,450
9
Noble Group LimitedFull Year Financial Statements And Dividend Announcement
1(b)(i) A statement of financial position (for the issuer and group), together with a comparative statement as at the end of theimmediately preceding financial year (cont'd)
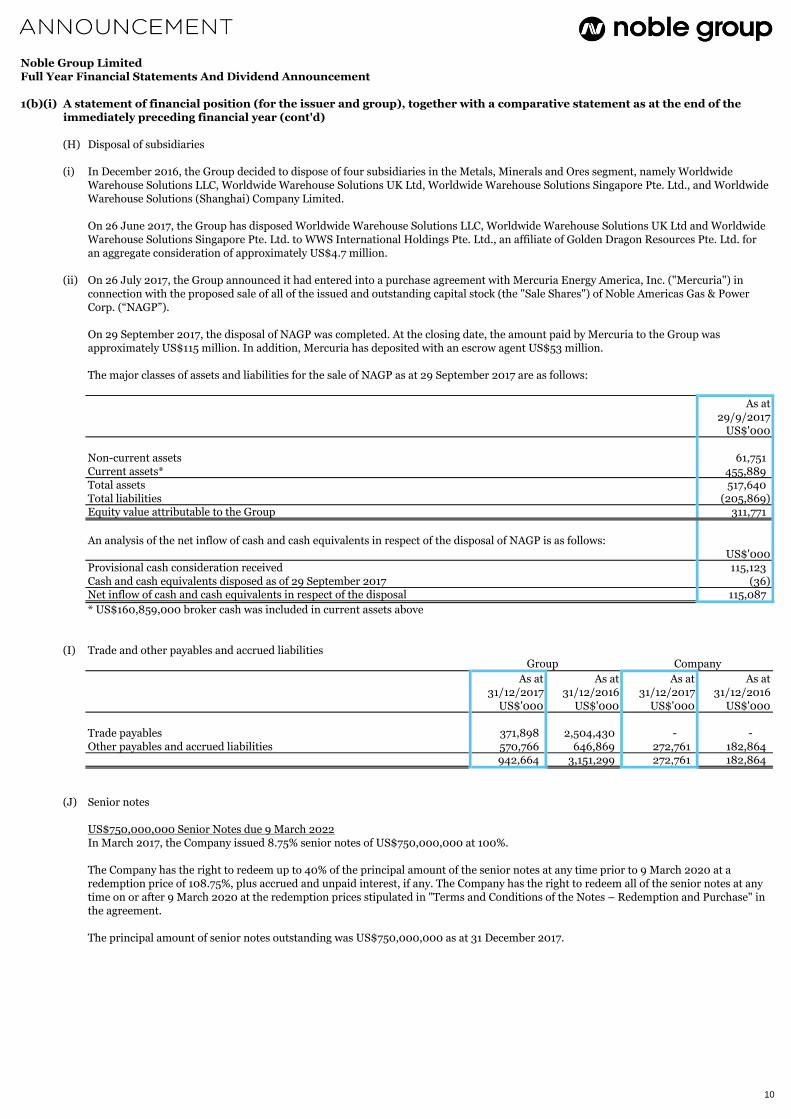
(H) Disposal of subsidiaries
(i) In December 2016, the Group decided to dispose of four subsidiaries in the Metals, Minerals and Ores segment, namely Worldwide Warehouse Solutions LLC, Worldwide Warehouse Solutions UK Ltd, Worldwide Warehouse Solutions Singapore Pte. Ltd., and WorldwideWarehouse Solutions (Shanghai) Company Limited.
On 26 June 2017, the Group has disposed Worldwide Warehouse Solutions LLC, Worldwide Warehouse Solutions UK Ltd and Worldwide
Warehouse Solutions Singapore Pte. Ltd. to WWS International Holdings Pte. Ltd., an affiliate of Golden Dragon Resources Pte. Ltd. foran aggregate consideration of approximately US$4.7 million.
(ii) On 26 July 2017, the Group announced it had entered into a purchase agreement with Mercuria Energy America, Inc. ("Mercuria") inconnection with the proposed sale of all of the issued and outstanding capital stock (the "Sale Shares") of Noble Americas Gas & PowerCorp. (“NAGP”).
On 29 September 2017, the disposal of NAGP was completed. At the closing date, the amount paid by Mercuria to the Group wasapproximately US$115 million. In addition, Mercuria has deposited with an escrow agent US$53 million.
The major classes of assets and liabilities for the sale of NAGP as at 29 September 2017 are as follows:
As at29/9/2017
US$'000
Non-current assets 61,751Current assets* 455,889Total assets 517,640Total liabilities (205,869) Equity value attributable to the Group 311,771
An analysis of the net inflow of cash and cash equivalents in respect of the disposal of NAGP is as follows:US$'000
Provisional cash consideration received 115,123Cash and cash equivalents disposed as of 29 September 2017 (36) Net inflow of cash and cash equivalents in respect of the disposal 115,087
* US$160,859,000 broker cash was included in current assets above
(I) Trade and other payables and accrued liabilities Group
As at As at As at As at 31/12/2017 31/12/2016 31/12/2017 31/12/2016
US$'000 US$'000 US$'000 US$'000
Trade payables 371,898 2,504,430 - - Other payables and accrued liabilities 570,766 646,869 272,761 182,864
942,664 3,151,299 272,761 182,864
(J) Senior notes
US$750,000,000 Senior Notes due 9 March 2022In March 2017, the Company issued 8.75% senior notes of US$750,000,000 at 100%.
The Company has the right to redeem up to 40% of the principal amount of the senior notes at any time prior to 9 March 2020 at aredemption price of 108.75%, plus accrued and unpaid interest, if any. The Company has the right to redeem all of the senior notes at any
time on or after 9 March 2020 at the redemption prices stipulated in "Terms and Conditions of the Notes – Redemption and Purchase" inthe agreement.
The principal amount of senior notes outstanding was US$750,000,000 as at 31 December 2017.
Company
10

Noble Group LimitedFull Year Financial Statements And Dividend Announcement
1(b)(i) A statement of financial position (for the issuer and group), together with a comparative statement as at the end of theimmediately preceding financial year (cont'd)
(J) Senior notes (cont'd)
US$1,176,920,000 (Originally US$1,250,000,000) Senior Notes due 29 January 2020In October 2009, the Company issued 6.75% senior notes of US$850,000,000 at 99.105%. On 9 February 2010, the Company issued afurther US$400,000,000 6.75% senior notes due 2020 at 103.6676% to form a single series US$1,250,000,000 senior notes due 29January 2020.
The Company has the right to redeem some or all of the senior notes at any time on or after 16 October 2010 at the redemption pricesstipulated in "Description of notes - Optional redemption" in the agreement.
In May 2012, June 2012 and January 2016, the Company repurchased US$73,080,000 of its US$1,250,000,000 6.75% senior notes. Suchsenior notes were cancelled subsequent to the repurchases. The principal amount of senior notes outstanding was US$1,176,920,000 as at 31 December 2017.
RM3,000,000,000 Medium Term Note ProgrammeIn March 2012, the Company established a multi-currency Islamic medium term note programme of up to Malaysian Ringgit3,000,000,000 (or its equivalent in foreign currency) under the laws of Malaysia. Under the programme, the Company may issue Islamicmedium term notes (“Sukuk Murabahah”) from time to time in Malaysian Ringgit or in other currencies, in various amounts and tenors ofmore than a year and up to a maximum tenor of 20 years.
The Sukuk Murabahah holders, in subscribing or purchasing the Sukuk Murabahah with rights of early redemption, grant the Issuer theoption to redeem the Sukuk Murabahah, in whole or in part, prior to maturity dates stipulated in the agreement of the notes.
There is no outstanding amount of senior notes as at 31 December 2017.
US$3,000,000,000 Medium Term Note ProgrammeIn August 2011, the Company established a US$3,000,000,000 medium term note programme. Under the programme, the Companymay issue notes from time to time in various currencies, amounts and tenors. The notes may bear fixed or floating rates, interest on dualcurrency or index linked bases or may not bear interest. The notes may be offered on a syndicated or non-syndicated basis.
The pricing supplements issued in respect of each issue of notes will state whether such notes may be redeemed prior to their statedmaturity at the Company’s option (either in whole or in part) and/or at the option of the holders, and if so the terms applicable to suchredemption. The Company has the right to redeem some or all of the medium term notes at any time at the redemption prices stipulated inthe agreement of the medium term notes.
On 20 March 2013, the Company issued 3.625% medium term notes of US$400,000,000 at 99.268% due 20 March 2018.
In March 2015 and January 2016, the Company repurchased US$21,000,000 of its US$400,000,000 3.625% medium term notes. Suchmedium term notes were cancelled subsequent to the repurchases. The principal amount of medium term notes outstanding was
US$379,000,000 and were reclassified as current liabilities as at 31 December 2017.
(K) Capital securities
6.0% US$400,000,000 Perpetual Capital SecuritiesThe Company issued perpetual capital securities with a par value of US$350,000,000 on 24 June 2014. On 10 July 2014, the Companyissued an additional US$50,000,000 of the perpetual capital securities at an issue price of 101%. The US$50,000,000 in perpetual capitalsecurities were consolidated with the US$350,000,000 in capital securities issued on 24 June 2014 to form a single series ofUS$400,000,000.
The capital securities are perpetual and do not have a fixed redemption date. The distribution rate of the securities is 6.0% per annum,payable in arrears on a semi-annual basis at the discretion of the Company. The first distribution date was on 24 December 2014. TheCompany may, on giving not more than 60 nor less than 30 days' irrevocable notice to the holders in writing, redeem all but not someonly of the securities in accordance with the terms and conditions of the securities.
In the event of a winding-up, the rights and claims of the holders in respect of the capital securities shall rank ahead of claims in respect ofthe Company's shareholders, but shall be subordinated in right of payment to the claims of all present and future unsubordinated obligations, except for obligations of the Company that are expressed to rank pari passu with, or junior to, its obligations under the capitalsecurities.
11
Noble Group LimitedFull Year Financial Statements And Dividend Announcement
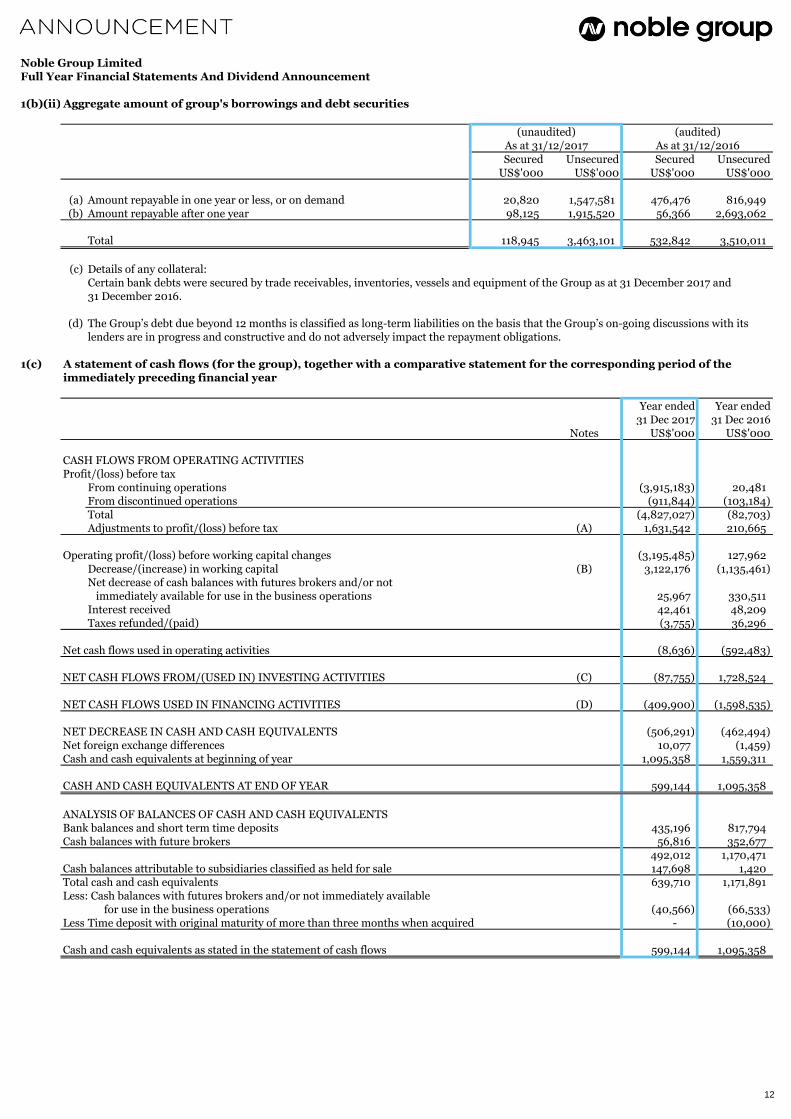
1(b)(ii) Aggregate amount of group's borrowings and debt securities
Secured Unsecured Secured UnsecuredUS$'000 US$'000 US$'000 US$'000
(a) Amount repayable in one year or less, or on demand 20,820 1,547,581 476,476 816,949 (b) Amount repayable after one year 98,125 1,915,520 56,366 2,693,062
Total 118,945 3,463,101 532,842 3,510,011
(c) Details of any collateral:Certain bank debts were secured by trade receivables, inventories, vessels and equipment of the Group as at 31 December 2017 and31 December 2016.
(d) The Group’s debt due beyond 12 months is classified as long-term liabilities on the basis that the Group’s on-going discussions with itslenders are in progress and constructive and do not adversely impact the repayment obligations.
1(c) A statement of cash flows (for the group), together with a comparative statement for the corresponding period of theimmediately preceding financial year
Year ended Year ended31 Dec 2017 31 Dec 2016
Notes US$'000 US$'000
CASH FLOWS FROM OPERATING ACTIVITIESProfit/(loss) before tax
From continuing operations (3,915,183) 20,481 From discontinued operations (911,844) (103,184) Total (4,827,027) (82,703) Adjustments to profit/(loss) before tax (A) 1,631,542 210,665
Operating profit/(loss) before working capital changes (3,195,485) 127,962 Decrease/(increase) in working capital (B) 3,122,176 (1,135,461) Net decrease of cash balances with futures brokers and/or not immediately available for use in the business operations 25,967 330,511 Interest received 42,461 48,209 Taxes refunded/(paid) (3,755) 36,296
Net cash flows used in operating activities (8,636) (592,483)
NET CASH FLOWS FROM/(USED IN) INVESTING ACTIVITIES (C) (87,755) 1,728,524
NET CASH FLOWS USED IN FINANCING ACTIVITIES (D) (409,900) (1,598,535)
NET DECREASE IN CASH AND CASH EQUIVALENTS (506,291) (462,494) Net foreign exchange differences 10,077 (1,459) Cash and cash equivalents at beginning of year 1,095,358 1,559,311
CASH AND CASH EQUIVALENTS AT END OF YEAR 599,144 1,095,358
ANALYSIS OF BALANCES OF CASH AND CASH EQUIVALENTSBank balances and short term time deposits 435,196 817,794 Cash balances with future brokers 56,816 352,677
492,012 1,170,471 Cash balances attributable to subsidiaries classified as held for sale 147,698 1,420 Total cash and cash equivalents 639,710 1,171,891
Less: Cash balances with futures brokers and/or not immediately available for use in the business operations (40,566) (66,533)
Less: Cash balances with futures brokers not immediately available Time deposit with original maturity of more than three months when acquired - (10,000)
Cash and cash equivalents as stated in the statement of cash flows 599,144 1,095,358
As at 31/12/2016As at 31/12/2017(unaudited) (audited)
12

Noble Group LimitedFull Year Financial Statements And Dividend Announcement
1(c) A statement of cash flows (for the group), together with a comparative statement for the corresponding period of theimmediately preceding financial year (cont'd)
Year ended Year ended31 Dec 2017 31 Dec 2016
US$'000 US$'000Notes to the statement of cash flows:-(A) Adjustments to profit/(loss) before tax:
Depreciation 83,062 104,301 Amortisation of intangible assets 18,792 18,090
Gains on redemption of senior notes - (13,315) Net losses on impairment and disposal of non-current assets - from continuing operations 431,427 66,998 - from discontinued operations 119,355 7,227 Impairment of long term loans 6,497 1,800 Impairment of trade receivables 97,965 12,006 Impairment of prepayments and other receivables 172,236 16,780 Impairment of inventories 11,000 - Loss on deemed disposal of an associate 257,815 - Net losses/(gain) on disposal of subsidiaries - from continuing operations 8,540 (287,767) - from discontinued operations 202,536 - Remeasurement gain on pre-existing interest (15,904) (4,245) Share of profits and losses of joint ventures/associates 16,048 71,519 Share-based payment and equity-settled share option expenses 28,730 60,336 Dividend income from long term equity investments (876) (859)
Net finance costs 194,319 157,794 1,631,542 210,665
(B) Decrease/(increase) in working capital includes: Decrease/(increase) in trade receivables 1,210,423 (330,859) Decrease in prepayments, deposits and other receivables 264,985 239,876 Decrease in net fair value gains/losses on commodity and other derivative financial instruments 2,446,769 234,234 Decrease in inventories 995,777 148,069 Decrease in trade and other payables and accrued liabilities (1,795,778) (1,426,781)
3,122,176 (1,135,461)
(C) Net cash flows from/(used in) investing activities: Additions of property, plant and equipment (69,024) (114,224) Proceeds from disposal of property, plant and equipment 10,871 5,230 Cash inflow/(outflow) on acquisition of subsidiaries 2,130 (1,586)
Cash inflow on disposal of subsidiaries 173,755 982,294 Broker cash outflow on disposal of subsidiaries (160,859) - Investments in joint ventures/associates - (6,151) Reduction of investments in joint ventures/associates - 862 Decrease/(increase) in amounts due from joint ventures/associates (76,597) 74,528 Proceeds from disposal of joint ventures 10,000 6,869 Proceeds from disposal of associates - 750,000 Dividend income from joint ventures 10,648 - Disposal of long term equity investments, net - 8,868 Dividend income from long term equity investments 876 859 Decrease in long term loans 445 30,975 Decrease/(increase) in time deposit 10,000 (10,000)
(87,755) 1,728,524
(D) Net cash flows used in financing activities: Interest paid on financing activities (233,774) (205,226)
Bank debts - additions 1,623,745 2,063,528 Bank debts - repayments (2,535,891) (3,549,986) Net proceeds from right issues - 496,455 Redemption of senior notes - (379,306) Dividend paid to capital securities - (24,000) Net proceeds from issuance of senior notes 736,020 -
(409,900) (1,598,535)
13
Noble Group LimitedFull Year Financial Statements And Dividend Announcement
These figures have been audited
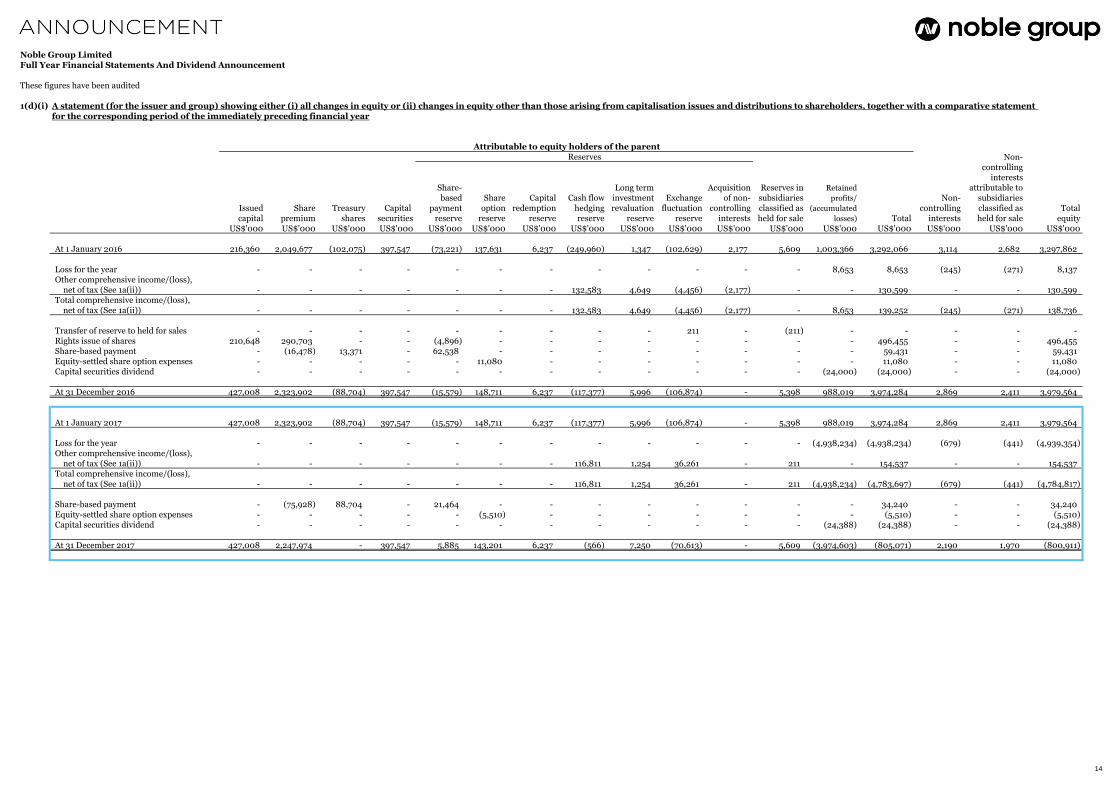
1(d)(i) A statement (for the issuer and group) showing either (i) all changes in equity or (ii) changes in equity other than those arising from capitalisation issues and distributions to shareholders, together with a comparative statement for the corresponding period of the immediately preceding financial year
Non-controlling
interestsShare- Long term Acquisition Reserves in Retained attributable tobased Share Capital Cash flow investment Exchange of non- subsidiaries profits/ Non- subsidiaries
Issued Share Treasury Capital payment option redemption hedging revaluation fluctuation controlling classified as (accumulated controlling classified as Totalcapital premium shares securities reserve reserve reserve reserve reserve reserve interests held for sale losses) Total interests held for sale equity
US$'000 US$'000 US$'000 US$'000 US$'000 US$'000 US$'000 US$'000 US$'000 US$'000 US$'000 US$'000 US$'000 US$'000 US$'000 US$'000 US$'000
At 1 January 2016 216,360 2,049,677 (102,075) 397,547 (73,221) 137,631 6,237 (249,960) 1,347 (102,629) 2,177 5,609 1,003,366 3,292,066 3,114 2,682 3,297,862
Loss for the year - - - - - - - - - - - - 8,653 8,653 (245) (271) 8,137 Other comprehensive income/(loss), net of tax (See 1a(ii)) - - - - - - - 132,583 4,649 (4,456) (2,177) - - 130,599 - - 130,599 Total comprehensive income/(loss), net of tax (See 1a(ii)) - - - - - - - 132,583 4,649 (4,456) (2,177) - 8,653 139,252 (245) (271) 138,736
Transfer of reserve to held for sales - - - - - - - - - 211 - (211) - - - - - Rights issue of shares 210,648 290,703 - - (4,896) - - - - - - - - 496,455 - - 496,455 Share-based payment - (16,478) 13,371 - 62,538 - - - - - - - - 59,431 - - 59,431 Equity-settled share option expenses - - - - - 11,080 - - - - - - - 11,080 - - 11,080 Capital securities dividend - - - - - - - - - - - - (24,000) (24,000) - - (24,000)
At 31 December 2016 427,008 2,323,902 (88,704) 397,547 (15,579) 148,711 6,237 (117,377) 5,996 (106,874) - 5,398 988,019 3,974,284 2,869 2,411 3,979,564
At 1 January 2017 427,008 2,323,902 (88,704) 397,547 (15,579) 148,711 6,237 (117,377) 5,996 (106,874) - 5,398 988,019 3,974,284 2,869 2,411 3,979,564
Loss for the year - - - - - - - - - - - - (4,938,234) (4,938,234) (679) (441) (4,939,354) Other comprehensive income/(loss), net of tax (See 1a(ii)) - - - - - - - 116,811 1,254 36,261 - 211 - 154,537 - - 154,537 Total comprehensive income/(loss), net of tax (See 1a(ii)) - - - - - - - 116,811 1,254 36,261 - 211 (4,938,234) (4,783,697) (679) (441) (4,784,817)
Share-based payment - (75,928) 88,704 - 21,464 - - - - - - - - 34,240 - - 34,240 Equity-settled share option expenses - - - - - (5,510) - - - - - - - (5,510) - - (5,510) Capital securities dividend - - - - - - - - - - - - (24,388) (24,388) - - (24,388)
At 31 December 2017 427,008 2,247,974 - 397,547 5,885 143,201 6,237 (566) 7,250 (70,613) - 5,609 (3,974,603) (805,071) 2,190 1,970 (800,911)
ReservesAttributable to equity holders of the parent
14

Noble Group LimitedFull Year Financial Statements And Dividend Announcement
1(d)(ii) Details of any changes in the company's share capital arising from rights issue, bonus issue, share buy-backs, exercise
of share options or warrants, conversion of other issues of equity securities, issue of shares for cash or as considerationfor acquisition or for any other purpose since the end of the previous period reported on. State also the number ofshares that may be issued on conversion of all the outstanding convertibles, as well as the number of shares held astreasury shares, if any, against the total number of issued shares excluding treasury shares of the issuer, as at the end ofthe current financial period reported on and as at the end of the corresponding period of the immediately precedingfinancial year
As at As at 31/12/2017 31/12/2016
Share’000 Share’000
ISSUED CAPITAL At 1 Jan 13,274,877 6,739,467 Rights issue of shares - 6,535,410 Share consolidation (11,947,393) - At 31 December 1,327,484 13,274,877
SHARE OPTIONS OUTSTANDING AT 31 DECEMBER 34,901 571,547
TREASURY SHARESAt 1 January 177,328 204,057 Share consolidation (132,197) - Share-based payment (45,131) (26,729) At 31 December - 177,328
On 3 June 2016, the Group announced a renounceable underwritten rights issue on the basis of one rights share for every one existing shareheld by entitled shareholders as at 30 June 2016. Shareholders approved the rights issue in the Special General Meeting held on 24 June2016. The rights issue was completed on 1 August 2016. Accordingly, the issued share capital excluding treasury shares was increased to13,070,819,124 shares of HK$0.25 each on 4 August 2016.
On 15 March 2017, the Group announced a share consolidation exercise pursuant to which the Company will consolidate every ten existingissued shares (including treasury shares) into one ordinary share of par value of HK$2.50 each in the share capital of the Company,fractional entitlements to be disregarded. Unissued shares were also consolidated on the same basis. Shareholders approved the shareconsolidation in the Special General Meeting held on 28 April 2017. On 11 May 2017, the share consolidation was completed.
1(d)(iii) To show the total number of issued shares excluding treasury shares as at the end of the current financial period and asat the end of the immediately preceding year
Total number of issued shares excluding treasury shares as at 31 December 2017 was 1,327,483,781 shares
(31 December 2016: 13,097,548,524 shares).
1(d)(iv) A statement showing all sales, transfers, disposal, cancellation and/or use of treasury shares as at the end of thecurrent financial period reported on
Please refer to the 1(d)(ii) above.
2 Whether the figures have been audited or reviewed, and in accordance with which auditing standard or practice
The financial statements have been audited, in accordance with Hong Kong Standards on Auditing.
3 Whether the figures have been audited or reviewed, the auditors' report (including any qualifications or emphasis ofmatter)
The independent Auditors' Report on the financial statements, as attached, is unqualified but includes an emphasis of matter with respectto a material uncertainty as to going concern.
4 Whether the same accounting policies and methods of computation as in the issuer's most recently audited annualfinancial statements have been applied
The accounting policies adopted are primarily consistent with those disclosed in the 2016 audited financial statements.
5 If there are any changes in the accounting policies and methods of computation, including any required by anaccounting standard, what has changed, as well as the reasons for, and the effect of, the change
Not applicable
Company
15

Noble Group LimitedFull Year Financial Statements And Dividend Announcement
6 Earnings per ordinary share of the group for the current financial period reported on and the corresponding period of
the immediately preceding financial year, after deducting any provision for preference dividends
Basic earnings/(loss) per share amounts are calculated by dividing the profit/(loss) for the period attributable to ordinary equity holders of theparent less capital securities dividend by the weighted average number of ordinary shares outstanding during the period.
Diluted earnings/(loss) per share amounts are calculated by dividing the loss for the period attributable to ordinary equity holders of theparent by the weighted average number of ordinary shares outstanding during the period plus the weighted average number of ordinaryshares that would be issued on the conversion of all the dilutive potential ordinary shares into ordinary shares.
The computations of basic and diluted earnings/(loss) per share are based on:
Continuing Discontinuedoperations operations Group
Earnings/(loss) US$'000 US$'000 US$'000
FY 2017Loss attributable to equity holders of the parent for basic and diluted earnings per share (3,884,799) (1,053,435) (4,938,234) Less: Capital securities dividend (24,388) - (24,388)
Adjusted loss attributable to ordinary equity holders of the parent for basic anddiluted earnings per share (3,909,187) (1,053,435) (4,962,622)
FY 2016Loss attributable to equity holders of the parent for basic and diluted earnings per share (47,578) 56,231 8,653
Less: Capital securities dividend (24,000) - (24,000)
Adjusted loss attributable to ordinary equity holders of the parent for basic anddiluted earnings per share (71,578) 56,231 (15,347)
Year ended Year ended31 Dec 2017 31 Dec 2016
Share'000 Share'000(restated)
Weighted average number of ordinary shares 1,309,253 1,083,136 Dilutive effect of share options - -
Weighted average number of ordinary shares adjusted for the dilutive effect 1,309,253 1,083,136
The effect of share consolidation and bonus element resulting from the rights issue has been included in the calculation of basic and dilutedearnings per share. Prior year basic and diluted earnings per share is adjusted in order to provide a comparable basis for the effect of rightsissue and share consolidation.
16
Noble Group LimitedFull Year Financial Statements And Dividend Announcement
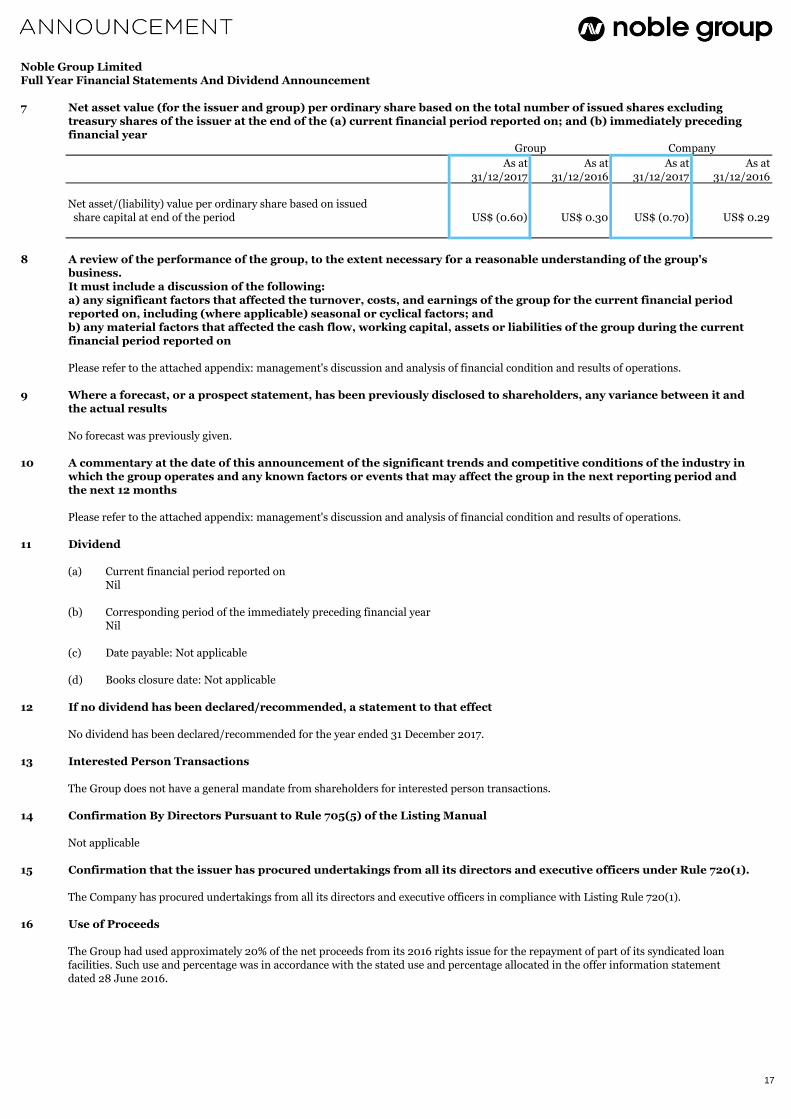
7 Net asset value (for the issuer and group) per ordinary share based on the total number of issued shares excluding
treasury shares of the issuer at the end of the (a) current financial period reported on; and (b) immediately precedingfinancial year
Group Company
As at As at As at As at 31/12/2017 31/12/2016 31/12/2017 31/12/2016
Net asset/(liability) value per ordinary share based on issued share capital at end of the period US$ (0.60) US$ 0.30 US$ (0.70) US$ 0.29
8 A review of the performance of the group, to the extent necessary for a reasonable understanding of the group'sbusiness.It must include a discussion of the following:a) any significant factors that affected the turnover, costs, and earnings of the group for the current financial periodreported on, including (where applicable) seasonal or cyclical factors; andb) any material factors that affected the cash flow, working capital, assets or liabilities of the group during the currentfinancial period reported on
Please refer to the attached appendix: management's discussion and analysis of financial condition and results of operations.
9 Where a forecast, or a prospect statement, has been previously disclosed to shareholders, any variance between it andthe actual results
No forecast was previously given.
10 A commentary at the date of this announcement of the significant trends and competitive conditions of the industry inwhich the group operates and any known factors or events that may affect the group in the next reporting period andthe next 12 months
Please refer to the attached appendix: management's discussion and analysis of financial condition and results of operations.
11 Dividend
(a) Current financial period reported onNil
(b) Corresponding period of the immediately preceding financial yearNil
(c) Date payable: Not applicable
(d) Books closure date: Not applicable
12 If no dividend has been declared/recommended, a statement to that effect
No dividend has been declared/recommended for the year ended 31 December 2017.
13 Interested Person Transactions
The Group does not have a general mandate from shareholders for interested person transactions.
14 Confirmation By Directors Pursuant to Rule 705(5) of the Listing Manual
Not applicable
15 Confirmation that the issuer has procured undertakings from all its directors and executive officers under Rule 720(1).
The Company has procured undertakings from all its directors and executive officers in compliance with Listing Rule 720(1).
16 Use of Proceeds
The Group had used approximately 20% of the net proceeds from its 2016 rights issue for the repayment of part of its syndicated loanfacilities. Such use and percentage was in accordance with the stated use and percentage allocated in the offer information statementdated 28 June 2016.
17
Noble Group LimitedFull Year Financial Statements And Dividend Announcement
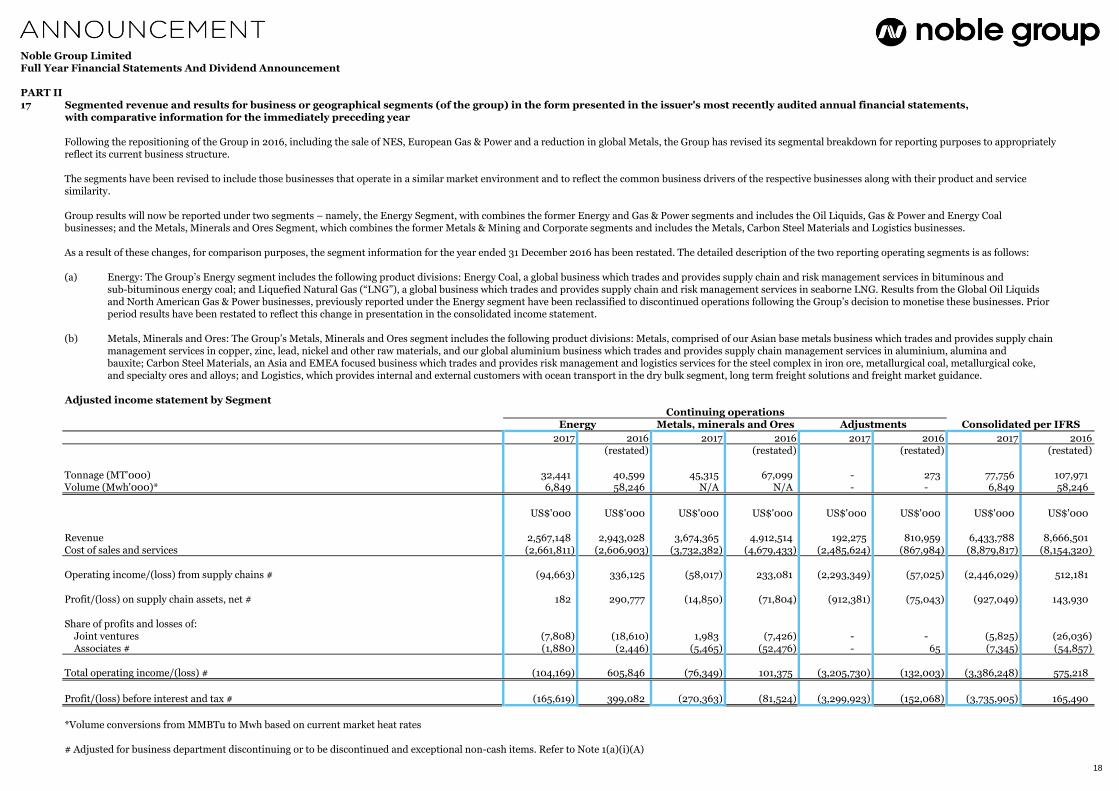
PART II17 Segmented revenue and results for business or geographical segments (of the group) in the form presented in the issuer's most recently audited annual financial statements,
with comparative information for the immediately preceding year
Following the repositioning of the Group in 2016, including the sale of NES, European Gas & Power and a reduction in global Metals, the Group has revised its segmental breakdown for reporting purposes to appropriatelyreflect its current business structure.
The segments have been revised to include those businesses that operate in a similar market environment and to reflect the common business drivers of the respective businesses along with their product and servicesimilarity.
Group results will now be reported under two segments – namely, the Energy Segment, with combines the former Energy and Gas & Power segments and includes the Oil Liquids, Gas & Power and Energy Coalbusinesses; and the Metals, Minerals and Ores Segment, which combines the former Metals & Mining and Corporate segments and includes the Metals, Carbon Steel Materials and Logistics businesses.
As a result of these changes, for comparison purposes, the segment information for the year ended 31 December 2016 has been restated. The detailed description of the two reporting operating segments is as follows:
(a) Energy: The Group’s Energy segment includes the following product divisions: Energy Coal, a global business which trades and provides supply chain and risk management services in bituminous andsub-bituminous energy coal; and Liquefied Natural Gas (“LNG”), a global business which trades and provides supply chain and risk management services in seaborne LNG. Results from the Global Oil Liquidsand North American Gas & Power businesses, previously reported under the Energy segment have been reclassified to discontinued operations following the Group’s decision to monetise these businesses. Priorperiod results have been restated to reflect this change in presentation in the consolidated income statement.
(b) Metals, Minerals and Ores: The Group’s Metals, Minerals and Ores segment includes the following product divisions: Metals, comprised of our Asian base metals business which trades and provides supply chainmanagement services in copper, zinc, lead, nickel and other raw materials, and our global aluminium business which trades and provides supply chain management services in aluminium, alumina andbauxite; Carbon Steel Materials, an Asia and EMEA focused business which trades and provides risk management and logistics services for the steel complex in iron ore, metallurgical coal, metallurgical coke,and specialty ores and alloys; and Logistics, which provides internal and external customers with ocean transport in the dry bulk segment, long term freight solutions and freight market guidance.
Adjusted income statement by Segment
2017 2016 2017 2016 2017 2016 2017 2016(restated) (restated) (restated) (restated)
Tonnage (MT'000) 32,441 40,599 45,315 67,099 - 273 77,756 107,971 Volume (Mwh'000)* 6,849 58,246 N/A N/A - - 6,849 58,246
US$'000 US$'000 US$'000 US$'000 US$'000 US$'000 US$'000 US$'000
Revenue 2,567,148 2,943,028 3,674,365 4,912,514 192,275 810,959 6,433,788 8,666,501 Cost of sales and services (2,661,811) (2,606,903) (3,732,382) (4,679,433) (2,485,624) (867,984) (8,879,817) (8,154,320)
Operating income/(loss) from supply chains # (94,663) 336,125 (58,017) 233,081 (2,293,349) (57,025) (2,446,029) 512,181
Profit/(loss) on supply chain assets, net # 182 290,777 (14,850) (71,804) (912,381) (75,043) (927,049) 143,930
Share of profits and losses of: Joint ventures (7,808) (18,610) 1,983 (7,426) - - (5,825) (26,036) Associates # (1,880) (2,446) (5,465) (52,476) - 65 (7,345) (54,857)
Total operating income/(loss) # (104,169) 605,846 (76,349) 101,375 (3,205,730) (132,003) (3,386,248) 575,218
Profit/(loss) before interest and tax # (165,619) 399,082 (270,363) (81,524) (3,299,923) (152,068) (3,735,905) 165,490
*Volume conversions from MMBTu to Mwh based on current market heat rates
# Adjusted for business department discontinuing or to be discontinued and exceptional non-cash items. Refer to Note 1(a)(i)(A)
Consolidated per IFRSAdjustmentsMetals, minerals and OresEnergyContinuing operations
18

Noble Group LimitedFull Year Financial Statements And Dividend Announcement
PART II18 In the review of performance, the factors leading to any material changes in contributions to turnover and
earnings by the operating segments
Please refer to the attached appendix: management's discussion and analysis of financial condition and results of operations.
19 A breakdown of the Group's sales
Year ended Year ended Increase/
31 Dec 2017 31 Dec 2016 (decrease)US$'000 US$'000 %
(restated)(a) Sales from continuing operation reported for the first half year 3,563,532 4,739,837 (25)
(b) Operating loss after tax before deducting minority interestsreported for the first half year (1,880,264) (14,472) 12,892
(c) Sales from continuing operation reported for the second half year 2,870,256 3,926,664 (27)
(d) Operating profit/(loss) after tax before deducting minority interestsreported for the second half year (3,059,090) 22,609 N/A
20 A breakdown of the total annual dividend (in dollar value) for the issuer's latest full year and its previous full year
Year ended Year ended
31 Dec 2017 31 Dec 2016US$'000 US$'000
(a) Ordinary - - (b) Capital securities 24,388 24,000
Total 24,388 24,000
21 Disclosure of person occupying a managerial position in the issuer or any of its principal subsidiaries who is arelative of a director or chief executive officer or substantial shareholder of the issuer pursuant to Rule 704(10)
During the year, there was no person occupying a managerial position in the Company or any of its principal subsidiaries who is arelative of a director or chief executive officer or substantial shareholder of the Company.
BY ORDER OF THE BOARD
Paul Jeremy BroughChairman28 February 2018
19