part three continuous particulate monitoring for … three - continuous particulate monitoring for...
TRANSCRIPT

PART THREE
Continuous Particulate Monitoring for PM2.5, PM10, and PMc


Chapter 7 Part Three - Continuous Particulate Monitoring for PM2.5, PMc and PM10
Table of Contents
Page
1.0 Introduction ........................................................................................................................ 1 1.1 Sampling Method Overview .......................................................................................... 1
2.0 Instrumentation .................................................................................................................. 4 2.1 Interferences ................................................................................................................... 4 2.2 Instrument Description ................................................................................................... 5
2.2.1 Control Unit............................................................................................................52.2.2 PM10 Inlet or PM2.5 Very Sharp Cut Cyclone.......................................................52.2.3 Sensor Unit .............................................................................................................5
2.3 Ancillary Equipment....................................................................................................... 5
3.0 Site Selection ....................................................................................................................... 6 3.1 Siting Requirements ....................................................................................................... 6 3.2 Site Safety and Security.................................................................................................. 7
4.0 Monitor Installation, Calibration, and Operation .......................................................... 8 4.1 Monitor Installation ........................................................................................................ 8 4.2 Calibration of Components............................................................................................. 9
4.2.1 Overview of Calibration Procedures ......................................................................94.2.2 TEOM Calibration Procedure ..............................................................................104.2.3 SHARP Calibration Procedure .............................................................................144.2.4 BAM Calibration Procedure.................................................................................164.2.5 API 602 Calibration Procedure ............................................................................17
4.3 Monitor Operation........................................................................................................ 18
5.0 Data Acquisition ............................................................................................................... 18
6.0 Data Validation................................................................................................................. 18
7.0 Verification and Performance Audit Procedures.......................................................... 21 7.1 Flow-Rate Verification and Performance Audit Procedures........................................ 21
7.1.1 Equipment ............................................................................................................217.2 Overview of Verification and Audit Procedures ........................................................ 223
7.2.1 TEOM Verification and Audit Procedure (for PM10) ..........................................237.2.2 BAM Verification and Audit Procedure ..............................................................247.2.3 SHARP Verification and Audit Procedure...........................................................25
7.3 Verification and Audit Data Reporting ........................................................................ 26 7.4 Verification and Audit Frequency ................................................................................ 26 7.5 Systems Audit............................................................................................................... 26
8.0 Precision and Accuracy Assessment ............................................................................... 26 8.1 Precision ....................................................................................................................... 26

8.2 Accuracy....................................................................................................................... 27
9.0 Maintenance...................................................................................................................... 27 9.1 Recommended Maintenance and Frequency................................................................ 27 9.2 As Needed Maintenance............................................................................................... 28
10.0 Forms ................................................................................................................................. 28
FORMS1 TEOM Calibration Form .................................................................................................... 29 2 TEOM® PM10 / PM2.5 Audit Form .................................................................................... 303 TEOM® PM10 / PM2.5 Verification Form .......................................................................... 31 4 BAM Calibration Form ...................................................................................................... 32 5 BAM Audit Form ............................................................................................................... 34 6 BAM Verification Form..................................................................................................... 35 7 SHARP Calibration Form .................................................................................................. 36 8 SHARP Audit Form ........................................................................................................... 389 SHARP Audit Form ........................................................................................................... 39 10 API 602 Calibration Form.................................................................................................. 40 11 API 602 Audit Form........................................................................................................... 41 12 API 602 Audit Form........................................................................................................... 42
FIGURES1 R&P TEOM.......................................................................................................................... 2 2 Met One BAM...................................................................................................................... 3 3 Thermo Scientific SHARP ................................................................................................... 34 Teledyne API 602 Beta Plus ................................................................................................ 4
TABLES1 Standard Sampler Configuration .......................................................................................... 4 2 Example of Minimum Sampler Siting Criteria .................................................................... 7 3 Data Validation Criteria ..................................................................................................... 19 4 Conversions ........................................................................................................................ 21 5 Recommended Maintenance & Frequencies ...................................................................... 27
PHOTOSInlet on Terre Haute Lafayette Ave Roof ....................................................................................... 8

Chapter 7 Part 3Revision No. 6
December 31, 2017Page 1 of 42
Part Three – Continuous Particulate Monitoring of PM2.5, PMc and PM10
1.0 Introduction
Traditional particulate monitoring uses pre-weighed filters on which particles are collected over a 24-hour period. This sampling method is labor intensive, requiring an operator to pick-up an exposed filter and install a new clean filter for each sample at each sampling site. Exposed filters must then be transported back to a laboratory for conditioning, weighing, data calculation, and data entry. Samples are normally collected in a one every three day frequency (intermittent sampling). Daily sampling still only produces a particulate concentration averaged over a 24-hour period.
The first continuous particulate monitors, installed in 1995 the Rupprecht and Patashnick (R&P) PM10 TEOM®,, were installed at two sites in northern Indiana. This was followed roughly 10 years later with the introduction of Met One’s BAM units, and more recently Thermo Environmental’s SHARP monitors and Teledyne API 602 Beta Plus samplers.
The Rupprecht and Patashnick uses a Tapered Element Oscillating Microbalance (TEOM®)methodology to continuously measure particulate matter mass concentrations. Met One utilizes a Beta Attenuation Monitor (BAM), while the Thermo Synchronized Hybrid Ambient Real-Time Particulate Monitor (SHARP) combines nephelometric and radiometric measurements into one instrument. All three have been designated as a USEPA equivalency for PM2.5 and PM10monitoring. The Teledyne API 602 Beta Plus (API 602) combines sequential sampling with automated mass measurements (utilizing beta attenuation), and has been designated as a USEPA equivalency method for PM2.5, PM10, as well as PM10-2.5.
1.1 Sampling Method Overview
Ambient air is drawn into sampler through an air inlet followed by an exchangeable filter cartridge or filter tape, where the particulate mass collects. The inlet system is equipped with a sampling head which separates particles of either a 2.5 μm or 10 μm diameter (PM2.5 or PM10). The sampled air proceeds through the sensor unit; microbalance for the TEOM, beta attenuation for the BAM and API 602, and hybrid nephelometer/beta attenuation for the SHARP.
A TEOM makes use of a microbalance system. As the sample stream moves into the microbalance system, it is heated to the temperature specified by the control unit. This heating minimizes the deposition of water due to changes in ambient humidity. The control unit contains a flow controller, which regulates the sample stream through the monitor at flow rates between0.5 and 6 liters per minute. A hollow tube is attached to a platform at its wide end (Tapered Element) and is vibrated at its natural frequency. As particulate matter gathers on the filter cartridge, the tube’s natural frequency of oscillation decreases. The electronic microbalance system continually monitors this frequency.
The BAM contains a small 14C element which emits a constant source of high energy electrons. These beta particles are detected and counted by a sensitive scintillation detector. An external

Chapter 7 Part 3Revision No. 6
December 31, 2017Page 2 of 42
pump pulls a measured amount of dust-laden air through a filter tape. After the filter tape is loaded with ambient dust, it is automatically placed between the source and the detector, thereby causing an attenuation of the beta particle signal. The degree of attenuation of the beta particle signal is used to determine the mass concentration of the particulate matter on the filter tape, hence the volumetric concentration of particulate matter in ambient air.
The SHARP incorporates a hybrid system utilizing two distinct measurement processes in one unit. The sample stream is first passed through the nephelometer where a sensor measures the light scattering caused by the particulate matter aerosol as it passes through an 880 nm illumination beam. Next the aerosol is deposited onto a filter tape. Here the instrument measures particulate concentrations by passing radiation through a known sample area to a detector, similar in principle to the BAM, refstandard.
The API 602 has two separate and independent sample flow controls, filter holders, sample lines, and inlets. They share one beta attenuation measuring system. The channels can be set up to sample PM2.5, PM10, or PM10-2.5 as well as a wide range of flow points. Particulate matter is collected on standard 47mm filters which are moved in pairs (both channels) for measurement. The instrument also has the ability to be set up as a conventional sequential sampler.
Figure 1R&P TEOM

Chapter 7 Part 3Revision No. 6
December 31, 2017Page 3 of 42
Figure 2Met One BAM
Figure 3Thermo Scientific SHARP

Chapter 7 Part 3Revision No. 6
December 31, 2017Page 4 of 42
Figure 4Teledyne API 602 Beta Plus
2.0 Instrumentation
IDEM uses TEOMs, BAMs, API 602s, and SHARPs for all continuous particulate data collection. Table 1 shows the standard configuration for each, as specified by the manufacturer.
Table 1Standard Sampler Configuration
Parameter TEOM BAM SHARP API 602
Total Flow
16.7 liters per min (1 m3/hr)
16.7 liters per min (1 m3/hr)
16.7 liters per min
(1 m3/hr)
16.7 liters per min
(1 m3/hr)
Sample Stream Temperature 50 °C 25 °C 25 °C
Variable (controlled to regulate
RH)
Particulate Matter Concentration
Measurement Range
< 5 μg/m3 to several μg/m3
0 to 1,000 μg/m3
0 to 1,000 μg/m3
0-2000μg/m3
2.1. Interferences
These highly accurate and precise instruments can be affected by a variety of outside forces. These include, but are not limited to: vibrations; electrical interferences – such as blackouts, brown outs, power spikes, and magnetic/electric fields; moisture, temperature, and improper siting.

Chapter 7 Part 3Revision No. 6
December 31, 2017Page 5 of 42
The temperature of the TEOM’s sample stream should be maintained within as narrow a range as possible. Large temperature fluctuations (7 to 8 °F per minute) of the sample stream may cause measurement accuracy to decrease. The decrease is due to the inlet system’s inability to adjust the temperature of the sample to the temperature specified by the software before traveling to the microbalance system. Both the BAM and SHARP have built-in heater assemblies on the down tube, between the sample inlet and instrument, to help moderate both temperature and relative humidity.
Very high background radiation levels can possibly affect the SHARP, BAM, and API 602, as they utilize an internal radiation emitting source.
2.2. Instrument Description
The four real-time particulate monitors, utilized by IDEM’s monitoring network, can be broken down into three parts: the control features, sensor, and inlet.
2.2.1 Control Unit
The control unit houses the following:
Mass flow controllers and the control electronics for operation.The main electrical and air connections to the main power supply, the auxiliary control, and the main vacuum pump/connections.The main power switch, status light, and the keypad for operation.
2.2.2 PM10 Inlet or PM2.5 Very Sharp Cut Cyclone
A PM10 inlet is designed to allow on in diameter to remain suspended in the sample air stream as long as the flow rate of the system is maintained at16.67 L/min. The inlet incorporates a rain and bug shield, and is used on the TEOM, SHARP, and BAM. Due to the set up and close proximity of the API 602’s downtubes, it utilizes a European style PM10 inlet. If the monitor is sampling PM2.5, a very sharp cut cyclone (VSCC) is placed in-line directly below the PM10 inlet and above the down tube. This cyclone further
into the sampler. This combination of PM10 inlet and VSCC is identical to that used in intermittent sampling.
2.2.2 Sensor Unit
The sensor unit houses the mass transducer (TEOM), beta attenuation monitor (BAM/SHARP/API602), or nephelometer (SHARP) sensing units and all included electronic circuit boards with the appropriate wiring for electricity and frequency signal output.
2.3. Ancillary Equipment
Listed below are several (but not inclusive) supplies required for operation of IDEM’s

Chapter 7 Part 3Revision No. 6
December 31, 2017Page 6 of 42
monitoring network:
Certified flow rate transfer standards (Bios, Chinook Streamline FTS kit, TriCal, or similar)Certified barometer (digital or aneroid)Certified thermometer (digital or liquid)Certified relative humidity meter (SHARP)Certified zero/span foil kit (SHARP)Laboratory and maintenance / logbooks and databaseManufacturer recommended spare partsStandard time piece of known accuracy within ±2 min/24hr
3.0 Site Selection
3.1. Siting Requirements
Basic siting criteria for the placement of ambient air samplers are documented in Table 2 in this section. This is not a complete listing of siting requirements; instead, an outline to be used by the operating agency to determine a sampler’s location. Complete siting criteria are presented in 40 CFR Part58, Appendix E. All sampling locations must meet the guidelines set forth in 40 CFR Part 50 Appendix L and Part 58 Appendix D as well as the siting guidelines outlined in Chapter 1, Section 4.0 of this manual.
As with any type of air monitoring study in which sample data are used to draw conclusions about a general population, the validity of the conclusions depends on the representativeness of the sample data. Therefore, the primary goal of a monitoring project is to select a site or sites where the collected particulate mass is representative of the monitored area.

Chapter 7 Part 3Revision No. 6
December 31, 2017Page 7 of 42
Table 2Example of Minimum Sampler Siting Criteria
Scale Height AboveGround
Distance from supportingstructure, meters Other spacing criteria
Vertical Horizontal a
Micro 2 to 7 meters >2 >2 1. Should be >20 meters fromtrees.
Middle, Neighborhood,
Urban, andRegional
2 to 15 meters >2 >2
2. Distance from sampler toobstacle, such as buildings, must be twice the height that the obstacle protrudes above the sampler.
a When the inlet is located on a rooftop, this separation distance is in reference to walls, parapets, or penthouses located on the roof.
3. Must have unrestricted airflow 270 degrees around the sampler inlet.4. No furnace or incineration flues should be nearby. b
b Distance depends on the height of the furnace or the incineration flues, type of fuel or waste burned, and quality of fuel (sulfur, ash, or lead content). This is to avoid undue influences from minor pollutant sources. As a precautionary measure, the sampler should be placed at least 5 meters from the furnace or the incinerator flue.
5. Spacing from roads varies with traffic(See 40 CFR 58, Appendix E).6. Sampler inlet is at least 2 m,but not greater than 4 m from any collocated sampler.(See 40 CFR 58, Appendix E).Sampler inlet is not greater than 1 m vertically from any collocatedsampler.(See 40 CFR 58, Appendix E).
3.2. Site Safety and Security
Additional factors not specified in the CFR must be considered in determining where the monitor is deployed. These factors include accessibility under all weather conditions, availability of adequate electricity, and security of the monitoring personnel and equipment. The monitor must be situated where the operator can reach it safely despite adverse weather conditions. If the monitor or part of the monitor (i.e., sample inlet) is located on a rooftop, care should be taken that the operator’s personal safety is not jeopardized by a slippery roof surface during inclement weather. Consideration also should be given to the fact that routine operation (i.e., calibration, maintenance, flow check, and audit) involves transporting supplies and equipment to and from the monitoring site.
To ensure that adequate power is available, consult the manufacturer’s instruction manual for the sampler’s minimum voltage and power requirements. Lack of a stable power source can result in the loss of data, because of power interruptions.

Chapter 7 Part 3Revision No. 6
December 31, 2017Page 8 of 42
The security of the sampler itself depends mostly on its location. Rooftop sites with locked access and ground-level sites with fences are common. In all cases, the security of the operating personnel as well as the sampler should be considered.
Photo 1Inlets on Terre Haute Lafayette Ave Roof
4.0 Monitor Installation, Calibration, and Operation
4.1. Monitor Installation
All site selections and installations shall comply with siting criteria presented in 40 CFR Part 58,Appendix E. Installation should also adhere to section 3.2 Site Safety and Security in this document. The following is a general guideline for instrument installation. More detailed instructions should be referenced in their corresponding manuals.
Once a site has been selected, and the instrument tested and found to be in working order:
1. Determine the exact location of the monitor and all included equipment, such as pumps. Care should be taken to allow room for both sample and electrical connections.

Chapter 7 Part 3Revision No. 6
December 31, 2017Page 9 of 42
The BAM, SHARP, and API 602 instruments must be placed directly below the down tube.The TEOM unit itself does not need to be directly below the down tube, but its sensor unit does.
2. Drill or use an existing opening in the structure’s roof to allow for the instrument’s down tube(s). In addition, mount the tripod or other down tube support structure, if needed, and the temperature/pressure sensor.
The TEOM also has a bypass flow line that is flexible, and can be routed through the shelter’s side or an existing port to alleviate the need for another hole in the roof.
3. Inside the shelter, mount the instrument on a rack using the appropriate hardware or place on a sturdy flat surface, such as a table or counter top.
Be sure to account for the down tube, as mentioned above.If not rack mounting, be sure to properly secure the instrument to account for vibrations.
4. Make all electrical, communication, and air connections. Be sure all packing material, shipping screws, and other similar materials have been removed prior to turning on the instrument.
5. Once installed, power on, allow instrument to warm up, and ensure that all functions are working properly.
4.2. Calibration of Components
4.2.1 Overview of Calibration Procedures
The following is a general guide to calibrating the continuous monitors used by IDEM. For more detailed instructions, refer to the specific monitor’s user manual and the IDEM OAQ instrument specific SOP.
Useful Formulas for Calibration/Verification/Audit Procedures:
Reference Flow
= +Where:
QRef = Reference flow (liters per minute)m = FTS Slope

Chapter 7 Part 3Revision No. 6
December 31, 2017Page 10 of 42
b = FTS Intercept= Manometer reading (H2O)
Tamb = Reference ambient temperature (K)Pamb = Reference ambient pressure (atm)
Temperature Conversion, Celsius to Kelvin= + 273 Where:
TK = Temperature in KelvinTC = Temperature in Celsius
Barometric Pressure Conversion, mmHg to atm
= 760Where:
Patm = Pressure in atmPmmhg = Pressure in mmHg
Flow Conversion, True to Standard= 298 760Qstd = Standard flow (liters per minute)Qtrue = True flow (liters per minute)Tamb = Reference ambient temperature (K)Pamb = Reference ambient pressure (mmHg)
To calculate Reference/Observed Flow Difference
= × 100Where:
QRef = Reference flow (liters per minute)QObs = Observed flow (liters per minute)Diff = Difference in percent
4.2.2 TEOM Calibration Procedure
Equipment required for calibration:
Certified thermometer/temperature probeCertified barometer

Chapter 7 Part 3Revision No. 6
December 31, 2017Page 11 of 42
Certified flow transfer standards (FTS, TriCal, deltaCal, or similar)Standard time piece of known accuracy within ±2 min/24hr.Flow audit adapter (leak check device)Pre-weighed calibration filterFilter exchange toolCalibration forms
Before calibrating the sensors, ensure the sampler time is within 1 minute of local standard time and the date is correct. If an adjustment is made, make note of this.
A. Ambient Air Temperature and Pressure Verification:1. Place a certified thermometer/temperature probe into the TEOM’s ambient temperature
sensor mount.
2. On the TEOM control panel, access the Set Temps/Flows screen. Arrow down until the Amb Temp and Amb Pres come into view.
3. Verify that the ambient temperature is within ±2.1 within ± 10.1mmHg of the transfer standards.
4. If either parameter falls outside the given range, an analog calibration is required. Refer to the TEOM service manual for more information on analog calibrations.
5. Ambient temperature and pressure verifications should be completed before a flow calibration/verification.
B. Leak Check:1. Disable the corresponding channel in the LEADS system.
2. Use the up and down arrow keys on the TEOM to view the main and total flow values.
3. Remove the inlet from the down tube. If present, leave the VSCC in place.
4. Attach a flow audit device to the down tube or very sharp cyclone and close the device.
5. Record the flow values shown on the TEOM on the calibration form. The main flow should be < 0.15 lpm, while total flow should be < 0.6 lpm. Return to the inlet, and slowly open and remove the flow audit device. Replace the inlet on the down tube or VSCC.
6. If the values are higher than the allowable standard, a non-linearity offset value (NOV) may be established. This is done by:
a. Repeat the first 4 steps of the leak check procedure. Slowly open the flow audit device.
b. Unplug the pump from the power supply.
c. Wait several minutes to let the flow rates stabilize, then close the flow audit device.
d. Record the flow values. Take the original values and subtract the NOV.

Chapter 7 Part 3Revision No. 6
December 31, 2017Page 12 of 42
e. Remove the flow audit device and replace the inlet.
f. Enable the corresponding channel in LEADS and leave an entry in electronic operator log.
C. Flow Verification/Calibration:1. Disable the corresponding channel in the LEADS system.
2. Perform a leak check using a flow audit adapter.
3. Locate the flow audit adapter and ensure that the valve of the adapter is in its open position.
4. Remove the size-selective inlet from the flow splitter and replace it with the flow audit adapter.
5. Make sure the flow audit adaptor is in the open position.
6. When in the Main screen, scroll down to the Main Flow and Aux Flow lines. These values represent the actual volumetric flows, as measured by the monitor’s flow controllers.
7. Confirm that these flows are within ± 2% of their set points (3.0 L/min for the Main Flow and 13.67 L/min for the Aux Flow). Any greater deviation may indicate that the in-line filters are plugged or other blockages exist in the system.
8. Attach a reference flow meter to the top of the flow audit adapter.
9. Read the total flow (approximately 16.67 L/min) on the reference flow meter. The total volumetric flow measured by the reference flow meter must be 16.67 ± 1.0 L/min to be acceptable.
10. Disconnect the bypass flow line from the bypass extension on the bottom of the flow splitter located at the sample inlet.
11. Cap the exit of the flow splitter bypass extension with the 3/8-inch Swagelok cap.
12. Read the main flow (approximately 3.0 L/min) on the reference flow meter. The volumetric flow measured by the reference flow meter must be 3.0 ± 0.2 L/min to be acceptable.
13. If the flow readings are within acceptable limits, remove the 3/8-inch Swagelok cap from the flow splitter bypass extension.
14. Install the bypass flow line onto the flow splitter bypass extension.
15. Perform a leak check.
16. Remove the flow audit adapter from the top of the flow splitter.
17. Install the sample inlet onto the flow splitter.
18. Install a new TEOM filter into the mass transducer.
19. Press <F1> or <Run>.
20. Enable the corresponding channel in LEADS and leave an entry in electronic operator log.

Chapter 7 Part 3Revision No. 6
December 31, 2017Page 13 of 42
D. Mass Transducer Calibration Verification:
1. From any screen press 17<Enter> to access the K0 Confirmation screen. Confirm the Calibration Constant shown on the “Set Hardware” Screen is the same as that shown on the nameplate, located on the left side of the mass transducer support cage.
2. Warm up the system with any filter cartridge that is not the calibration filter, so that all the temperatures are at their normal operating conditions for at least one hour. The airflow through the system should be at its normal value, at or near 16.67 L/min combined main/auxiliary flows, during this period.
3. Disable the corresponding channel on the LEADS system. Enter the Setup Mode on the control unit by pressing the keypad Data Stop. Turn off the air tube heater by setting the set point to 0 on the “Set Temps/Flows” Screen.
4. Unplug the vacuum pump, so there is no flow through the instrument. This prevents particulate contamination of the calibration filter.
5. Scroll through the Menu Screen (using “Stop” Screen and the down arrow on the keypad of the control unit) and select the last item, KO Confirmation.
6. When KO Confirmation is selected, the following screen will appear:
7. Use the down arrow keypad to move to the Filt Wght. Input the weight of the preweighed calibration filter, as recorded on the kit data, on the line labeled Filt Wght, by pressing the Edit keypad and then the value.
8. Open the mass transducer and remove the media filter from the tip of the tapered element,using the filter exchange procedure. Close the mass transducer and sensor unit door. Operate the system without a filter and wait for the oscillating frequency shown in the upper right-hand corner of the screen to reach a maximum value. Observe the frequency output next to K0 confirm on the first line of the K0 Confirmation screen. The frequency will increase, peak, and then start to decrease in value. When the frequency peaks, press the First/Last keypad (in the center of the arrow keys) to record this frequency value in the first slot of the third line of the screen. (Note: If you miss the peak you can open and close the transducer again, and observe the frequency a second time to catch the peak value.)
9. Remove the filter tool and filter box containing the calibration filter.
(Note: The calibration tool can be distinguished from a normal filter tool by its red handle. Do NOT use the calibration filter tool to remove or install any filters except for the calibration filter.)
10. Install the calibration verification filter, with the filter exchange tool provided with the calibration kit, in the instrument. Note that the filter exchanges are normally performed with

Chapter 7 Part 3Revision No. 6
December 31, 2017Page 14 of 42
the pump on to help the filter become properly seated on the tapered element. Since the pump is not on, take special care to ensure that the filter is properly seated. Close the mass transducer and sensor unit door. Return the calibration tool immediately to the kit and reseal the bag. Again, watch the frequency output and the control unit’s screen, when it peaks to reach a new maximum value.
11. Press the <First/Last> key again to record the frequency f1.
12. The instrument then automatically computes and displays the audit value of the calibration constant, K0, on the line entitled Audit K0. An example of the final screen display is as follows.
13. The K0 confirmation screen also displays the current K0 value entered in the monitor, and the percentage difference between the audit and currently entered value. The indicateddifference should not be more than 2.5% from the original R&P calibration constant.
14. Press F1 to leave the TEOM in OK. Enable the corresponding channel in LEADS and leave an electronic operator log.
4.2.3 SHARP Calibration Procedure
Equipment required for calibration:
Certified thermometer/temperature probeCertified barometerCertified flow transfer standards (FTS, TriCal, deltaCal, or similar)Flow audit adapter (leak check device)Standard time piece of known accuracy within ±2 min/24hr.Certified relative humidity meterCertified zero/span foil kitHEPA filter/adapterCalibration forms
Prior to beginning the SHARP calibration, ensure the instrument is operating properly. If the internal sample temperature sensor is to be calibrated, allow the instrument to operate at least one hour with the heating system turned OFF. Also, ensure the sampler time is within 1 minute of local standard time and the date is correct. If adjustment is made, make note of this.
A. Temperature, Relative Humidity, and Barometric Pressure Sensor Calibration1. Enter the Calibration Menu. Press SET to input the calibration menu code. Change the code

Chapter 7 Part 3Revision No. 6
December 31, 2017Page 15 of 42
to 4 using the + and - soft keys.
2. Press the YES key to perform a 1 point calibration of the barometric pressure, relative humidity, and all of the temperature sensors.
3. Obtain a reference ambient temperature by placing a certified temperature probe or thermometer near the SHARP ambient temperature sensor. Input the reference reading into the ambient (T1) temperature calibration screen using the + and - keys.
4. Repeat the process for T2 (Sample Temp), T3 (Orifice Temp), and T4 (Heater Temp). Reference temperature values can be obtained by measuring the shelter temperature. Allow an hour for T2, T3, and T4 to equilibrate with each other and the shelter temperature, with the heating system off, before taking a reading.
5. Perform a relative humidity calibration by placing the reference meter’s probe into the sample chamber and closing the door. Allow approximately one hour for equilibration. Input the reading into the relative humidity calibration screen.
6. Input the barometric pressure reading obtained from a certified barometer into the calibration screen.
B. Sample Flow Calibration1. Before beginning a flow calibration, ensure that the pump is turned off. Remove the inlet and
attach a certified flow transfer standard.
2. Turn the pump on through the calibration menu.
3. Press the CAL soft key to input the calibration coefficient using the + and - keys.
4. Adjust the indicated flow rate to match the certified transfer standard using the + and - keys. Allow at least 30 seconds between adjustments for flow equilibration.
5. Repeat the process until the indicated flow is within ±2.1% of the certified transfer standard.
C. Mass Foil Calibration1. Enter the Foil Calibration screen through the calibration menu and press the YES soft key.
2. Enter the span foil value, as noted on the span foil in the certified foil calibration kit, using the + and - soft keys. Once the correct value is displayed press NEXT.
3. After the beta attenuation chamber opens, cut the filter tape, and pull out from the chamber. Insert the foil holder into the chamber. It should click into place. Once in place, press NEXT.
4. Once the chamber closes, insert the zero foil into the foil holder, press NEXT. The zeroing process should take approximately 200 seconds to complete.
5. With the zero complete, remove the foil and replace with the span foil. After pressing NEXT wait another 200 seconds for the span point to run.
6. A screen showing the old and new mass calibration factors will be displayed. Press YES to change the factors.

Chapter 7 Part 3Revision No. 6
December 31, 2017Page 16 of 42
7. After the chamber opens again, remove the foil and foil holder. Replace the filter tape, ensuring proper placement through the chamber and across the rollers.
8. Perform a FC+Z (filter change and zero) by pressing the FC+Z soft key before returning the instrument to service.
D. Nephelometer Zero and Calibration1. Install the HEPA filter on the inlet.
2. Enter the Nephelometer calibration screen through the calibration menu and press the YES soft key.
3. Allow the instrument to run several minutes allowing the nephelometer to stabilize. Press the ZERO soft key to begin the zeroing process. This is an automated process that should last less than two minutes.
4. Once the calibration is complete, exit the calibration menu, lock the keypad, and return the instrument to normal service. Enable the corresponding LEADS channel and leave an electronic operator log entry.
4.2.4 BAM Calibration Procedure
Equipment required for calibration:
Certified thermometer/temperature probeCertified barometerCertified flow transfer standards (FTS, TriCal, deltaCal, or similar)Standard time piece of known accuracy within ±2 min/24hr.Calibration forms
Before attempting a calibration, ensure that the BAM has been powered on and allowed to warm up for at least an hour.
1. Disable the corresponding LEADS channel.
2. Ensure the sampler time is within 1 minute of local standard time and the date is correct. If adjustment is made, make note of this.
3. Obtain a reference ambient temperature reading by placing a certified temperature probe or thermometer near the BAM’s ambient temperature sensor. Use a certified barometer to note the ambient barometric pressure.
4. On the BAM’s control panel, enter the TEST> FLOW menu. Use the NEXT soft key to highlight the AT field. Input the reference temperature obtained in the previous step. Repeat the process to input the barometric pressure in the BP field.
5. Remove the PM10 inlet and install the certified transfer standard. If the BAM is sampling PM2.5, leave the VSCC in place. Return to the control panel and use the NEXT soft key to move to the first flow point of 15 L/min. The pump will start automatically. Allow the BAM to equilibrate. Input the reference flow reading and press the CAL soft key to correct the

Chapter 7 Part 3Revision No. 6
December 31, 2017Page 17 of 42
BAM’s reading.
6. Repeat the process for the other two calibration flow levels. The BAM will not change to match until all three points have been entered.
7. Replace the PM10 inlet on the down tube.
8. Exit the TEST>FLOW menu and leave the BAM in Normal mode.
9. Enable the corresponding LEADS channel and leave an electronic operator log.
4.2.5 API 602 Calibration Procedure
Equipment required for calibration:
Certified thermometer/temperature probeCertified barometerCertified flow transfer standards (FTS, TriCal, deltaCal, or similar)Accurate time pieceCalibration forms
Before calibrating the sensors, ensure the sampler time is within 1 minute of local standard time and the date is correct. If adjustment is made, make note of this.
1. Disable the LEADS channel.2. Place the certified flow transfer standard onto the sample line of the intended channel.3. Ensure the instrument is in READY status. Press ENTER then SELECT until Instrument
Tools menu is showing.4. Select the pneumatic circuit (Channel) to be calibrated using the SELECT button. Press enter
to confirm.5. Select Line A Manual Span Test or Line B Manual Span Test and press ENTER.6. Insert a filter into the Loader and press ENTER.7. Press ENTER again to turn the vacuum pump on.8. Regulate the valve opening until the certified flow standard has stabilized on the intended
flow.9. Record the values displayed for V, Qs, Qi, and Qref.
Where:V = regulation valve position compared with the zero positionQs = flow rate value measured by the instrument standard conditionsQi = inlet volumetric flow rate value measured using shelter temperatureQref = indicated flow using the certified flow transfer standard
10. Repeat the previous steps for all points along the chosen flow range.11. Press ESC to stop the calibration procedure.12. Repeat the process for the other channel.

Chapter 7 Part 3Revision No. 6
December 31, 2017Page 18 of 42
4.3. Monitor Operation
Each monitor should be operated in accordance with the user’s manual. In general, each should:
1. Be properly sited (refer to section 3 in this part).
2. Be connected to a reliable power source.
3. Have a valid calibration prior to collecting usable data.
5.0 Data Acquisition
Data is collected and stored using the Leading Environmental Analysis and Display System (LEADS) data logging system.
Disable data logger during maintenance, calibrations, and audits. This prevents erroneous results from being considered valid by LEADS.
6.0 Data Validation
Data validation criteria were developed from the instruments’ operation manual recommendations and from staff’s operational experience.

Chapter 7 Part 3Revision No. 6
December 31, 2017Page 19 of 42
Table 3Data Validation Criteria
Verification/Audit Limits and Actions (different instrument thresholds are noted)
Flow Rate:Limit Action
PM2.5 < ±4.1% of transfer standard;
PM2.5 < ±5.1% of design valuePM10 Verification < ±7.1% of
transfer standardPM10 Audit < ±10.1% of transfer
standard
Data valid. Flow in-calibration.Flows for PM10transfer standard.
PM2.5 ±4.1% of transfer standard;
PM2.5 of design flowPM10 Verification ±7.1% of
transfer standardPM10 Audit ±10.1% of transfer
standard
Data invalid for verification. Invalid period back to last good flow check. Calibration is performed.Data suspect for audit and must be confirmed by verification.
Leak Check (TEOM for PM10)Limit Action
L/min Data valid. Pass, no action.
Main Flow > 0.15 L/min
Data invalid for verification. Invalid period back to last good leak check. Maintenance performed followed by another leak check.Data suspect for audit and must be confirmed by verification.
L/min Data valid. Pass, no action.
Aux Flow > 0.60 L/min
Data invalid for verification. Invalid period back to last good leak check. Maintenance performed followed by another leak check.Data suspect for audit and must be confirmed by verification.
Leak Check (BAM)

Chapter 7 Part 3Revision No. 6
December 31, 2017Page 20 of 42
Limit Action
< 1.5 L/min Data Valid. Pass, no action.
1.5 L/min
Data invalid for verification. Invalid period back to last good leak check. Maintenance performed followed by another leak check.Data suspect for audit and must be confirmed by verification.
Leak Check (API 602)Limit Action
External 15.l mL/min Data valid. Pass, no action.
External > 15.l mL/min
Data invalid for verification. Invalid period back to last good leak check. Maintenance performed followed by another leak check.Data suspect for audit and must be confirmed with verification.Data valid. Pass, no action.
Internal > 5.l mL/min
Data invalid for verification. Invalid period back to last good leak check. Maintenance performed followed by another leak check.Data suspect for audit and must be confirmed with verification.
Temperature and Barometric Pressure:< ±2.1 °C Data valid. Pass, no action
±2.1 °C Data valid. Site operator recalibrates temperature sensor.< ±10.1 mmHg Data valid. Pass, no action
±10.1 mmHg Data valid. Site operator recalibrates barometric pressure sensor.

Chapter 7 Part 3Revision No. 6
December 31, 2017Page 21 of 42
7.0 Verification and Performance Audit Procedures
The primary goal of a verification and auditing program is to identify problems that may result in suspect or invalid data. The verification checks are performed by the operating agency, who also performs the calibrations. Audits must be performed by another group independent of the group performing the calibrations. Verifications and performance audits should be conducted under the following guidelines:
Audits must be done without special preparation or adjustments made to the system.The individual performing the audit must be someone other than the routine operator and must have a thorough knowledge of all instruments or processes being evaluated.All aspects of the verification and audit must be completely documented including the types of instruments and transfer standards, model numbers and serial numbers of instruments and transfer standards, calibration information, etc.The samplers in the state of Indiana’s ambient monitoring network have verifications performed monthly by the Ambient Monitoring Section, and audits performed quarterly by the Quality Assurance Section.
Audits should start at the beginning of an hour or at least completed during the hour to minimize data loss.
7.1 Flow-Rate Verification and Performance Audit Procedures
7.1.1 Equipment
Chinook Engineering Streamline flow transfer standards (FTS).Certified digital manometer.Certified digital or aneroid barometerCertified temperature probe(s) or thermometer(s)Accurate time pieceRelative humidity meter (SHARP)Certified zero/span foil kit (SHARP)Temperature sensor dummy wires (SHARP)
Equations
Table 4Conversions
mmHg to atmospheres (atm) mmHg/760atm to mmHg atm*760
°C to Kelvin (K) °C + 273
True Flow Calculation

Chapter 7 Part 3Revision No. 6
December 31, 2017Page 22 of 42
= +Where:
Qtrue = True flow rate, m3/min= Manometer pressure drop (in Hg)
Pamb = Ambient barometric pressure, mmHgTamb = Ambient temperature Km = FTS slopeb = FTS intercept
% = ( ) 100Where:
Qtrue = True flow rate, m3/minQob = Observed (sampler) flow rate, m3/min
If the sampler requires the conversion of actual/standard flow, use the following equation:
Qstd = Qa(Pa/Pstd)(Tstd/Ta)
Qa = Qstd(Pstd/Pa)(Ta/Tstd)
Where:Qstd = Standard volume flow rate, m3/minQa = Actual volume flow rate, m3/minPa = Ambient barometric pressure, mmHgPstd = Standard barometric pressure, 760 mmHgTstd = Standard temperature, 298 K (25 oC + 273)Ta = Ambient temperature, K (°C + 273)
Relative Humidity (SHARP) calculation
= × .Where:
RHT2 = SHARP Relative Humidity in %RHRef = Reference Relative Humidity in %TRef = Reference Ambient Temperature in KT2 = SHARP Sample Temperature in K
Difference, in Percent calculation

Chapter 7 Part 3Revision No. 6
December 31, 2017Page 23 of 42
= × 100Where:
VRef = Reference ValueVObs = Observed ValueDiff = Difference in percent
7.2 Overview of Verification and Audit Procedures
The following is only a general guide. For more detailed, sampler specific instructions, refer to the user’s manual and instrument specific SOPs. For each sampler, ensure the sampler time is within 5 minutes of local standard time and the date is correct. If not, site operators performing the verification should make adjustments and document this, while auditors should make note and contact the site operator.
7.2.1 TEOM Verification and Audit Procedure (for PM10)1. Place a certified temperature probe or thermometer near the TEOM’s temperature sensor
and allow to equilibrate.
2. Measure and record on the TEOM verification/audit form the ambient temperature (°C) and ambient barometric pressure (mmHg). Allow sufficient time for the temperature probe to equilibrate to ambient conditions and ensure that the probe is not in direct sunlight or not in contact with any surfaces. The TEOM’s ambient temperature should be within 2.0°C while the barometric pressure should be within 10.0 mmHg of the reference values collected.
3. On the control unit, note the observed ambient temperature and pressure. Record the TEOM status/mode, serial number, filter loading, date and time, and the last calibration date.
4. Disable the corresponding LEADS channel and press F1 on the TEOM keypad to flag the data. Note the start time.
5. Access the sample inlet and remove the inlet by gently twisting and lifting. Place a certified flow transfer standard on the down tube. The use of a separate high (total flow) and low (main flow) flow FTS may be required. Allow the flow to equilibrate.
6. Record the pressure drop. Note the TEOM indicated flow. The total indicated flow should be within 10.0% of the reference flow for the audit; greater than ± 7.0% is valid, but will require a recalibration; and within 7.0% of the reference flow for the verification.
7. Remove the green auxiliary line and plug the port.
8. Once more, allow the flow to equilibrate, record the pressure drop, and note the TEOM indicated flow. The TEOM indicated main flow should be ±0.2 L/min of the reference.
9. Remove the plug and reattach the green auxiliary line.

Chapter 7 Part 3Revision No. 6
December 31, 2017Page 24 of 42
10. Remove the flow transfer standard and replace with a flow audit device for a leak check. Close the flow audit device.
11. Record the flow values for the main and total flows. The main flow value should be< 0.15 L/min, the total flow < 0.6 L/min.
12. Remove the flow audit device and replace the inlet.
13. Enable the corresponding LEADS channel and leave an electronic operator log entry.
7.2.2 BAM Verification and Audit Procedure1. A BAM verification/audit should be initiated while the unit is in
SAMP/COUNT/COUNTING mode.
2. Place a certified temperature probe or thermometer near the BAM’s temperature sensor and allow to equilibrate. Ensure that the probe is not in direct sunlight or not in contact with any surfaces.
3. Measure and record on the BAM Audit Form the ambient temperature (°C) and ambient barometric pressure (mmHg). The BAM’s ambient temperature should be within 2.0°C,while the barometric pressure should be within 10.0 mmHg of the reference values collected.
4. On the control unit, note the observed ambient temperature and pressure. This can be accessed by pressing the F1 Current key.
5. Press the EXIT soft key and record the BAM status/mode, serial number, filter tape remaining, date and time, and the last calibration date.
6. Disable the corresponding LEADS channel.
7. On the BAM control unit, press the TEST soft key to access the TEST menu. Use the left/right arrows to select PUMP and enter the PUMP screen.
8. The pump should be off before starting a flow audit.
9. Remove the inlet head and attach a certified flow transfer standard. If a VSCC is present, leave in line.
10. Return to the control unit and press the PUMP ON soft key. Note the BAM’s indicated flow.
11. Collect a reference flow from the certified flow transfer standard. The BAM should bewithin 4% of the reference flow and 5% of the design value. Contact the site operator if it fails.
12. Return to the control unit and press the PUMP OFF soft key.
13. Remove the certified transfer standard and attach a flow audit device to begin a leak check.
14. Return to the control unit and press the PUMP ON soft key. The indicated flow should be<1.5 L/min. Contact site operator if it fails.

Chapter 7 Part 3Revision No. 6
December 31, 2017Page 25 of 42
15. Press the PUMP OFF soft key. Slowly open and then remove the flow audit device. Replace the inlet.
16. Return to the control unit and press the EXIT soft key twice to get back to the main menu. Select the OPERATE soft key to move to the Operate Mode screen. Ensure that the BAM OPERATE and STATUS commands are ON.
17. Press the NORMAL soft key to return the instrument to normal operation. It should now show the Normal display screen.
18. Enable the corresponding LEADS channel and leave an electronic operator log entry.
7.2.3 SHARP Verification and Audit Procedure1. Check for any status/error lights and ensure that the instrument is in working order.
2. Measure and record on the Sharp Verification/Audit Form the ambient temperature (°C)and barometric pressure (mmHg). Allow sufficient time for the temperature probe to equilibrate to ambient conditions and ensure that the probe is not in direct sunlight or not in contact with any surfaces. The SHARP’s ambient temperature should be within 2.0°C of the reference value. The SHARP’s barometric pressure should be within 10.0 mmHg of the reference value.
3. Disable the corresponding LEADS channel. Note the start time
4. The SHARP ambient temperature (T1) can be reached through the Operation/Temperature Control System Menu. The ambient barometric pressure (P3) is accessed through the Service Menu / Hardware Diagnostics Menu.
5. For the audit check performed 6 months after an annual calibration, all temperatures and the relative humidity will be checked, as well as the mass foil and nephelometer zero. These procedures are performed like the annual calibration except no adjustments are made (see SHARP calibration procedure in this chapter or consult the instrument manual). All of the temperatures should be within 2.0°C of the reference value and for relative humidity 3.0% RH of the reference value.
6. The SHARP relative humidity and sample temperature values can be found in the Diagnostics Menu.
7. Remove the relative humidity meter, if performed and the temperature probe.
8. Enter the Calibration Menu and unlock the keys. Use the calibration code to unlock theCalibration Menu and enter the Air Flow Menu to turn the pump off.
9. Exit the Calibration Menu and enter the Service Menu. Under the Hardware Diagnostics submenu note the P1 (orifice pressure) and P2 (vacuum pressure) values, which should be close to zero.
10. Remove the inlet from the down tube. If a VSCC is present, leave in place.
11. Attach a certified flow transfer standard to the down tube. Turn the pump on and allow flow to equilibrate for at least 5 minutes.

Chapter 7 Part 3Revision No. 6
December 31, 2017Page 26 of 42
12. The SHARP indicated flow can be viewed in the Calibration Menu / Air Flow Menu.
13. Compare the SHARP indicated flow with the reference and record on the SHARP Verification/Audit Form. The values should be within 4%. The reference flow should be within 5.0% of the design value.
14. Exit and return to the Calibration Menu / Air Flow Menu and turn the pump off.
15. Remove all verification/audit equipment. Record the operational pump power in the Display Menu.
16. Lock the keys pad and return the instrument to operation. Note the end time, enable the corresponding LEADS channel, and leave an entry in the electronic operator log.
7.3 Verification and Audit Data Reporting
Inform the site or network operator of the verification and audit results as soon as possible after completion. A paper copy may be forwarded to the operator or personnel may view the results in the database. If the audit produces poor results, the auditor should promptly inform the operator verbally and in written form (memo or e-mail).
7.4 Verification and Audit Frequency
The Indiana Department of Environmental Management conducts verifications of all real-timeparticulate monitors in its network at least once each month and audits quarterly to ensure minimal data loss.
7.5 Systems Audit
A system audit is a review of the total monitoring process from site location, safety, sampling to final analysis, and data reporting; and includes an on-site inspection. System audits are generally done at the initial set up of a network and on an annual or on an as needed basis thereafter. The specific guidelines and procedures for this type of audit are found in Chapter 15 of this manual, Quality Systems Audit Criteria and Procedures for Evaluating Ambient Air Monitoring Networks.
8.0 Precision and Accuracy Assessment
8.1 Precision
Precision is the measure of mutual agreement among individual measurements of the same property, usually under prescribed similar conditions. Precision is estimated by the use of a duplicate or collocated sampler at a selected monitoring location in a measurement network. One sampler is designated as the reporting sampler and one sampler is designated as the collocated sampler. The collocated sampler must be maintained, operated, calibrated, and audited in the same manner as the reporting sampler. Precision is calculated from the difference in the concentrations from the reporting and collocated samplers over a calendar quarter.
Chapter 7 Part 3Revision No. 6
December 31, 2017Page 27 of 42
8.2 Accuracy
The accuracy of the network is measured by auditing the flow rate performance of the samplers in the network. The percentage difference between the audit flow rate and the sampler flow rate is used to determine accuracy. Two flows rates are audited on the R&P TEOM® monitor: the main flow which is approximately 3 L/min and the total flow which is approximately 16 L/min. Only the total flow is used to estimate accuracy. Accuracy calculations are described in detail in 40 CFR Part 50, Appendix L, CFR Part 50, Appendix A.
The USEPA requires that 25 percent of the samplers within a reporting organization’s network be audited for accuracy each quarter. To improve accuracy estimates, additional accuracy flow rate audits may be conducted each calendar quarter. IDEM OAQ QAS audits all continuous PM2.5/PM10 samplers in its monitoring network at least once each quarter. This audit frequency provides additional accuracy, flow rate data, and ensures minimal data loss due to“out-of-calibration” conditions.
9.0 Maintenance
Routine preventive maintenance helps prevent failures of the monitoring processes. The overall objective is to increase measurement reliability and prevent data loss. Follow the manufacturer’s recommended guidelines for routine maintenance procedures.
Maintenance records must be kept for each sampler or instrument. These records should contain a history of the sampler, including all replacement parts, suppliers, costs, installation dates, etc.
9.1 Recommended Maintenance and Frequency
Table 5Recommended Maintenance and Frequencies
Maintenance FrequencyClean PM10 or PM2.5 inlet MonthlyLarge bypass in-line filter exchange 6 monthsBattery test 6 months – change if necessaryPump test 6 months (or pump power >95% in SHARP)Clean air inlet system 1 yearRebuild pump 1 year – or as needed

Chapter 7 Part 3Revision No. 6
December 31, 2017Page 28 of 42
9.2 As Needed Maintenance
Exchange fusesClock adjustmentResetting systemSystem software download
10.0 Forms
*Continuous PM10 and PM2.5 monitoring use the same calibration and audit forms.

Chapter 7 Part 3Revision No. 6
December 31, 2017Page 29 of 42
Form 1TEOM Calibration Form
Chapter 7 Part 3Revision No. 6
December 31, 2017Page 30 of 42
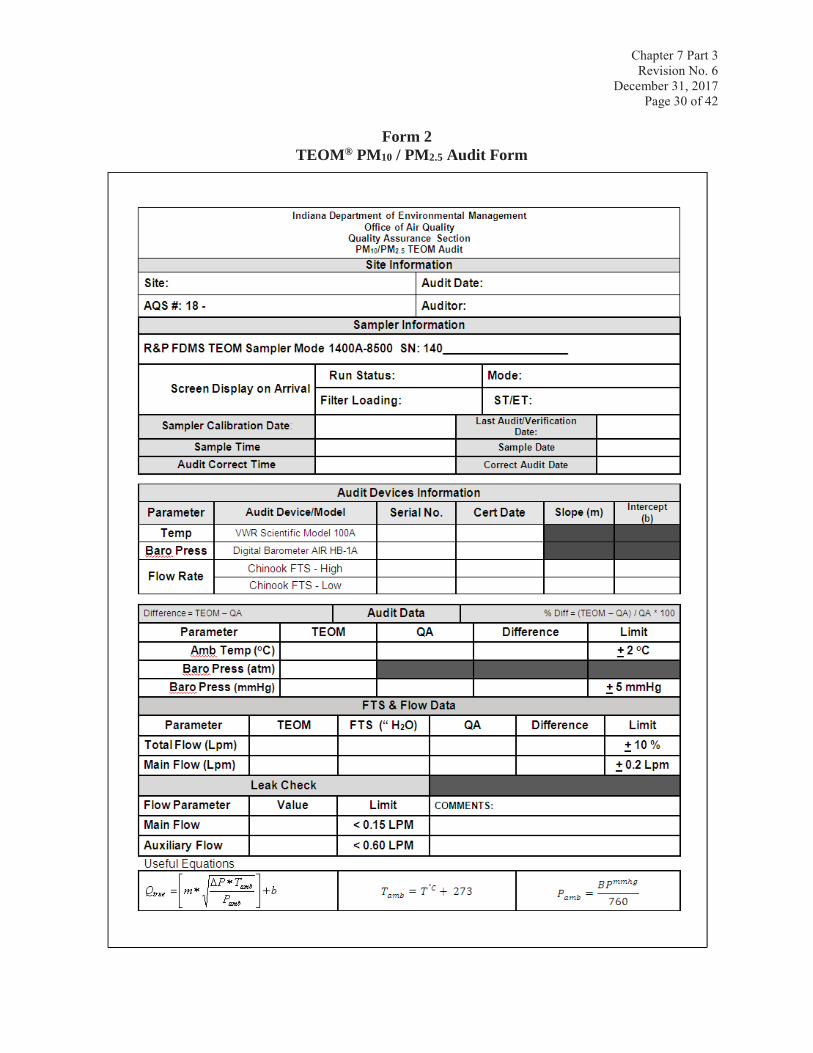
Form 2TEOM® PM10 / PM2.5 Audit Form

Chapter 7 Part 3Revision No. 6
December 31, 2017Page 31 of 42
Form 3TEOM® PM10 / PM2.5 Verification Form

Chapter 7 Part 3Revision No. 6
December 31, 2017Page 32 of 42
Form 4:BAM Calibration Form

Chapter 7 Part 3Revision No. 6
December 31, 2017Page 33 of 42
BAM Calibration Form (Continued)

Chapter 7 Part 3Revision No. 6
December 31, 2017Page 34 of 42
Form 5BAM Audit Form

Chapter 7 Part 3Revision No. 6
December 31, 2017Page 35 of 42
Form 6BAM Verification Form

Chapter 7 Part 3Revision No. 6
December 31, 2017Page 36 of 42
Form 7SHARP Calibration Form

Chapter 7 Part 3Revision No. 6
December 31, 2017Page 37 of 42
SHARP Calibration Form (Continued)

Cha
pter
7 P
art 3
Rev
isio
n N
o. 6
Dec
embe
r 31,
201
7Pa
ge 3
8of
42
Form
8SH
AR
P A
udit
Form

Chapter 7 Part 3Revision No. 6
December 31, 2017Page 39 of 42
Form 9SHARP Verification Form

Cha
pter
7 P
art 3
Rev
isio
n N
o. 6
Dec
embe
r 31,
201
7Pa
ge 4
0of
42
Form
10
API
602
Cal
ibra
tion
Form

Cha
pter
7 P
art 3
Rev
isio
n N
o. 6
Dec
embe
r 31,
201
7Pa
ge 4
1of
42
Form
11
API
602
Aud
itFo
rm
Line
B P
M2.
5 Fl
ow A
udit
Site
:A
udito
r:A
QS
No.
Dat
e:A
PI 6
02 i
ndic
ated
flow
, m3 /h
our
=0.
00L/
min
Inst
rum
ent
Mod
el N
o.:
Sta
rt Ti
me:
Am
b. T
emp,
(°C
)=
273.
15K
Ser
ial N
o.:
End
Tim
eA
mb.
Pre
ss, m
mH
g=
0.00
00at
mM
anom
eter
, in.
H2O
Aud
it E
quip
men
tP
aram
eter
Aud
it D
evic
eS
eria
l No.
Cer
t Dat
eS
lope
Inte
rcep
tA
PI
QA
% D
iffLi
mit
Pas
s/Fa
ilFl
owC
hino
ok F
TSFl
ow R
ate,
L/m
in0.
00#D
IV/0
!#D
IV/0
!±
4%#D
IV/0
!A
mbi
ent P
ress
ure
Dig
ital B
arom
eter
Am
bien
t Tem
pV
WR
Sci
entif
ic 1
00A
War
ning
/Ala
rm L
ED
sLi
ne A
(PM
10)
Lim
itP
ass/
Fail
< 5
PA
SS
Qre
fQ
test
% D
iffLi
mit
Pas
s/Fa
ilFl
ow, N
m3 /h
r±
4%P
AS
SAm
bien
t Tem
pera
ture
Aud
itLi
ne B
(PM
2.5)
AP
I Am
bien
t Tem
pK
°CLi
mit
Pas
s/Fa
il<
5P
AS
SA
PI
QA
Ta
Lim
itP
ass/
Fail
Am
bien
t Tem
p, K
027
3.15
-273
.15
± 2
FAIL
Qca
lQ
test
% D
iffLi
mit
Pas
s/Fa
ilFl
ow, N
m3 /h
r±
4%P
AS
S
Ambi
ent P
ress
ure
Aud
it
AP
I Am
b. P
ress
ure
kPa
mm
Hg
Lim
itP
ass/
Fail
AP
IQ
ALi
mit
Pas
s/Fa
il<
15P
AS
SA
mb
Pre
ss.,
mm
Hg
0.0
0.0
0.0
± 10
P
AS
SLi
mit
Pas
s/Fa
il<
15P
AS
S
AP
I 602
ind
icat
ed fl
ow, m
3 /hou
r=
0.00
L/m
inD
esig
n Fl
ow C
ompa
rison
Des
ign
Flow
:16
.67
Am
b. T
emp,
(°C
)=
273.
15K
Am
b. P
ress
, mm
Hg
=0.
0000
atm
QA
Flo
w%
Diff
Lim
itP
ass/
Fail
Man
omet
er, i
n. H
2OLi
ne A
(PM
10)
#DIV
/0!
#DIV
/0!
± 5%
#DIV
/0!
AP
IQ
A%
Diff
Lim
itP
ass/
Fail
Line
B (P
M2.
5)#D
IV/0
!#D
IV/0
!±
5%#D
IV/0
!Fl
ow R
ate,
L/m
in0.
00#D
IV/0
!#D
IV/0
!±
4%#D
IV/0
!Co
mm
ents
API 6
02 Q
uarte
rly A
udit
Line
B (P
M2.
5), m
L/(m
in*k
Pa)
Line
A (P
M10
) and
Lin
e B
(PM
2.5)
Inte
rnal
Che
cks
(che
ck in
tern
al fl
ow if
flow
aud
it fa
ils)
Exte
rnal
Lea
k C
heck
s
QA
Am
bien
t Tem
p
QA
Am
bien
t Pre
ssur
e
Line
A P
M10
Flo
w A
udit
Inte
rnal
Lea
k, m
L/(m
in*k
Pa)
Inte
rnal
Lea
k, m
L/(m
in*k
Pa)
Line
A (P
M10
), m
L/(m
in*k
Pa)

Chapter 7 Part 3Revision No. 6
December 31, 2017Page 42 of 42
Form 12API 602 Verification Form