participation in the supplemental -...
TRANSCRIPT
David H. Finifter and Mark A. Prell
Economic Research Service
Economic Research Report Number 157
November 2013
United States Department of Agriculture
Participation in the Supplemental Nutrition Assistance Program (SNAP) and Unemployment Insurance: How Tight Are the Strands of the Recessionary Safety Net?
SNAP UISNAP & UI

Economic Research Service www.ers.usda.gov
The U.S. Department of Agriculture (USDA) prohibits discrimination in all its programs and activities on the basis of race, color, national origin, age, disability, and, where applicable, sex, marital status, familial status, parental status, religion, sexual orientation, genetic information, political beliefs, reprisal, or because all or a part of an individual’s income is derived from any public assistance program. (Not all prohibited bases apply to all programs.) Persons with disabilities who require alternative means for communication of program information (Braille, large print, audiotape, etc.) should contact USDA’s TARGET Center at (202) 720-2600 (voice and TDD).
To file a complaint of discrimination write to USDA, Director, Office of Civil Rights, 1400 Independence Avenue, S.W., Washington, D.C. 20250-9410 or call (800) 795-3272 (voice) or (202) 720-6382 (TDD). USDA is an equal opportunity provider and employer.
United States Department of Agriculture
Visit our website for more information on this topic: www.ers.usda.gov/topics/ food- nutrition-assistance/supplemental-nutrition-assistance-program-(snap).aspx
Access this report online: www.ers.usda.gov/publications/err-economic-research-report/err157.aspx
Download the charts contained in this report:
• Go to the report’s index page www.ers.usda.gov/publications/ err-economic-information-bulletin/err157.aspx
• Click on the bulleted item “Download err157.zip”
• Open the chart you want, then save it to your computer
Recommended citation format for this publication:
Finifter, David H., and Mark A. Prell. Participation in the Supplemental Nutrition Assistance Program (SNAP) and Unemployment Insurance: How Tight Are the Strands of the Recessionary Safety Net?, ERR-157. U.S. Department of Agriculture, Economic Research Service, November 2013.
Cover image: Thinkstock

United States Department of Agriculture
Economic Research Service
Economic Research Report Number 157
November 2013
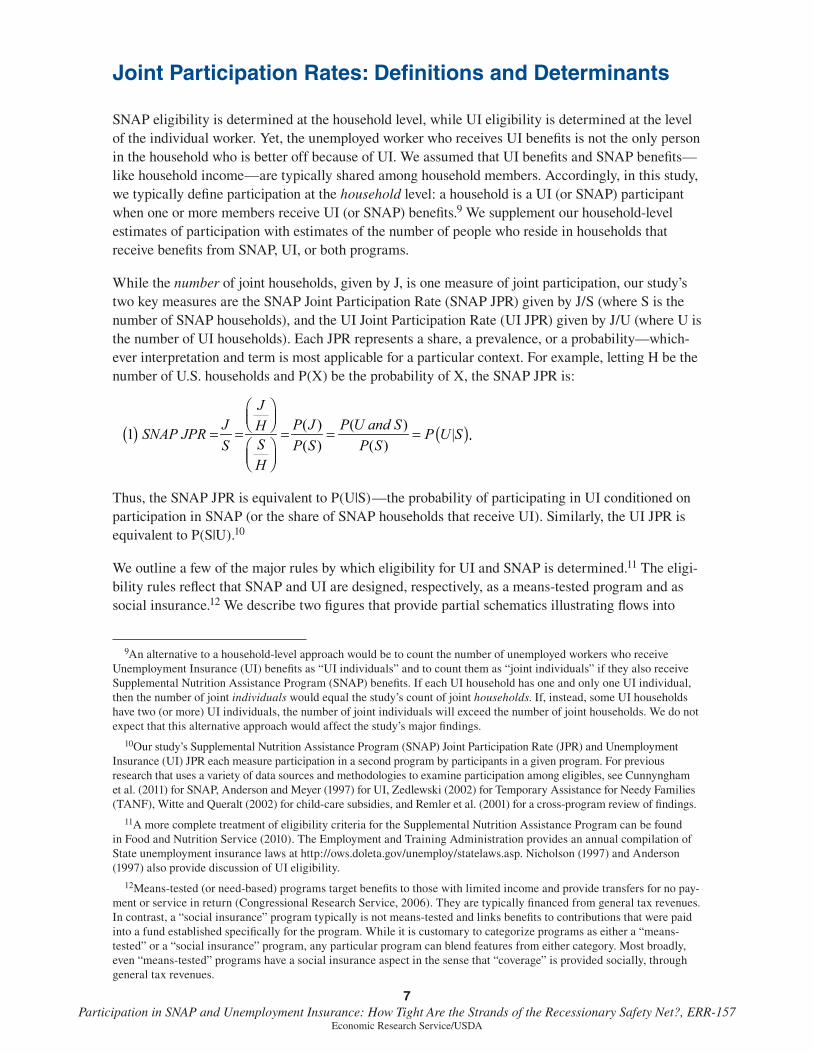
AbstractThis report provides nationally representative annual estimates for 2004-09 of households’ multi-program or “joint” participation patterns in both the Supplemental Nutrition Assistance Program (SNAP) and the Unemployment Insurance (UI) program, including breakouts of household types categorized by household income relative to poverty, race/ethnicity, and education level. SNAP and UI are two strands of the Nation’s recessionary safety net—the subset of safety-net programs for which participation is responsive to the business cycle. Using data from the Annual Social and Economic (ASEC) Supplement to the Current Population Survey, the study found that an estimated 14.4 percent of SNAP households also received UI at some time in 2009 (a recessionary year), an increase of 6.6 percentage points from 2005 (a full-employment year). Conversely, an estimated 13.4 percent of UI households also received SNAP in 2009, an increase of 2.3 percentage points from 2005. SNAP households with lower annual income relative to poverty or with householders who did not complete high school were relatively less likely to also have UI, indicating that these populations were relatively more likely to rely on SNAP benefits alone (without UI).
Keywords: SNAP, Supplemental Nutrition Assistance Program, Unemployment Insurance, UI, multi-program participation, social safety net, recessionary safety net
About the AuthorsDavid H. Finifter is Professor of Economics (Emeritus) at the College of William and Mary. Mark A. Prell is a Senior Economist in the Food Economics Division of the Economic Research Service, U.S. Department of Agriculture.
AcknowledgmentsThe authors thank Constance Kelly of the College of William and Mary for research assistance and Christopher O’Leary of the W.E. Upjohn Institute, David Stevens of University of Baltimore, and Margaret Andrews, John Kirlin, Mark Nord, Laura Tiehen, and Michele Ver Ploeg of USDA, Economic Research Service for their comments and reviews of this report. We also thank Susmita Pendurthi and Cynthia A. Ray for editorial and design assistance.
David H. Finifter and Mark A. Prell
Participation in the Supplemental Nutrition Assistance Program (SNAP) and Unemployment Insurance: How Tight Are the Strands of the Recessionary Safety Net?

ii Participation in SNAP and Unemployment Insurance: How Tight Are the Strands of the Recessionary Safety Net?, ERR-157
Economic Research Service/USDA
Contents
Summary . . . . . . . . . . . . . . . . . . . . . . . . . . . . . . . . . . . . . . . . . . . . . . . . . . . . . . . . . . . . . . . . . . . . . iii
SNAP and Unemployment Insurance as Two Strands of the Recessionary Safety Net . . . . . . .1
Joint Participation Rates: Definitions and Determinants . . . . . . . . . . . . . . . . . . . . . . . . . . . . . . .7
Data and Methodology . . . . . . . . . . . . . . . . . . . . . . . . . . . . . . . . . . . . . . . . . . . . . . . . . . . . . . . . . . 16
Recession Increased SNAP, UI, and Joint Participation . . . . . . . . . . . . . . . . . . . . . . . . . . . . . . . 19
Recessionary Caseloads and Changes in Joint Participation Rates . . . . . . . . . . . . . . . . . . . . . .23
Joint Participation by Household Income Relative to Poverty . . . . . . . . . . . . . . . . . . . . . . . . . .27
Joint Participation by Race/Ethnicity . . . . . . . . . . . . . . . . . . . . . . . . . . . . . . . . . . . . . . . . . . . . . .32
Joint Participation by Education Level . . . . . . . . . . . . . . . . . . . . . . . . . . . . . . . . . . . . . . . . . . . . .35
Conclusion . . . . . . . . . . . . . . . . . . . . . . . . . . . . . . . . . . . . . . . . . . . . . . . . . . . . . . . . . . . . . . . . . . . .38
References . . . . . . . . . . . . . . . . . . . . . . . . . . . . . . . . . . . . . . . . . . . . . . . . . . . . . . . . . . . . . . . . . . . .40
Appendix 1 . . . . . . . . . . . . . . . . . . . . . . . . . . . . . . . . . . . . . . . . . . . . . . . . . . . . . . . . . . . . . . . . . . . .44
www.ers.usda.gov
The U.S. Department of Agriculture’s Supplemental Nutrition Assistance Program (SNAP) provides nutrition assistance to low-income individuals and households that meet certain eligibility criteria. The Unemployment Insurance (UI) program of the U.S. Department of Labor (DOL) provides financial support to experienced workers who become unemployed through no fault of their own. SNAP and UI are two strands of the recessionary safety net—the subset of safety-net programs for which participation responds countercyclically. Economic downturns result in wider eligibility and participation in the two programs, increasing expenditures on program benefits. During the 2007-09 recession, some households received benefits from only one of these programs, while others received benefits from both SNAP and UI (joint participation).
What Is the Issue?
Households that participate jointly in both programs can improve their ability to sustain food expenditures, nutrition, and overall standard of living during times of economic challenge. To what extent do SNAP or UI households receive benefits from the other program? How is joint participation affected by changing macroeconomic conditions? What types of SNAP households tend to rely on SNAP alone, without UI, even in the midst of recession? This report answers these and related questions by examining participation patterns at the national level across 2004-09 and across households categorized by annual income relative to poverty, race/ethnicity, and education. Findings may inform efforts by local SNAP and UI offices to enhance cross-program access for eligible participants.
What Did the Study Find?
• The recession not only increased the number of SNAP households but also altered the mix of participating households. An estimated 14.4 percent of SNAP households also received UI at some point in 2009 (a recessionary year)—nearly double the estimate of 7.8 percent in 2005 (a full-employment year). During a recession, households with tight labor market connections (their members have work histories and earnings sufficient to meet UI-eligibility requirements upon unemployment) become a larger component of the SNAP caseload, increasing the overall share of SNAP households that also receive UI.
United States Department of Agriculture
A report summary from the Economic Research Service November 2013
ERS is a primary source of economic research and
analysis from the U.S. Department of Agriculture, providing timely informa-
tion on economic and policy issues related to agriculture, food, the environment,and
rural America.
Find the full report at www.ers.usda.
gov/publications/err-economic-research-report/err-157.aspx
David H. Finifter and Mark A. Prell
Economic Research Service
Economic Research Report Number 157
November 2013
United States Department of Agriculture
Participation in the Supplemental Nutrition Assistance Program (SNAP) and Unemployment Insurance: How Tight Are the Strands of the Recessionary Safety Net?
SNAP UISNAP & UI
David H. Finifter and Mark A. Prell
Participation in the Supplemental Nutrition Assistance Program (SNAP) and Unemployment Insurance: How Tight Are the Strands of the Recessionary Safety Net?

• An estimated 13.4 percent of UI households also received SNAP at some point in 2009, an increase of about one-fifth over the estimate of 11.1 percent from 2005.
• The share of SNAP households that also receive UI initially increases with householder education until reaching a plateau for households with a high school diploma or greater. Conversely, SNAP-only participa-tion—receipt of SNAP benefits without any support from the UI system— is greatest for households with less than 9th grade education: 92 percent of this subgroup of SNAP households participated in SNAP alone, with no support from the UI system at any time during the year. Thus, households that are most prone to rely on SNAP alone are the least well-off, most vulnerable households as measured by education.
• UI households’ participation in SNAP decreases as education levels increase—e.g., UI households with a bach-elor’s degree or higher are less likely to also receive SNAP than those without a high school diploma.
• Below-poverty SNAP households tend to rely on SNAP alone, without UI, more than SNAP households with higher annual income relative to poverty.
How Was the Study Conducted?
This study used household data on SNAP receipt and UI receipt, as well as household characteristics, from the Annual Social and Economic (ASEC) Supplement, which is administered by the U.S. Census Bureau each year in February, March, and April as a supplement to the monthly Current Population Survey (CPS). The study used an annual timeframe that treats a household as a SNAP, UI, or joint participant if the household was supported by benefits from SNAP, UI, or both programs at some time during a given year (not necessarily in the same month).
www.ers.usda.gov
JPRs for SNAP and UI programs are responsive to economic conditions, 2004-09
Note: The Supplemental Nutrition Assistance Program (SNAP) Joint Participation Rate (JPR) is the share of SNAP households that also receive Unemployment Insurance (UI) benefits. The UI JPR is the share of UI households that also receive SNAP benefits. Sources: JPRs were calculated using data from the U.S. Census Bureau’s Annual Social and Economic Supplement to the Current Population Survey for reference years 2004-09. The unemployment rate is the annual average of the seasonally adjusted civilian unemployment rate among all civilian workers, as reported in table B-42 of the Economic Report of the President, 2011.
Percent
8.47.8
7.06.0
9.8
14.4
10.111.1 10.5
9.5
12.0
13.4
5.55.1 4.6 4.6
5.8
9.3
0
2
4
6
8
10
12
14
16
2004 05 06 07 08 09
UI Joint Participation Rate
SNAP Joint Participation Rate
Unemployment rate

1 Participation in SNAP and Unemployment Insurance: How Tight Are the Strands of the Recessionary Safety Net?, ERR-157
Economic Research Service/USDA
Participation in the Supplemental Nutrition Assistance Program (SNAP) and Unemployment Insurance: How Tight Are the Strands of the Recessionary Safety Net?
David H. Finifter and Mark A. Prell
SNAP and Unemployment Insurance as Two Strands of the Recessionary Safety Net
This report examines multi-program participation patterns for the U.S. Department of Agriculture’s (USDA) Supplemental Nutrition Assistance Program (SNAP) and the Unemployment Insurance (UI) program of the U.S. Department of Labor (DOL). The research was motivated by the 2007-09 recession and the recognition that households may receive benefits from more than one government program as they try to put together the resources to get them through times of economic challenge. The recession was the longest of the post-WWII era and unemployment increased sharply (Bureau of Labor Statistics, 2010). The economic downturn increased SNAP participation and UI participa-tion, with SNAP providing food assistance to households that meet certain eligibility criteria and UI providing financial support to experienced workers who become unemployed through no fault of their own. The study examined the extent to which the recession increased joint participation—multi-program participation in both SNAP and UI.1
The study focused on household-level analysis under the assumption that a household’s pooled resources—including household income, SNAP benefits, and UI benefits—are shared among the members of a household, touching the lives of everyone in the household. A SNAP, UI, or joint household is defined as a household in which (one or more) members receive benefits from, respec-tively, SNAP, UI, or both programs. Because participation is measured at the household level, these households may also be referred to as SNAP, UI, or joint participants, respectively. The report’s participation rates (for one program or for both programs jointly) are also primarily measured at the household level; the denominators for various participation rates involve U.S. households, SNAP households, and UI households.2
The severity of the recent recession, and the lingering unemployment in its aftermath, have focused attention on the roles of various government support programs in providing a safety net during a
1To conduct programmatic research on joint participation in the Supplemental Nutrition Assistance Program (SNAP) and Unemployment Insurance (UI) before and during the recent recession, the Economic Research Service (ERS) has partnered with several research organizations, some of which examine SNAP and UI receipt using administrative data from selected States. This study is a component of the ERS SNAP-UI research program.
2For our study, we defined the term “participation” to refer to receipt of a program benefit paid by the Supplemental Nutrition Assistance Program (SNAP), by Unemployment Insurance (UI) or, for joint participation, by both programs. In some contexts, employed workers may be deemed to be “participants” in the UI system if they would be eligible to receive UI benefits upon losing the job through no fault of the worker. We use the term “UI covered” rather than the term “UI participant” to describe these workers.

2 Participation in SNAP and Unemployment Insurance: How Tight Are the Strands of the Recessionary Safety Net?, ERR-157
Economic Research Service/USDA
period of economic challenges. The study distinguished between two concepts of a safety net. In the broadest sense, the social safety net includes the whole set of programs, both means-tested and social insurance programs, that aim to protect individuals and households with cash, in-kind benefits, and certain tax expenditures such as the Earned Income Tax Credit. To contrast with that full array of programs, the study developed the concept of the recessionary safety net—the subset of social safety-net programs for which participation is counter cyclical, expanding during economic downturns and shrinking during times of economic growth.3 A program in the recessionary safety net performs two related functions that can be described as “well-being and stabilization” or as “micro and macro.” First, the program fosters well-being at the microeconomic level of the partici-pating household, with government support for program participation increasing during a reces-sion. Second, during a recession, with national participation expanding and the national total of the program’s benefits rising, the program helps lift aggregate household spending and keeps the macro-economic downturn from being as severe as it would have been in the absence of the program (see box, “SNAP and UI as Macroeconomic Stabilizers”).
It is well known that SNAP participation and UI participation each increased in the 2007-09 recession. However, little is known about SNAP-UI joint participation—the combined receipt of benefits from both programs. Among the programs in the recessionary safety net, SNAP and UI have two features that make studying their joint participation patterns an especially promising area for programmatic research. First, SNAP and UI are relatively large, with millions of participants in each. Second, the dollar values of SNAP benefits and UI benefits can account for a large share of a participating house-hold’s resources, supporting its well-being when earnings or other resources are low.4
The study addressed two broad, interrelated issues:
(1) joint participation in both SNAP and UI, and
(2) the lack of joint participation; the absence of joint participation can be no less important than its presence.
The study addressed the first issue because joint participants can improve their opportunities to sustain a household’s food expenditures, nutrition, and overall standard of living by receiving benefits from both SNAP and UI. From the perspectives of USDA and DOL, and many who are concerned about the well-being of those with low income and who face unemployment, it is programmatically impor-tant to foster joint participation among those who are eligible for benefits from both programs. The importance given by USDA and DOL to promoting joint participation is conveyed in a Training and Employment Notice issued in March 2009 by the Employment and Training Administration (ETA), the DOL agency responsible for administering UI at the Federal level. The Notice stated that ETA and the Food and Nutrition Service (FNS), the USDA agency that administers SNAP at the Federal level, “are working to ensure that the nation’s unemployed and under-employed workers are aware of the full range of income assistance available to them and their families during this difficult economic period... Food assistance is one more valuable resource to support unemployed or under-employed individuals.” (Employment and Training Administration, 2009, pp. 1-2).
3Although our study focuses only on the Supplemental Nutrition Assistance Program and Unemployment Insurance, other Federal programs are potentially in the recessionary safety net. These include Temporary Assistance for Needy Families (TANF), Supplemental Security Income for disabled adults and children who have limited income, and Medicaid.
4This report investigates participation in the Supplemental Nutrition Assistance Program and Unemployment Insur-ance without examining the amounts of benefits. Future research could potentially examine the household benefits levels of the two programs, singly and in combination.
3 Participation in SNAP and Unemployment Insurance: How Tight Are the Strands of the Recessionary Safety Net?, ERR-157
Economic Research Service/USDA
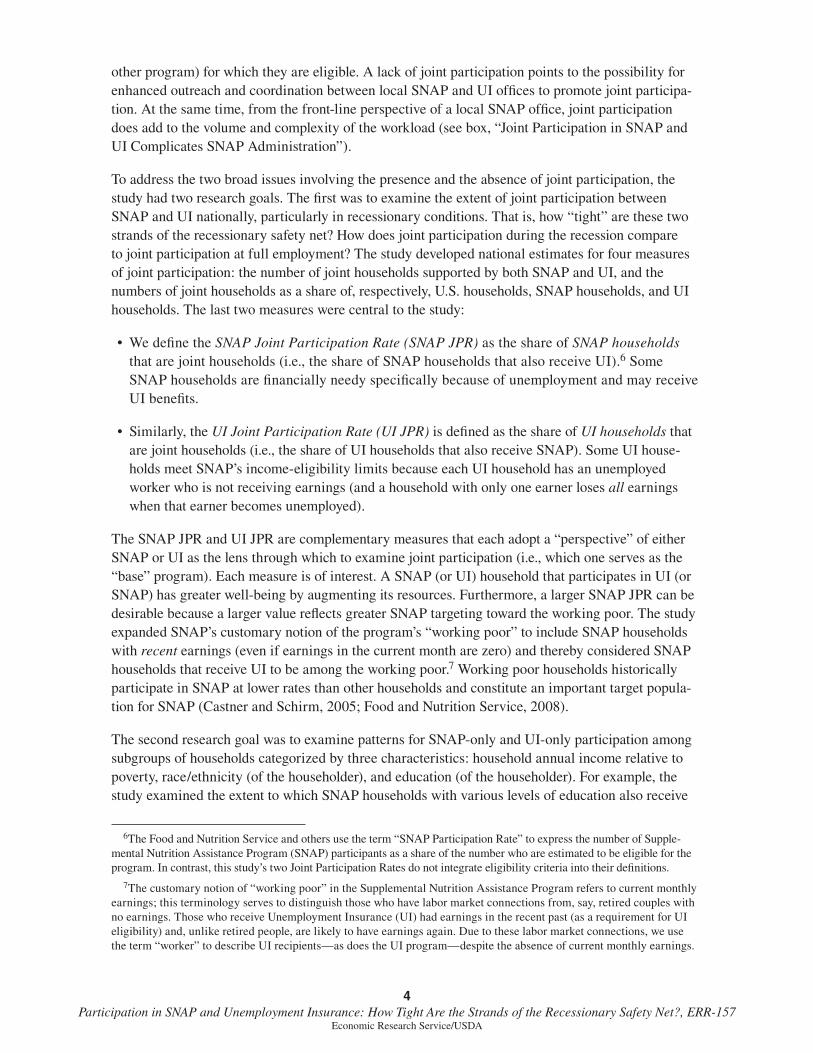
Our study addressed the second issue—the lack of joint participation—by identifying SNAP-only households (SNAP households that do not receive UI) and UI-only households (UI households that do not receive SNAP).5 The lack of joint participation can be a targeting and distributional issue. For example, when examining the most vulnerable households that have the least income or the least education, the extent to which they are SNAP-only households captures their reliance on SNAP alone (without UI benefits). For SNAP-only households, SNAP is an especially critical resource as potentially the largest source of government support—and perhaps the only source (depending on participation in programs besides UI, such as cash welfare, housing assistance, etc., which this report does not examine). Relatedly, the existence of SNAP-only or UI-only households points to a possible “gap in the safety net” if some households are not receiving program benefits (from the
5Supplemental Nutrition Assistance Program (SNAP) or Unemployment Insurance (UI) participants may receive benefits from government programs besides SNAP or UI, but these programs were not part of our SNAP-UI study. For studies that examine relationships between UI and Temporary Assistance for Needy Families (TANF), see O’Leary and Kline (2008, 2010). See Cole and Lee (2004) for a study that examines multi-program participation in SNAP and the Special Supplemental Nutrition Program for Women, Infants, and Children (WIC).
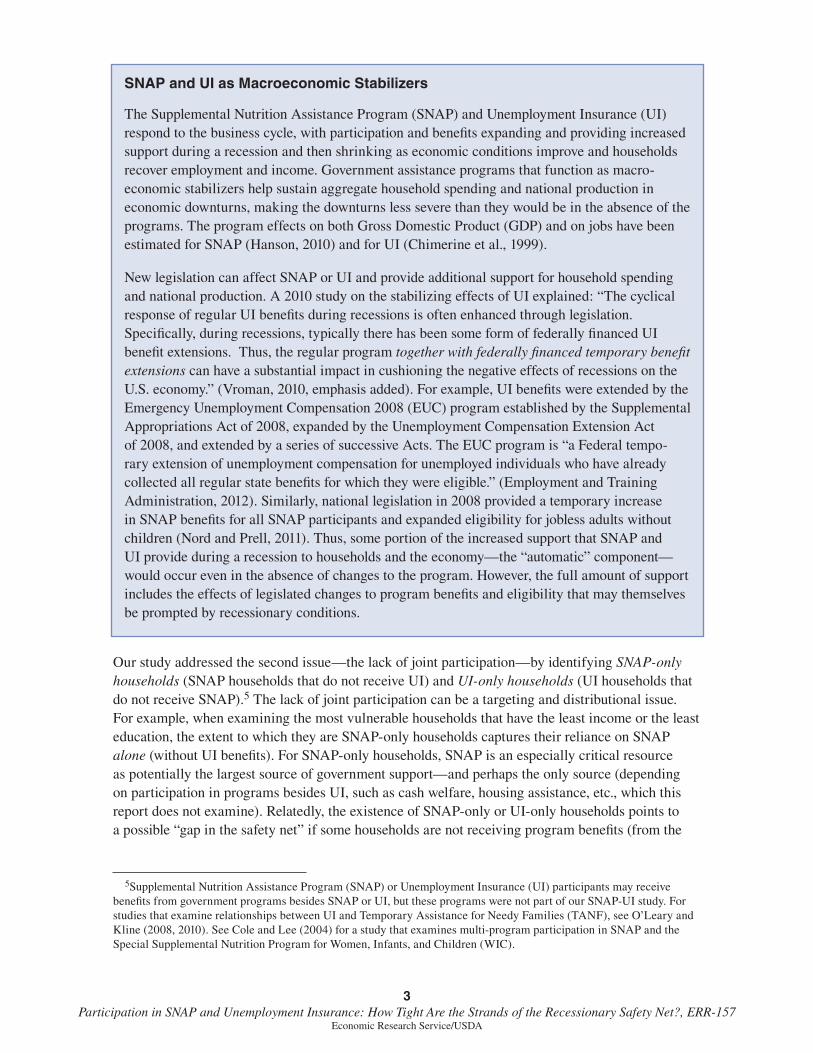
SNAP and UI as Macroeconomic Stabilizers
The Supplemental Nutrition Assistance Program (SNAP) and Unemployment Insurance (UI) respond to the business cycle, with participation and benefits expanding and providing increased support during a recession and then shrinking as economic conditions improve and households recover employment and income. Government assistance programs that function as macro-economic stabilizers help sustain aggregate household spending and national production in economic downturns, making the downturns less severe than they would be in the absence of the programs. The program effects on both Gross Domestic Product (GDP) and on jobs have been estimated for SNAP (Hanson, 2010) and for UI (Chimerine et al., 1999).
New legislation can affect SNAP or UI and provide additional support for household spending and national production. A 2010 study on the stabilizing effects of UI explained: “The cyclical response of regular UI benefits during recessions is often enhanced through legislation. Specifically, during recessions, typically there has been some form of federally financed UI benefit extensions. Thus, the regular program together with federally financed temporary benefit extensions can have a substantial impact in cushioning the negative effects of recessions on the U.S. economy.” (Vroman, 2010, emphasis added). For example, UI benefits were extended by the Emergency Unemployment Compensation 2008 (EUC) program established by the Supplemental Appropriations Act of 2008, expanded by the Unemployment Compensation Extension Act of 2008, and extended by a series of successive Acts. The EUC program is “a Federal tempo-rary extension of unemployment compensation for unemployed individuals who have already collected all regular state benefits for which they were eligible.” (Employment and Training Administration, 2012). Similarly, national legislation in 2008 provided a temporary increase in SNAP benefits for all SNAP participants and expanded eligibility for jobless adults without children (Nord and Prell, 2011). Thus, some portion of the increased support that SNAP and UI provide during a recession to households and the economy—the “automatic” component—would occur even in the absence of changes to the program. However, the full amount of support includes the effects of legislated changes to program benefits and eligibility that may themselves be prompted by recessionary conditions.
4 Participation in SNAP and Unemployment Insurance: How Tight Are the Strands of the Recessionary Safety Net?, ERR-157
Economic Research Service/USDA
other program) for which they are eligible. A lack of joint participation points to the possibility for enhanced outreach and coordination between local SNAP and UI offices to promote joint participa-tion. At the same time, from the front-line perspective of a local SNAP office, joint participation does add to the volume and complexity of the workload (see box, “Joint Participation in SNAP and UI Complicates SNAP Administration”).
To address the two broad issues involving the presence and the absence of joint participation, the study had two research goals. The first was to examine the extent of joint participation between SNAP and UI nationally, particularly in recessionary conditions. That is, how “tight” are these two strands of the recessionary safety net? How does joint participation during the recession compare to joint participation at full employment? The study developed national estimates for four measures of joint participation: the number of joint households supported by both SNAP and UI, and the numbers of joint households as a share of, respectively, U.S. households, SNAP households, and UI households. The last two measures were central to the study:
• We define the SNAP Joint Participation Rate (SNAP JPR) as the share of SNAP households that are joint households (i.e., the share of SNAP households that also receive UI).6 Some SNAP households are financially needy specifically because of unemployment and may receive UI benefits.
• Similarly, the UI Joint Participation Rate (UI JPR) is defined as the share of UI households that are joint households (i.e., the share of UI households that also receive SNAP). Some UI house-holds meet SNAP’s income-eligibility limits because each UI household has an unemployed worker who is not receiving earnings (and a household with only one earner loses all earnings when that earner becomes unemployed).
The SNAP JPR and UI JPR are complementary measures that each adopt a “perspective” of either SNAP or UI as the lens through which to examine joint participation (i.e., which one serves as the “base” program). Each measure is of interest. A SNAP (or UI) household that participates in UI (or SNAP) has greater well-being by augmenting its resources. Furthermore, a larger SNAP JPR can be desirable because a larger value reflects greater SNAP targeting toward the working poor. The study expanded SNAP’s customary notion of the program’s “working poor” to include SNAP households with recent earnings (even if earnings in the current month are zero) and thereby considered SNAP households that receive UI to be among the working poor.7 Working poor households historically participate in SNAP at lower rates than other households and constitute an important target popula-tion for SNAP (Castner and Schirm, 2005; Food and Nutrition Service, 2008).
The second research goal was to examine patterns for SNAP-only and UI-only participation among subgroups of households categorized by three characteristics: household annual income relative to poverty, race/ethnicity (of the householder), and education (of the householder). For example, the study examined the extent to which SNAP households with various levels of education also receive
6The Food and Nutrition Service and others use the term “SNAP Participation Rate” to express the number of Supple-mental Nutrition Assistance Program (SNAP) participants as a share of the number who are estimated to be eligible for the program. In contrast, this study’s two Joint Participation Rates do not integrate eligibility criteria into their definitions.
7The customary notion of “working poor” in the Supplemental Nutrition Assistance Program refers to current monthly earnings; this terminology serves to distinguish those who have labor market connections from, say, retired couples with no earnings. Those who receive Unemployment Insurance (UI) had earnings in the recent past (as a requirement for UI eligibility) and, unlike retired people, are likely to have earnings again. Due to these labor market connections, we use the term “worker” to describe UI recipients—as does the UI program—despite the absence of current monthly earnings.

5 Participation in SNAP and Unemployment Insurance: How Tight Are the Strands of the Recessionary Safety Net?, ERR-157
Economic Research Service/USDA
UI and, reciprocally, the extent to which they are SNAP-only participants. Do households with less than a high school education participate in SNAP alone, without UI, more than other households do? Even during a recession? Do households with a college education tend to participate in UI alone, without SNAP, more than other households do?
To address its research goals, the study used nationally representative annual data for 2004-09 to estimate:
1. The extent of joint participation during the 2008-09 recession;8
2. How SNAP, UI, and joint participation patterns changed over time as macroeconomic conditions worsened from earlier years;
3. How joint, SNAP-only, and UI-only participation patterns varied across subgroups of households during the recession; and
4. How joint, SNAP-only, and UI-only participation patterns for subgroups of households were affected as macroeconomic conditions worsened from earlier years.
8According to the National Bureau of Economic Research (NBER), which provides authoritative dating of business cycles, the recession began in December 2007 and ended in June 2009. In this report, we provide results and analysis that are based on annual data. For consistency with our empirical work, our discussion dates the recession as 2008-09 rather than 2007-09 even though the NBER dating of the recession includes 1 month in 2007.
Joint Participation in SNAP and UI Complicates SNAP Administration
Three broad activities can potentially become more complicated for a local Supplemental Nutrition Assistance Program (SNAP) office when a household receives Unemployment Insurance (UI):
• SNAP benefit determination. Because UI benefits count as part of household income in SNAP, SNAP rules require the local SNAP office to decrease the amount of SNAP benefits it issues to the SNAP household based on the level of UI benefits received in the same month.1
• Churning. SNAP administration is more difficult and (re)application-processing costs are higher because of churning—transitions between SNAP participation and nonparticipa-tion over short periods of time (e.g., a few months). SNAP households that also receive UI contribute to churning. Receipt of UI by a SNAP household is an indicator that (1) the house-hold recently experienced one labor market transition, from employment to unemployment; (2) the household may possibly experience a second labor market transition—from unemploy-ment back to employment—and may exit from SNAP; and (3) the household may re-enter SNAP in the future, especially if unemployment recurs following re-employment.
• Recertification. Even before any re-employment—and the earnings that it would bring— a UI-receiving SNAP household for which the prospect of re-employment may be imminent poses administrative challenges for SNAP. Recertification by the local SNAP office that a SNAP household continues to be income eligible may be more frequent for UI-receiving SNAP households than for other SNAP households (e.g., those on fixed incomes).
1Resources and well-being for a Supplemental Nutrition Assistance Program (SNAP) household increase with Unemployment Insurance (UI) receipt despite the adjustment in SNAP benefits (i.e., the decrease in SNAP benefits is smaller than the amount of UI benefits).

6 Participation in SNAP and Unemployment Insurance: How Tight Are the Strands of the Recessionary Safety Net?, ERR-157
Economic Research Service/USDA
The study’s findings can inform policy decisions on managing and coordinating the two programs, and better serve households that may be accessing only one program when they are eligible for both. Altogether, joint participation and the lack of joint participation have implications for issues of program design, administration, targeting, and access over the business cycle and across subgroups of households. These issues are of interest to officials and managers in SNAP and UI and to the programs’ multiple stakeholders, including those seeking to promote program outreach and better understanding of the roles of the SNAP and UI programs in the Nation’s social safety net.
7 Participation in SNAP and Unemployment Insurance: How Tight Are the Strands of the Recessionary Safety Net?, ERR-157
Economic Research Service/USDA
Joint Participation Rates: Definitions and Determinants
SNAP eligibility is determined at the household level, while UI eligibility is determined at the level of the individual worker. Yet, the unemployed worker who receives UI benefits is not the only person in the household who is better off because of UI. We assumed that UI benefits and SNAP benefits—like household income—are typically shared among household members. Accordingly, in this study, we typically define participation at the household level: a household is a UI (or SNAP) participant when one or more members receive UI (or SNAP) benefits.9 We supplement our household-level estimates of participation with estimates of the number of people who reside in households that receive benefits from SNAP, UI, or both programs.
While the number of joint households, given by J, is one measure of joint participation, our study’s two key measures are the SNAP Joint Participation Rate (SNAP JPR) given by J/S (where S is the number of SNAP households), and the UI Joint Participation Rate (UI JPR) given by J/U (where U is the number of UI households). Each JPR represents a share, a prevalence, or a probability—which-ever interpretation and term is most applicable for a particular context. For example, letting H be the number of U.S. households and P(X) be the probability of X, the SNAP JPR is:
( ) ( ).( ) ( )1 |( ) ( )
= = = = =
JJ P J P U and SH SNAP JPR P U S
SS P S P SH
Thus, the SNAP JPR is equivalent to P(U|S)—the probability of participating in UI conditioned on participation in SNAP (or the share of SNAP households that receive UI). Similarly, the UI JPR is equivalent to P(S|U).10
We outline a few of the major rules by which eligibility for UI and SNAP is determined.11 The eligi-bility rules reflect that SNAP and UI are designed, respectively, as a means-tested program and as social insurance.12 We describe two figures that provide partial schematics illustrating flows into
9An alternative to a household-level approach would be to count the number of unemployed workers who receive Unemployment Insurance (UI) benefits as “UI individuals” and to count them as “joint individuals” if they also receive Supplemental Nutrition Assistance Program (SNAP) benefits. If each UI household has one and only one UI individual, then the number of joint individuals would equal the study’s count of joint households. If, instead, some UI households have two (or more) UI individuals, the number of joint individuals will exceed the number of joint households. We do not expect that this alternative approach would affect the study’s major findings.
10Our study’s Supplemental Nutrition Assistance Program (SNAP) Joint Participation Rate (JPR) and Unemployment Insurance (UI) JPR each measure participation in a second program by participants in a given program. For previous research that uses a variety of data sources and methodologies to examine participation among eligibles, see Cunnyngham et al. (2011) for SNAP, Anderson and Meyer (1997) for UI, Zedlewski (2002) for Temporary Assistance for Needy Families (TANF), Witte and Queralt (2002) for child-care subsidies, and Remler et al. (2001) for a cross-program review of findings.
11A more complete treatment of eligibility criteria for the Supplemental Nutrition Assistance Program can be found in Food and Nutrition Service (2010). The Employment and Training Administration provides an annual compilation of State unemployment insurance laws at http://ows.doleta.gov/unemploy/statelaws.asp. Nicholson (1997) and Anderson (1997) also provide discussion of UI eligibility.
12Means-tested (or need-based) programs target benefits to those with limited income and provide transfers for no pay-ment or service in return (Congressional Research Service, 2006). They are typically financed from general tax revenues. In contrast, a “social insurance” program typically is not means-tested and links benefits to contributions that were paid into a fund established specifically for the program. While it is customary to categorize programs as either a “means-tested” or a “social insurance” program, any particular program can blend features from either category. Most broadly, even “means-tested” programs have a social insurance aspect in the sense that “coverage” is provided socially, through general tax revenues.
8 Participation in SNAP and Unemployment Insurance: How Tight Are the Strands of the Recessionary Safety Net?, ERR-157
Economic Research Service/USDA
UI eligibility and SNAP eligibility; we use the term “partial schematic” because the figures capture only some of the many complex rules for eligibility in UI or SNAP.
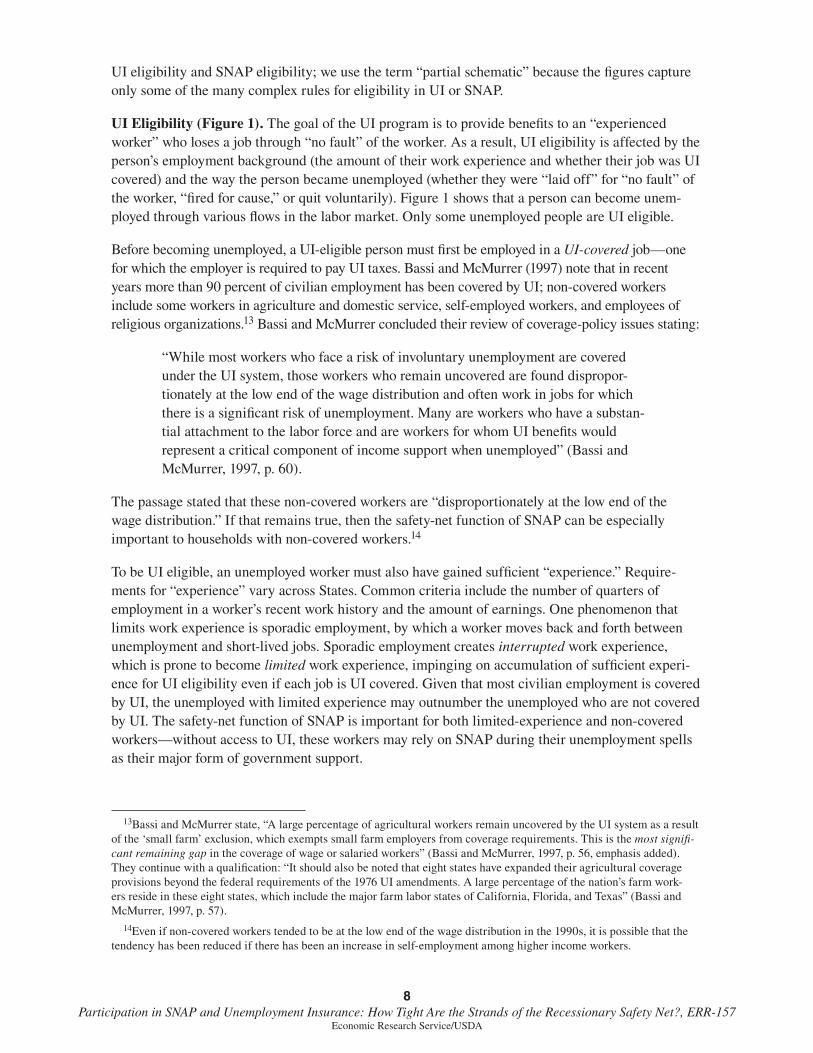
UI Eligibility (Figure 1). The goal of the UI program is to provide benefits to an “experienced worker” who loses a job through “no fault” of the worker. As a result, UI eligibility is affected by the person’s employment background (the amount of their work experience and whether their job was UI covered) and the way the person became unemployed (whether they were “laid off” for “no fault” of the worker, “fired for cause,” or quit voluntarily). Figure 1 shows that a person can become unem-ployed through various flows in the labor market. Only some unemployed people are UI eligible.
Before becoming unemployed, a UI-eligible person must first be employed in a UI-covered job—one for which the employer is required to pay UI taxes. Bassi and McMurrer (1997) note that in recent years more than 90 percent of civilian employment has been covered by UI; non-covered workers include some workers in agriculture and domestic service, self-employed workers, and employees of religious organizations.13 Bassi and McMurrer concluded their review of coverage-policy issues stating:
“While most workers who face a risk of involuntary unemployment are covered under the UI system, those workers who remain uncovered are found dispropor-tionately at the low end of the wage distribution and often work in jobs for which there is a significant risk of unemployment. Many are workers who have a substan-tial attachment to the labor force and are workers for whom UI benefits would represent a critical component of income support when unemployed” (Bassi and McMurrer, 1997, p. 60).
The passage stated that these non-covered workers are “disproportionately at the low end of the wage distribution.” If that remains true, then the safety-net function of SNAP can be especially important to households with non-covered workers.14
To be UI eligible, an unemployed worker must also have gained sufficient “experience.” Require-ments for “experience” vary across States. Common criteria include the number of quarters of employment in a worker’s recent work history and the amount of earnings. One phenomenon that limits work experience is sporadic employment, by which a worker moves back and forth between unemployment and short-lived jobs. Sporadic employment creates interrupted work experience, which is prone to become limited work experience, impinging on accumulation of sufficient experi-ence for UI eligibility even if each job is UI covered. Given that most civilian employment is covered by UI, the unemployed with limited experience may outnumber the unemployed who are not covered by UI. The safety-net function of SNAP is important for both limited-experience and non-covered workers—without access to UI, these workers may rely on SNAP during their unemployment spells as their major form of government support.
13Bassi and McMurrer state, “A large percentage of agricultural workers remain uncovered by the UI system as a result of the ‘small farm’ exclusion, which exempts small farm employers from coverage requirements. This is the most signifi-cant remaining gap in the coverage of wage or salaried workers” (Bassi and McMurrer, 1997, p. 56, emphasis added). They continue with a qualification: “It should also be noted that eight states have expanded their agricultural coverage provisions beyond the federal requirements of the 1976 UI amendments. A large percentage of the nation’s farm work-ers reside in these eight states, which include the major farm labor states of California, Florida, and Texas” (Bassi and McMurrer, 1997, p. 57).
14Even if non-covered workers tended to be at the low end of the wage distribution in the 1990s, it is possible that the tendency has been reduced if there has been an increase in self-employment among higher income workers.
9 Participation in SNAP and Unemployment Insurance: How Tight Are the Strands of the Recessionary Safety Net?, ERR-157
Economic Research Service/USDA
Finally, an experienced worker in a UI-covered job must lose the job through “no fault” of the worker (e.g., due to a slowdown in business) to be UI eligible. The figure uses the term “laid off” to refer to this case and the term “fired for cause” to cover termination of employment for a reason considered to be the fault of the worker (e.g., late for work). People unemployed for other reasons (e.g., those who voluntarily quit or are new entrants or re-entrants to the labor force) are not eligible for UI.15
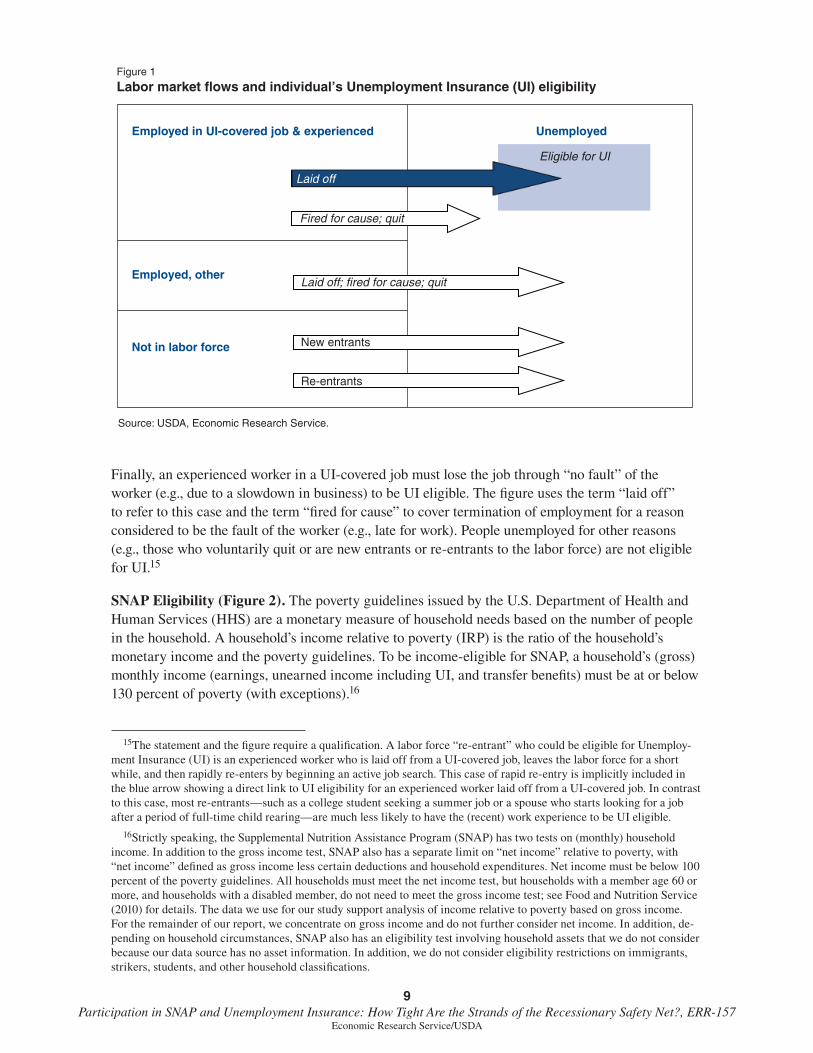
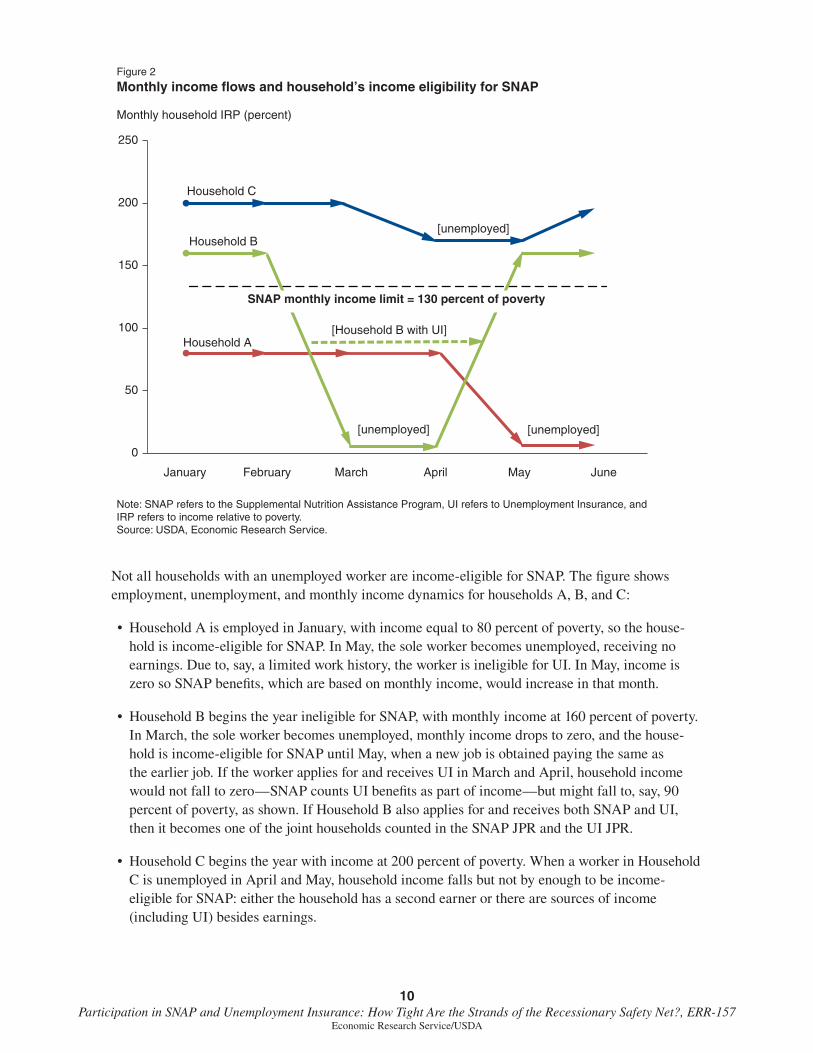
SNAP Eligibility (Figure 2). The poverty guidelines issued by the U.S. Department of Health and Human Services (HHS) are a monetary measure of household needs based on the number of people in the household. A household’s income relative to poverty (IRP) is the ratio of the household’s monetary income and the poverty guidelines. To be income-eligible for SNAP, a household’s (gross) monthly income (earnings, unearned income including UI, and transfer benefits) must be at or below 130 percent of poverty (with exceptions).16
15The statement and the figure require a qualification. A labor force “re-entrant” who could be eligible for Unemploy-ment Insurance (UI) is an experienced worker who is laid off from a UI-covered job, leaves the labor force for a short while, and then rapidly re-enters by beginning an active job search. This case of rapid re-entry is implicitly included in the blue arrow showing a direct link to UI eligibility for an experienced worker laid off from a UI-covered job. In contrast to this case, most re-entrants—such as a college student seeking a summer job or a spouse who starts looking for a job after a period of full-time child rearing—are much less likely to have the (recent) work experience to be UI eligible.
16Strictly speaking, the Supplemental Nutrition Assistance Program (SNAP) has two tests on (monthly) household income. In addition to the gross income test, SNAP also has a separate limit on “net income” relative to poverty, with “net income” defined as gross income less certain deductions and household expenditures. Net income must be below 100 percent of the poverty guidelines. All households must meet the net income test, but households with a member age 60 or more, and households with a disabled member, do not need to meet the gross income test; see Food and Nutrition Service (2010) for details. The data we use for our study support analysis of income relative to poverty based on gross income. For the remainder of our report, we concentrate on gross income and do not further consider net income. In addition, de-pending on household circumstances, SNAP also has an eligibility test involving household assets that we do not consider because our data source has no asset information. In addition, we do not consider eligibility restrictions on immigrants, strikers, students, and other household classifications.
Figure 1
Labor market flows and individual’s Unemployment Insurance (UI) eligibility
Source: USDA, Economic Research Service.
Employed, other
Unemployed
Laid off; fired for cause; quit
Employed in UI-covered job & experienced
Fired for cause; quit
Not in labor force New entrants
Re-entrants
Eligible for UI
Laid off
10 Participation in SNAP and Unemployment Insurance: How Tight Are the Strands of the Recessionary Safety Net?, ERR-157
Economic Research Service/USDA
Not all households with an unemployed worker are income-eligible for SNAP. The figure shows employment, unemployment, and monthly income dynamics for households A, B, and C:
• Household A is employed in January, with income equal to 80 percent of poverty, so the house-hold is income-eligible for SNAP. In May, the sole worker becomes unemployed, receiving no earnings. Due to, say, a limited work history, the worker is ineligible for UI. In May, income is zero so SNAP benefits, which are based on monthly income, would increase in that month.
• Household B begins the year ineligible for SNAP, with monthly income at 160 percent of poverty. In March, the sole worker becomes unemployed, monthly income drops to zero, and the house-hold is income-eligible for SNAP until May, when a new job is obtained paying the same as the earlier job. If the worker applies for and receives UI in March and April, household income would not fall to zero—SNAP counts UI benefits as part of income—but might fall to, say, 90 percent of poverty, as shown. If Household B also applies for and receives both SNAP and UI, then it becomes one of the joint households counted in the SNAP JPR and the UI JPR.
• Household C begins the year with income at 200 percent of poverty. When a worker in Household C is unemployed in April and May, household income falls but not by enough to be income-eligible for SNAP: either the household has a second earner or there are sources of income (including UI) besides earnings.
Figure 2
Monthly income flows and household’s income eligibility for SNAP
Note: SNAP refers to the Supplemental Nutrition Assistance Program, UI refers to Unemployment Insurance, and IRP refers to income relative to poverty.Source: USDA, Economic Research Service.
Monthly household IRP (percent)
0
50
100
150
200
250
January February March April May June
Household C
Household B
Household A[Household B with UI]
[unemployed]
[unemployed] [unemployed]
SNAP monthly income limit = 130 percent of poverty

11 Participation in SNAP and Unemployment Insurance: How Tight Are the Strands of the Recessionary Safety Net?, ERR-157
Economic Research Service/USDA
In summary, all three households experienced unemployment. Of these, only two households—A and B—were income-eligible for SNAP for at least part of the year. Of these, only Household A was income-eligible for SNAP while employed.
Some factors that may increase the likelihood of joint participation in SNAP and UI are:
• Unemployment. In times of high unemployment (e.g., during the 2008-09 recession), joint partic-ipation can increase because of a rise in the number of households with UI-eligible members and more households that are income-eligible for SNAP.
• Cross-program outreach. There is recognition at the Federal level that UI and SNAP have over-lapping participants and that actions taken at local offices can facilitate cross-program access for eligible participants (see box, “U.S. Department of Labor Encourages SNAP Outreach at Local Unemployment Insurance Offices”). As local program offices administer their program, they can also conduct cross-program outreach activities, providing information and referrals to applicants on the availability and application procedures for the other program. SNAP outreach at UI offices may be especially important under recessionary conditions for two reasons. First, the numbers of unemployed and low-income people increase during a recession. The second, more subtle reason is that the mix of unemployed people, perhaps especially if the recession is a severe one, may include a larger share (compared to times of a strong economy) of people who have little, if any, familiarity with SNAP’s availability and application process.17
Some factors that may inhibit joint participation in SNAP and UI are:
• UI coverage and eligibility rules. UI and joint participation reflect, and are constrained by, the existing framework of rules for UI coverage and eligibility (e.g., an experienced worker must have been laid off from a UI-covered job). If one or another of these rules were eased, the resulting increase in UI participation would almost certainly include some who are also SNAP partici-pants, resulting in increases in joint participants and in the SNAP JPR (J/S); the effect on the UI JPR (J/U) is ambiguous because both numerator and denominator increase.18
• SNAP eligibility rules. SNAP and joint participation reflect, and are constrained by, the existing framework of SNAP eligibility rules (particularly income eligibility). If one or another of these rules were eased, the resulting increase in SNAP participation would almost certainly include some who are also UI participants, resulting in increases in joint participants and in the UI JPR (J/U); the effect on the SNAP JPR (J/S) is ambiguous because both numerator and denominator increase. Two SNAP rules related to income can reduce joint participation:
– Multiple-earner households. If a household’s second earner has sufficiently large earn-ings, the household would not be income-eligible for SNAP even when one earner is not working. Thus, a UI household may not be income-eligible for SNAP despite the unem-
17Many who became unemployed during 2008-09 and received Unemployment Insurance had held a fairly steady job with income that (far) exceeded the income limits in the Supplemental Nutrition Assistance Program (SNAP). Thus, they may not have participated in SNAP for many years— if ever.
18Strictly speaking, two opposite perspectives that produce two opposite claims are equally valid. The existing rules on Unemployment Insurance (UI) coverage and eligibility both (a) inhibit and decrease UI participation compared to what it would be under looser rules, and (b) promote and increase UI participation compared to what it would be under tighter rules. For simplicity, our discussion is based on just the former perspective.
12 Participation in SNAP and Unemployment Insurance: How Tight Are the Strands of the Recessionary Safety Net?, ERR-157
Economic Research Service/USDA
U.S. Department of Labor Encourages SNAP Outreach at Local Unemployment Insurance Offices
The March 2009 Training and Employment Notice (No. 35-09) issued by the U.S. Department of Labor was addressed to State workforce agencies, State workforce liaisons, State and local Workforce Investment Board Directors, and One-Stop Career Center Managers. Portions (which we have excerpted) of the Notice stated:
Purpose. This training and employment notice provides information about the Supplemental Nutrition Assistance Program (SNAP) and describes opportunities for One-Stop Career Centers to inform customers of the resources available through SNAP. The Department of Labor’s Employment and Training Administration (ETA) and the United States Department of Agriculture (USDA) Food and Nutrition Service are working to ensure that the nation’s unem-ployed and under-employed workers are aware of the full range of income assistance available to them and their families during this difficult economic period. [emphasis added]
Background. Federal and State governments provide income support programs to help families make ends meet when they are unemployed, or when earnings from work are not sufficient to meet their needs. While many individuals are aware of income support programs such as Unemployment Insurance, Medicaid, and Temporary Assistance for Needy Families (TANF), many unemployed or under-employed workers may not know about other forms of assistance, such as SNAP. SNAP helps low-income people and families buy the food they need for good health.
USDA has committed to assuring that all eligible people have access to the nutrition benefits of SNAP. To assist in this effort, ETA strongly encourages the public workforce system to include SNAP information as part of the work supports that are offered to customers at One-Stop Career Centers. [emphasis added]
Role for One-Stop Career Centers. Food assistance is one more valuable resource to support unemployed or under-employed individuals during this difficult economic period. Because One-Stop Career Centers serve many customers who may also qualify for SNAP, we encourage One-Stops to help customers learn about the program and begin the application process. Since the One-Stop Career Centers serve millions of people each year, people who would otherwise not apply for SNAP may be able to access this valuable assistance. [emphasis added]
In addition, the Notice encouraged managers of One-Stop Career Centers to access online SNAP outreach materials and identified other specific activities that could be implemented at the local level:
• Reaching out to the local SNAP offices to learn more about eligibility requirements and the application process.
• Providing information about SNAP’s eligibility requirements and the application process to customers at the One-Stop who may be eligible, including keeping copies of SNAP applica-tions on hand in the One-Stop Career Center and maintaining a list of contact information for local SNAP offices.
• Establishing a referral process to ensure that customers are able to quickly begin the SNAP application process. While some One-Stops may already have this relationship in place, renewing or establishing coordination with local SNAP offices will improve the referral process and, ultimately, enhance the services available to One-Stop customers.
• Providing computer access to the SNAP Pre-Screening Tool, located at www.snap-step1.usda.gov/.
13 Participation in SNAP and Unemployment Insurance: How Tight Are the Strands of the Recessionary Safety Net?, ERR-157
Economic Research Service/USDA
ployed worker’s lack of earnings. This factor is rooted in the household composition and labor force decisions of a household and in SNAP’s design as a means-tested program.
– UI benefits. The amount of UI benefits received by a household are counted as part of the household’s monthly gross income, which can affect both the household’s income-eligibility for SNAP and the amount of the household’s SNAP benefits (which is based, in part, on household income). SNAP-eligible households can make a cost-benefit calcu-lation to decide whether to apply and participate. For given costs (such as the time and out-of-pocket expenses of submitting an application), a decrease in SNAP benefits (since UI benefits are considered income) may affect that calculation, decreasing SNAP and joint participation.
• Lack of familiarity with the other program. Applicants at one program’s local office may be unfamiliar with the other program and its application process. This lack of familiarity may espe-cially affect the extent to which UI households participate in SNAP and be more prevalent during a recessionary period.19 At such times, more households (including UI households) that were not previously SNAP participants (due to higher income in previous times) are in a range of lower income that enables them to receive SNAP benefits—if only they were to apply.
• Stigma associated with participation. Some people may be reluctant to apply for SNAP or UI benefits because of perceived stigma attached with participation in certain government assistance programs. Stigma may inhibit joint participation, particularly by affecting SNAP participa-tion. UI benefits, as social insurance, may be widely perceived by many as an “earned right” in contrast to SNAP benefits, which are based on need and not on an individual’s contribution to a trust fund.20 However, stigma for receipt of SNAP benefits may potentially diminish in periods when many others, especially those considered peers, become SNAP participants. While stigma is distinct from limited information, outreach may promote program participation by both providing information and awareness and by helping to shape public perception of the program.
• Duration of need expected to be short. Some SNAP-eligible UI households may not apply for SNAP because they anticipate short-term rather than long-term unemployment (e.g., a few weeks rather than a few months). These households may perceive UI to be a sufficient bridge between periods of employment.21
In practice, it can be difficult to disentangle the reasons that may impede SNAP participation by a particular UI household. The effects of such factors as limited information, perceived stigma, and the household’s expectations about its duration of need are not easily measured.
19Because some Unemployment Insurance (UI) participants lack recent—or perhaps any—contact with the Supple-mental Nutrition Assistance Program (SNAP), they may find it easier to locate a UI office and apply for UI benefits than to become participants in SNAP. For these unemployed workers, a union or former employer may readily provide infor-mation on how to apply for UI and online application for UI may be relatively easy.
20As explained by the Social Security Administration in a review of the historical development of Social Security programs, “[T]he contributory financing of social insurance programs would ensure that protection was available as a matter of right as contrasted with a public assistance approach whereby only those persons in need would be eligible for benefits” (SSA, 1997, p. 1, emphasis added).
21A study based on monthly longitudinal data from the 1990s provides supportive evidence (Farrell et al., 2003). The study found that, compared with Supplemental Nutrition Assistance Program (SNAP) households, those households that were income-eligible for SNAP but were not SNAP participants had (on average) a larger decrease in monthly incomes preceding the study’s reference month and a larger increase in incomes after the reference month.

14 Participation in SNAP and Unemployment Insurance: How Tight Are the Strands of the Recessionary Safety Net?, ERR-157
Economic Research Service/USDA
One final influence on our study’s estimates is a statistical factor, distinct from the programmatic and behavioral factors mentioned earlier. To measure joint participation, there are two statistical metrics that correspond to two timeframes. For example, the “share of SNAP households that also receive UI” can be measured using either a monthly timeframe or an annual timeframe; the same is true for the “share of UI households that also receive SNAP.” We first consider the effect of using alternative timeframes to measure “SNAP participation,” and then examine the effect of the two timeframes on “joint participation.”
The question “How many SNAP participants were there in 2005?” is seemingly simple, but it has two answers. Based on data from the Census Bureau’s Survey of Income and Program Participation, an estimated 31.7 million people received SNAP benefits “at some time” (in at least one month) during 2005, while about 23.1 million people received SNAP benefits in a typical month (Mabli et al., 2011). Each of these two metrics—ever-during-the-year SNAP participation (ES) and average monthly SNAP participation (S )—has its own uses.
The extent to which SNAP touches the lives of Americans can be called the “reach” of SNAP, a concept that ties closely to issues about SNAP’s role in providing a safety net. The question “How widespread is SNAP’s safety net?” is tantamount to asking “How many and what proportion of people (or households) receive SNAP benefits?” When assessing SNAP’s “reach,” it can be important to recognize that different people use the program at different times during the year. For example, FNS states that “SNAP serves substantially more individuals over the course of a year than is implied by the monthly average number of participants. About 40 percent more individuals participated over the course of a year than participated in an average month, resulting in a turnover rate of 1.4 in the mid-2000s” (Food and Nutrition Service, 2012a, p. 11); the estimated turnover rate is (ES/ S). Another example is a Census Bureau report that uses American Community Survey ACS)data to estimate—for the United States and for each State—the numbers and proportions of households that receive SNAP benefits at some time within the past 12 months (Loveless, 2010). In addition, FNS uses ACS data to provide estimates of the number of households receiving SNAP (and the number not receiving SNAP) for each Congressional District, together with selected household characteristics (Food and Nutrition Service, 2012b). Thus, when reporting on the reach of SNAP, an annual timeframe (and its associated metric of ever-during-the-year SNAP participation) can be especially informative.22
On the other hand, for budgetary purposes, average monthly participation is an informative measure of “participation” and the associated cost to taxpayers. SNAP’s average monthly expenditure (in dollar terms) is the product of average monthly participation and average monthly SNAP benefits per person, making SNAP expenditures and average monthly participation highly correlated. Thus, the annual and monthly timeframes, and their associated metrics, can each be informative for its own purpose.23
22Strictly speaking, the annual timeframe of data from the Annual Social and Economic (ASEC) Supplement to the Current Population Survey, which we use for our study, differs from the 12-month timeframe of the American Commu-nity Survey (ACS) data. ASEC respondents report on Supplemental Nutrition Assistance Program (SNAP) receipt for a particular calendar year, while ACS respondents report on SNAP receipt for the 12 months prior to the ACS interview, which can occur at any time during a year.
23Sometimes it can be advantageous to examine the Supplemental Nutrition Assistance Program’s (SNAP) reach using S (rather than ES) because of timeliness or consistency. A year’s S , which is derived from the Food and Nutrition Service’s monthly participation data, is available more quickly than a survey-based estimate of ES (which is available many months after the end of a year). For the sake of consistency, a study that considers both the cost and reach of SNAP may opt to use a single measure of participation for both issues.
15 Participation in SNAP and Unemployment Insurance: How Tight Are the Strands of the Recessionary Safety Net?, ERR-157
Economic Research Service/USDA
Estimates are already available of the “share of SNAP households that also receive UI” in a typical month of the fiscal year (monthly timeframe). At the time of SNAP certification or recertification, households report income and certain expenditures to SNAP offices for determinations of eligibility and SNAP benefits. For this purpose, the States’ SNAP administrative databases collect information on receipt of SNAP and UI in the same month—what we call concurrent participation in the two programs.24 As part of its Quality Control (QC) System, FNS collects data from the States’ data-bases on a sample of SNAP households. Based on QC data, the estimated share of SNAP households that concurrently received UI in a “typical month” of fiscal 2004 was about 2.5 percent (Castner and Schirm, 2005). In successive fiscal years, that share dropped to 1.9, 1.7, and 1.7 percent before rising to 2.1 percent in fiscal 2008 and 4.7 percent in fiscal 2009. These 2004-09 data show that the esti-mated shares of SNAP households concurrently receiving UI increased during the recession.
The purpose of our study was to examine the extent to which SNAP and UI—both singly and together—touch the lives of Americans. To measure the joint reach of SNAP and UI, our study adopted an annual timeframe and ever-during-the-year joint participation. Some households partici-pate in both SNAP and UI in some “proximate” time period, even though they may not receive SNAP and UI benefits concurrently (in the same month). For example, a household may receive UI without receiving SNAP but then, when UI benefits are exhausted, turn to SNAP for additional support. To fully portray the joint reach of SNAP and UI, our study counts all households as “joint participants” if they received SNAP and UI benefits in the same year (though not necessarily in the same month(s)).
In measures of “SNAP participation,” an annual timeframe consistently results in a higher estimate than a monthly timeframe. However, an annual metric is not statistically “biased” compared to a monthly metric—it is only that the two metrics measure different things. Similarly, for joint partici-pation in SNAP and UI, a metric based on ever-during-the-year joint participation exceeds a metric based on concurrent participation alone. That is, the study’s SNAP JPR estimates can be expected to exceed those cited earlier based on the QC’s monthly timeframe: to reflect the joint reach of SNAP and UI over the course of a year, the SNAP JPR is supposed to be larger.25
The SNAP JPRs and UI JPRs we estimate in this report using ASEC data are meant to complement, rather than replace, the important monthly information provided in the QC data. Together, these two sources of data provide a better understanding of the complex issues surrounding joint SNAP and UI participation than either source can provide on its own.
24Supplemental Nutrition Assistance Program offices collect data on Unemployment Insurance (UI) receipt because UI benefits are considered income. In contrast, the UI program makes no use of information on SNAP benefits and does not collect this information in its State administrative systems. Survey data are essential for any estimate of the share of UI households that also receive SNAP.
25The estimated Supplemental Nutrition Assistance Program Joint Participation Rates can differ from the Quality Control figures for reasons besides the use of different timeframes (e.g., time period—calendar year versus fiscal year, geographical coverage—exclusion versus inclusion of U.S. territories, unit of analysis—household versus person, survey item nonresponse, and imputations for missing values).
16 Participation in SNAP and Unemployment Insurance: How Tight Are the Strands of the Recessionary Safety Net?, ERR-157
Economic Research Service/USDA
Data and Methodology
The study’s two research goals were to examine joint participation across the business cycle and across subgroups of households. The Annual Social and Economic (ASEC) Supplement (formerly, the Annual Demographic File) was identified as the best source of data to help meet these goals because ASEC data span several years and the large sample size supports estimation for subgroups of households. The ASEC is administered by the Census Bureau each year in February, March, and April as a supplement to the monthly Current Population Survey (CPS), a nationally representa-tive survey of the civilian, noninstitutionalized population of the United States. The sample size of ASEC is large (about 97,000 households in 2010) and has been collected for many years. ASEC data collected in 2005-10 provide information applicable to calendar years 2004-09, a study period that includes both full-employment and recessionary conditions.
The U.S. Census Bureau uses ASEC data for national poverty estimates. Reflecting that purpose, the ASEC data refer to the conditions, experiences, and behaviors of households and their members in the (previous) calendar year. Using ASEC’s annual data, our study’s definitions of “SNAP partici-pation” and “UI participation” are based on receipt (aggregated to the household level) of program benefits “at some time during the year.” The study also defined a household as a “joint participant” when the household received SNAP and UI, each at some time during the year (though not neces-sarily in the same months).
It is recognized that a monthly timeframe can also be of interest. Of course, monthly longitudinal data would be needed to examine monthly participation dynamics, which is left for future research. Monthly data would also support estimates of “same-month” (strictly concurrent) SNAP and UI participation, which would likely be smaller than our annual estimates that include all manner of intra-year dynamics. Each set of estimates can be informative and, methodologically, neither is a biased measure of the other—the two sets simply examine multi-program participation using different timeframes.
The 2010 ASEC included two questions aimed at gathering information on SNAP participation (Census Bureau, 2010b, p. D-88):
• Q87. “Did (you/ anyone in this household) get food stamps or a food stamp benefit card at any time during 2009?” and
• Q87a. “At any time during 2009, even for one month, did (you/ anyone in this household) receive any food assistance from (State Program name)?”
For our study, we define the household as a “SNAP participant” if there is an affirmative response in the ASEC’s yes/no household-level variable HFOODSP, which the ASEC data dictionary describes as “Did anyone in this household get food stamps at any time in [previous calendar year]?”26 (Census Bureau, 2010b, p. 8-4).
The household member who is the respondent to the ASEC answers the following item on behalf of all other household members (Census Bureau, 2010b, p. D-20):
26We note that the Annual Social and Economic Supplement does not distinguish between the regular Supplemental Nutrition Assistance Program (SNAP) and SNAP’s Disaster Assistance component.
17 Participation in SNAP and Unemployment Insurance: How Tight Are the Strands of the Recessionary Safety Net?, ERR-157
Economic Research Service/USDA
• Q51A1. “At any time during 2009 did (name/you) receive any State or Federal unemployment compensation?”
ASEC follow-up questions on amount and frequency are posed if a household member is reported as receiving State or Federal unemployment compensation.27 For our study, we defined the household as a “UI participant” if there is an affirmative response in the ASEC’s household variable HINC-UC, which is a yes/no recode at the household level of receipt of unemployment compensation benefits (Census Bureau, 2010b, p. 8-5).
Our study also examined differences of joint participation patterns across subgroups of households, focusing on three characteristics: household annual income relative to poverty (IRP),28 race/ethnicity, and education level. The household’s annual IRP is the ratio of the household’s monetary income to the poverty guidelines issued by HHS. To measure the household’s monetary income, we used ASEC’s household variable HTOTVAL, which combined income of all members of a household from all sources. The poverty guidelines issued by HHS are defined on a fiscal-year basis (October through September), while household income recorded in ASEC is defined on a calendar- year basis. When converted from annual to monthly figures, IRP is the basis of the income-eligibility guidelines of SNAP. For our study, we calculated household IRP for a calendar year based on the poverty guidelines of the fiscal year.29
Race/ethnicity and educational attainment are each an individual-level characteristic in ASEC data. To conduct our household-level analysis, our study adopted a standard approach that treats the race/ethnicity and the educational attainment of the household reference person in ASEC (the “house-holder”) as the characteristic of the household.
To reflect the multi-stage, stratified design of the CPS and ASEC, we obtained estimates of standard errors using the replicate weights and the methodology of Balanced Repeated Replication (BRR) as described in Lee and Forthofer (2006), Lohr (1999), and U.S. Census Bureau (2009, 2010a). Our study used annual sets of 160 replicate weights, which the Census Bureau calculated and made avail-able for the ASEC.
The samples for the annual ASEC and the monthly CPS are drawn from lists of addresses. In these census surveys, a “household” is an address-based concept, referring to people living together.30
27The Annual Social and Economic Supplement does not distinguish between different unemployment insurance pro-grams such as regular State programs and extended benefits programs. Other smaller, specialized unemployment insur-ance programs include one for ex-service members and another for unemployed former civilian Federal employees (State and local government employees are covered under the regular State programs (Basi and McMurrer, 1997)).
28Poverty guidelines are a monetary measure of household needs based on the number of people in the household. Poverty guidelines are revised annually to account for changes in the cost of living and are calculated separately for mainland United States, for Alaska, and for Hawaii.
29An alternative would be to calculate a weighted-average “calendar-year” set of poverty guidelines from 2 consecutive fiscal years and to use those to calculate a “weighted-IRP” (income relative to poverty). If we had shifted from using IRP to using a weighted-IRP, our statistical results would have changed little, if at all, for two reasons: (1) IRP and weighted-IRP differ very little for any single household, and (2) our study grouped households into seven broad income “categories.” Whether we used IRP or weighted-IRP, (nearly) every household in the sample would be in its same income category.
30Household composition changes over time. In the Annual Social and Economic Supplement (ASEC), Supplemental Nutrition Assistance Program and Unemployment Insurance receipt, like other information, is collected for those who are members of the household at the time of the ASEC interview. Longitudinal data could be better suited to examin-ing how recessionary conditions—and the potential for some nonmembers to become household members following job loss—may affect household composition.

18 Participation in SNAP and Unemployment Insurance: How Tight Are the Strands of the Recessionary Safety Net?, ERR-157
Economic Research Service/USDA
For our study, we adopted a “Census household” as our unit of analysis, which we simply call a “household” and discuss as if it were the same as a “SNAP unit” (a group of people who buy food and prepare meals in common). The local SNAP office collects information from an applicant, including the number of people in the SNAP unit and their incomes, to determine eligibility for SNAP and the amount of SNAP benefits. We recognize that people in the SNAP unit can differ from people in the Census Bureau’s definition of household. However, there is not sufficient data in the ASEC to identify the SNAP unit with precision.
Previous research has found that survey data are subject to underreporting on the extent to which households receive program benefits from SNAP, UI, and other government support programs.31 ASEC data that record receipt of SNAP or UI benefits, as reported by sampled households, do not fully capture all instances in which sampled households actually received program benefits. As a result of underreporting, our study’s sample-based national estimates of joint participation are “conservative”—they almost certainly underestimate the actual (but unknown) number of house-holds that received benefits from both SNAP and UI. All of the study’s results are likely to be affected to some extent by underreporting and need to be interpreted accordingly.
31For an analysis of underreporting of transfers in the Current Population Survey and other household surveys, see Meyer et al. (2009), Wheaton (2007), and Lynch et al. (2008).
19 Participation in SNAP and Unemployment Insurance: How Tight Are the Strands of the Recessionary Safety Net?, ERR-157
Economic Research Service/USDA
Recession Increased SNAP, UI, and Joint Participation
Our study examined the extent to which U.S. households, and the people living in them, received SNAP benefits, UI benefits, or benefits from both programs as joint participants.
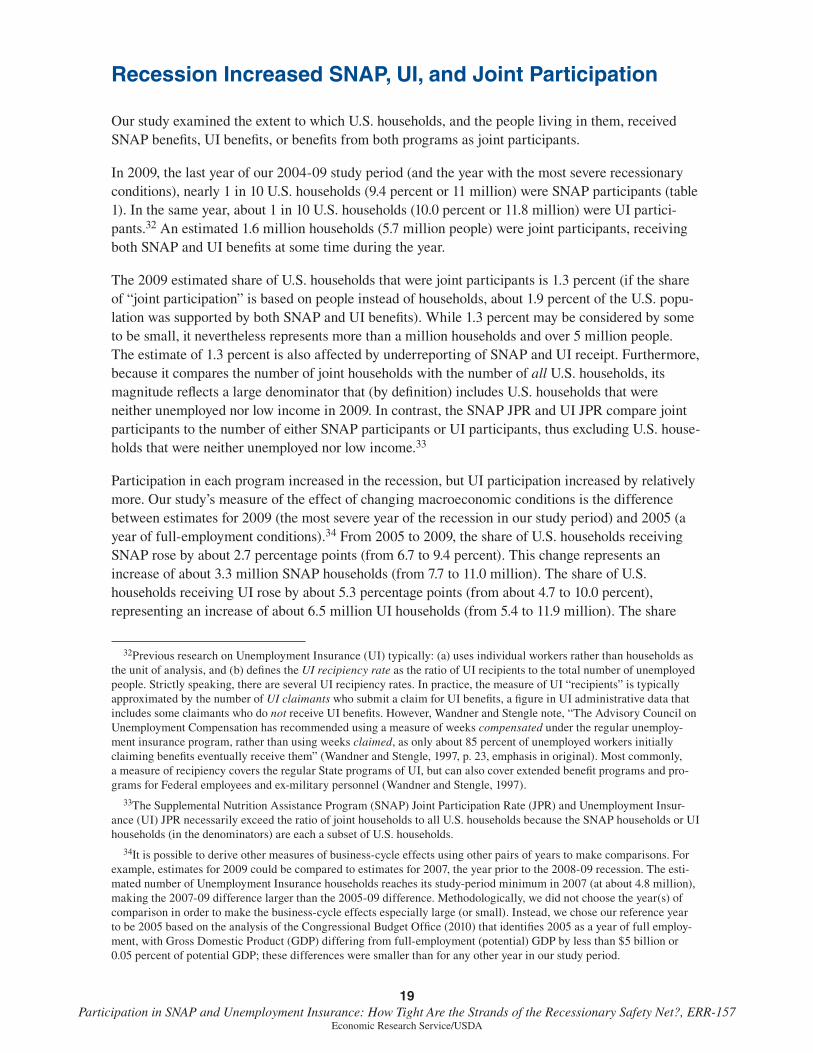
In 2009, the last year of our 2004-09 study period (and the year with the most severe recessionary conditions), nearly 1 in 10 U.S. households (9.4 percent or 11 million) were SNAP participants (table 1). In the same year, about 1 in 10 U.S. households (10.0 percent or 11.8 million) were UI partici-pants.32 An estimated 1.6 million households (5.7 million people) were joint participants, receiving both SNAP and UI benefits at some time during the year.
The 2009 estimated share of U.S. households that were joint participants is 1.3 percent (if the share of “joint participation” is based on people instead of households, about 1.9 percent of the U.S. popu-lation was supported by both SNAP and UI benefits). While 1.3 percent may be considered by some to be small, it nevertheless represents more than a million households and over 5 million people. The estimate of 1.3 percent is also affected by underreporting of SNAP and UI receipt. Furthermore, because it compares the number of joint households with the number of all U.S. households, its magnitude reflects a large denominator that (by definition) includes U.S. households that were neither unemployed nor low income in 2009. In contrast, the SNAP JPR and UI JPR compare joint participants to the number of either SNAP participants or UI participants, thus excluding U.S. house-holds that were neither unemployed nor low income.33
Participation in each program increased in the recession, but UI participation increased by relatively more. Our study’s measure of the effect of changing macroeconomic conditions is the difference between estimates for 2009 (the most severe year of the recession in our study period) and 2005 (a year of full-employment conditions).34 From 2005 to 2009, the share of U.S. households receiving SNAP rose by about 2.7 percentage points (from 6.7 to 9.4 percent). This change represents an increase of about 3.3 million SNAP households (from 7.7 to 11.0 million). The share of U.S. households receiving UI rose by about 5.3 percentage points (from about 4.7 to 10.0 percent), representing an increase of about 6.5 million UI households (from 5.4 to 11.9 million). The share
32Previous research on Unemployment Insurance (UI) typically: (a) uses individual workers rather than households as the unit of analysis, and (b) defines the UI recipiency rate as the ratio of UI recipients to the total number of unemployed people. Strictly speaking, there are several UI recipiency rates. In practice, the measure of UI “recipients” is typically approximated by the number of UI claimants who submit a claim for UI benefits, a figure in UI administrative data that includes some claimants who do not receive UI benefits. However, Wandner and Stengle note, “The Advisory Council on Unemployment Compensation has recommended using a measure of weeks compensated under the regular unemploy-ment insurance program, rather than using weeks claimed, as only about 85 percent of unemployed workers initially claiming benefits eventually receive them” (Wandner and Stengle, 1997, p. 23, emphasis in original). Most commonly, a measure of recipiency covers the regular State programs of UI, but can also cover extended benefit programs and pro-grams for Federal employees and ex-military personnel (Wandner and Stengle, 1997).
33The Supplemental Nutrition Assistance Program (SNAP) Joint Participation Rate (JPR) and Unemployment Insur-ance (UI) JPR necessarily exceed the ratio of joint households to all U.S. households because the SNAP households or UI households (in the denominators) are each a subset of U.S. households.
34It is possible to derive other measures of business-cycle effects using other pairs of years to make comparisons. For example, estimates for 2009 could be compared to estimates for 2007, the year prior to the 2008-09 recession. The esti-mated number of Unemployment Insurance households reaches its study-period minimum in 2007 (at about 4.8 million), making the 2007-09 difference larger than the 2005-09 difference. Methodologically, we did not choose the year(s) of comparison in order to make the business-cycle effects especially large (or small). Instead, we chose our reference year to be 2005 based on the analysis of the Congressional Budget Office (2010) that identifies 2005 as a year of full employ-ment, with Gross Domestic Product (GDP) differing from full-employment (potential) GDP by less than $5 billion or 0.05 percent of potential GDP; these differences were smaller than for any other year in our study period.
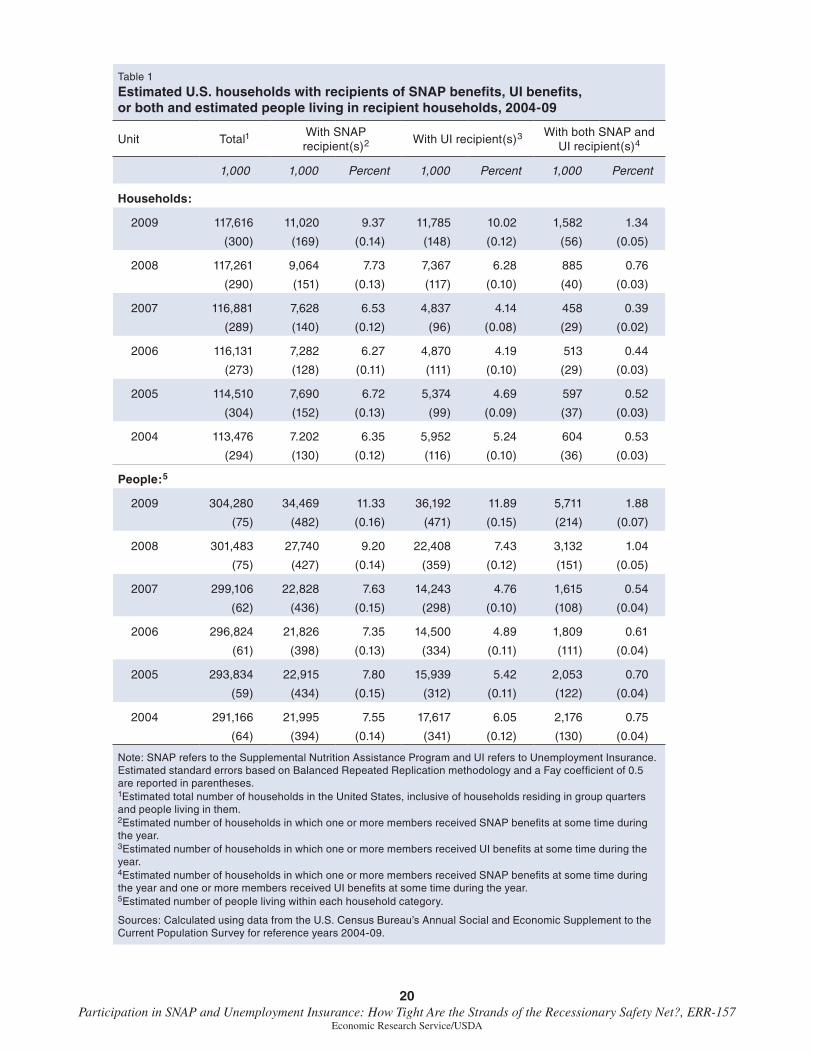
20 Participation in SNAP and Unemployment Insurance: How Tight Are the Strands of the Recessionary Safety Net?, ERR-157
Economic Research Service/USDA
Table 1
Estimated U.S. households with recipients of SNAP benefits, UI benefits, or both and estimated people living in recipient households, 2004-09
Unit Total1With SNAP recipient(s)2 With UI recipient(s)3 With both SNAP and
UI recipient(s)4
1,000 1,000 Percent 1,000 Percent 1,000 Percent
Households:
2009 117,616 11,020 9.37 11,785 10.02 1,582 1.34
(300) (169) (0.14) (148) (0.12) (56) (0.05)
2008 117,261 9,064 7.73 7,367 6.28 885 0.76
(290) (151) (0.13) (117) (0.10) (40) (0.03)
2007 116,881 7,628 6.53 4,837 4.14 458 0.39
(289) (140) (0.12) (96) (0.08) (29) (0.02)
2006 116,131 7,282 6.27 4,870 4.19 513 0.44
(273) (128) (0.11) (111) (0.10) (29) (0.03)
2005 114,510 7,690 6.72 5,374 4.69 597 0.52
(304) (152) (0.13) (99) (0.09) (37) (0.03)
2004 113,476 7.202 6.35 5,952 5.24 604 0.53
(294) (130) (0.12) (116) (0.10) (36) (0.03)
People:5
2009 304,280 34,469 11.33 36,192 11.89 5,711 1.88
(75) (482) (0.16) (471) (0.15) (214) (0.07)
2008 301,483 27,740 9.20 22,408 7.43 3,132 1.04
(75) (427) (0.14) (359) (0.12) (151) (0.05)
2007 299,106 22,828 7.63 14,243 4.76 1,615 0.54
(62) (436) (0.15) (298) (0.10) (108) (0.04)
2006 296,824 21,826 7.35 14,500 4.89 1,809 0.61
(61) (398) (0.13) (334) (0.11) (111) (0.04)
2005 293,834 22,915 7.80 15,939 5.42 2,053 0.70
(59) (434) (0.15) (312) (0.11) (122) (0.04)
2004 291,166 21,995 7.55 17,617 6.05 2,176 0.75
(64) (394) (0.14) (341) (0.12) (130) (0.04)
Note: SNAP refers to the Supplemental Nutrition Assistance Program and UI refers to Unemployment Insurance. Estimated standard errors based on Balanced Repeated Replication methodology and a Fay coefficient of 0.5 are reported in parentheses. 1Estimated total number of households in the United States, inclusive of households residing in group quarters and people living in them. 2Estimated number of households in which one or more members received SNAP benefits at some time during the year.3Estimated number of households in which one or more members received UI benefits at some time during the year.4Estimated number of households in which one or more members received SNAP benefits at some time during the year and one or more members received UI benefits at some time during the year.5Estimated number of people living within each household category.
Sources: Calculated using data from the U.S. Census Bureau’s Annual Social and Economic Supplement to the Current Population Survey for reference years 2004-09.

21 Participation in SNAP and Unemployment Insurance: How Tight Are the Strands of the Recessionary Safety Net?, ERR-157
Economic Research Service/USDA
of U.S. households receiving both SNAP and UI (joint households) rose by about 0.8 percentage points (from 0.5 to 1.3 percent), representing an increase of about 1.0 million joint households (from 0.6 million to 1.6 million). The 2005-09 increase in UI households exceeds the increase in SNAP households which, in turn, increased by more than joint households.
We expected that joint households increased in the recession, given that SNAP households and UI house-holds each increased. However, it is not so clear what patterns to expect for the SNAP JPR (J/S) and the UI JPR (J/U). Mathematically, either of these measures could rise or fall over 2005-09, depending on whether joint participation increased proportionately more or less than SNAP and UI participation.
Although the number of SNAP households fluctuated a bit, the decline in joint households was sufficiently large that the SNAP JPR (J/S) declined early in the study period (fig. 3). Then, in 2008, the SNAP JPR rose to about 9.8 percent and rose further in 2009. In the most severe recessionary conditions of the study period, about 1 in 7 (14.4 percent) of SNAP households also received UI. Appendix table A-1 supplements figure 3 by providing annual estimates of the SNAP JPR and the UI JPR and the standard errors of the estimates.35
35In addition, the table reports t-statistics for the test of whether an estimate is statistically significantly different from its 2005 estimated value for years 2007-09.
Figure 3
JPRs for SNAP and UI programs are responsive to economic conditions, 2004-09
Note: The Supplemental Nutrition Assistance Program (SNAP) Joint Participation Rate (JPR) is the share of SNAP households that also receive Unemployment Insurance (UI) benefits. The UI JPR is the share of UI households that also receive SNAP benefits. Sources: JPRs were calculated using data from the U.S. Census Bureau’s Annual Social and Economic Supplement to the Current Population Survey for reference years 2004-09. The unemployment rate is the annual average of the seasonally adjusted civilian unemployment rate among all civilian workers, as reported in table B-42 of the Economic Report of the President, 2011.
Percent
8.47.8
7.06.0
9.8
14.4
10.111.1 10.5
9.5
12.0
13.4
5.55.1 4.6 4.6
5.8
9.3
0
2
4
6
8
10
12
14
16
2004 05 06 07 08 09
UI Joint Participation Rate
SNAP Joint Participation Rate
Unemployment rate

22 Participation in SNAP and Unemployment Insurance: How Tight Are the Strands of the Recessionary Safety Net?, ERR-157
Economic Research Service/USDA
The figure shows the UI JPR fluctuated between 10.1 percent in 2004 and its minimum value (in the study period) of 9.5 percent in 2007. With the onset of the recession, the UI JPR rose to 12.0 percent in 2008 and to 13.4 percent in 2009. The 2005-09 increase in the UI JPR was a statistically signifi-cant 2.3 percentage points (from 11.1 to 13.4 percent).
Major findings about business-cycle effects are:
• The SNAP JPR and the UI JPR each increased under recessionary conditions, with the SNAP JPR increasing from 7.8 to 14.4 percent and the UI JPR increasing from 11.1 to 13.4 percent, each of which is statistically significant36;
• The SNAP JPR increased by more than the UI JPR (6.6 versus 2.3 percentage points).
These findings can be explained as a mathematical consequence of proportionate changes in SNAP, UI, and joint participation (based on table 1) that occurred over 2005-09:
• The SNAP JPR (J/S) and the UI JPR (J/U) each increased because the proportionate increase in joint households (165 percent, from 597,000 to 1,582,000) exceeded the proportionate increases in SNAP households (43 percent, from 7,690,000 to 11,020,000) and UI households (120 percent, from 5,374,000 to 11,785,000).
• The SNAP JPR increased by more than the UI JPR because the denominator of the UI JPR rose proportionately more than the denominator of the SNAP JPR (120 percent versus 43 percent).
In summary, SNAP, UI, and joint participation (measured by numbers of households or as shares of U.S. households) each increased during the economic downturn. Moreover, during the recession, the overlaps in SNAP and UI participation also increased the share of SNAP households receiving UI (SNAP JPR) and the share of UI households receiving SNAP (UI JPR). The recessionary safety net grew.
36An estimated result is statistically significant when it is unlikely to be due to chance associated with sampling error. Following the practice of the Census Bureau (2010b, p. G-9), we adopt the 0.10 level of significance to make determina-tions of statistical significance.

23 Participation in SNAP and Unemployment Insurance: How Tight Are the Strands of the Recessionary Safety Net?, ERR-157
Economic Research Service/USDA
Recessionary Caseloads and Changes in Joint Participation Rates
Although both the SNAP and UI JPRs increased during the recession, the SNAP JPR increased by relatively more, reflecting the proportionate changes in SNAP, UI, and joint participation. To explore factors that drove those proportionate changes and the meaning of the recessionary safety net, we consider changes in caseload composition and introduce the key concept of a “recessionary caseload.”
Even under full-employment conditions, SNAP or UI still have some participation, which we refer to as full-employment caseloads for SNAP and UI and designate by the symbols S* and U*. If the economy were perpetually at full employment, SNAP and UI caseloads could each be roughly constant over time at S* and U*.37 However, recessionary conditions in 2008 and 2009 increased the SNAP and UI caseloads above their full-employment levels. We define the recessionary caseload for a program (either SNAP or UI) as the difference, given by ΔSt and ΔUt, between the program’s annual caseload, St and Ut, and its full-employment caseload, S* and U*; the same distinction between recessionary and full-employment caseloads can be made for the joint households:
(1a) ΔSt = St – S*
(1b) ΔUt = Ut – U*
(1c) ΔJt = Jt – J*
which can easily be re-expressed as:
(2a) St = S* + ΔSt
(2b) Ut = U* + ΔUt
(2c) Jt = J* + ΔJt
According to equation (2), a program’s annual caseload can be broken down into its full-employment caseload and its recessionary caseload.38 The recessionary caseload is a “marginal” caseload that is added to the full-employment caseload. The marginal SNAP households in the recessionary case-loads represent “net additional” households (households that were part of the caseload in 2009 but not in 2005).39
37Factors such as population growth cause gradual annual changes in the Supplemental Nutrition Assistance Pro-gram or Unemployment Insurance full-employment caseloads. Over the course of a decade or two, even gradual annual changes accumulate, resulting in important increases in S* and U* over time. For our shorter 2004-09 study period, we consider S* and U* fixed, thereby treating these factors as negligible in order to concentrate on business-cycle effects.
38Our decomposition of a caseload mirrors other decompositions in economics, e.g., the Gross Domestic Product, the unemployment rate, and the Federal budget deficit can each be decomposed into an estimated full-employment compo-nent and a cyclical component.
39The Annual Social and Economic Supplement data used for our study are not a long-term panel data set, and we cannot identify—and for our study we do not need to identify—which individual Supplemental Nutrition Assistance Program (SNAP) households in 2009 are “new” to the caseload in the sense that they never participated before or were not participants in 2005. Our data are able to estimate “net additional” SNAP households and that is all that our study required.

24 Participation in SNAP and Unemployment Insurance: How Tight Are the Strands of the Recessionary Safety Net?, ERR-157
Economic Research Service/USDA
Table 2 provides an example of the JPR for the SNAP recessionary caseload; the JPR for the UI recessionary caseload is analogous. In 2005, 14 of 200 SNAP households also received UI (the SNAP JPR was 7 percent). During the recessionary year of 2009, a larger share—25 out of 250 (or 10 percent)—of the SNAP caseload received UI. From full employment to recession, the SNAP recessionary caseload was 50 (250-200 SNAP households) and the joint recessionary caseload was 11 (25-14 households). With 11 net additional joint households and 50 net additional SNAP house-holds in 2009, just over one-fifth (22 percent) of the net additional SNAP households also received UI—a ratio that we define as the Joint Participation Rate for the SNAP recessionary caseload. The ratio does not mean that 22 percent of all SNAP households in 2009 were joint participants—just 22 percent of the net additional households.
In the example, the driving factor that increases the SNAP JPR for the overall SNAP caseload is that the JPR for the SNAP recessionary caseload exceeded the SNAP JPR for the full-employment caseload in 2005 (22 versus 7 percent). As the net additional SNAP households joined the caseload in 2009, the mix of SNAP households changed. A portion of the 2009 SNAP caseload—the portion consisting of the net additional SNAP households—received UI at a greater rate than the 2005 SNAP caseload, which resulted in the increase in the SNAP JPR (from 7 to 10 percent).
To better understand the example and how a changing composition of the SNAP caseload helps explain the increase in the SNAP JPR, there are two cases to consider. The first case is based on an assumption that is not represented by the table’s example. Suppose that SNAP households in the full-employment caseload in 2005 and SNAP households in the recessionary caseload in 2009 have identical “profiles” of characteristics—that is, the two caseloads have the same distributions of households exhibiting various conditions, experiences, characteristics, and behaviors. Then, by supposition, the same percentage of SNAP households receive UI in both the full-employment caseload and the recessionary caseload—i.e., the SNAP recessionary caseload JPR in 2009 and the SNAP JPR in 2005 would be equal (say at 7 percent). If so, then, as SNAP’s net additional house-holds enter the caseload in 2009, their entry makes no difference to the overall caseload’s mix of characteristics and that entry makes no difference to the SNAP JPR, which would stay steady over time (at 7 percent).
Table 2
Example defining the JPR for the SNAP recessionary caseload
YearJoint
caseloadSNAP
caseload
SNAP JPR
(“average”)
Joint recessionary
caseload
SNAP recessionary
caseload
JPR for the SNAP
recessionary caseload
(“marginal”)
J S JS
ΔJ ΔS ΔJΔS
2005 (full employment) 14 200 0.07
2009 (recession) 25 250 0.10 25 – 14 =11 250 – 200 =50 11/50 =0.22
Note: A recessionary caseload is the difference between the measured caseload for a given year and the caseload at full employment (2005 for this report). The definition for a recessionary caseload is applicable for the Supplemental Nutrition Assistance Program (SNAP), for Unemployment Insurance (UI), and for the joint caseload (those households that receive both SNAP and UI). The Joint Participation Rate (JPR) for SNAP’s recessionary caseload is the ratio of the joint recessionary caseload to the SNAP recessionary caseload.
Source: USDA, Economic Research Service.
25 Participation in SNAP and Unemployment Insurance: How Tight Are the Strands of the Recessionary Safety Net?, ERR-157
Economic Research Service/USDA
For the second case, suppose the profiles of characteristics for the full-employment and recessionary caseloads are different. In particular, the overall SNAP caseload at full employment contains a rela-tively high proportion of households with limited labor market connections that impede UI receipt—e.g., the elderly poor who are retired; the disabled poor who may not be employed; and workers who do not meet UI-eligibility requirements if they were to become laid off because they have short work histories or low earnings. There are some households in the SNAP full-employment caseload with a UI-receiving worker who, before becoming unemployed, had tight labor market connections (i.e., their work histories and earnings are sufficient to meet UI-eligibility requirements), but they are relatively few; in 2005, the SNAP JPR is relatively low at 7 percent. In contrast, the net additional SNAP households have relatively more households with tight labor market connections. Importantly, a feature of recessions is an increase in layoffs throughout the economy—including among those with tight labor market connections.40 Thus, under recessionary conditions, we expect that the share of net additional SNAP households that also get UI will be relatively greater compared to UI receipt among the overall SNAP caseload at full employment (22 versus 7 percent in the example). Because the SNAP recessionary caseload drives changes in the overall caseload, the mix of household types in the overall SNAP caseload changes: during a recession, the households with tight connections and greater UI receipt become a larger share of the SNAP caseload, increasing the overall share of SNAP households that receive UI. This caseload-composition effect of a changing mix of SNAP households is consistent with the estimated increase in the SNAP JPR in 2009 compared to 2005.
Values for the JPRs of recessionary caseloads are added to estimated SNAP and UI JPRs (fig. 4) to account for our two major findings about business-cycle effects. The figure explains why both SNAP JPRs and UI JPRs increased during the recession, and why SNAP JPRs increased by more than UI JPRs. To highlight the effects of the recession, the figure compares the recessionary years 2008 and 2009 with the full-employment year 2005; 2006 and 2007 are omitted.41
The figure depicts the “average” JPRs for the overall caseload and the “marginal” JPRs for the reces-sionary caseload. Economic principles establish that when a marginal value exceeds an average value, the average rises. For 2008, the estimated JPR for SNAP’s recessionary caseload is about 21 percent, which exceeds the estimated 7.8 percent SNAP JPR for the overall SNAP caseload at full employment in 2005. Once the net additional SNAP households enter the mix in 2008, their relatively high JPR pulls up the SNAP JPR in 2008 for the caseload as a whole. Thus, because the marginal value exceeds the average value, the SNAP JPR increases from 7.8 to 9.8 percent in 2008. This process is compounded even further the next year. In 2009, nearly 3 in 10 (29.6 percent) of the net additional SNAP households also receive UI, which raises the overall caseload’s SNAP JPR in 2009 to 14.4 percent.
The UI JPR rose from 11.1 to 12.0 percent between 2005 and 2008 because the JPR for the UI reces-sionary caseload of 14.5 percent exceeded the UI JPR in 2005. The JPR for the UI recessionary caseload of 15.4 percent in 2009 brought that year’s UI JPR to 13.4 percent.
40As shown in figure 1, the combination of a tight labor market connection (in a UI-covered job) and a layoff together confer Unemployment Insurance (UI) eligibility—either factor without the other is insufficient to result in UI receipt.
41Appendix table A-2 contains the recessionary caseloads and their associated Joint Participation Rates (JPRs) for every year in the 2004-09 study period. The appendix provides additional details on the measurement of recessionary caseloads, the relationships among the JPRs for the recessionary and full-employment caseloads, and properties and results of the JPR for a recessionary caseload.

26 Participation in SNAP and Unemployment Insurance: How Tight Are the Strands of the Recessionary Safety Net?, ERR-157
Economic Research Service/USDA
While the quantitative magnitudes differ, the qualitative relationships between the JPR and the recessionary caseload JPR are the same for SNAP and for UI. Our first major finding for business-cycle effects was that the SNAP and UI JPRs both rose in the recession. This finding occurs because the JPRs for the recessionary caseload (a marginal value) exceeded the JPRs for the full-employ-ment caseload (an average value), increasing the JPR for the overall caseload.
Our second major finding was that the SNAP JPR rose more than the UI JPR (6.6 versus 2.3 percentage points). This result is also explained by the relationship between marginal and average values—only now, relative magnitudes need to be taken into account: a difference between a marginal and an average value that is relatively large increases the average by more than a smaller difference. The difference between the JPR of the SNAP recessionary caseload in 2009 and the SNAP JPR at full employment is relatively large—21.8 percentage points (29.6 less 7.8 percent)—and increases the SNAP JPR by a relatively large amount. In contrast, the difference between the JPR of the UI recessionary caseload in 2009 and the UI JPR at full employment is relatively small— 4.3 percentage points (15.4 less 11.1 percent). Therefore, while the SNAP and UI JPRs both increase in the recession, the SNAP JPR increases more than the UI JPR.42
42The appendix examines these relationships in mathematical detail.
Figure 4
SNAP and UI JPRs (“average”) and the JPRs for their recessionary caseloads (“marginal”)
Percent
7.8
9.8
14.4
11.112.0
13.4
0
5
10
15
20
25
30SNAP recessionary caseload JPRs ("marginal")
SNAP JPRs ("average")
UI JPRs ("average")
UI recessionary caseload JPRs ("marginal")
2005 (full employment) 2008 (recession) 2009 (recession)
21.0
15.414.5
29.6
Note: The Supplemental Nutrition Assistance Program (SNAP) Joint Participation Rate (JPR) is the share of SNAP households that also receive Unemployment Insurance (UI) benefits. The UI JPR is the share of UI households that also receive SNAP benefits. The SNAP recessionary caseload JPR is the ratio of the joint recessionary caseload to the SNAP recessionary caseload. The UI recessionary caseload JPR is the ratio of the joint recessionary caseload to the UIrecessionary caseload. Sources: Appendix tables A-1, A-2.

27 Participation in SNAP and Unemployment Insurance: How Tight Are the Strands of the Recessionary Safety Net?, ERR-157
Economic Research Service/USDA
Joint Participation by Household Income Relative to Poverty
As we examine differences within and across subgroups, research and policy issues that emerge consider which types of households are most likely to receive both SNAP and UI, and which types of households are more likely to rely on SNAP alone or UI alone.
We use household annual IRP as our measure of household income because the poverty thresholds are adjusted for the number of people in the household and for price inflation, and because they are the basis of SNAP’s monthly income-eligibility guidelines.
Generally, UI JPRs (the shares of UI households that receive SNAP) are likely to decrease as annual IRP increases. Two factors play a role in this decrease:
• Monthly income variability and SNAP eligibility. SNAP’s income-eligibility rule limiting household (gross) income to 130 percent of poverty (with exceptions) applies to monthly income. Some households with chronically low income have monthly income at or below 130 percent every month of the year; as a result, they also have annual IRP below 130 percent. Some house-holds with IRP above 130 percent of the poverty level on an annual basis can be eligible for and receive SNAP for part of the year. Their monthly income variability may result in temporarily low monthly IRP at or below SNAP’s monthly limit. As a household’s annual IRP increases above 130 percent, the probability becomes smaller that the household will experience a drop in income large enough to make it income eligible for SNAP based on monthly income. Thus, UI households with annual IRP above 130 percent receive SNAP at a positive (rather than zero) rate that diminishes with income.
• Participation choices of SNAP-eligible households. Annual IRP reflects some combination of low monthly incomes (low monthly IRP) and the number of months in which monthly IRP was low. A lower annual IRP is associated with greater household needs. Also, SNAP benefits increase as a household’s income decreases (other factors constant). Altogether, we expect that, as a SNAP-eligible household’s annual IRP falls, the probability increases that it will choose to apply for and receive SNAP. Alternatively, we expect that SNAP participation falls as a SNAP-eligible household’s annual IRP increases.
A UI-only Participation Rate is the share of UI households that are not joint participants; because every UI household either receives only UI or also receives SNAP, the UI-only Participation Rate and the UI JPR sum to 100 percent. Concerns about low SNAP participation can arise if there is a low UI JPR—or, correspondingly, a high UI-only Participation Rate—specifically among lower income households that are likely to be SNAP eligible. This consideration highlights the importance of supplementing aggregate analysis with subgroup analysis of households at various levels of house-hold income.43
Generally, SNAP JPRs (the shares of SNAP households that receive UI) are likely to increase with annual IRP, at least across some initial range of income. Factors that play a role in this increase are:
43The effects of underreporting of Supplemental Nutrition Assistance Program benefits are especially germane here if propensities to underreport vary across households with different levels of income.

28 Participation in SNAP and Unemployment Insurance: How Tight Are the Strands of the Recessionary Safety Net?, ERR-157
Economic Research Service/USDA
• UI eligibility. Households with higher IRP may be more likely to have members who are UI eligible than households with lower IRP. It is possible that higher IRP households are more likely to have UI-eligible members even if they experience unemployment less often than lower income households do. Relative to households with lower annual IRP, households with higher IRP may be more likely to have members who have:
- Earnings from work (versus retirement income, disability income, SNAP, or other resources);
- Jobs that are UI covered (versus non-covered jobs in agriculture or domestic service jobs, which tend to have workers with lower IRP);
- Work “experience” as measured by their State UI program (versus having limited labor market connections with sporadic employment in low-paying jobs); and
- Greater likelihood of job loss due to “no fault” of the worker (versus “fired for cause”).
For some combination of these four factors, SNAP households with lower IRP are relatively less likely to receive UI because their connections to the labor market are weaker, precluding UI eligi-bility. Indeed, these weaker labor market connections result not only in lower UI eligibility and lower SNAP JPRs but also in the lower household incomes by which we are categorizing these SNAP households as “lower IRP” in the first place.
• Participation choices by UI-eligible households. Barriers to UI application and participation—such as limited information or familiarity, limited physical access, or concerns about partici-pating in UI—may be rarer among higher IRP households than among lower IRP households.
The SNAP-only Participation Rate is the share of SNAP-receiving households that are not joint participants; because every SNAP household either only receives SNAP or also receives UI, the SNAP-only Participation Rate and the SNAP JPR sum to 100 percent. An issue for SNAP’s role in the safety net is the extent to which SNAP households may be SNAP-only households, especially among households with low annual IRP.
We chose seven IRP subgroups to examine joint participation patterns. The seven subgroups consisted of households with IRP in the ranges of: less than 50 percent of poverty, 51-99 percent of poverty, 100-149 percent of poverty, 150-199 percent of poverty, 200-249 percent of poverty, 250-299 percent of poverty, and 300 percent of poverty or more. The seventh subgroup (300 or more percent of poverty) contains more than half of U.S. households (52.8 and 55.1 percent in 2009 and 2005, respectively). Thus, our results cover all U.S. households while focusing on distinctions among households with IRP below median household (the median household at the 50th percentile is contained in the seventh subgroup while the other six subgroups divide the lower half of the income distribution).
Estimated SNAP JPRs and UI JPRs across IRP subgroups for both 2009 (solid lines) and 2005 (dashed lines) are in figure 5. In 2009, the estimated UI JPRs are negatively related to IRP. UI JPRs fall from an estimated 57.1 percent in the first subgroup (less than 50 percent of poverty) to 1.8 percent in the seventh subgroup (above 300 percent of poverty). The decline in UI JPRs is substan-tial (55.3 percentage points across all seven subgroups) and is more than double the change in the SNAP JPR (19.2 percentage points, from 6.7 to 25.9 percent).
To determine whether the negative relationship between the UI JPR and income is statistically significant, we conducted six t-tests on the difference between each successive pair of the seven estimated UI JPRs. The difference between the UI JPR of the first subgroup (less than 50 percent of

29 Participation in SNAP and Unemployment Insurance: How Tight Are the Strands of the Recessionary Safety Net?, ERR-157
Economic Research Service/USDA
poverty) and the second (50 to 99 percent of poverty) is not statistically significant. From the second subgroup through the seventh, however, each t-test was statistically significant.44 Therefore, for the overall statistical relationship, we conclude that the UI JPR is negatively related to IRP.
The UI JPRs for the first two subgroups (and perhaps the third and even fourth subgroups) are espe-cially important from a SNAP participation perspective. Households in the first two subgroups must be income-eligible for SNAP: if annual IRP is at or below 100 percent of poverty for the year as a whole, then monthly IRP must be at or below the poverty level for some months (and probably most) of the year.
The result that UI JPRs fall with household income points to an important safety-net function for SNAP: while SNAP can serve all households that have low monthly income, including UI house-holds, the UI households most likely to receive SNAP are those that have the lowest annual incomes.
SNAP JPRs, on the other hand, tend to increase across IRP subgroups. In 2009, the SNAP JPR rose from a low of 6.7 percent in the first subgroup to 25.9 percent in the seventh subgroup. The increase occurs primarily in the lower IRP subgroups, with the SNAP JPR curve flattening for higher IRP subgroups. Thus, UI participation among below-poverty SNAP households is below UI participation among above-poverty SNAP households.
A series of t-tests on the differences between the SNAP JPRs of each successive pair of IRP subgroups confirms that the changes in SNAP JPRs are statistically significant only across the first four subgroups.45 The differences are not statistically significant for any of the remaining three pairs.46 The statistical conclusion is that the SNAP JPR curve has two segments: it increases across the lower IPR subgroups and then remains steady across the higher IRP subgroups. However, about 76.3 percent of SNAP households are in the first three subgroups.47 We describe the SNAP JPR curve as “initially increasing.”
For the United States, the 2009 SNAP JPR was 14.4 percent (fig. 4), making the SNAP-only Participation Rate 85.6 percent. At the IRP subgroup level, given that the SNAP JPRs are lowest for below-poverty households (the first two subgroups), their SNAP-only Participation Rates—at 93.3 and 89.5 percent—are the highest (by statistically significant amounts). Thus, below-poverty SNAP households are more likely to rely on SNAP alone than SNAP households with higher IRP.
From the declining UI JPRs and the initially increasing SNAP JPRs, we can surmise that subgroups of households show different patterns of combining SNAP with UI or, alternatively, exhibiting SNAP-only participation. SNAP is especially important in the below-poverty subgroup because below-poverty UI households are relatively more likely (than above-poverty UI households) to supplement UI with SNAP, and below-poverty SNAP households are relatively less likely (than
44The t-statistics for the differences in Unemployment Insurance Joint Participation Rates of the six successive pairs of subgroups are: -0.81, -4.70, -9.69, -6.47, -9.17, and -5.15.
45The t-values between the pairs of subgroups were: t = 3.78 for the difference between the first and the second sub-groups, t = 5.36 between the second and the third, and t = 6.86 between the third and the fourth.
46The t-values between the pairs of the remaining subgroups were: t = 0.77 between the fourth and the fifth, t = 0.83 between the fifth and the sixth, and t = 0.09 between the sixth and the seventh.
47The fourth subgroup could reasonably be classified on either the increasing or the flat segment of the curve inasmuch as it is the borderline subgroup. We included it in the flat section. Including it in the increasing section would shift its 11.7 percent of Supplemental Nutrition Assistance Program (SNAP) households, raising to 88.0 percent the share of SNAP households on the “increasing” segment.
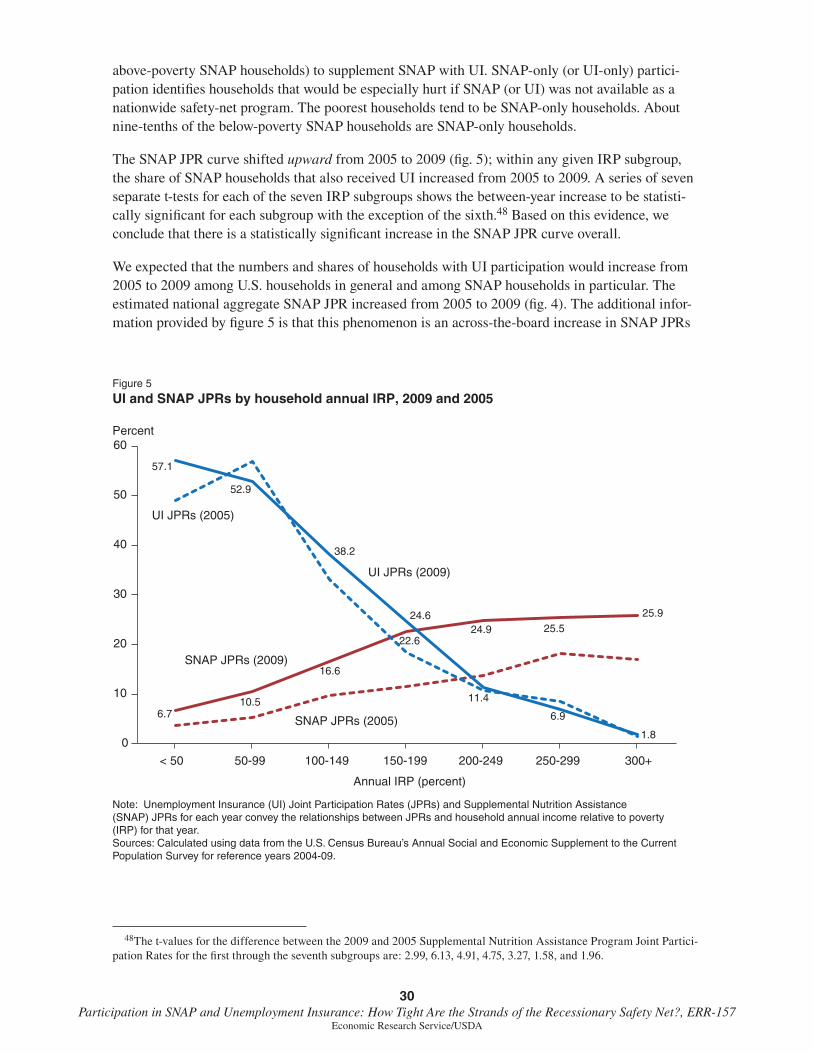
30 Participation in SNAP and Unemployment Insurance: How Tight Are the Strands of the Recessionary Safety Net?, ERR-157
Economic Research Service/USDA
above-poverty SNAP households) to supplement SNAP with UI. SNAP-only (or UI-only) partici-pation identifies households that would be especially hurt if SNAP (or UI) was not available as a nationwide safety-net program. The poorest households tend to be SNAP-only households. About nine-tenths of the below-poverty SNAP households are SNAP-only households.
The SNAP JPR curve shifted upward from 2005 to 2009 (fig. 5); within any given IRP subgroup, the share of SNAP households that also received UI increased from 2005 to 2009. A series of seven separate t-tests for each of the seven IRP subgroups shows the between-year increase to be statisti-cally significant for each subgroup with the exception of the sixth.48 Based on this evidence, we conclude that there is a statistically significant increase in the SNAP JPR curve overall.
We expected that the numbers and shares of households with UI participation would increase from 2005 to 2009 among U.S. households in general and among SNAP households in particular. The estimated national aggregate SNAP JPR increased from 2005 to 2009 (fig. 4). The additional infor-mation provided by figure 5 is that this phenomenon is an across-the-board increase in SNAP JPRs
48The t-values for the difference between the 2009 and 2005 Supplemental Nutrition Assistance Program Joint Partici-pation Rates for the first through the seventh subgroups are: 2.99, 6.13, 4.91, 4.75, 3.27, 1.58, and 1.96.
Figure 5
UI and SNAP JPRs by household annual IRP, 2009 and 2005
6.710.5
16.6
22.624.9 25.5
25.9
57.1
52.9
38.2
24.6
11.4
6.9
1.80
10
20
30
40
50
60
< 50 50-99 100-149 150-199 200-249 250-299 300+
Annual IRP (percent)
SNAP JPRs (2009)
UI JPRs (2005)
Note: Unemployment Insurance (UI) Joint Participation Rates (JPRs) and Supplemental Nutrition Assistance (SNAP) JPRs for each year convey the relationships between JPRs and household annual income relative to poverty (IRP) for that year. Sources: Calculated using data from the U.S. Census Bureau’s Annual Social and Economic Supplement to the Current Population Survey for reference years 2004-09.
Percent
UI JPRs (2009)
SNAP JPRs (2005)
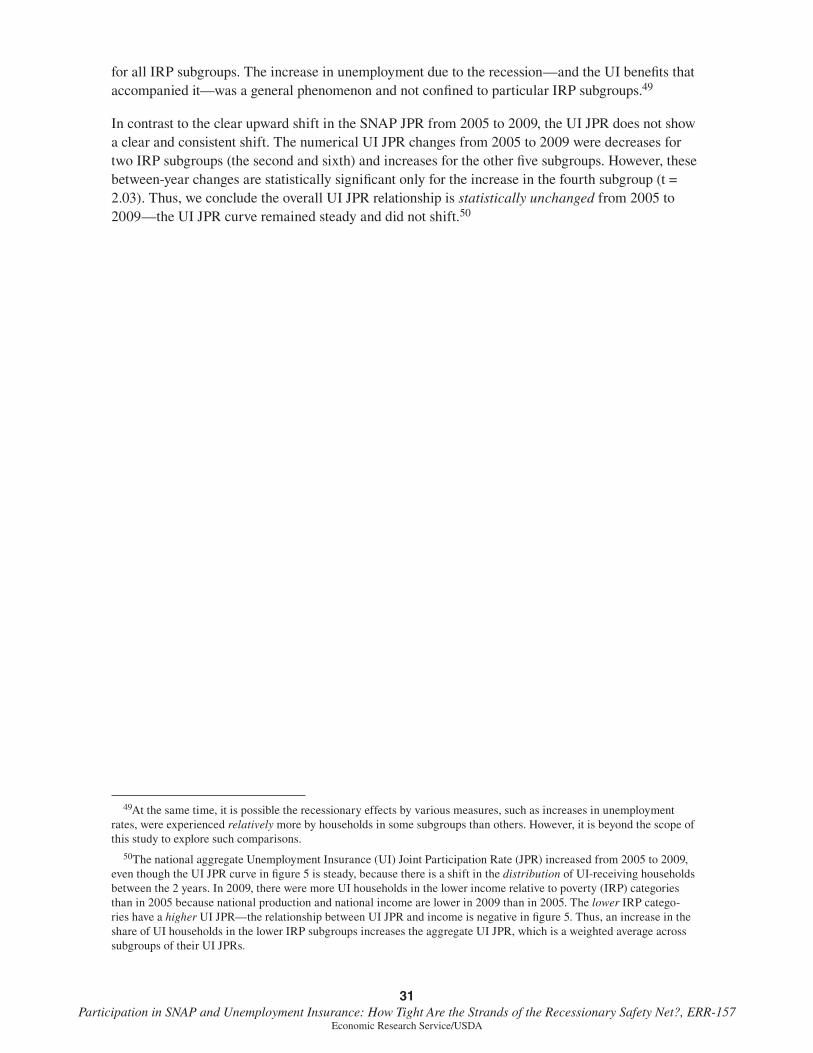
31 Participation in SNAP and Unemployment Insurance: How Tight Are the Strands of the Recessionary Safety Net?, ERR-157
Economic Research Service/USDA
for all IRP subgroups. The increase in unemployment due to the recession—and the UI benefits that accompanied it—was a general phenomenon and not confined to particular IRP subgroups.49
In contrast to the clear upward shift in the SNAP JPR from 2005 to 2009, the UI JPR does not show a clear and consistent shift. The numerical UI JPR changes from 2005 to 2009 were decreases for two IRP subgroups (the second and sixth) and increases for the other five subgroups. However, these between-year changes are statistically significant only for the increase in the fourth subgroup (t = 2.03). Thus, we conclude the overall UI JPR relationship is statistically unchanged from 2005 to 2009—the UI JPR curve remained steady and did not shift.50
49At the same time, it is possible the recessionary effects by various measures, such as increases in unemployment rates, were experienced relatively more by households in some subgroups than others. However, it is beyond the scope of this study to explore such comparisons.
50The national aggregate Unemployment Insurance (UI) Joint Participation Rate (JPR) increased from 2005 to 2009, even though the UI JPR curve in figure 5 is steady, because there is a shift in the distribution of UI-receiving households between the 2 years. In 2009, there were more UI households in the lower income relative to poverty (IRP) categories than in 2005 because national production and national income are lower in 2009 than in 2005. The lower IRP catego-ries have a higher UI JPR—the relationship between UI JPR and income is negative in figure 5. Thus, an increase in the share of UI households in the lower IRP subgroups increases the aggregate UI JPR, which is a weighted average across subgroups of their UI JPRs.
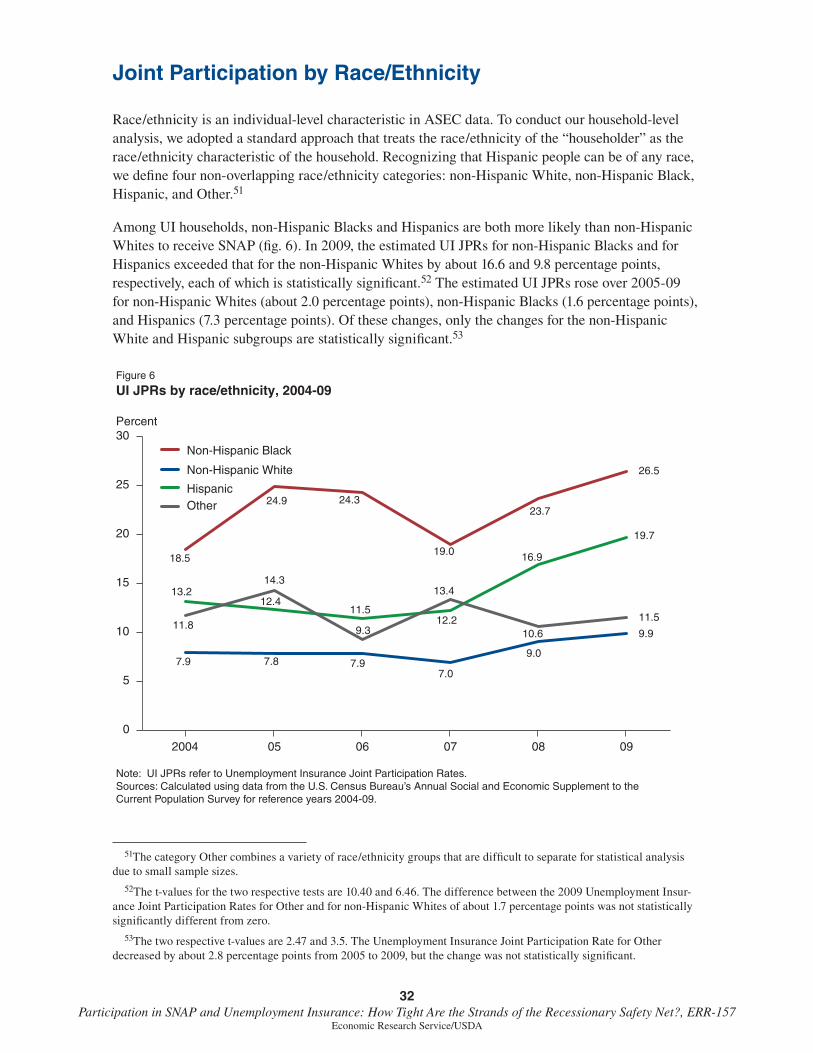
32 Participation in SNAP and Unemployment Insurance: How Tight Are the Strands of the Recessionary Safety Net?, ERR-157
Economic Research Service/USDA
Joint Participation by Race/Ethnicity
Race/ethnicity is an individual-level characteristic in ASEC data. To conduct our household-level analysis, we adopted a standard approach that treats the race/ethnicity of the “householder” as the race/ethnicity characteristic of the household. Recognizing that Hispanic people can be of any race, we define four non-overlapping race/ethnicity categories: non-Hispanic White, non-Hispanic Black, Hispanic, and Other.51
Among UI households, non-Hispanic Blacks and Hispanics are both more likely than non-Hispanic Whites to receive SNAP (fig. 6). In 2009, the estimated UI JPRs for non-Hispanic Blacks and for Hispanics exceeded that for the non-Hispanic Whites by about 16.6 and 9.8 percentage points, respectively, each of which is statistically significant.52 The estimated UI JPRs rose over 2005-09 for non-Hispanic Whites (about 2.0 percentage points), non-Hispanic Blacks (1.6 percentage points), and Hispanics (7.3 percentage points). Of these changes, only the changes for the non-Hispanic White and Hispanic subgroups are statistically significant.53
51The category Other combines a variety of race/ethnicity groups that are difficult to separate for statistical analysis due to small sample sizes.
52The t-values for the two respective tests are 10.40 and 6.46. The difference between the 2009 Unemployment Insur-ance Joint Participation Rates for Other and for non-Hispanic Whites of about 1.7 percentage points was not statistically significantly different from zero.
53The two respective t-values are 2.47 and 3.5. The Unemployment Insurance Joint Participation Rate for Other decreased by about 2.8 percentage points from 2005 to 2009, but the change was not statistically significant.
Figure 6
UI JPRs by race/ethnicity, 2004-09
7.9 7.8 7.97.0
9.0
9.9
18.5
24.9 24.3
19.0
23.7
26.5
13.212.4
11.512.2
16.9
19.7
11.8
14.3
9.3
13.4
10.6
11.5
0
5
10
15
20
25
30
2004 05 06 07 08 09
Percent
Note: UI JPRs refer to Unemployment Insurance Joint Participation Rates. Sources: Calculated using data from the U.S. Census Bureau’s Annual Social and Economic Supplement to the Current Population Survey for reference years 2004-09.
Non-Hispanic White
Hispanic
Non-Hispanic Black
Other

33 Participation in SNAP and Unemployment Insurance: How Tight Are the Strands of the Recessionary Safety Net?, ERR-157
Economic Research Service/USDA
In 2009, the estimated SNAP JPRs for non-Hispanic Whites exceeded that for Hispanics by 2.3 percentage points, which is statistically significant (fig. 7).54 The increases in SNAP JPRs from 2005 to 2009 were statistically significant for non-Hispanic Whites (7.4 percentage points), non-Hispanic Blacks (5.4 percentage points), and Hispanics (7.7 percent).55
Perhaps the most notable feature of figure 7 is that the SNAP JPR time trends are more clustered than the UI JPR time trends (fig. 6) although the two figures are on the same scale. This may be attributable to the different effects that household income has on UI JPRs and SNAP JPRs.56 The finding that household income is negatively related to UI JPR (i.e., that an increase in household income is associated with a lower UI JPR) was illustrated in figure 5. Non-Hispanic White house-holds have a lower UI JPR than Hispanic or non-Hispanic Black households because non-Hispanic White households have comparatively higher household income, on average.
54The t-value is -1.99. The 2009 Supplemental Nutrition Assistance Program (SNAP) Joint Participation Rates (JPRs) for non-Hispanic Blacks and for Other were not statistically significantly different from the SNAP JPR for non-Hispanic Whites.
55The t-values are, respectively, 7.63, 4.82, and 6.17.56We recognize that other factors can influence race/ethnicity Unemployment Insurance (UI) Joint Participation Rates
(JPRs) and that single-factor explanations are typically incomplete. Even so, the results for UI JPRs across race/ethnicity categories are consistent with the relationship between UI JPRs and household income.
9.6
8.07.8
6.7
11.0
15.4
7.48.4 7.3
5.5
8.7
13.8
6.15.3 4.7 4.6
8.6
13.1
10.6 9.9
6.5
7.89.4
12.5
0
5
10
15
20
25
30
2004 05 06 07 08 09
Figure 7
SNAP JPRs by race/ethnicity, 2004-09
Percent
Note: SNAP JPRs refer to Supplement Nutrition Assistance Program Joint Participation Rates.Sources: Calculated using data from the U.S. Census Bureau’s Annual Social and Economic Supplement to the Current Population Survey for reference years 2004-09.
Non-Hispanic White
Hispanic
Non-Hispanic Black
Other
34 Participation in SNAP and Unemployment Insurance: How Tight Are the Strands of the Recessionary Safety Net?, ERR-157
Economic Research Service/USDA
The (positive) effect that household income has on SNAP JPRs is not as strong as its effect on UI JPRs. The decrease in UI JPRs across income categories is more than double the increase in SNAP JPRs (fig. 5). Moreover, the positive relationship between household income and SNAP JPRs flattens out in the higher income subgroups. Altogether, household income creates differences across race/ethnicity categories in SNAP JPRs, but the differences are smaller than for UI JPRs, resulting in (relative) clustering of the SNAP JPRs.

35 Participation in SNAP and Unemployment Insurance: How Tight Are the Strands of the Recessionary Safety Net?, ERR-157
Economic Research Service/USDA
Joint Participation by Education Level
According to the economic theory of “human capital,” a person acquires a set of skills, talents, and knowledge from education. While many factors affect labor market earnings, a person with more education earns more, on average, compared to a person with less education—at least during times when they both hold jobs. For most households, earnings are, by far, the largest source of income, so we expect the results for the effects of education on joint participation to resemble the results for the effects of household income on joint participation.
Education is a long-term characteristic (formal educational attainment remains largely unchanged for most people once they reach their late teens or early- to mid-twenties), while income can fluc-tuate month-to-month (based on job promotion, unemployment, cross-State mobility patterns, etc.). SNAP serves all types of low-income households, but households have low monthly income for different reasons and durations. A household with members with lower education levels may receive SNAP for many months or years, while a household with more highly educated members may receive SNAP due to temporary unemployment. Annual household income data cannot readily distinguish between these two households because, when both types of households receive SNAP in the same year, their annual incomes could be very similar for that year. Education level may be a more accurate indicator than current income of the long-term conditions and experiences of various SNAP households.
Like race/ethnicity, educational attainment is an individual-level characteristic in the ASEC data. Our study treats the education level of the “householder” as the education characteristic of the household and groups educational information from ASEC into five categories: less than 9th grade (4.4 percent of U.S. households in 2009), high school/no diploma (7.8 percent of households), high school diploma (29.5 percent of households), 1-3 years of college (27.9 percent of households), and bachelor’s degree or higher (30.2 percent of households).57
In 2009, the UI JPRs fall from a peak of 25.6 percent (for high school/no diploma) to a low of 3.7 percent (for the bachelor’s degree or higher category) (fig. 8). Each of the successive differ-ences in UI JPRs between those adjacent pairs of education categories is statistically significant.58 Therefore, we conclude that the overall relationship between UI JPRs and education of the house-holder is negative.
The 2009 estimates for SNAP JPRs initially rise across education categories, increasing from about 8.1 percent for the less than 9th grade category and peaking at 16.9 percent for the high school diploma category. After that, the SNAP JPR drops. The differences in SNAP JPRs between adja-cent pairs of education categories are statistically significant only for the first two adjacent pairs (from less than 9th grade to high school/no diploma and from high school/no diploma to high school
57For our study, and its focus on the Supplemental Nutrition Assistance Program and on lower income, lower education households, we chose to keep separate the first two categories rather than combining them into a single “less than high school diploma.”
58The numerical increase across the first two categories is not statistically significant. The t-values are -3.93 for the difference between the third and the second categories, -2.68 for the difference between the fourth and the third catego-ries, and -9.31 for the difference between the fifth and the fourth categories.
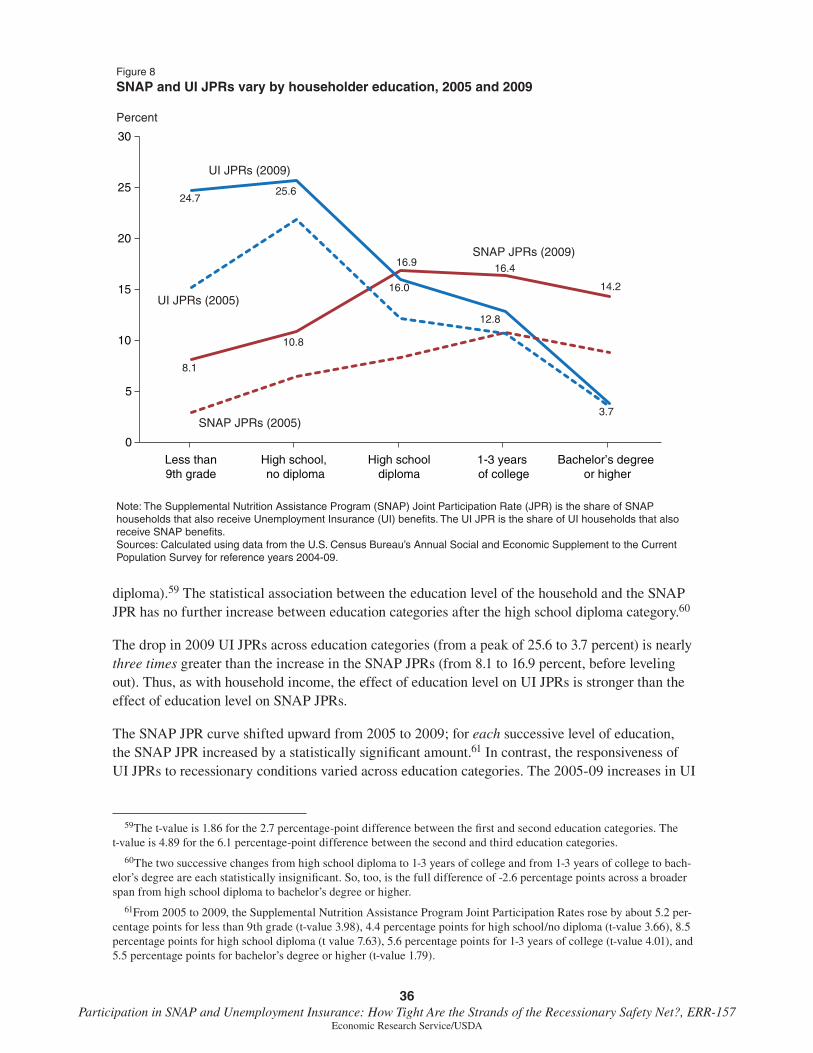
36 Participation in SNAP and Unemployment Insurance: How Tight Are the Strands of the Recessionary Safety Net?, ERR-157
Economic Research Service/USDA
diploma).59 The statistical association between the education level of the household and the SNAP JPR has no further increase between education categories after the high school diploma category.60
The drop in 2009 UI JPRs across education categories (from a peak of 25.6 to 3.7 percent) is nearly three times greater than the increase in the SNAP JPRs (from 8.1 to 16.9 percent, before leveling out). Thus, as with household income, the effect of education level on UI JPRs is stronger than the effect of education level on SNAP JPRs.
The SNAP JPR curve shifted upward from 2005 to 2009; for each successive level of education, the SNAP JPR increased by a statistically significant amount.61 In contrast, the responsiveness of UI JPRs to recessionary conditions varied across education categories. The 2005-09 increases in UI
59The t-value is 1.86 for the 2.7 percentage-point difference between the first and second education categories. The t-value is 4.89 for the 6.1 percentage-point difference between the second and third education categories.
60The two successive changes from high school diploma to 1-3 years of college and from 1-3 years of college to bach-elor’s degree are each statistically insignificant. So, too, is the full difference of -2.6 percentage points across a broader span from high school diploma to bachelor’s degree or higher.
61From 2005 to 2009, the Supplemental Nutrition Assistance Program Joint Participation Rates rose by about 5.2 per-centage points for less than 9th grade (t-value 3.98), 4.4 percentage points for high school/no diploma (t-value 3.66), 8.5 percentage points for high school diploma (t value 7.63), 5.6 percentage points for 1-3 years of college (t-value 4.01), and 5.5 percentage points for bachelor’s degree or higher (t-value 1.79).
Figure 8
SNAP and UI JPRs vary by householder education, 2005 and 2009
Percent
Note: The Supplemental Nutrition Assistance Program (SNAP) Joint Participation Rate (JPR) is the share of SNAP households that also receive Unemployment Insurance (UI) benefits. The UI JPR is the share of UI households that also receive SNAP benefits. Sources: Calculated using data from the U.S. Census Bureau’s Annual Social and Economic Supplement to the Current Population Survey for reference years 2004-09.
8.1
10.8
16.9 16.4
14.2
24.725.6
16.0
12.8
3.7
0
5
10
15
20
25
30
Less than9th grade
High school, no diploma
High schooldiploma
1-3 years of college
Bachelor’s degree or higher
SNAP JPRs (2009)
UI JPRs (2005)
UI JPRs (2009)
SNAP JPRs (2005)
37 Participation in SNAP and Unemployment Insurance: How Tight Are the Strands of the Recessionary Safety Net?, ERR-157
Economic Research Service/USDA
JPRs are statistically significant for only two of the five categories—less than 9th grade and high school diploma—which contained about 39.3 percent of all UI households in 2009.62
In summary, UI JPRs fall with the education level of the householder. UI households with less than a high school diploma are relatively more likely to receive SNAP to supplement their UI receipt than are households with higher education. In contrast, SNAP JPRs rise with education across the three lower educational categories. SNAP-only participation—receipt of SNAP without UI—is greatest for households with less than a high school diploma. SNAP-only households tend to be the least well-off, most vulnerable households as measured by education—a socio-economic determinant of lifetime earnings.
62The 2005-09 increase for less than 9th grade is 9.5 percentage points (t-value 1.81) and the increase for high school diploma is 3.8 percentage points (t-value of 2.52). The other increases—3.8 percentage points for high school/no diploma (t-value 1.11), 2.1 percentage points for 1-3 years of college (t-value 1.53), and 0.3 percentage points for bachelor’s degree or higher (t-value 0.23)—were each statistically insignificant.

38 Participation in SNAP and Unemployment Insurance: How Tight Are the Strands of the Recessionary Safety Net?, ERR-157
Economic Research Service/USDA
Conclusion
The severity of the recent recession, and the lingering unemployment in its aftermath, has focused attention on the roles of various government support programs in providing a safety net. The reces-sionary safety net is composed of those social safety-net programs for which participation is counter-cyclical, expanding during economic downturns and shrinking during times of economic growth. SNAP and UI are two major components of the recessionary safety net. Each program improves the well-being of millions of Americans, and the dollar values of SNAP and UI benefits can be sizable components of a household’s resources. SNAP and UI function as macroeconomic stabilizers that help sustain aggregate household spending and national production in economic downturns, making the downturns less severe than they would be in the absence of the programs.
During the recession, the share of SNAP households that also received UI (the SNAP Joint Participation Rate) was about 14.4 percent in 2009—nearly double that of the full-employment year of 2005 (7.8 percent). During a recession, households with unemployed workers who had tight labor market connections (i.e., their work histories and earnings are sufficient to meet UI-eligibility requirements) and greater UI receipt become a larger share of the SNAP caseload (compared to households with limited labor market connections), increasing the overall share of SNAP households that receive UI. This changing mix of SNAP households is consistent with the estimated increase in the SNAP JPR in 2009 (compared with 2005). To help explain these 2005-09 changes, we examined the recessionary caseload for SNAP—the difference between the SNAP caseload for a recessionary year and the 2005 full-employment SNAP caseload. This difference in annual caseloads represents the number of “net additional” or “marginal” SNAP households that are added to the SNAP case-load during the recession. We estimated the 2009 share of the “marginal” SNAP households that received UI to be nearly 3 in 10 (29.6 percent), well exceeding the share of 7.8 percent receiving UI among “average” SNAP households in the 2005 full-employment caseload. This considerable differ-ence between marginal and average shares nearly doubled the share of SNAP households that also received UI from 2005 to 2009.
In 2009, the share of UI households that also received SNAP (the UI Joint Participation Rate) reached 13.4 percent, exceeding its 2005 estimate of 11.1 percent. Although the qualitative patterns are similar for UI and SNAP, the 2005-09 increase in the share of UI households receiving SNAP (2.3 percentage points) was less than the 2005-09 increase in the share of SNAP households receiving UI (6.6 percentage points). The share of the “marginal” UI recessionary caseload that received SNAP in 2009 was 15.4 percent, which was above the 11.1 percent share of “average” UI households receiving SNAP in 2005 by only 4.3 percentage points (resulting in an increase in the UI JPR that was small relative to the near doubling of the share of SNAP households receiving UI).
The study highlights a key point about SNAP: the least well-off, most vulnerable households—as measured either by education level of the householder or by the household’s annual income relative to poverty—are more likely to be SNAP-only households. For SNAP-only households, SNAP is potentially the largest source of government support—and perhaps the only source (depending on participation in programs besides UI, such as cash welfare, housing assistance, etc., which this report does not examine).
Future research could adopt a multivariate framework to examine how SNAP JPRs and UI JPRs are affected by household characteristics (such as those examined here or by other factors such as household composition—e.g., households with children). Another fruitful approach could be the use
39 Participation in SNAP and Unemployment Insurance: How Tight Are the Strands of the Recessionary Safety Net?, ERR-157
Economic Research Service/USDA
of monthly longitudinal data to examine intra-year participation dynamics to determine the extent to which households receive SNAP and UI benefits in the same month and the extent to which SNAP and UI benefits are received in the same year but in different months. Other research could estimate SNAP JPRs and UI JPRs at the level of individual States. The estimated JPRs could be dependent variables in econometric models that examine the effects of State-level economic conditions and of SNAP policies or UI policies that vary across States.
Because both SNAP and UI are “automatic” stabilizers, discretionary legislation is not required for the two programs to provide increased support for household spending during an economic down-turn. Even so, new legislation can, at times, affect SNAP or UI and provide support over and above what would otherwise be available. During the 2008-09 period, new legislation provided a temporary increase in SNAP benefits and expanded SNAP eligibility for jobless adults without children (through the American Recovery and Reinvestment Act (ARRA) of 2009) and extended UI benefits (through successive Acts beginning in 2008). The new legislation raises important policy and research ques-tions about the contribution of “policy” or “economic” factors on SNAP- or UI-participation levels (or program expenditures). For example, how much of the 2005-09 increase in SNAP participation was due to new legislation and how much of it was due to the economic downturn? While both policy-makers and researchers would be interested in this issue, and in findings that address it, no one study can accomplish all research objectives. Our study focused on estimating joint participation patterns across time and across subgroups, leaving other analyses for future research.
The “policy versus economy” distinction can miss a simple but important point: a recession may itself be the motivation for new legislation or for enhanced outreach.63 Therefore, while it can be useful to distinguish statistically the policy and economy components of the 2005-09 increase in the SNAP caseload, it can be valid conceptually to consider the caseload increase to be due entirely to the reces-sion (inclusive of the caseload’s “ARRA component”). If a recessionary economy prompts a policy or programmatic change, then the policy factor is not easily separated from the economic factor.
It is no contradiction to adopt a policy approach that eschews discretionary legislation during mild downturns but responds actively during a severe recession. In 2009, the full amount of support provided by SNAP and UI rose because the effects of the new legislation augmented the automatic stabilization already built into the programs.
63This point may be self-evident. After all, as identified in the Supplemental Nutrition Assistance Program (SNAP) American Recovery and Reinvestment Act (ARRA) Plan, two of the objectives of the ARRA SNAP provisions were specifically to “create and save jobs” and to “stimulate the economy” (Food and Nutrition Service, 2010). Further, it is difficult to imagine that Congress would have passed Emergency Unemployment Compensation in 2008 in the absence of an emergency. In this view, if the economy had not been in a recession in 2008 and 2009, then new legislation for Unem-ployment Insurance and SNAP would not have been adopted.
40 Participation in SNAP and Unemployment Insurance: How Tight Are the Strands of the Recessionary Safety Net?, ERR-157
Economic Research Service/USDA
References
Anderson, Patricia M. 1997. “Continuing Eligibility.” Unemployment Insurance in the United States: Analysis of Policy Issues. O’Leary, Christopher J. and Stephen A. Wandner, eds. Kalamazoo, MI: W.E. Upjohn Institute for Employment Research.
Anderson, Patricia M., and Bruce D. Meyer. August 1997. “Unemployment Insurance Takeup Rates and the After-Tax Value of Benefits.” Quarterly Journal of Economics 112(3): 913-937. http://www.jstor.org/stable/pdfplus/2951259.pdf
Bassi, Laurie J., and Daniel P. McMurrer. 1997. “Coverage and Recipiency.” Unemployment Insurance in the United States: Analysis of Policy Issues. O’Leary, Christopher J. and Stephen A. Wandner, eds. Kalamazoo, MI: W.E. Upjohn Institute for Employment Research.
Castner, Laura A., and Allen L. Schirm. 2005. State Food Stamp Participation Rates for the Working Poor in 2002, Final Report. U.S. Department of Agriculture, Food and Nutrition Service, Office of Research and Analysis. http://www.fns.usda.gov/ora/menu/Published/snap/FILES/Participation/WorkingPoor2002.pdf
Chimerine, Lawrence, Theodore S. Black, and Lester Coffey. 1999. Unemployment Insurance as an Economic Stabilizer: Evidence of Effectiveness Over Three Decades. Unemployment Insurance Occasional Paper 99-8. U.S. Department of Labor, Employment and Training Administration, Unemployment Insurance Service. http://wdr.doleta.gov/owsdrr/99-8
Cole, Nancy, and Ellie Lee. 2004. Feasibility and Accuracy of Record Linkage to Estimate Multiple Program Participation: Volume III, Results of Record Linkage. E-FAN-03-008-03. U.S. Department of Agriculture, Economic Research Service. http://www.abtassociates.com/reports/DataLink-Vol3.pdf
Cunnyngham, K.E., L.A. Castner, and A.L. Schirm. 2011. Empirical Bayes Shrinkage Estimates of State Supplemental Nutrition Assistance Program Participation Rates in 2006-2008 for All Eligible People and the Working Poor. U.S. Department of Agriculture, Food and Nutrition Service.
Executive Office of the President, Council of Economic Advisors. February 2011. Economic Report of the President, 2011. U.S. Government Printing Office. http://www.whitehouse.gov/sites/default/files/microsites/2011_erp_appendixB.pdf
Farrell, Mary, Michael Fishman, Matthew Langley, and David C. Stapleton. 2003. The Relationship of Earnings and Income to Food Stamp Participation: A Longitudinal Analysis. E-FAN-03-011. U.S. Department of Agriculture, Economic Research Service. http://naldc.nal.usda.gov/download/45667/PDF
Hanson, Kenneth. October 2010. The Food Assistance National Input-Output Multiplier (FANIOM) Model and Stimulus Effects of SNAP. ERR-103. U.S. Department of Agriculture, Economic Research Service. http://www.ers.usda.gov/media/134117/err103_1_.pdf
Lee, Eun Sul, and Ronald N. Forthofer. 2006. Analyzing Complex Survey Data. Thousand Oaks, CA: Sage Publications, Second Edition.
Lohr, Sharon L. 1999. Sampling: Design and Analysis. Pacific Grove, CA: Duxbury Press.

41 Participation in SNAP and Unemployment Insurance: How Tight Are the Strands of the Recessionary Safety Net?, ERR-157
Economic Research Service/USDA
Loveless, Tracy A. 2010. Food Stamp/Supplemental Nutrition Assistance Program (SNAP) Receipt in the Past 12 Months for Households by State: 2008 and 2009. ACSBR/09-8. U.S. Census Bureau. http://www.census.gov/prod/2010pubs/acsbr09-8.pdf
Lynch, Victoria, Dean M. Resnick, Jane Staveley, and Cynthia M. Taeuber. January 2008. Differences in Estimates of Public Assistance Recipiency Between Surveys and Administrative Records. Jacob France Institute: University of Baltimore. http://www.ubalt.edu/jfi/jfi/reports/TANFJan2008.pdf
Mabli, James, Stephen Tordella, Laura Castner, Thomas Godfrey, and Priscilla Foran. September 2011. Dynamics of Supplemental Nutrition Assistance Program Participation in the Mid-2000s. U.S. Department of Agriculture, Food and Nutrition Service, Office of Research and Analysis. http://www.fns.usda.gov/ora/MENU/Published/SNAP/FILES/Participation/DynamicsMid2000.pdf
Meyer, Bruce D., Wallace K.C. Mok, and James X. Sullivan. 2009. The Under-Reporting of Transfers in Household Surveys: Its Nature and Consequences. Working Paper 15181. Cambridge, MA: National Bureau of Economic Research. http://www.nber.org/papers/w15181
Nicholson, Walter. 1997. “Initial Eligibility for Unemployment Compensation.” Unemployment Insurance in the United States: Analysis of Policy Issues. O’Leary, Christopher J. and Stephen A. Wandner, eds. Kalamazoo, MI: W.E. Upjohn Institute for Employment Research.
Nord, Mark, and Mark Prell. April 2011. Food Security Improved Following the 2009 ARRA Increase in SNAP Benefits. ERR-116. U.S. Department of Agriculture, Economic Research Service. http://www.ers.usda.gov/media/127913/err116.pdf
O’Leary, Christopher J., and Kenneth J. Kline. 2008. UI as a Safety Net for Former TANF Recipients: Final Report. U.S. Department of Health and Human Services. http://aspe.hhs.gov/hsp/08/ui-tanf/report.pdf
O’Leary, Christopher J., and Kenneth J. Kline. 2010. Use of Unemployment Insurance and Employment Services by Newly Unemployed Leavers from Temporary Assistance for Needy Families: Final Report. ETA Occasional Paper 2010-07. U.S. Department of Labor, Employment and Training Administration. http://research.upjohn.org/externalpapers/13
Remler, Dahlia K., Jason E. Rachlin, and Sherry A. Glied. 2001. What Can the Take-up of Other Programs Teach Us About How to Improve Take-up of Health Insurance Programs? Working Paper 8185. Cambridge, MA: National Bureau of Economic Research. http://papers.nber.org/papers/w8185
U.S. Census Bureau. 2010a. Estimating ASEC Variances with Replicate Weights (link is 2010 Replicate Weight Usage Instruction (MS Word). http://thedataweb.rm.census.gov/ftp/cps_ftp.html
U.S. Census Bureau. 2010b. Current Population Survey, 2010 Annual Social and Economic (ASEC) Supplement. http://www.census.gov/prod/techdoc/cps/cpsmar10.pdf
U.S. Census Bureau. 2009. Estimating ASEC Variances with Replicate Weights (link is 2005-2009 Replicate Weight Usage Instruction (MS Word). http://thedataweb.rm.census.gov/ftp/cps_ftp.html
42 Participation in SNAP and Unemployment Insurance: How Tight Are the Strands of the Recessionary Safety Net?, ERR-157
Economic Research Service/USDA
U.S. Congressional Budget Office. May 2010. The Effects of Automatic Stabilizers on the Federal Budget. http://www.cbo.gov/sites/default/files/cbofiles/ftpdocs/114xx/doc11471/05-27-automatic-stabilizers.pdf
U.S. Congressional Research Service. 2006. Cash and Noncash Benefits for Persons with Limited Income: Eligibility Rules, Recipient and Expenditure Data, FY2002-FY2004.
U.S. Department of Agriculture, Food and Nutrition Service. 2012a. Building a Healthy America: A Profile of the Supplemental Nutrition Assistance Program. http://www.fns.usda.gov/ora/MENU/Published/snap/FILES/Other/BuildingHealthyAmerica.pdf
U.S. Department of Agriculture, Food and Nutrition Service. 2012b. SNAP Community Characteristics. http://www.fns.usda.gov/ora/SNAPCharacteristics/default.htm
U.S. Department of Agriculture, Food and Nutrition Service. 2010. USDA Food and Nutrition Service Supplemental Nutrition Assistance Program (SNAP) American Recovery and Reinvestment Act Plan Update 6/18/2010. http://www.fns.usda.gov/fns/recovery/memos/SNAP_ARRA-Plan.pdf
U.S. Department of Agriculture, Food and Nutrition Service, Office of Research and Analysis. 2008. Food and Nutrition Service Research and Evaluation Plan—Fiscal Year 2009. Alexandria, VA. http://www.fns.usda.gov/ora/MENU/Published/Research/2009RandE.pdf
U.S. Department of Labor, Bureau of Labor Statistics. December 2010. Sizing Up the 2007-09 Recession: Comparing Two Key Labor Market Indicators With Earlier Downturns. Issues in Labor Statistics, Summary 10-11. http://www.bls.gov/opub/ils/pdf/opbils88.pdf
U.S. Department of Labor, Employment and Training Administration. February 2012. Emergency Unemployment Compensation 2008 (EUC) Program. http://workforcesecurity.doleta.gov/unemploy/pdf/euc08.pdf
U.S. Department of Labor, Employment and Training Administration. March 2009. Training and Employment Notice No. 35-09. http://wdr.doleta.gov/directives/attach/TEN/ten2009/ten35-09acc.pdf
Social Security Administration. 1997. “Historical Development.” http://www.ssa.gov/history/pdf/histdev.pdf
Vroman, Wayne. 2010. The Role of Unemployment Insurance As an Automatic Stabilizer During a Recession. IMPAQ International. Prepared for U.S. Department of Labor, Employment and Training Administration, Unemployment Insurance Service. http://wdr.doleta.gov/research/FullText_Documents/ETAOP2010-10.pdf
Wandner, Stephen A., and Thomas Stengle. July 1997. “Unemployment insurance: Measuring Who Receives It.” Monthly Labor Review.
Wheaton, Laura. 2007. Underreporting of Means-Tested Transfer Programs in the CPS and SIPP. 2007. Proceedings of the American Statistical Association, Social Statistics Section. Alexandria, VA. Also available from Washington, DC: The Urban Institute. http://www.urban.org/UploadedPDF/411613_transfer_programs.pdf
43 Participation in SNAP and Unemployment Insurance: How Tight Are the Strands of the Recessionary Safety Net?, ERR-157
Economic Research Service/USDA
Witte, Ann D., and Magaly Queralt. 2002. Take-Up Rates and Trade Offs After the Age of Entitlement: Some Thoughts and Empirical Evidence for Child Care Subsidies. Working Paper 8886. Cambridge, MA: National Bureau of Economic Research. http://www.nber.org/papers/w8886
Zedlewski, Sheila R. 2002. Left Behind or Staying Away? Eligible Parents Who Remain Off TANF. Series B, No. B-51. Urban Institute. http://www.urban.org/UploadedPDF/310571_B51.pdf
44 Participation in SNAP and Unemployment Insurance: How Tight Are the Strands of the Recessionary Safety Net?, ERR-157
Economic Research Service/USDA
Appendix 1
This appendix provides additional detail on the relationships between the JPRs for the recessionary and full-employment caseloads for a program and a table with estimates of recessionary caseloads and their associated JPRs for every year in the study period.
We will focus on examining how the SNAP JPR relates to the SNAP JPR for the full-employment caseload and the JPR of the recessionary caseload; the relationships for the UI caseloads and JPRs are fully analogous. Let the SNAP JPR in any particular year t be designated by πt. Then, using equation (1) or (2) from Chapter 5, the SNAP JPR can be expressed as a weighted average given by:
( )1 +
= = = + = + −
* * **t t t t t
t t t*t t t t t t
J J ΔJ ΔS ΔJ ΔJ S Jπ θ π θS S S S S ΔS ΔS
( )1A ,
where (a) π* is the SNAP JPR at full employment (i.e., the JPR for the full-employment caseload) and J* and S* are the full-employment numbers of SNAP and joint households, respectively, and (b) the ratio of the joint recessionary caseload ΔJt and the SNAP recessionary caseload ΔSt is the share of net additional SNAP households that also receive UI, i.e., the JPR of the recessionary caseload. The two weights θt and (1 – θt) that combine these two JPRs reflect the sizes of the full-employment SNAP caseload S* and the SNAP caseload in the given year St—their ratio equals θt.
The relationship expressed by equation (A1) embodies the factors that drive changes in the SNAP JPR over time. The SNAP JPR πt —the JPR that pertains to the “average” SNAP household in SNAP’s overall caseload—increases when the JPR for the “marginal” net additional SNAP house-holds in the SNAP recessionary caseload, given by (ΔJt /ΔSt), exceeds π* (the “previous average” SNAP JPR at full employment). For example, the SNAP JPR for 2005 is about 7.8 percent and the JPR for the SNAP recessionary caseload in 2009 is about 29.6 percent (fig. 4). The weight θt for 2009 is about 0.70 (the ratio of the SNAP caseloads for 2005 and 2009 of about 7.69 million and 11.0 million, from table 1). Based on (A1), the SNAP JPR for 2009 of 14.3 percent follows from (0.70)(7.8 percent) + (1-0.70)(29.6 percent). Based on analogous estimates from figure 4 and table 1, the UI JPR for 2009 of 13.4 percent follows from (0.46)(11.1 percent) + (1-0.46)(15.4 percent). Given that the JPR for the recessionary caseload exceeded the JPR for the full-employment caseload for both SNAP and UI, the SNAP JPR and the UI JPR each rose from 2005 to 2009.
From 2005 to 2009, the SNAP JPR rose 6.6 percentage points, which was relatively more than the UI JPR increase of 2.3 percentage points (fig. 4). This result is easily explained by adapting the weighted average formula. Using (A1), the difference between the SNAP JPR for a given year and the JPR of the full-employment caseload can be expressed as:
( ) ( )2 1
− = − − * *t
t tt
ΔJ A π π θ π
ΔS.
That is, the increase in the SNAP JPR from 2005 to another year, such as 2009, is larger when the JPR for the marginal, net additional SNAP households exceeds the average SNAP JPR at full employ-ment by a larger amount. It is a well-known economic principle that when a marginal value exceeds an average value, the average increases. The fully intuitive result in (A2) says something more: when a marginal value exceeds an average value by a large amount, then the average will rise by a large amount. For SNAP, the difference in the two JPRs was 21.8 percentage points (29.6 percent minus
45 Participation in SNAP and Unemployment Insurance: How Tight Are the Strands of the Recessionary Safety Net?, ERR-157
Economic Research Service/USDA
7.8 percent) while the differences for UI is a smaller 4.3 percentage points (15.4 percent minus 11.1 percent). It is little wonder, then, that the SNAP JPR rose by more than the UI JPR.
Strictly speaking, (A2) also contains the term (1 – θt) which potentially means an additional factor could help explain why the SNAP JPR rose by more than the UI JPR. The larger (1 – θt), the greater the increase in the SNAP JPR or the UI JPR (for any given difference in the JPRs of the reces-sionary and full-employment caseloads). However, in our results, this term does not happen to contribute to the relatively greater recessionary response of the SNAP JPR. The term (1 – θt) equals about 0.30 for SNAP, which is less than the corresponding value of about 0.54 for UI. If anything, the value of (1 – θt) for SNAP makes the increase in the SNAP JPR smaller than it would have been if the SNAP value had equaled the 0.54 value for UI.
While the definitions, structure, and lessons of (1) and (A1) make sense, the two equations do create the possibility of results that are not intuitive. It is possible to have negative values for a year’s reces-sionary caseload, a JPR of a recessionary caseload, or one of the weights in (A1).
The definition in (1) of recessionary caseloads and its related discussion might seem to imply that a recessionary caseload is always a positive number. However, (1) does allow for a “negative” reces-sionary caseload if and when, for example, the SNAP caseload for a year is below the full-employ-ment caseload (2005). This possibility mirrors other examples in economics. For example, it is possible for a year’s unemployment rate to be below its full-employment rate, resulting in a negative unemployment gap. The years 2006 and 2007 had negative unemployment gaps in which the actual unemployment rate was 0.3 or 0.5 percent, respectively, below its estimated full-employment level according to the Congressional Budget Office. For temporary periods, the economy can have very vigorous employment and higher than normal rates of output and income. Table 1 also shows that the GDP gap for 2006 was positive, indicating that the economy was producing slightly above its full-employment capacity (a condition that starts to exert upward pressure on wages and prices). When the economy is operating “above” full employment, with unusually high income and unusually low unemployment, SNAP and UI participation can be below what they would be at full employment, making St < S* and Ut < U* in (1). Thus, the recessionary caseloads can be positive, as we found for the recessionary years 2008 and 2009, or negative in temporary periods of over-full employment.
Appendix table A-2 shows annual values for the SNAP, UI, and joint recessionary caseloads that are derived from table 1 as well as the JPRs for the recessionary caseloads. The table exhibits the phenomena of negative recessionary caseloads in some years.
Two counter-intuitive possibilities emerge because the share of net additional SNAP households that also receive UI is measured as the ratio of the joint recessionary caseload ΔJt and the SNAP recessionary caseload ΔSt. First, there is no mathematical or statistical law that forces the joint and recessionary caseloads to have the same signs in a given year. Under the recessionary conditions of 2008 and 2009, it can be expected that both St > S* and Jt > J*, in which case the joint recessionary caseload ΔJt and the SNAP recessionary caseload ΔSt are each positive, making their ratio positive in turn. However, for economic conditions in years close to 2005, the SNAP and joint caseloads are much closer to their full-employment values (as table A-1 shows) and can differ from S* and J* in opposite directions. The JPR for the SNAP recessionary caseload happens to have a negative sign in 2004, when the joint caseload was slightly above its full-employment level and SNAP was below; with only about 6,000 more joint households than in 2005, it would not have taken a large swing in joint participation to change the SNAP JPR from a negative value (close to zero at -1.3 percent) to a positive value. Second, if the joint and SNAP recessionary caseloads have the same sign (both
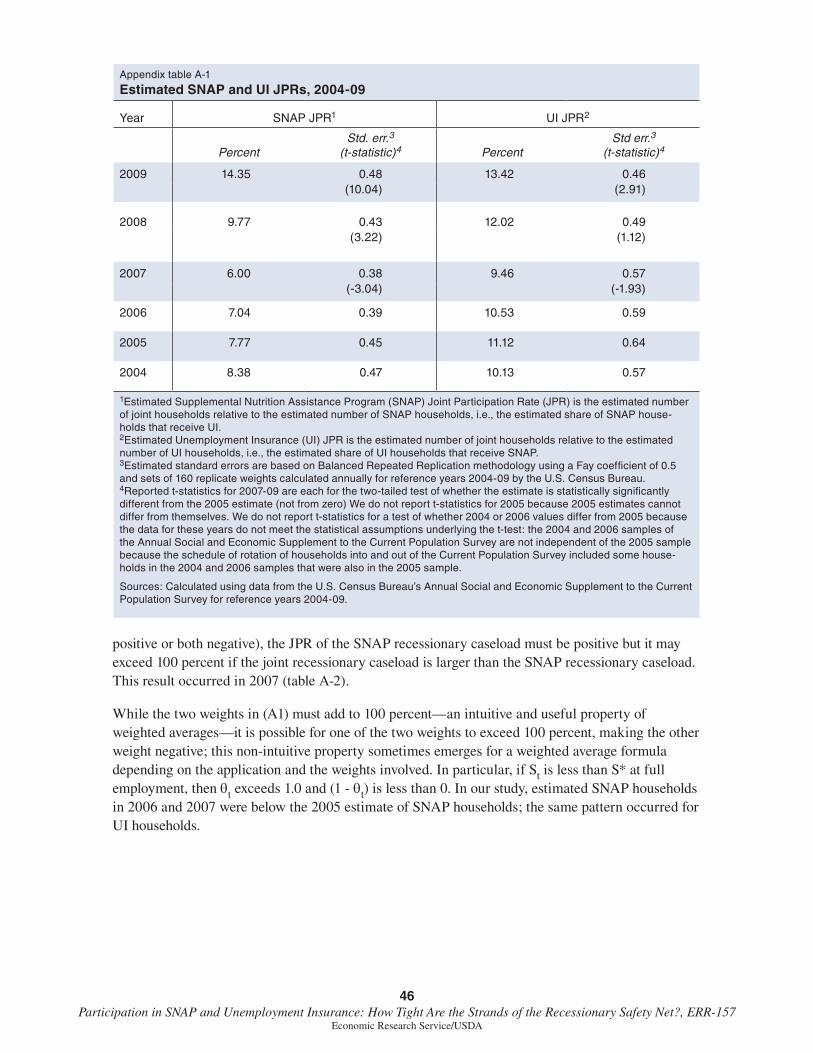
46 Participation in SNAP and Unemployment Insurance: How Tight Are the Strands of the Recessionary Safety Net?, ERR-157
Economic Research Service/USDA
positive or both negative), the JPR of the SNAP recessionary caseload must be positive but it may exceed 100 percent if the joint recessionary caseload is larger than the SNAP recessionary caseload. This result occurred in 2007 (table A-2).
While the two weights in (A1) must add to 100 percent—an intuitive and useful property of weighted averages—it is possible for one of the two weights to exceed 100 percent, making the other weight negative; this non-intuitive property sometimes emerges for a weighted average formula depending on the application and the weights involved. In particular, if St is less than S* at full employment, then θt exceeds 1.0 and (1 - θt) is less than 0. In our study, estimated SNAP households in 2006 and 2007 were below the 2005 estimate of SNAP households; the same pattern occurred for UI households.
Appendix table A-1
Estimated SNAP and UI JPRs, 2004-09
Year SNAP JPR1 UI JPR2
PercentStd. err.3
(t-statistic)4 PercentStd err.3
(t-statistic)4
2009 14.35 0.48 13.42 0.46 (10.04) (2.91)
2008 9.77 0.43 12.02 0.49 (3.22) (1.12)
2007 6.00 0.38 9.46 0.57 (-3.04) (-1.93)
2006 7.04 0.39 10.53 0.59
2005 7.77 0.45 11.12 0.64
2004 8.38 0.47 10.13 0.57
1Estimated Supplemental Nutrition Assistance Program (SNAP) Joint Participation Rate (JPR) is the estimated number of joint households relative to the estimated number of SNAP households, i.e., the estimated share of SNAP house-holds that receive UI. 2Estimated Unemployment Insurance (UI) JPR is the estimated number of joint households relative to the estimated number of UI households, i.e., the estimated share of UI households that receive SNAP. 3Estimated standard errors are based on Balanced Repeated Replication methodology using a Fay coefficient of 0.5 and sets of 160 replicate weights calculated annually for reference years 2004-09 by the U.S. Census Bureau.4Reported t-statistics for 2007-09 are each for the two-tailed test of whether the estimate is statistically significantly different from the 2005 estimate (not from zero) We do not report t-statistics for 2005 because 2005 estimates cannot differ from themselves. We do not report t-statistics for a test of whether 2004 or 2006 values differ from 2005 because the data for these years do not meet the statistical assumptions underlying the t-test: the 2004 and 2006 samples of the Annual Social and Economic Supplement to the Current Population Survey are not independent of the 2005 sample because the schedule of rotation of households into and out of the Current Population Survey included some house-holds in the 2004 and 2006 samples that were also in the 2005 sample.
Sources: Calculated using data from the U.S. Census Bureau’s Annual Social and Economic Supplement to the Current Population Survey for reference years 2004-09.

47 Participation in SNAP and Unemployment Insurance: How Tight Are the Strands of the Recessionary Safety Net?, ERR-157
Economic Research Service/USDA
Appendix table A-2
Recessionary caseloads for SNAP, UI, and joint households and JPRs for SNAP and UI recessionary caseloads, 2004-09
Year Recessionary caseloads JPRs
SNAP (thousands of households)
UI (thousands of households)
Joint (thousands of households)
For SNAP recessionary
caseload (percent)
For UI recessionary
caseload (percent)
2009 3,330 6,411 984 29.6 15.4
2008 1,373 1,993 288 21.0 14.5
2007 -62 -536 -140 224.5 26.1
2006 -408 -504 -85 20.7 16.8
2005 0 0 0 n/a n/a
2004 -488 578 6 -1.3 1.1
Note: A recessionary caseload is defined as the difference between the measured caseload for a given year and the caseload at full employment (2005 in this report). The definition for a recessionary caseload is applicable for Supplemental Nutrition Assistance Program (SNAP), for Unemployment Insurance (UI), and for the joint caseload. At full employment, the recessionary caseload is zero. The Joint Participation Rate (JPR) for SNAP recessionary caseload is the ratio of the joint recessionary caseload to the SNAP recessionary caseload. The JPR for UI recessionary caseload is the ratio of the joint recessionary caseload to the UI recessionary caseload.
Sources: Calculated from estimated SNAP, UI, and joint households in table 1 using the methodology of table 3. Derived figures in Appendix table A-2 may not match differences based on figures in table 1 due to rounding error.