participation in transition planning among high … · introduction reflecting an emphasis on...
TRANSCRIPT
PARTICIPATION IN TRANSITION PLANNING AMONG HIGH SCHOOL
STUDENTS WITH AUTISM SPECTRUM DISORDERS
By
Megan Marie Griffin
Dissertation
Submitted to the Faculty of the
Graduate School of Vanderbilt University
in partial fulfillment of the requirements
for the degree of
DOCTOR OF PHILOSOPHY
in
Special Education
August, 2012
Nashville, TN
Approved:
Professor Robert M. Hodapp
Professor Erik W. Carter
Professor Deborah D. Hatton
Professor Julie L. Taylor
Professor Carolyn Hughes
ii
ACKNOWLEDGEMENTS
This work would not have been possible without the financial support of both the
Leadership Training Program in Severe Disabilities/Autism (Department of Education),
and the Melvyn I. Semmel Dissertation Research Award.
Over the past five years, I have had the pleasure of working with members of the
Vanderbilt Kennedy Center and the Department of Special Education. I have been
inspired by the kindness and commitment of the faculty, staff, and my fellow students. I
have been fortunate to learn from the examples of my friends, Dr. Marisa Fisher and Dr.
Meghan Burke. I am also thankful to have worked with and learned from those involved
in the Next Steps program, as well as the Disability, Religion, and Spirituality Program.
Particularly, I want to thank those who have supported my work on this project. I
benefited greatly from the technological expertise and patience of Dr. Richard Urbano. I
am also indebted to Dr. Julie Lounds Taylor and Dr. Jennifer Gilbert who helped guide
my analyses and interpretation. Likewise, I am grateful to members of my Dissertation
Committee for their support and thoughtful feedback. I especially would like to thank my
faculty advisor, Dr. Robert Hodapp. In this and my other work at Vanderbilt, he has acted
as a sounding board, provided guidance, and encouraged my professional growth.
Additionally, I want to acknowledge the importance of my faith, family, and
friends. I am blessed to have a loving family that has supported and believed in me
throughout my life. I am also very thankful that I have found great friends in Nashville
and elsewhere. Finally, I am so fortunate to have Terry Holbrook in my life—his
patience, thoughtfulness, and humor have been a great support throughout this process.

iii
TABLE OF CONTENTS
ACKNOWLEDGEMENTS ................................................................................................ ii LIST OF TABLES .............................................................................................................. v LIST OF FIGURES ............................................................................................................ vi Chapter I. INTRODUCTION ....................................................................................................... 1 Student participation in transition planning ............................................................ 2
Predictors of student attendance and participation ...................................... 4 Students with ASD in the transition to adulthood ................................................... 5 The current study ..................................................................................................... 7
Hypothesized predictors of participation in transition planning ................. 8 Nature of the outcome variable ................................................................. 15
II. METHOD ..................................................................................................................... 16 NLTS2 methods .................................................................................................... 16
Study design and sampling procedures ..................................................... 16 Measures.................................................................................................... 17
The current study: Participant selection and characteristics ................................. 20 Participants ................................................................................................ 22
Predictor and outcome variables ........................................................................... 24 Predictor variables ..................................................................................... 24 Outcome variable ...................................................................................... 32
Data analysis ......................................................................................................... 33 Preliminary analyses ................................................................................. 34 Relationships between variables ............................................................... 37 Regression analyses................................................................................... 38
III. RESULTS.................................................................................................................... 39 Preliminary results................................................................................................. 39 Relationships between variables ........................................................................... 44
Relationships between predictor and outcome variables .......................... 44 Relationships among predictor variables .................................................. 50
Regression analyses............................................................................................... 52 Post-hoc analyses .................................................................................................. 58 IV. DISCUSSION ............................................................................................................. 61

iv
Summary of findings ............................................................................................. 61
Nature of the outcome variable ................................................................. 61 Regression A: Predictors of attendance .................................................... 62 Regression B: Predictors of participation.................................................. 65 Recurrent themes and divergent findings .................................................. 17
Implications for research and practice .................................................................. 71 Limitations ............................................................................................................ 74 REFERENCES .................................................................................................................. 76
v
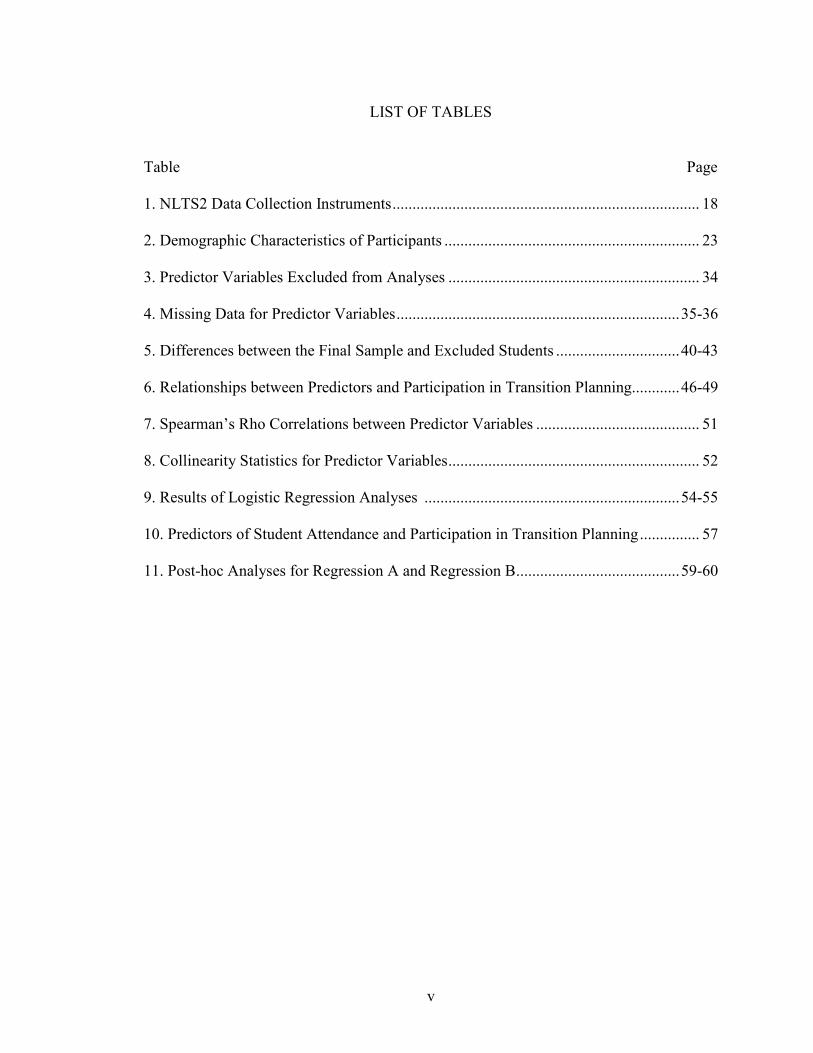
LIST OF TABLES
Table Page 1. NLTS2 Data Collection Instruments ............................................................................. 18 2. Demographic Characteristics of Participants ................................................................ 23 3. Predictor Variables Excluded from Analyses ............................................................... 34 4. Missing Data for Predictor Variables ....................................................................... 35-36 5. Differences between the Final Sample and Excluded Students ............................... 40-43 6. Relationships between Predictors and Participation in Transition Planning............ 46-49 7. Spearman’s Rho Correlations between Predictor Variables ......................................... 51 8. Collinearity Statistics for Predictor Variables ............................................................... 52 9. Results of Logistic Regression Analyses ................................................................ 54-55 10. Predictors of Student Attendance and Participation in Transition Planning ............... 57 11. Post-hoc Analyses for Regression A and Regression B ......................................... 59-60

vi
LIST OF FIGURES
Figure Page 1. Participant selection flow .............................................................................................. 22
1
CHAPTER I
INTRODUCTION
Reflecting an emphasis on post-school outcomes for students with disabilities,
policymakers amended the Individuals with Disabilities Education Act (IDEA) in 1990.
One significant change was to require that services be provided to facilitate the transition
from school to adult life. These transition services were defined as follows:
A coordinated set of activities for a student, designed within an outcome-oriented process, which promotes movement from school to postschool activities . . . [and] shall be based upon the individual student's needs, taking into account the
student's preferences and interests [emphasis added]. (IDEA, 1990)
Thus, the 1990 amendments set the initial expectation that students would provide their
perspectives, so that their preferences and interests would be taken into account during
the development of transition services (Wehmeyer & Sands, 1998).
Subsequent reauthorizations of IDEA have further emphasized the role of student
input in transition planning (Grigal, Test, Beattie, & Wood, 1997; Martin, Marshall, &
Sale, 2004). Thus, students must be invited to attend meetings in which postsecondary
transition goals are discussed. If students do not attend, the individualized education
program (IEP) team is still required to consider the student’s preferences and interests in
the development of transition services. Ultimately, the progressive emphasis on student
attendance reflects a desire to include the student voice in planning for life after high
school. Educators and researchers in the field of special education have also recognized
participation in transition planning as an authentic way for students to learn and practice
self-determination skills (e.g., self-advocacy, goal-setting; Test et al., 2004).
2
Student Participation in Transition Planning
In recent years, attendance at IEP and transition planning meetings has increased
among students with disabilities. For example, Trach and Shelden (2000) analyzed the
IEPs of two groups of students in their final years of high school: 531 students from
1991-93, and 253 from 1996-98. In the first group, 53% of students attended their IEP
meetings; in the second group, attendance rose to 64%. Documenting the continuation of
this positive trend, a study of 393 IEP meetings for students in middle and high school
reported a 70% attendance rate (Martin et al., 2004). Thus, research suggests an increase
in attendance at IEP and transition planning meetings among students with disabilities.
Though students may be attending these meetings more, they are not necessarily
active participants. Martin et al. (2006) observed 109 middle and high school IEP
meetings and surveyed IEP team members about this process. In rating how much they
thought the student participated in the meeting (not at all, a little, some, a lot), 40.6% of
special education teachers reported that students participated a lot. This finding, however,
contrasts sharply with the observational results of the same study: students spoke in their
IEP meetings only 3% of the time. Though no research has directly addressed this
discrepancy, the authors suggested that teachers may have equated student attendance
with student participation.
Other research also documents the frequent occurrence of students attending, but
not otherwise participating in IEP and transition planning meetings. In a national survey
of 523 educators involved in IEP meetings, 46% of respondents indicated that students
attended their IEP meeting, but otherwise did not participate (Mason, Field, &
Sawilowsky, 2004). Likewise, teacher reports from the National Longitudinal Transition

3
Study-2 (NLTS2) revealed that 24.6% of students were present at meetings, but
participated little (Cameto, Levine, & Wagner, 2004). Thus, both studies document a
substantial portion of students who attend meetings, but do not actively participate.
Thus, in the same way that placement in a general education classroom does not
ensure inclusion of students with disabilities, student attendance does not ensure
participation in IEP and transition planning meetings. And, though inviting students to
attend transition planning meetings complies with the IDEA transition mandates, the
spirit of these mandates was to encourage students to actively participate and have a
voice in planning for their lives after high school (deFur, 2003).
Unfortunately, students may not participate in IEP and transition planning
meetings for a variety of reasons. They may not participate because teachers and parents
do not communicate this expectation or provide the opportunities and supports needed
(deFur, 2003; Martin et al., 2006). Additionally, students may encounter barriers related
to access and logistics. Further, students may not be motivated to participate because of
prior negative experiences or because it is not meaningful to them (Morningstar,
Turnbull, & Turnbull, 1995). Interviews of 29 high school students with disabilities
revealed an array of negative attitudes toward the transition planning process: “confusion,
ambivalence, distaste, or a lack of interest” (Lovitt, Cushing, & Stump, 1994, p. 36).
Beyond opportunity and motivation, many students also need instruction in
certain skills to participate meaningfully in transition planning. They need to be taught
information specific to the process, such as unfamiliar terms and concepts. They also
need to learn effective communication skills to express their preferences and strengths
within the transition planning context. Just as many students with disabilities need
4
instruction and practice in new skills, they may also need instruction and practice in these
self-determination skills (Martin et al., 2006; Test, Fowler, Brewer, & Wood, 2005).
Various interventions have been developed to promote student participation in
transition planning. A recent review identified 17 intervention studies, several of which
reported medium and large effect sizes (Griffin, 2011). This literature has shown that
interventions can successfully teach students with disabilities the needed skills to
participate actively in their own transition planning process. Thus, we know that students
with disabilities are capable of participating in the IEP and transition planning process;
however, we also know that not all students do so.
Predictors of Student Attendance and Participation
Using two national datasets, Wagner, Newman, Cameto, Javitz, and Valdes
(2012) conducted regressions to investigate differences in student participation in IEP
and transition planning meetings. Compared to students with learning disabilities (LD),
students with autism spectrum disorders (ASD) were less likely to attend meetings. Also,
both students with ASD and students with speech/language impairments were less likely
to actively participate. Beyond disability type, higher functional cognitive skills and
social skills were positively related to greater participation.
Wagner et al. (2012) also identified various other characteristics related to
participation in transition planning. With regard to demographics, Caucasian students
were more likely to take an active role in transition planning, compared to African
American and Hispanic students. Additionally, older students were more likely to attend
transition planning meetings and participate actively. Finally, students from families with
5
a higher annual income (> $50,000) were less likely to actively participate in transition
planning, compared to students from families with a lower annual income (< $25,000).
Various aspects of parent involvement and expectations were also related to
student participation in transition planning (Wagner et al., 2012). Students whose parents
were actively involved with their education at home were more likely to attend their
transition planning meetings and to take an active role in transition planning. Similarly,
students whose parents were actively involved at their school were also more likely to
take an active role in transition planning. Students whose parents attended their transition
planning meetings were also more likely to attend these meetings themselves. Finally,
students whose parents had high expectations for them to pursue postsecondary education
were more likely to attend and participate in transition planning meetings.
Finally, two school-related characteristics were associated with differential
participation in transition planning (Wagner et al., 2012). First, students who spent more
time in general education settings were more likely to attend transition planning meetings
and to participate actively. Second, students who received instruction specifically focused
on transition planning were also more likely to attend and participate actively. Thus,
Wagner and colleagues have provided a global overview of the characteristics that relate
to greater involvement in transition planning among students with disabilities overall.
Students with ASD in the Transition to Adulthood
As noted previously, students with ASD are among the least likely to attend and
participate in transition planning meetings. Shogren and Plotner (2012) have also drawn
attention to the unique challenges faced by students with ASD and their families in the
6
transition planning process. Beyond school-based transition planning, the experiences of
young adults with ASD and their families have been the focus of recent research and
attention. This is due in part to a rapid increase in the number of children diagnosed with
ASD in the early 1990s; two decades later, this generation of individuals with ASD is
transitioning out of high school and into adulthood (Taylor, 2009).
Various studies have documented dismal employment outcomes among adults
with ASD (Eaves & Ho, 2008; Howlin, Goode, Hutton, & Rutter, 2004). Recent findings
from a nationally representative sample revealed that students with ASD in the United
States are in fact faring worse than youth with other disabilities. Compared to youth with
speech/language impairments, intellectual disability, or LD, youth with ASD are
employed at the lowest rates and are the most likely to have no engagement in education
or employment activities (Shattuck et al., 2012). This study found that over half of youth
with ASD are not engaged in employment or pursuing education after high school.
Unfortunately, many young adults with ASD spend their days after high school in
segregated settings, such as sheltered workshops or day centers.
Alongside these low rates of engagement in inclusive employment and
educational settings, youth with ASD also experience high rates of service disengagement
after high school (Shattuck, Wagner, Narendorf, Sterzing, & Hensley, 2011). Thus, after
leaving the supports and services provided in high school, youth with ASD and their
families are left to fend for themselves. This transition—from the services provided under
IDEA to receiving little in the adult service system—has far-reaching consequences.
Taylor and Seltzer (2011a) found that, whereas youth with ASD experienced
improvements in autism symptoms and maladaptive behaviors during high school, this

7
improvement slowed after exit. Mirroring this trajectory, improvements in the mother-
child relationship during high school were found to slow or stop after students with ASD
exited high school (Taylor & Seltzer, 2011b). This decline in the improvement of
behavior among youth with ASD and concurrent decline in the mother-child relationship
might be attributed in part to the unmet service needs of these youth and their families.
Taken together, these findings reveal that adolescents with ASD and their families
face unique challenges in the transition from high school to adult life in the community.
Though some of these challenges obviously relate to larger issues around the adult
service system, a closer examination of the transition planning process for youth with
ASD is also warranted (Shattuck et al., 2012). Shogren and Plotner (2012) have begun
this work by identifying areas in which the transition planning process for students with
ASD differs from that experienced by students with other disabilities.
The Current Study
Though many aspects of transition planning might be the focus of further
research, the current study focuses on the characteristics that related to participation in
transition planning among students with ASD. This investigation is needed because
students with ASD are the least likely to attend their transition planning meetings, and the
least likely to take an active role in the transition planning process (Wagner et al., 2012).
Yet, the current literature provides little evidence regarding the effectiveness of
interventions to promote participation in transition planning among students with ASD.
Currently, only 5 students with ASD have participated in intervention studies to promote
student participation in IEP or transition planning (Griffin, 2011).
8
Because of the need to improve participation in transition planning among
students with ASD, and because little evidence of the efficacy of current interventions is
available, the current study is needed to characterize the factors related to differing levels
of participation in transition planning among students with ASD. Specifically, the
principal research question of this study is: Which characteristics independently predict
greater participation in transition planning among students with ASD? To investigate this
question, I analyzed relevant questions included in the NLTS2 dataset.
Hypothesized Predictors of Participation in Transition Planning
Many variables potentially relate to level of student participation in transition
planning. These include demographics related to the students’ family and school;
characteristics specific to individual students; variables related to students’ school
experiences; and variables related to parental involvement.
Demographic characteristics. Various demographic characteristics are
hypothesized to relate to level of student participation in transition planning. These
include gender, age, ethnicity, and main language; household income; parent education
level; and the surrounding community and socioeconomic status (SES) of schools.
Gender. In a study of self-determination among youth with disabilities, female
participants were at risk for lower levels of self-determination, compared with male
participants (Wehmeyer & Lawrence, 1995). However, in the recent study of student
participation in transition planning, gender was not significantly related participation
(Wagner et al., 2012). Given these mixed findings, I hypothesize that female students will
participate at lower levels than male students, but that overall the difference will be small.

9
Age. As previously noted, Wagner et al. (2012) found that older students with
disabilities were more likely to attend and actively participate in transition planning. I
hypothesize that the same will hold true for students with ASD: compared with younger
students, older students will be more likely to attend and actively participate.
Ethnicity. Wagner et al. (2012) found that ethnicity was unrelated to student
attendance. However, compared to Caucasian students, African American and Hispanic
students were less likely to actively participate in transition planning. Thus, I hypothesize
that attendance will not relate to ethnicity among students with ASD, but that African
American and Hispanic students will participate at lower rates than Caucasian students.
Language at home. Students whose primary language is not English may struggle
with listening comprehension and verbal communication (Watts-Taffe & Truscott, 2000).
More formal, cognitively challenging settings may pose additional challenges to students
who speak English as a second language. Compared to informal conversations, these
settings are more likely to lack contextual cues that facilitate understanding (e.g.,
gestures). Therefore, I hypothesize that students who primarily speak English will attend
and participate in transition planning meetings at higher rates than students who do not.
Parent education and income. Prior research has found parent education to be an
influential variable related to student achievement (e.g., Davis-Kean, 2005). More
specifically, maternal education level has been found to correlate positively with child
educational attainment (Magnuson, 2007). Thus, I hypothesize that maternal education
level will positively relate to student attendance and participation in transition planning.
Conversely, prior research upholds a different hypothesis regarding household income,
though this variable is often considered to be related to level of parent education (e.g.,
10
Carlson, Uppal, & Prosser, 2000). Compared to students from families with a lower
annual income (< $25,000), students from families with a higher income (> $50,000)
participate less in transition planning (Wagner et al., 2012). Therefore, I hypothesize that
students with ASD from higher-income families will participate at lower rates. However,
because the hypotheses regarding parent education and income level seem to be at odds,
and because the strength of relationships between these variables and the outcome
variable is unclear, it is also unclear which hypothesis will be confirmed.
Surrounding community. Baer et al. (2003) found that students with disabilities
in rural areas were more likely to attain full-time employment after graduation, and that
students from suburban areas were more likely to pursue postsecondary education. Yet,
Rabren, Dunn, and Chambers (2002) found that students with disabilities from urban
areas were more likely to be employed a year after high school than students from other
areas. Because differences in student outcomes have been related to the surrounding
community, it is plausible that in-school differences might also differ; however, findings
have been mixed. Thus, I simply hypothesize that differences in students’ surrounding
community will relate to differences in transition planning.
School SES. As noted by Hughes and Avoke (2010), high-poverty schools are
typically found in areas with low property tax revenues, and often operate without
adequate funding and staffing. Thus, students from high-poverty schools generally fare
worse than students from schools that are better equipped. Therefore, I hypothesize that
students from high-poverty schools will be less likely to attend and participate actively in
their transition planning meetings, compared to students from higher-SES schools.

11
Student characteristics. Beyond demographics, various other student
characteristics may relate to a student’s level of participation in transition planning.
These individual student characteristics include severity of disability; communication
skills; social skills; and abilities related to classroom participation and self-advocacy.
Severity of disability. Several NLTS2 items might be considered a proxy for
severity of disability, including whether the student has ID, and a series of questions
regarding functional cognitive skills. Wagner et al. (2012) found that greater functional
cognitive skills positively related to both student attendance and greater student
participation in transition planning meetings. Similarly, I hypothesize that higher
functional cognitive skills will be positively associated with greater attendance and
participation in transition planning among students with ASD. Likewise, I hypothesize
that students with ASD who have ID will be less likely to attend and participate actively
in their transition planning meetings, compared with students who do not have ID.
Communication skills. Particularly when considering a student’s ability to
participate in transition planning, the importance of communication skills cannot be
overestimated (Wagner et al., 2003). The importance of a student’s communication skills
relate to his or her ability to understand what is being said during the meeting (receptive
communication), as well as his or her ability to describe personal strengths, needs, goals,
and preferences (expressive communication). Though the topic of communication skills
in individuals with ASD warrants extensive study and discussion, for the purposes of this
study, it is sufficient to note that deficits in communication are a hallmark of ASD
(Tager-Flusberg, Paul, & Lord, 2005). Therefore, I hypothesize that both receptive and
expressive communication will positively relate to student attendance and participation.
12
Social skills. Wagner et al. (2012) found that greater social skills among students
with disabilities positively related to greater student participation in transition planning.
This variable is particularly relevant among students with ASD, a diagnosis characterized
by social skills impairment (Volkmar & Klin, 2005). I hypothesize that student social
skills will relate positively to attendance and participation among students with ASD.
Classroom participation. A student’s engagement in classroom activities might
relate to level of participation in transition planning meetings. Classroom participation
encompasses a wide variety of behaviors, such as engaging in discussions; completing
homework; staying focused on coursework; and participating in class activities (Carter,
Austin, & Trainor, 2012; Wagner et al., 2003). Though these behaviors are not directly
related to participation in transition planning, similar skills are involved. For example,
participating in a class discussion is similar to participating in the discussion at a
transition planning meeting. Thus, I hypothesize that classroom engagement will
positively relate to participation in transition planning among students with ASD.
Self-advocacy skills. Initial analyses conducted by Cameto et al. (2004)
considered an item regarding students’ ability to ask for what they need in school to be a
proxy for self-advocacy skills. Findings revealed that students with disabilities who were
better able to ask for what they needed were more active in transition planning than their
peers who were less able to do so. This is not surprising, given that this item involves
both understanding personal limitations and communicating needs—two skills that would
help students participate effectively in transition planning meetings. Therefore, I
hypothesize that self-advocacy skills will strongly relate to attendance and participation
in transition planning among students with ASD.

13
Educational experiences. Various aspects of students’ educational experiences
hypothetically relate to level of student participation in transition planning: level of
inclusion in general education settings, history of suspension/expulsion, relationships
with teachers, and whether transition planning instruction was provided.
Percent instruction in general education setting. Wagner et al. (2012) found that
the percentage of time spent in general education settings positively related both to
attendance and participation in transition planning meetings among students with
disabilities overall. Since greater inclusion in general education settings likely relates
both to a students’ functional abilities and to the perceptions of that student held by
teachers and parents, this finding is not surprising. Therefore, I hypothesize that the
percentage of time students with ASD spend in general education settings will also
positively relate to their attendance and participation in transition planning meetings.
History of suspension or expulsion. Though a history of suspension or expulsion
has not been linked with level of student participation in transition planning, this variable
has been related to parent satisfaction with their involvement in IEP and transition
planning meetings (Wagner et al., 2012). This variable might be considered a proxy for
problem behaviors more severe than those identified by items in social skills ratings.
Therefore, I hypothesize that students who have ever been suspended or expelled (versus
those who have not) will attend and participate in transition planning at lower rates.
Relationship with teachers. Though no research documents the impact of the
student-teacher relationship on level of student participation in transition planning, this
variable is hypothetically important. The type of relationship a student has with teachers
at school would likely impact the student’s willingness to participate in an optional
14
meeting with teachers, such as a transition planning meeting. Therefore, I hypothesize
that students with more positive relationships with teachers will attend and participate in
transition planning at higher rates than students who have less positive relationships.
Instruction in transition planning. Wagner et al. (2012) found that students who
had received instruction in transition planning were more likely to attend and participate
in transition planning meetings. Likewise, I hypothesize that students with ASD who
received instruction in transition planning will also attend and participate at higher rates
than students who did not have the benefit of such instruction.
Parent expectations and involvement. Various aspects of parent involvement
are also hypothetically related to level of participation in transition planning among
students with ASD. These include parents’ expectations of their child’s participation in
postsecondary education; parent involvement at school; parent attendance at transition
planning meetings; and how frequently an adult in the household discussed post-school
plans with the student.
Expectations of postsecondary education. Wagner et al. (2012) found that higher
parent expectations for their children to participate in postsecondary education positively
related to student attendance and participation in transition planning. Therefore, I
hypothesize that higher expectations among parents of students with ASD will also
positively relate to student attendance and participation in transition planning meetings.
Parent involvement in school events and transition planning. Wagner et al.
(2012) found that parent involvement at school events was positively related to
participation in transition planning among students with disabilities. Likewise, parent
attendance at IEP or transition planning meetings was positively related to student
15
attendance (Wagner et al.). Based on these findings, I hypothesize that parent
involvement in school events and transition planning meetings will positively relate to
attendance and participation in transition planning meetings among students with ASD.
Discussion of transition at home. Similarly, Wagner et al. (2012) found that
greater parent involvement at home was positively related to student participation in
transition planning. One item in their home involvement scale specifically related to how
often an adult in the household discussed plans after high school with the student. Thus, I
hypothesize that greater frequency of such discussions with parents will positively relate
to attendance and participation in transition planning among students with ASD.
Nature of the Outcome Variable
In addition to the hypotheses stated for each predictor variable, an overarching
hypothesis guided my analyses. This hypothesis relates to the nature of the outcome
variable (a variable included in NLTS2 in which teachers rated student participation in
transition planning, thus: 1 = student did not attend, 2 = student attended but participated
little, 3 = student was a moderate participant, and 4 = student took a leadership role). In a
preliminary report on this topic, Cameto et al. (2004) considered these ratings to be a
single ordinal scale. More recently, Wagner et al. (2012) took a different approach,
considering the issue of student attendance (versus absence) to be separate from level of
student participation. That is, they conducted two separate regressions, one to identify
predictors of attendance among students with disabilities, and a second to identify
predictors of active participation. I hypothesize that the approach employed by Wagner et
al. better reflects the nature of the outcome variable.

16
CHAPTER II
METHOD
This chapter addresses four aspects of the current study. First, it provides an
overview of the NLTS2 study design, sampling procedures, and measures. Second, it
explains the method for selecting the sample for this study and describes the participant
characteristics. Third, it details the specific predictor and outcome variables. Finally, it
outlines the descriptive, comparative, and regression analyses performed.
NLTS2 Methods
Study Design and Sampling Procedures
NLTS2 is a nationally-representative, longitudinal study of the experiences of
over 11,000 youth receiving special education services as they transition from high
school to adulthood (Newman et al., 2009). Using multiple instruments, data were
collected from youth, parents, teachers, and school staff. Data collection occurred in five
waves over the course of 10 years (2000-2010).
To generate a nationally representative sample, participants were selected in two
stages (Newman et al., 2009). First, the sample of school districts was stratified based on
geographic region, district size, and community wealth (proportion of students living
below poverty level). From this set of approximately 12,000 school districts, a stratified
random sample was selected. In addition to these districts, 77 state-supported special

17
schools were invited to participate in the study. In all, 501 school districts and 38 special
schools were recruited. Second, these schools provided rosters of students receiving
special education services. This group was stratified by primary disability category, and a
random sample was selected from each of the federally designated disability categories.
Measures
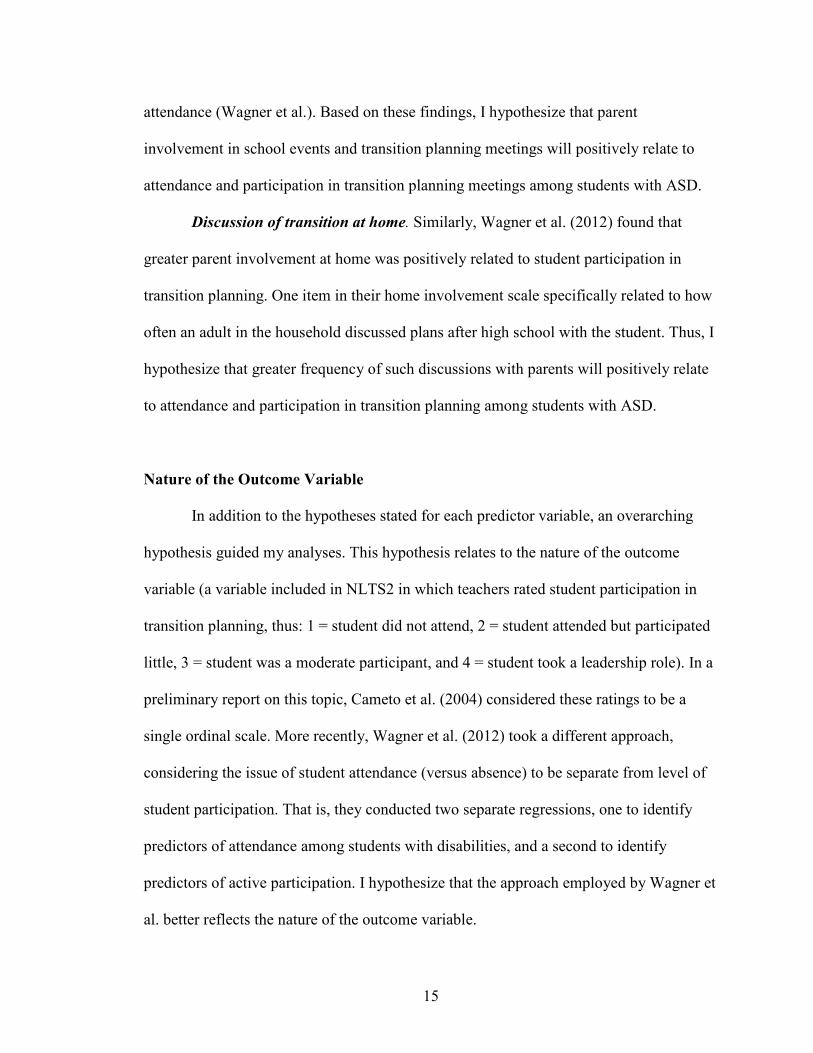
The current study linked data from five sources: Parent Interview, School
Characteristics Survey, School Program Survey, Teacher Survey, and Transcript Data
(see Table 1).
Parent Interview. The Parent Interview was conducted over telephone in one of
two ways. Either parents were contacted via their home telephone, or (if parents did not
have a reliable telephone number) a toll-free number was made available so that they
could call in for the interview. The interviews were conducted with computer-assisted
telephone interviewing technology. Parents who could not be reached by telephone were
mailed questionnaires (Cameto et al., 2004).
The Parent Interview includes items regarding demographic information about
both the student (e.g., gender, ethnicity, disability, age) and family (e.g., language spoken
at home, SES). The Parent Interview also asks about the student’s abilities (e.g., how
well the youth communicates), and school experiences (e.g., how well youth gets along
with teachers). Overall, the response rate for the Parent Interview was 61.1% (Javitz &
Wagner, 2005).
18
Table 1
NLTS2 Data Collection Instruments
Instrument Respondent Content of questions Response
rate
Parent
Interview
parent/guardian demographics; student’s
abilities; experiences at school
and home
61.1%
School
Characteristics
Survey
staff member able to
report on school
characteristics,
policies
demographics about the school
and its surrounding community
53.5%
School
Program
Survey
staff member most
knowledgeable about
the student
information about the student’s
school program (e.g., special and
vocational education classes;
transition planning)
48.1%
Teacher
Survey
teacher of the
student’s first general
education class of the
week (if applicable)
information about the student’s
experiences and participation in
general education classes
36.3%
Transcript
Data
staff member with
access to transcripts
student grade level; instructional
setting of courses; course content
84.3%
19
School Characteristics Survey. The School Characteristics Survey was mailed
in a packet to the school staff member who had agreed to distribute NLTS2 surveys.
These coordinators signed participation agreements, and received reimbursement for their
assistance, depending on the number of NLTS2 participants enrolled in their school.
The School Characteristics Survey was completed by a school staff member able
to report on school characteristics and policies. Often principals, these respondents were
surveyed to characterize the schools attended by students participating in the NLTS2. The
School Characteristics Survey included questions about the school’s surrounding
community (e.g., rural, suburban, urban), as well as the school’s demographics (e.g.,
percent of students receiving free or reduced-priced lunch). The response rate for the
School Characteristics Survey was 53.5% (Javitz & Wagner, 2005).
School Program Survey. One school staff member, identified as the person most
knowledgeable about a student participating in NLTS2, completed the School Program
Survey (Cameto et al., 2004). The respondents were often special education teachers.
Their answers provide information about the student’s school program, including
information about the student’s special education and vocational classes. The School
Program Survey also includes questions about whether transition planning occurred for
the student, whether the student received instruction related to transition planning, and
both students’ and parents’ participation in transition planning. Like the School
Characteristics Survey, the School Program Survey was mailed in a packet to the school
staff member who had agreed to distribute NLTS2 surveys. The response rate for the
School Program Survey was 48.1% (Javitz & Wagner, 2005).
20
Teacher Survey. Additional data were collected on the experiences of students
participating in NLTS2 who were enrolled in at least one general education academic
class. The teacher of the student’s first general education class of the week was selected
as the respondent to the Teacher Survey. This survey collected data on that class,
including instructional practices used, and the student’s experiences in that class. Several
of these items replicated questions in the School Program Survey about student
experiences in special education and vocational classes. Like the School Characteristics
Survey and School Program Survey, the Teacher Survey was mailed in a packet to the
school staff member who had agreed to distribute NLTS2 surveys. The response rate for
the Teacher Survey was 36.3% (Javitz & Wagner, 2005).
Transcript Data. Students’ most recent transcripts were requested of
participating schools from 2002-2009. In addition, a cover letter requested that the
registrar or other school staff member indicate the following, if not indicated on the
transcript: student’s enrollment or exit status, grade level, course content, instructional
setting of courses (e.g., special education), and absentee information. The response rate
for the Transcript Data was 84.3% (Wagner et al., 2012).
The Current Study: Participant Selection and Characteristics
Sample Selection
Sample selection focused on students with ASD for whom information on their
participation in transition planning was available. Data on student participation in
transition planning were collected in the School Program Survey, which was

21
administered at Waves 1 and 2. Wave 2 was selected for the focus of this study because
data on participation in transition planning were available for most youth with ASD.
Wave 2 of the School Program Survey includes data for 560 students with ASD. Of
these 560 potential participants, data on role in transition planning are available for 480
youth with ASD. The 80 individuals with ASD lacking data for this variable were
excluded in this first phase of sample selection.
The second and third phases of sample selection related to whether data were
available for two key predictors: (a) whether the student had received instruction related
to transition planning at school, and (b) how often the student talked with a parent about
their plans after high school. These items are theoretically important in that they relate to
experiences students might have at school or at home that prepare them to participate in
discussions about their transition out of high school.
In the second phase of sample selection, 30 individuals were excluded from
analyses because they were missing data for the variable on instruction in transition
planning. In the third phase of sample selection, 130 individuals were excluded from
analyses because they were missing data on how often the student talked with a parent
about their plans after high school. The final sample consisted of 320 students with ASD.
For each of these participants, data were available on (a) the student’s role in transition
planning; (b) whether students had received instruction in transition planning; and (c)
how often students and their parents discussed their plans for life after high school (see
Figure 1).

22
Figure 1. Participant Selection Flow
Participants
The final sample included 320 high school students with ASD. See Table 2 for
demographic characteristics of participants. Following instructions from Institute of
Education Sciences, these and all reported numbers have been rounded to the nearest 10.
Therefore, reported numbers in tables may not always sum to the sample size reported
here; likewise, reported numbers may not always correspond exactly with reported
percentages.
23
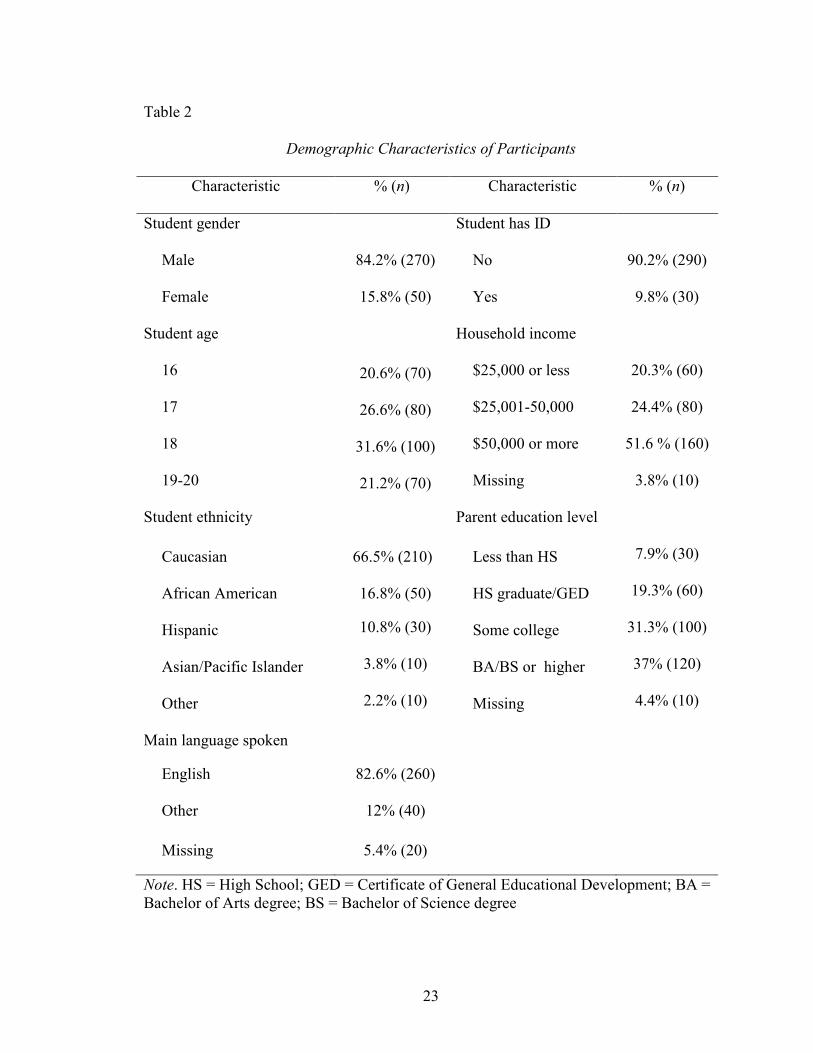
Table 2
Demographic Characteristics of Participants
Characteristic % (n) Characteristic % (n)
Student gender Student has ID
Male 84.2% (270) No 90.2% (290)
Female 15.8% (50) Yes 9.8% (30)
Student age Household income
16 20.6% (70) $25,000 or less 20.3% (60)
17 26.6% (80) $25,001-50,000 24.4% (80)
18 31.6% (100) $50,000 or more 51.6 % (160)
19-20 21.2% (70) Missing 3.8% (10)
Student ethnicity Parent education level
Caucasian 66.5% (210) Less than HS 7.9% (30)
African American 16.8% (50) HS graduate/GED 19.3% (60)
Hispanic 10.8% (30) Some college 31.3% (100)
Asian/Pacific Islander 3.8% (10) BA/BS or higher 37% (120)
Other 2.2% (10) Missing 4.4% (10)
Main language spoken
English 82.6% (260)
Other 12% (40)
Missing 5.4% (20)
Note. HS = High School; GED = Certificate of General Educational Development; BA = Bachelor of Arts degree; BS = Bachelor of Science degree
24
Predictor and Outcome Variables
Predictor Variables
The following section details the specific variables hypothesized to correlate with
student participation in transition planning. These include demographics related to the
students’ family and school, characteristics specific to the individual students, variables
related to the students’ school experiences, and variables related to parental involvement.
In some cases, responses were reverse-scored. Reverse-scoring was conducted for
two reasons. First, reverse-scoring was used if a question is negatively worded and all
other questions in a scale are positively worded; in this way, all the items in a scale will
be parallel. Second, reverse-scoring was used so that the scoring is consistent across the
different variables and scales. If necessary, reverse-scoring was used so that lower scores
indicate lower levels and higher scores indicate higher levels of a given variable (e.g.
social skills).
Demographic characteristics. Student, family, and school demographics were
analyzed in relation to student participation in transition planning. The following
demographic characteristics were included in analyses: student gender, age, and ethnicity;
the main language spoken at home; household income; parent education level; the
school’s surrounding community; and the SES of the student’s school.
Gender. Student gender was recorded (w2_Gend2) as (1) male or (2) female.
Age. The age of students during Wave 2 data collection was categorized
(w2_Age4) as follows: (1) 16 years, (2) 17 years, (3) 18 years, and (4) 19-20 years.
25
Ethnicity. The ethnicity of participating students was recorded (w2_Eth6) as
follows: (1) Caucasian, (2) African American, (3) Hispanic, (4) Asian/Pacific Islander,
(5) American Indian/Alaska Native, and (6) Other/multiple. Because the latter four
groups were small, they were combined for analysis. Therefore, ethnicity was grouped as
(1) Caucasian, (2) African American, and (3) Other.
Main language spoken at home. The main language spoken in a student’s home
was recorded (Parent Interview np1A4b); possible responses included English, as well as
38 other languages. This variable was recoded as (1) English, and (2) Other.
Household income. Household income was categorized into three groups
(w2_Incm3): (1) $25,000 and under; (2) $25,001 - $50,000; and (3) Over $50,000.
Parent education level. The education level of a student’s parents was recorded
(Parent Interview np1MotherEd, np1FatherEd). If education level was available for the
student’s mother, this value was used; if it was not available, the education level of the
student’s father was used. Possible responses included the following: (1) less than high
school, (2) graduated high school/earned Certificate of General Educational Development
(GED), (3) some college, and (4) Bachelor of Arts (B.A.) or Bachelor of Science (B.S.)
or higher degree. Because the first group was small, it was combined with the second
group for analyses: (1) less than high school, high school graduate, or GED; (2) some
college; and (3) B.A./B.S. or higher degree.
Surrounding community. The type of community surrounding the student’s
school was recorded (w2_Urb3) as (1) rural, (2) suburban, or (3) urban.
School SES. The percentage of students eligible for free or reduced-price lunch at
the participant’s school was considered a proxy for school SES (School Characteristics
26
Survey nsc1B5). Response choices were reverse-scored so that the higher score indicates
higher SES for the student body: (1) more than 75% eligible for free or reduced-price
lunch to (4) less than 25% of students eligible.
Student characteristics. Individual characteristics and abilities were considered
in relation to student participation in transition planning. The first of these student
characteristics was whether the student had been designated as having ID. Several other
variables also related to the students’ abilities in various areas: functional cognitive skills;
expressive and receptive communication skills; general social skills; classroom social
skills; classroom participation skills; and self-advocacy skills.
Intellectual disability. Participating students were categorized as having ID or not.
This variable was created by combining both district designations and parent report
(Parent Interview HasMR). The student was considered to have ID if either the district or
the student’s parent designated that the student was diagnosed with ID in either Wave 1
or Wave 2. Possible categories for this variable were (0) no, or (1) yes.
Functional cognitive skills. Parents were asked to rate students’ abilities on four
tasks (Parent Interview np2G3a_a-d): (a) telling time on an analog clock, (b)
understanding common signs, (c) counting change, and (d) looking up phone
numbers/using a phone. To rate how well students perform each of these skills, response
options ranged from (1) not at all well to (4) very well. Similar to prior studies (e.g.,
Wagner et al., 2012), items were summed to generate a Functional Cognitive Skills score.
Consistent with prior studies (e.g., Carter et al., 2012), if data for a single variable was
missing, mean imputation was used to generate this value. Possible scores range from 4
(“not at all well” on all items) to 16 (“very well” on all). Cronbach’s alpha for this scale
27
equaled .85. This variable was categorized into the following groups: low (4-8), medium
(9-14), and high functional cognitive skills (15-16; Wagner et al. 2003).
Expressive communication. Parents were asked to rate students’ ability to
communicate clearly (Parent Interview np2B5b). This item was reverse-scored so that the
higher score indicates greater skill: the student (1) does not communicate at all; (2) has a
lot of trouble communicating; (3) has a little trouble communicating; and (4) has no
trouble communicating. Because no participants were rated a (1) for this item, the
following three categories were used in analyses: (1) has a lot of trouble communicating;
(2) has a little trouble communicating; and (3) has no trouble communicating.
Receptive communication. Similarly, parents were asked to rate students’ ability
to understand others (Parent Interview np2B5e). This item was reverse-scored so that the
higher score indicates greater skill: the child (1) does not understand at all, (2) has a lot of
trouble understanding, (3) has a little trouble understanding, and (4) understands as well
as other children. Because few participants were rated a (1) for this item, the following
three categories were used in analyses: (1) does not understand or has a lot of trouble, (2)
has a little trouble, and (3) understands as well as other children.
General social skills. The Parent Interview included 11 questions regarding
social skills. Parents were asked how often their child engages in different behaviors
(Parent Interview np1G1a-np1G1k): (a) joins group activities without being told to, (b)
makes friends easily, (c) ends disagreements with parent calmly; (d) seems confident in
social situations; (e) gets into situations that are likely to result in trouble, (f) starts
conversations rather than waiting for others, (g) receives criticism well, (h) behaves at
home in a way that causes problems for the family, (i) controls temper when arguing with

28
peers other than siblings, (j) keeps working at something until he or she is finished, and
(k) speaks in an appropriate tone at home.
For each question, the response choices were (0) never, (1) sometimes, and (2)
very often. Scores were reversed for negatively worded items. These 11 items were
summed to determine a General Social Skills Scale. If data were missing on up to 3
questions, mean imputation was used to generate these values (Carter et al., 2012).
Possible scores range from 0 (never on all items) to 22 (very often on all items).
Cronbach’s alpha for this scale equaled .69. Scores of 0-10 were considered low, 11-16
were considered medium, and 17-22 were considered high.
Classroom social skills. Teachers were asked how well the student (a) gets along
with other students, (b) follows directions, and (c) controls behavior. Response options
ranged from (1) not at all well to (4) very well. If a data point for a single variable was
missing, mean imputation was used to generate this value (Carter et al., 2012). Then,
scores were summed to generate a Classroom Social Skills Scale score.
Teachers were asked to rate social skills in three settings, if applicable: special
education classes (School Program Survey npr1D18a-c), vocational education classes
(School Program Survey npr1C4a-c), and general education classes (Teacher Survey
nts1C1a-c). Cronbach’s alpha was .77 for the special education items; .78 for the
vocational education items; and .76 for the general education items. Cronbach’s alpha for
these nine items together was .87. If students had scores in more than one setting, these
were averaged together. Possible scores range from 3 (not at all well on all items) to 12
(very well on all). Scores 3-7 were considered low, >7-9 were medium, and >9-12 were
high (Carter et al., 2012).

29
Classroom participation. Teachers were asked to rate how often students (a)
engaged in group discussions, (b) completed homework on time, (c) stayed focused on
coursework, and (d) withdrew from activities. Response options ranged from (1) rarely to
(4) almost always; scores were reversed for the negatively worded question. If a data
point for a single variable was missing, mean imputation was used to generate this value
(Carter et al., 2012). Scores were summed to generate a Classroom Participation Scale.
Teachers were asked how well students participated across three settings, if
applicable: special education classes (School Program Survey npr1D19a-d), vocational
education classes (School Program Survey npr1C5a-d), and general education classes
(Teacher Survey nts1C6a-d). Cronbach’s alpha was .67 for the special education items,
.69 for the vocational education items, and .68 for the general education items.
Cronbach’s alpha for these 12 items together was .83. If students had scores in more than
one setting, these were averaged together. Possible scores range from 4 (lowest
engagement for each item) to 16 (highest engagement for each). Scores 4-9 were
considered low, >9-13 were medium, and >13-16 were high (Carter et al., 2012).
Self-advocacy. Teachers rated how well students ask for what they need; response
options ranged from (1) not at all well to (4) very well. Respondents were asked how well
students advocate for themselves in three settings, if applicable: special education classes
(School Program Survey npr1D18d), vocational education classes (School Program
Survey npr1C4d), and general education classes (Teacher Survey nts1C1d). If students
had scores in more than one setting, these were averaged together.
Educational experiences. Several aspects of students’ educational experiences
were considered in relation to level of student participation in transition planning:
30
percentage of time spent in a general education setting, history of suspension or
expulsion, relationships with teachers, and whether the student had received instruction
related to transition planning.
Percent instruction in general education setting. Participation in general
education was determined by calculating the percentage of credits students earned from
courses in a general education setting, as noted in the Transcript Data. If this information
was not available, data reported in the School Program Survey were used to calculate the
percentage (Wagner et al., 2012). To determine this percentage, I first calculated the total
number of courses the student took. This value was the sum of the 11 items related to
different content areas (School Program Survey npr2A3a -k). Next, I calculated the
number of courses taken in a general education setting. These items were each recoded
such that if the student did not receive instruction in a content area, the value for the
corresponding question about setting was (0) no, rather than missing. Finally, the number
of courses taken in general education was divided by the total number of courses taken by
the student. In categorizing these data, 0-33% was considered a low level of inclusion in
general education classes, 34-66% was medium, and 67-100% was high.
History of suspension or expulsion. A variable was created to indicate whether a
student’s parent reported that the student had ever been suspended or expelled. This item
(Parent Interview np2D5d_ever) was categorized into two categories: (0) no, or (1) yes.
Relationship with teachers. Parents were asked to rate their child’s ability to get
along with teachers on a 6-point scale (Parent Interview np2K2). This item was reverse-
scored so that the higher score indicates greater ability to get along with teachers: (1)
does not interact to (6) very well. Because few participants were rated on many of the

31
lower scores, these were combined for these analyses as follows: (1) does not interact to
gets along pretty well with teachers, and (2) gets along very well with teachers.
Instruction in transition planning. Data were collected regarding whether the
student received instruction that specifically focused on transition planning (School
Program Survey npr2E3); possible responses were (0) no, or (1) yes. For those missing
data for this variable, a second question was considered, regarding whether the school
offers instruction that specifically focuses on transition planning (School Characteristics
Survey nsc1D11). If the answer to this question was no (the school does not offer such
instruction), this value was used. This substitution was made for one participant.
Parent expectations and involvement. The current study also explored the
relationship between student participation in transition planning and various
characteristics related to parental expectations and involvement. These included parents’
expectations of their child’s participation in postsecondary education; parent involvement
at school; whether a parent attended the transition planning meeting; and how frequently
an adult in the household discussed post-school plans with the student.
Expectations of postsecondary education. Parents were asked to rate the
likelihood that their son or daughter would attend school after high school (Parent
Interview np2G6). This item was reverse-scored so that the higher score indicates greater
likelihood of attending postsecondary education: (1) definitely won’t to (4) definitely will.
Because the first group was small, it was combined with the second group for analyses:
(1) definitely won’t or probably won’t, (2) probably will, and (3) definitely will.
Involvement at school. Parents were asked to rate their own involvement at
school on a series of items (Parent Interview np2E1b_a-c). These addressed how often
32
parents (a) attended general school meetings, (b) attended school or class events, and (c)
volunteered at the school. Response options for these questions ranged from (0) never to
(4) more than 6 times. These items were summed to form a scale (Wagner et al., 2012); if
a data point for a single variable was missing, mean imputation was used to generate this
value. Cronbach’s alpha for these questions equaled .63. Possible scores range from 0 (no
involvement indicated for each) to 16 (highest involvement for each). To categorize these
data, 0-2 was considered low parent involvement, 3-5 was medium, and 6-12 was high.
Parent participation in transition planning. Teachers reported whether the
students’ parents were active participants in transition planning (School Program Survey
npr1E8_07); possible responses were (0) no, or (1) yes.
Discussion of transition at home. Parents were asked to estimate how often an
adult in the household had discussions with the student about their plans after high school
(Parent Interview np2E5b). Possible responses ranged from (1) never to (4) regularly.
Outcome Variable
Teachers were asked to rate level of student participation in transition planning,
thus: Which of the following best describes the student’s role in transition planning?
Response choices included the following: student has (1) not attended planning meetings
or participated in the transition planning process; (2) been present in discussions of
transition planning but participated very little or not at all; (3) provided some input as a
moderately active participant; and (4) taken a leadership role in the transition planning
process, helping set the direction of discussion, goals, and programs or service needs
identified. Teachers were only asked to rate students for whom transition planning had

33
begun. Because only 6.25% of participants (n = 20) were rated a 4 (took a leadership
role), the outcome variable was categorized as follows: (1) student has not attended
meetings or participated; (2) student has been present, but participated very little or not at
all; and (3) student has provided some input as a moderately active participant, or has
taken a leadership role. Of the 320 participants, 15.2% fell in the first category (did not
attend; n = 50); 47.5% were in the second category (present but participated little; n =
150); and 37.3% were in the third category (moderate-active participant; n =120).
As noted previously, it is unclear whether level of student participation in
transition planning is an ordinal variable. Therefore, it was considered categorical for
preliminary analyses. Subsequent regression analyses were designed to test the
hypothesis regarding the nature of the outcome variable--that is to determine whether it
constitutes a single ordinal scale.
Data Analysis
To conduct analyses for this study, a three-step process was followed. First,
preliminary analyses were conducted to determine the amount of missing data for each
variable and to determine the level of correlation between predictors. Decisions regarding
which variables to include were based on these analyses. Preliminary analyses were also
conducted to compare participants included in the final sample with those who were
excluded. Second, analyses were conducted to describe the relationships between
predictor variables and the outcome variable, as well as between the predictors. Finally,
logistic regression analyses were conducted to determine which characteristics
independently predicted student attendance and participation in transition planning.

34
Preliminary Analyses
Exclusion of predictor variables. Initial analyses revealed high amounts of
missing data for several variables. Three predictor variables were missing data for 20% or
more of the sample and were excluded. Additionally, initial analyses revealed a high
correlation between the Classroom Social Skills scale and the Classroom Participation
scale (r = .68). Rather than include both scales in the regression, only the Classroom
Social Skills scale was included in analyses (see Table 3).
Table 3
Predictor Variables Excluded from Analyses
Predictor Variable Missing Reason for exclusion
1. School SES School Characteristics
Survey nsc1B5
24% (80) > 20% missing
2. Relationship with
teachers
Parent Interview
np2K2
35% (110) > 20% missing
3. Expectations of post-
secondary education
Parent Interview
np2G6
61% (190) > 20% missing
4. Classroom participation
scale
School Program
Survey npr1C5a-d,
npr1D19a-d; Teacher
Survey nts2C6ar-d
7% (20) highly correlated
with Classroom
Social Skills scale
35
Missing data. Table 4 quantifies missing data for the predictor variables included
in analyses. For variables missing data, values were imputed based on the most frequent
category for categorical variables, and the median for continuous variables (Harrell,
2001). This method is recommended for variables missing less than 5% of the sample,
which describes all the predictor variables except one: the student’s main language
spoken at home. Because this variable was missing data for slightly above the guideline
set by Harrell (5.4% of the sample), the same method was used for imputation.
Table 4
Missing Data for Predictor Variables
Predictor Variable Missing
Demographics
Student gender w2_Gend2 0
Student age w2_Age4 0
Student ethnicity w2_Eth6 0
Main language Parent Interview np1A4b 5.4% (20)
Household income w2_Incm3 3.8% (10)
Parent education level Parent Interview np1MotherEd,
FatherEd
4.4% (10)
Surrounding community w2_Urb3 2.8% (10)
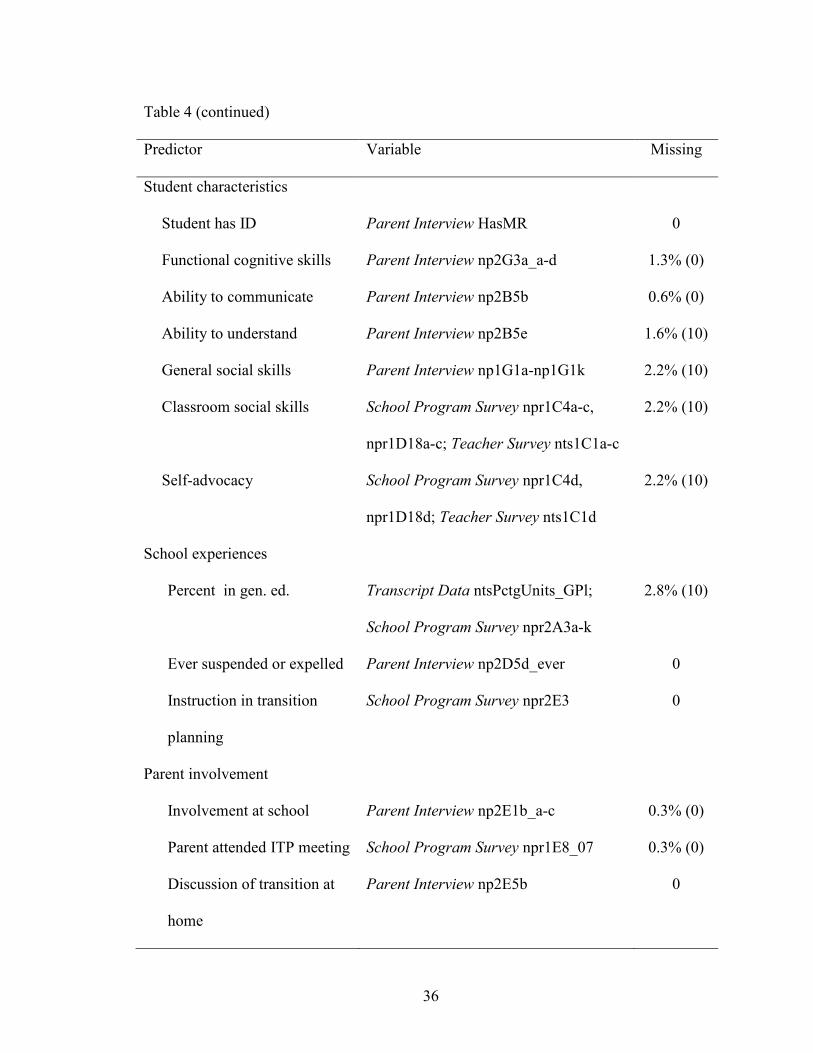
36
Table 4 (continued)
Predictor Variable Missing
Student characteristics
Student has ID Parent Interview HasMR 0
Functional cognitive skills Parent Interview np2G3a_a-d 1.3% (0)
Ability to communicate Parent Interview np2B5b 0.6% (0)
Ability to understand Parent Interview np2B5e 1.6% (10)
General social skills Parent Interview np1G1a-np1G1k 2.2% (10)
Classroom social skills School Program Survey npr1C4a-c,
npr1D18a-c; Teacher Survey nts1C1a-c
2.2% (10)
Self-advocacy School Program Survey npr1C4d,
npr1D18d; Teacher Survey nts1C1d
2.2% (10)
School experiences
Percent in gen. ed. Transcript Data ntsPctgUnits_GPl;
School Program Survey npr2A3a-k
2.8% (10)
Ever suspended or expelled Parent Interview np2D5d_ever 0
Instruction in transition
planning
School Program Survey npr2E3 0
Parent involvement
Involvement at school Parent Interview np2E1b_a-c 0.3% (0)
Parent attended ITP meeting School Program Survey npr1E8_07 0.3% (0)
Discussion of transition at
home
Parent Interview np2E5b 0
37
The last stage of preliminary analyses involved comparing the participants
included in the final sample with those excluded from analyses. Chi-square statistics were
calculated to determine whether the two groups differed significantly.
Similar to Carter et al. (2012), this study uses data from a small subset of the
larger sample upon which the NLTS2 sampling weights were based. Therefore, the
sampling weights developed for use with NLTS2 were not used. Because weights were
not used, these findings cannot be interpreted as representative of the national population
of students receiving special education services. Though not nationally representative,
these findings can still provide helpful information about the relationships between the
predictor and outcome variables. Because little is known about involvement in transition
planning among students with ASD, this information is particularly needed.
Relationships Between Variables
Non-parametric statistics were used to describe relationships between the
predictor variables and the outcome, as well as to describe interrelationships between the
predictors. Because the outcome variable is categorical, chi-square statistics were
calculated to describe the relationships between the predictor variables and the outcome
variable. To describe the relationships between the different predictor variables,
Spearman’s rho correlations were calculated. Spearman’s rho is appropriate in this case
because it does not make assumptions about the normal distribution of variables.
38
Regression Analyses
Prior to conducting regression analyses, collinearity statistics were examined to
determine whether predictors were highly correlated with other predictors. A tolerance
value of less than .20 and variance inflation factor (VIF) greater than 2.5 were used as
criteria to indicate collinearity (Cohen, Cohen, West, & Aiken, 2003; Menard, 2002).
To determine whether the outcome variable is an ordinal scale, two binary logistic
regressions were conducted. For the first (Regression A), the outcome variable was
grouped into students who were absent compared with students who attended but
participated little, participated moderately, or took a leadership role. For the second
(Regression B), the outcome variable was grouped as follows: students who were absent
or present but participated little compared with students who participated moderately or
who took a leadership role.
If similar predictor variables are identified by both sets of regression analyses,
this outcome would provide reason to consider the outcome variable an ordinal scale. To
follow up this outcome, an ordinal logistic regression would be conducted. In contrast, if
different predictor variables were identified by the two regressions, this outcome would
document the need to consider the outcome variable in two separate regressions. That is,
identifying unique predictor variables within each of the regressions would provide
evidence that attendance at transition planning meetings is predicted by different
variables than those that predict being an active participant in these meetings. To follow
up this outcome, additional univariate analyses would be conducted, categorizing the
outcome variable as it had been grouped in the two regressions.
39
CHAPTER III
RESULTS
This chapter first details the results of preliminary analyses comparing the final
sample with the group of excluded students. Next, it describes the relationships between
the individual predictor variables and the outcome variable, as well as the relationships
among predictor variables. Finally, it presents the findings of the regression analyses.
Preliminary Results
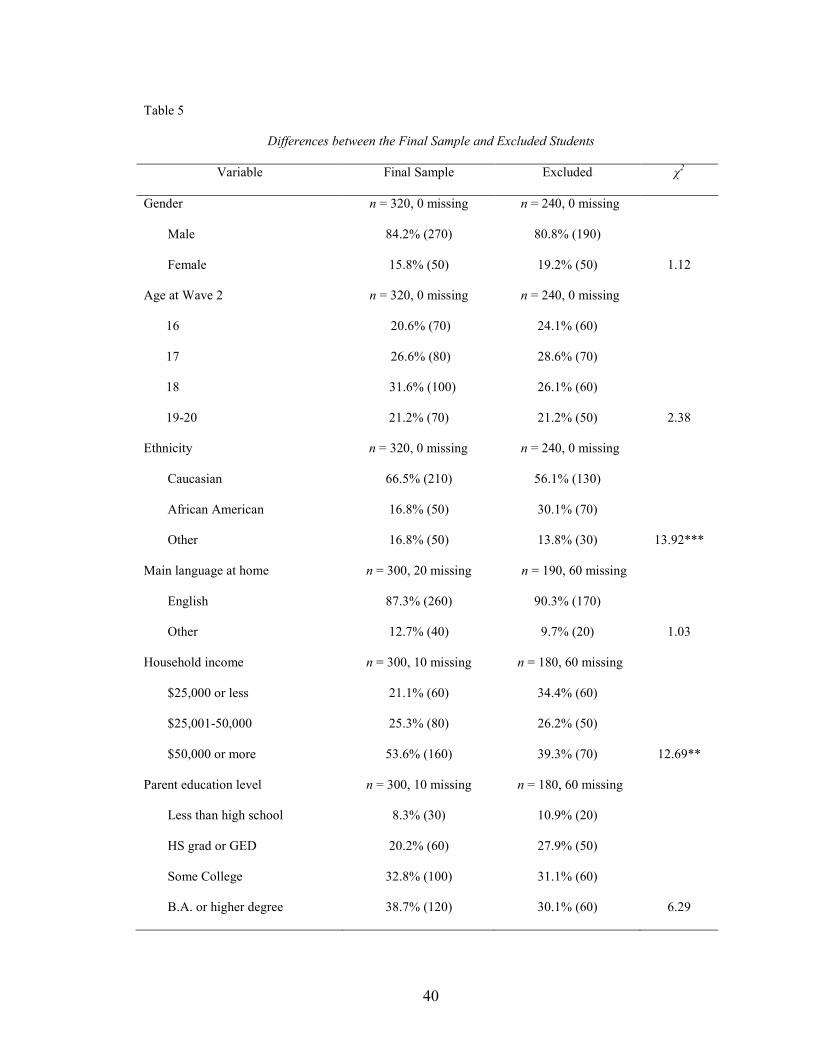
Participants in the final sample differ significantly from those excluded from the
sample on five of the 20 predictor variables: ethnicity, household income, diagnosis of
ID, functional cognitive skills, and percentage of time in general education (see Table 5).
African American students were more likely to be excluded from the sample than
Caucasian students, χ2 (2, N = 560) = 13.92, p ≤ .001. Also, students from families with
an income of $25,000 or less were more likely to be excluded from the sample than those
from families with an income of $50,000 or more, χ2 (2, N = 490) = 12.69, p = .002.
Additionally, students with ID were more likely to be excluded from the final
sample, χ2 (1, N = 450) = 4.20, p = .04; as were students with low functional cognitive
skills, χ2 (2, N = 430) = 9.08, p = .01, and those who spend 0-33% of instructional time
in general education, χ2 (2, N = 530) = 6.85, p = .03. Therefore, the final sample is more
likely to include Caucasian students, those from families with a higher SES, and those
who are higher functioning. Notably, the two groups do not differ on the outcome
variable, or on any of the 15 remaining predictor variables.
40
Table 5
Differences between the Final Sample and Excluded Students
Variable Final Sample Excluded χ2
Gender n = 320, 0 missing n = 240, 0 missing
Male 84.2% (270) 80.8% (190)
Female 15.8% (50) 19.2% (50) 1.12
Age at Wave 2 n = 320, 0 missing n = 240, 0 missing
16 20.6% (70) 24.1% (60)
17 26.6% (80) 28.6% (70)
18 31.6% (100) 26.1% (60)
19-20 21.2% (70) 21.2% (50) 2.38
Ethnicity n = 320, 0 missing n = 240, 0 missing
Caucasian 66.5% (210) 56.1% (130)
African American 16.8% (50) 30.1% (70)
Other 16.8% (50) 13.8% (30) 13.92***
Main language at home n = 300, 20 missing n = 190, 60 missing
English 87.3% (260) 90.3% (170)
Other 12.7% (40) 9.7% (20) 1.03
Household income n = 300, 10 missing n = 180, 60 missing
$25,000 or less 21.1% (60) 34.4% (60)
$25,001-50,000 25.3% (80) 26.2% (50)
$50,000 or more 53.6% (160) 39.3% (70) 12.69**
Parent education level n = 300, 10 missing n = 180, 60 missing
Less than high school 8.3% (30) 10.9% (20)
HS grad or GED 20.2% (60) 27.9% (50)
Some College 32.8% (100) 31.1% (60)
B.A. or higher degree 38.7% (120) 30.1% (60) 6.29

41
Table 5 (continued)
Variable Final Sample Excluded χ2
Surrounding community n = 300, 10 missing n = 230, 20 missing
Suburban 55.4% (170) 53.5% (120)
Rural 6.8% (20) 8.4% (20)
Urban 37.8% (120) 38.1% (90) 0.51
Has ID n = 320, 0 missing n = 130, 110 missing
No 90.2% (290) 83.3% (110)
Yes 9.8% (30) 16.7% (20) 4.20*
Functional Cognitive Skills n = 310, 0 missing n = 120, 120 missing
Low 27.2% (90) 42.1% (50)
Medium 50.3% (160) 38.8% (50)
High 22.4% (70) 19% (20) 9.08**
Expressive communication n = 310, 0 missing n = 130, 110 missing
A lot of trouble 20.4% (60) 23.8% (30)
A little trouble 44.6% (140) 47.7% (60)
No trouble 35% (110) 28.5% (40) 1.91
Receptive communication n = 310, 10 missing n = 130, 110 missing
A lot of trouble 17% (50) 16.9% (20)
A little trouble 63.7% (200) 61.5% (80)
No trouble 19.3% (60) 21.5% (30) 0.30
General social skills n = 310, 10 missing n = 130, 120 missing
Low 35.6% (110) 44% (60)
Medium 52.1% (160) 45.6% (60)
High 12.3% (40) 10.4% (10) 2.67
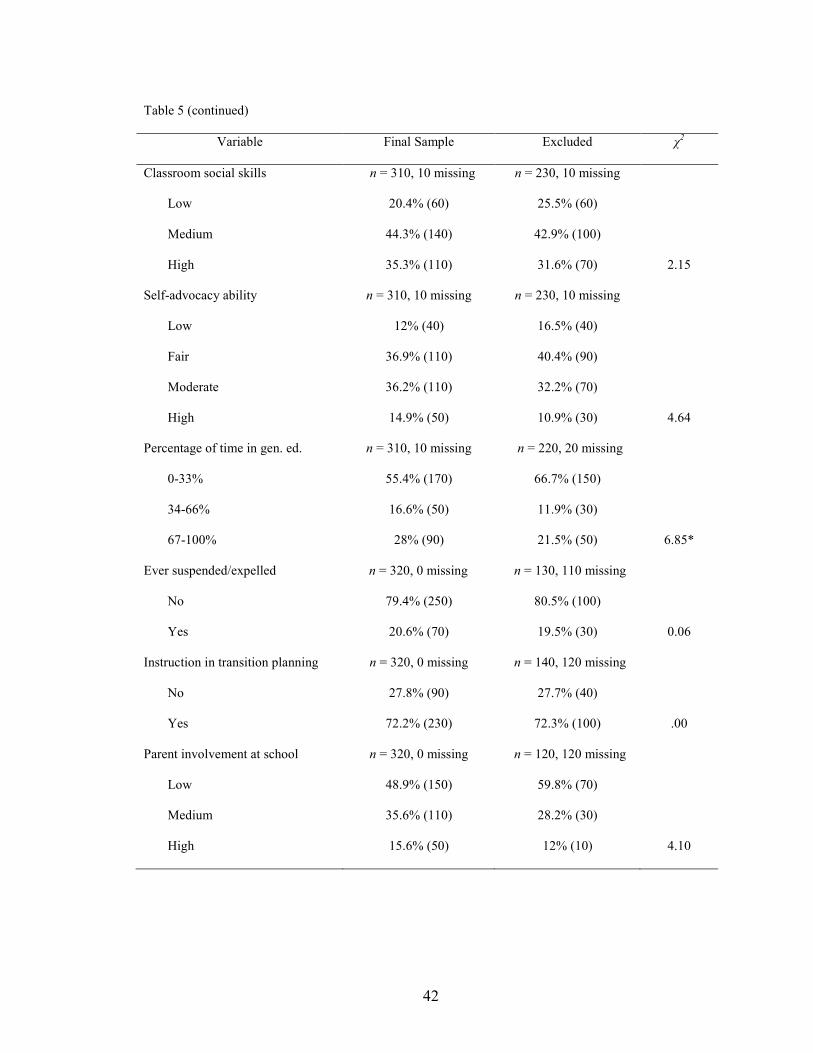
42
Table 5 (continued)
Variable Final Sample Excluded χ2
Classroom social skills n = 310, 10 missing n = 230, 10 missing
Low 20.4% (60) 25.5% (60)
Medium 44.3% (140) 42.9% (100)
High 35.3% (110) 31.6% (70) 2.15
Self-advocacy ability n = 310, 10 missing n = 230, 10 missing
Low 12% (40) 16.5% (40)
Fair 36.9% (110) 40.4% (90)
Moderate 36.2% (110) 32.2% (70)
High 14.9% (50) 10.9% (30) 4.64
Percentage of time in gen. ed. n = 310, 10 missing n = 220, 20 missing
0-33% 55.4% (170) 66.7% (150)
34-66% 16.6% (50) 11.9% (30)
67-100% 28% (90) 21.5% (50) 6.85*
Ever suspended/expelled n = 320, 0 missing n = 130, 110 missing
No 79.4% (250) 80.5% (100)
Yes 20.6% (70) 19.5% (30) 0.06
Instruction in transition planning n = 320, 0 missing n = 140, 120 missing
No 27.8% (90) 27.7% (40)
Yes 72.2% (230) 72.3% (100) .00
Parent involvement at school n = 320, 0 missing n = 120, 120 missing
Low 48.9% (150) 59.8% (70)
Medium 35.6% (110) 28.2% (30)
High 15.6% (50) 12% (10) 4.10

43
Table 5 (continued)
Variable Final Sample Excluded χ2
Parent involved at meeting n = 320, 0 missing n = 170, 70 missing
No 5.7% (20) 8.1% (10)
Yes 94.3% (300) 91.9% (160) 1.03
Discussed transition at home n = 320, 0 missing n = 80, 160 missing
Never 18.7% (60) 23.8% (20)
Rarely 9.2% (30) 6.3% (10)
Occasionally 32% (100) 35% (30)
Regularly 40% (130) 35% (30) 2.09
Role in transition planning n = 320, 0 missing n = 160, 80 missing
Absent 15.2% (50) 15.2% (30)
Present, participated little 47.5% (150) 46.3% (80)
Moderate-active participant 37.3% (120) 38.4% (60) 0.06
* p ≤ .05. ** p ≤ .01. *** p ≤ .001.

44
Relationships between Variables
Relationships between Predictor and Outcome Variables
Demographic characteristics. Of the seven demographic variables, three were
significantly related to the outcome variable: age, ethnicity, and household income. First,
compared with older students (aged 18-20), younger students (aged 16-17) were more
likely to take an active role in their transition planning, χ2 (6, N = 320) = 20.68, p =
.002. Second, Caucasian students were more likely to take a moderate to active role in
their transition planning and less likely to be absent, compared with students of other
ethnicities, χ2 (4, N = 320) = 19.99, p ≤ .001. Finally, compared with lower-income
students, higher-income students were more likely to be present and take a moderate to
active role in their transition planning, χ2 (4, N = 320) = 12.62, p ≤ .05.
Student characteristics. Of the seven variables related to student characteristics,
only one was not significantly related to the outcome variable: a diagnosis of ID. Results
related to functional and communication abilities, social skills, and self-advocacy are
reported in the following sections.
Functional and communication skills. Students with higher functional cognitive
skills are more likely to attend and take an active role in transition planning, χ2 (4, N =
320) = 52.21, p ≤ .001. Similarly, students with greater expressive communication are
more likely to attend and take an active role in transition planning, χ2 (4, N = 320) =
41.99, p ≤ .001. Finally, receptive communication was related to student participation in
transition planning, χ2 (4, N = 320) = 19.61, p ≤ .001. Students with lower receptive
communication skills were more likely to be absent or to be present but participate little.
45
Compared with students with higher receptive communication, they were less likely to
participate actively in their transition planning.
Social skills. Students with better general social skills are more likely to attend
and take an active role in transition planning, χ2 (4, N = 320) = 11.39, p = .02. Likewise,
students with better classroom social skills are more likely to attend and take an active
role in transition planning, χ2 (4, N = 320) = 29.40, p ≤ .001.
Self-advocacy. Students with greater self-advocacy skills are more likely to attend
and take an active role in transition planning, χ2 (6, N = 320) = 47.18, p ≤ .001.
School experiences. Of the three variables related to school experiences, only one
related to the outcome. Compared to students who spend little time in general education,
those who spend a greater percentage of time in general education settings are more
likely to attend and participate in transition planning, χ2 (4, N = 320) = 64.05, p ≤ .001.
Parent involvement. Of the three variables related to parent involvement, only
one was significantly related to the outcome variable. The more frequently students
discussed their plans after high school with a parent, the more likely students were to
attend and take an active role in transition planning, χ2 (6, N = 320) = 62.82, p ≤ .001.
Chi-square statistics are reported for all predictor variables in relation to the
outcome variable (see Table 6). For most predictors, the outcome was grouped into three
categories: the student (a) was absent; (b) was present, but participated little; and (c) took
a moderate to active role. However, for several predictor variables, the expected
frequency for some cells was less than 5. For these, the outcome was grouped into two
categories: the student (a) was absent, or present but participated little; and (b) took a
moderate to active role. These variables are listed at the end of Table 6.
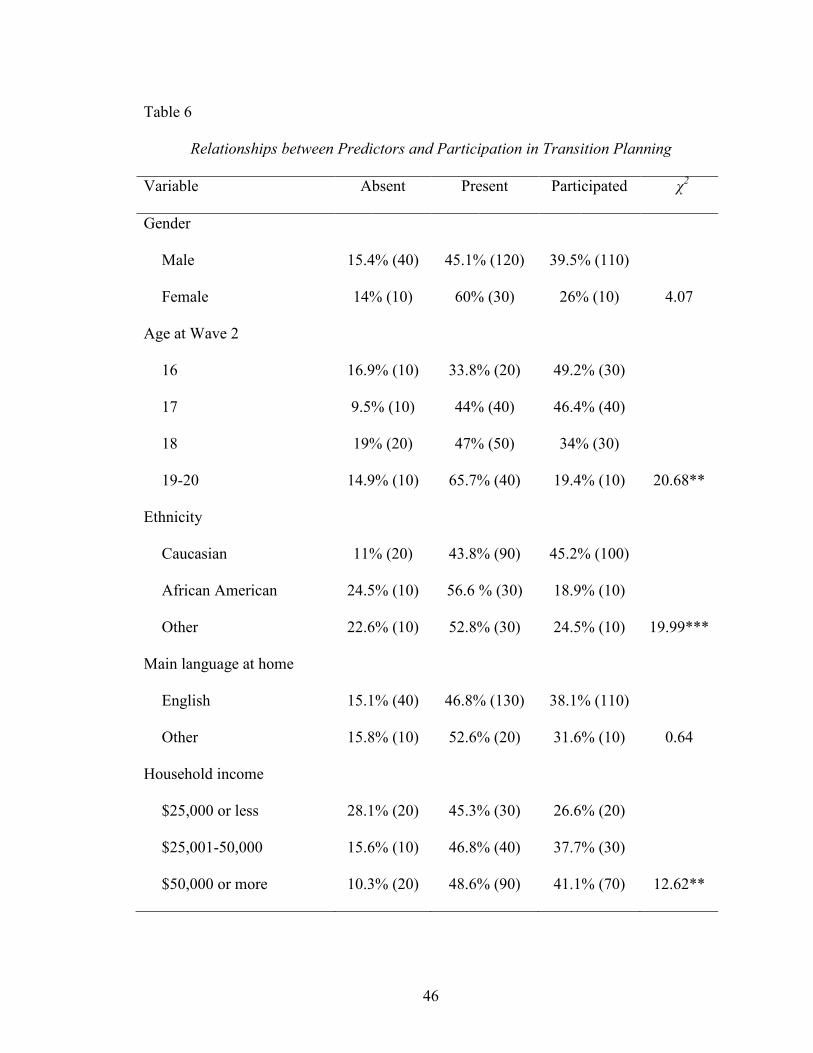
46
Table 6
Relationships between Predictors and Participation in Transition Planning
Variable Absent Present Participated χ2
Gender
Male 15.4% (40) 45.1% (120) 39.5% (110)
Female 14% (10) 60% (30) 26% (10) 4.07
Age at Wave 2
16 16.9% (10) 33.8% (20) 49.2% (30)
17 9.5% (10) 44% (40) 46.4% (40)
18 19% (20) 47% (50) 34% (30)
19-20 14.9% (10) 65.7% (40) 19.4% (10) 20.68**
Ethnicity
Caucasian 11% (20) 43.8% (90) 45.2% (100)
African American 24.5% (10) 56.6 % (30) 18.9% (10)
Other 22.6% (10) 52.8% (30) 24.5% (10) 19.99***
Main language at home
English 15.1% (40) 46.8% (130) 38.1% (110)
Other 15.8% (10) 52.6% (20) 31.6% (10) 0.64
Household income
$25,000 or less 28.1% (20) 45.3% (30) 26.6% (20)
$25,001-50,000 15.6% (10) 46.8% (40) 37.7% (30)
$50,000 or more 10.3% (20) 48.6% (90) 41.1% (70) 12.62**

47
Table 6 (continued)
Variable Absent Present Participated χ2
Parent education level
< HS, HS grad / GED 17.4% (20) 44.2% (40) 38.4% (30)
Some College 18.2% (20) 46.5% (50) 35.4% (40)
B.A. or higher degree 11.5% (20) 50.4% (70) 38.2% (50) 2.68
Functional Cognitive Skills
Low 24.7% (20) 62.4% (50) 12.9% (10)
Medium 13.7% (20) 49.7% (80) 36.6% (60)
High 7.1% (10) 24.3% (20) 68.6% (50) 52.21***
Expressive communication
A lot of trouble 31.3% (20) 60.9% (40) 7.8% (10)
A little trouble 14.8% (20) 46.5% (70) 38.7% (60)
No trouble 6.4% (10) 40.9% (50) 52.7% (60) 41.99***
Receptive communication
A lot of trouble 22.6% (10) 64.2% (30) 13.2% (10)
A little trouble 12.8% (30) 47.3% (100) 39.9% (80)
No trouble 16.7% (10) 33.3% (20) 50% (30) 19.61***
General social skills
Low 19.1% (20) 54.5% (60) 26.4% (30)
Medium 14.9% (30) 43.5% (70) 41.7% (70)
High 5.3% (0) 44.7% (20) 50% (20) 11.39*

48
Table 6 (continued)
Variable Absent Present Participated χ2
Classroom social skills
Low 31.7% (20) 52.4% (30) 15.9% (10)
Medium 13.2% (20) 50% (70) 36.8% (50)
High 8.3% (10) 41.3% (50) 50.5% (60) 29.40***
Self-advocacy ability
Low 32.4% (10) 56.8% (20) 10.8% (0)
Fair 18.2% (20) 57.9% (70) 24% (30)
Moderate 8.9% (10) 42% (50) 49.1% (60)
High 8.7% (0) 26.1% (10) 65.2% (30) 47.18***
Percent time in gen. ed.
0-33% 22.9% (40) 55.9% (100) 21.2% (40)
34-66% 7.8% (0) 52.9% (30) 39.2% (20)
67-100% 3.5% (0) 26.7% (20) 69.8% (60) 64.05***
Ever suspended/expelled
No 16.3% (40) 49% (120) 34.7% (90)
Yes 10.8% (10) 41.5% (30) 47.7% (30) 4.01
Instruction in transition
planning
No 18.2% (20) 42% (40) 39.8% (40)
Yes 14% (30) 49.6% (110) 36.4% (80) 1.67
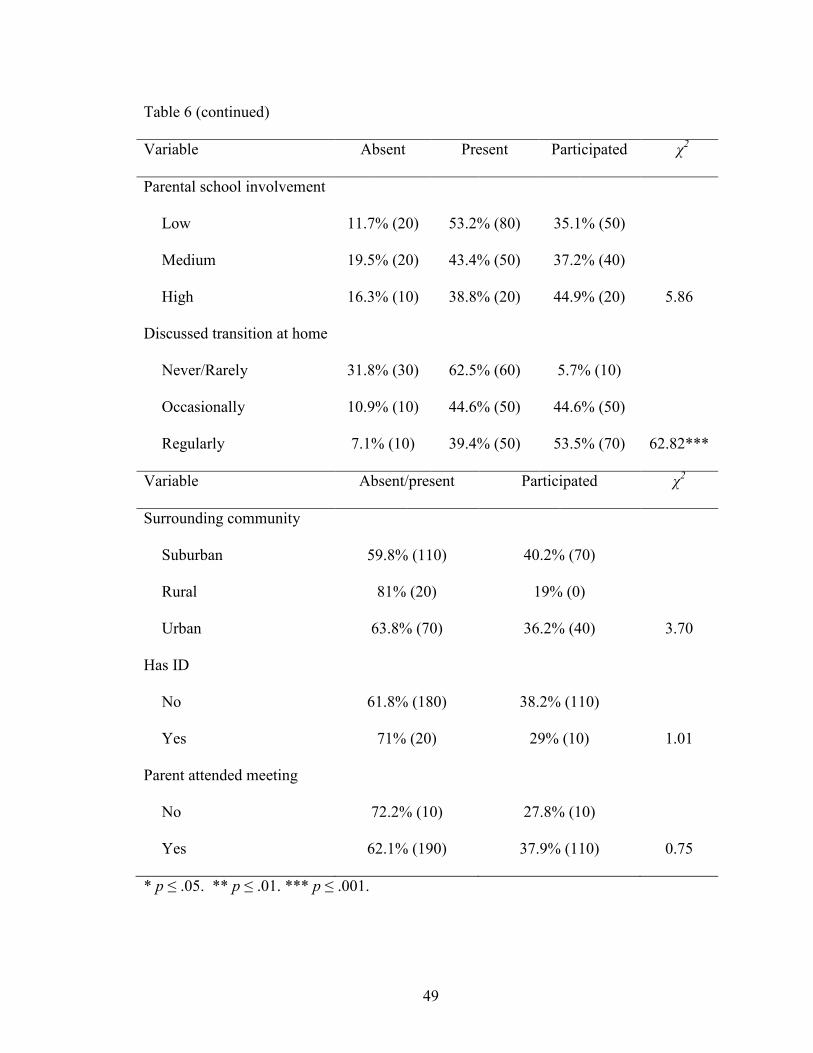
49
Table 6 (continued)
Variable Absent Present Participated χ2
Parental school involvement
Low 11.7% (20) 53.2% (80) 35.1% (50)
Medium 19.5% (20) 43.4% (50) 37.2% (40)
High 16.3% (10) 38.8% (20) 44.9% (20) 5.86
Discussed transition at home
Never/Rarely 31.8% (30) 62.5% (60) 5.7% (10)
Occasionally 10.9% (10) 44.6% (50) 44.6% (50)
Regularly 7.1% (10) 39.4% (50) 53.5% (70) 62.82***
Variable Absent/present Participated χ2
Surrounding community
Suburban 59.8% (110) 40.2% (70)
Rural 81% (20) 19% (0)
Urban 63.8% (70) 36.2% (40) 3.70
Has ID
No 61.8% (180) 38.2% (110)
Yes 71% (20) 29% (10) 1.01
Parent attended meeting
No 72.2% (10) 27.8% (10)
Yes 62.1% (190) 37.9% (110) 0.75
* p ≤ .05. ** p ≤ .01. *** p ≤ .001.

50
Relationships among Predictor Variables
To describe the relationships among the predictor variables, Spearman’s rho
correlations were calculated. Nine of the 20 predictors were not correlated above .30 with
any other predictor variables: gender, age, main language spoken at home, surrounding
community, whether the student has ID, whether the student has ever been suspended or
expelled, whether the student received instruction in transition planning, parent
involvement at school, and parent attendance at the transition planning meeting.
For ease of presentation, only the 11 variables with correlations of .30 or above
were reported in Table 7. Several of these were significantly correlated with many other
predictors. Five variables were significantly correlated with nine of the 10 other
predictors listed in Table 7: functional cognitive skills, ability to communicate, self-
advocacy skills, percentage of time spent in general education settings, and how often
transition is discussed at home. The highest correlation was between functional cognitive
skills and the percentage of time spent in general education settings, rs (320) = .62, p <
.01.
Though not so highly correlated that they should be excluded, many predictor
variables were clearly related. For example, the three demographic variables (ethnicity,
household income, and parent education level) were correlated. Similarly, many of the
variables related to student characteristics were correlated. Conversely, the 9 variables
excluded from Table 7 are not correlated above .30 with any other predictor variables.
Therefore, several of the 20 predictor variables are highly interrelated, and several are not
strongly related to any of the others.
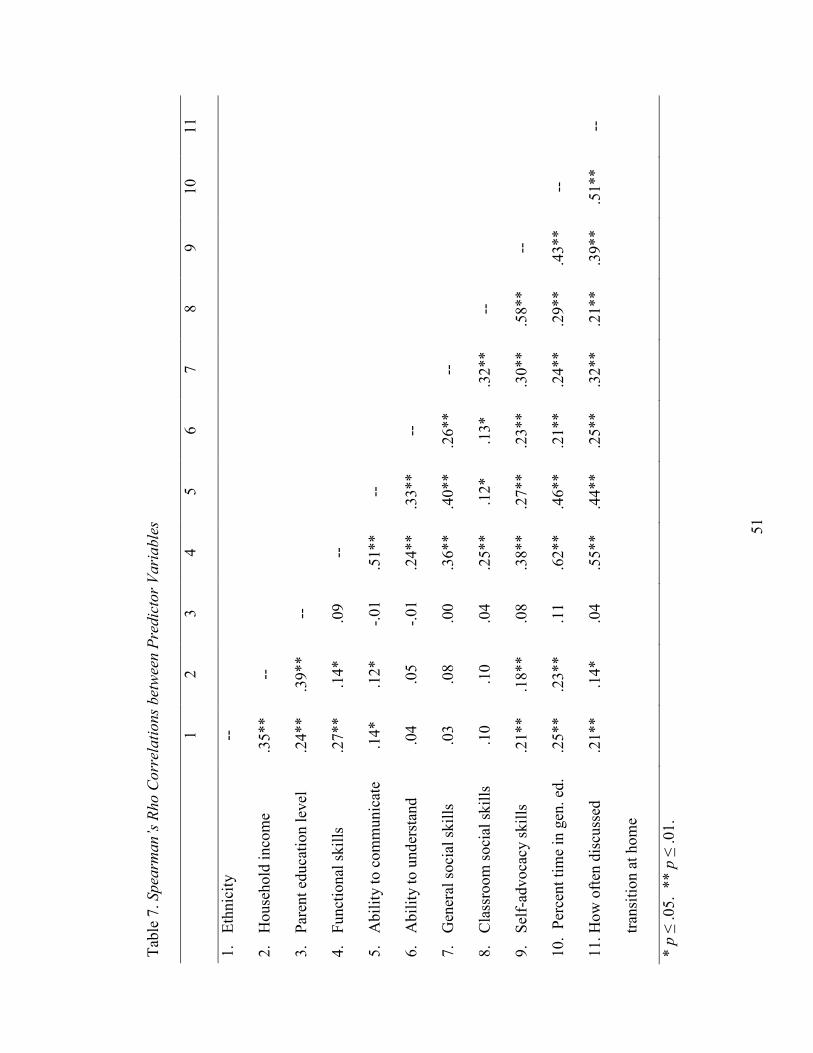
51
Tab
le 7
. Spea
rman
’s R
ho
Corr
elati
ons
bet
wee
n P
redic
tor
Vari
able
s
1
2
3
4
5
6
7
8
9
10
11
1. E
thnic
ity
--
2. H
ouse
hold
inco
me
.35**
--
3. P
aren
t ed
uca
tion l
evel
.2
4**
.39**
--
4. F
unct
ional
skil
ls
.27**
.14*
.09
--
5. A
bil
ity t
o c
om
munic
ate
.14*
.12*
-.01
.51**
--
6. A
bil
ity t
o u
nd
erst
and
.0
4
.05
-.01
.24**
.33**
--
7. G
ener
al s
oci
al s
kil
ls
.03
.08
.00
.36**
.40**
.26**
--
8. C
lass
room
soci
al s
kil
ls
.10
.10
.04
.25**
.12*
.13*
.32**
--
9. S
elf-
advoca
cy s
kil
ls
.21**
.18**
.08
.38**
.27**
.23**
.30**
.58**
--
10. P
erce
nt
tim
e in
gen
. ed
. .2
5**
.23**
.11
.62**
.46**
.21**
.24**
.29**
.43**
--
11. H
ow
oft
en d
iscu
ssed
tran
siti
on a
t hom
e
.21**
.14*
.04
.55**
.44**
.25**
.32**
.21**
.39**
.51**
--
* p
≤ .05. *
* p
≤ .01.
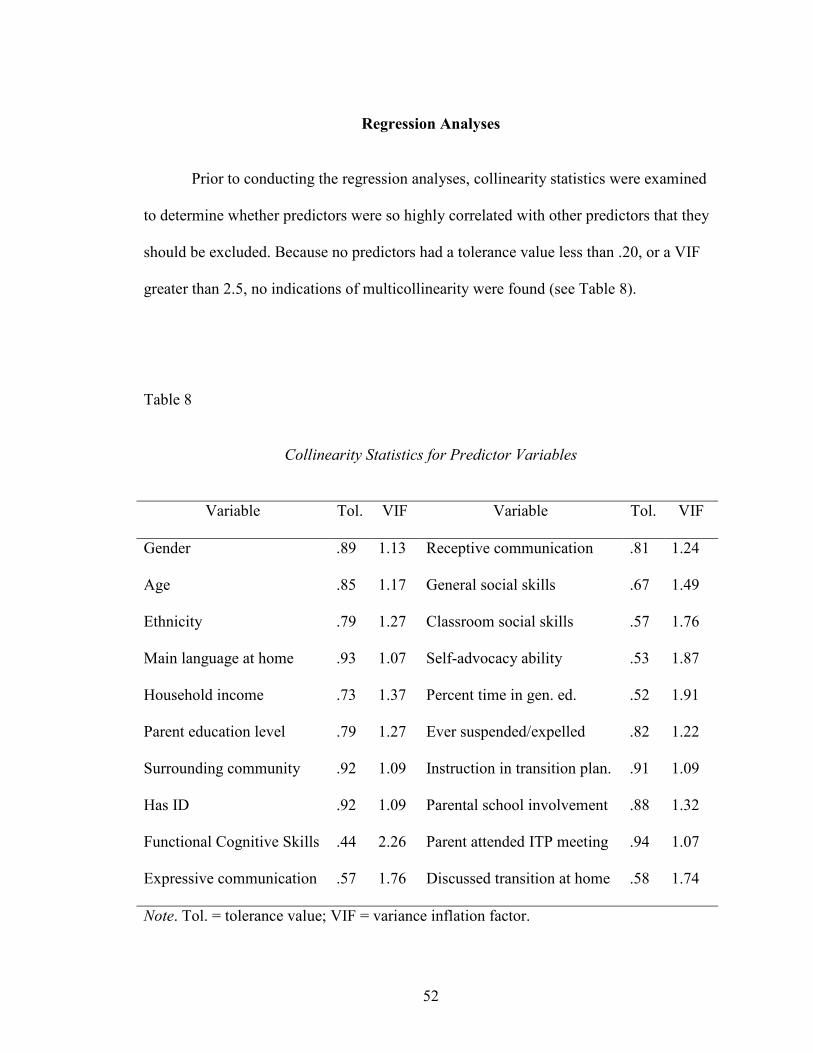
52
Regression Analyses
Prior to conducting the regression analyses, collinearity statistics were examined
to determine whether predictors were so highly correlated with other predictors that they
should be excluded. Because no predictors had a tolerance value less than .20, or a VIF
greater than 2.5, no indications of multicollinearity were found (see Table 8).
Table 8
Collinearity Statistics for Predictor Variables
Variable Tol. VIF Variable Tol. VIF
Gender .89 1.13 Receptive communication .81 1.24
Age .85 1.17 General social skills .67 1.49
Ethnicity .79 1.27 Classroom social skills .57 1.76
Main language at home .93 1.07 Self-advocacy ability .53 1.87
Household income .73 1.37 Percent time in gen. ed. .52 1.91
Parent education level .79 1.27 Ever suspended/expelled .82 1.22
Surrounding community .92 1.09 Instruction in transition plan. .91 1.09
Has ID .92 1.09 Parental school involvement .88 1.32
Functional Cognitive Skills .44 2.26 Parent attended ITP meeting .94 1.07
Expressive communication .57 1.76 Discussed transition at home .58 1.74
Note. Tol. = tolerance value; VIF = variance inflation factor.
53
Next, two binary logistic regressions were conducted to determine whether the
outcome variable constituted an ordinal scale. For Regression A, the outcome variable
was grouped into students who were absent versus those who were present (e.g., students
who attended but participated little, those who participated moderately, and those who
took a leadership role). The combination of four variables significantly predicted
whether students would be present (versus absent) for transition planning, χ2 (22, N =
320) = 67.84, p < .001 (see Table 9).
The variables that significantly predicted student attendance were expressive
communication skills; percentage of time in general education settings; frequency of
discussions about transition with parents; and parental involvement at school. Higher
expressive communication skills were positively related to student attendance (p ≤ .01, OR
= 2.80), as was a greater percentage of time in general education settings (p ≤ .05, OR =
1.02). Predictors related to parent involvement produced contrasting results. Whereas
more frequent discussions at home about plans for after high school was positively
related to student attendance (p ≤ .05, OR = 1.83), greater parental involvement at school
was negatively related (p ≤ .01, OR = 0.81).
For Regression B, the outcome variable was grouped as follows: students who
were absent or present but participated little versus students who participated moderately
and those who took a leadership role. The combination of five variables significantly
predicted whether students would be active participants, χ2 (22, N = 320) = 129.94, p
< .001 (see Table 9).

54
Tab
le 9
. R
esu
lts
of
Lo
gis
tic
Reg
ress
ion
An
aly
ses
R
egre
ssio
n A
: S
tud
ent
atte
nd
ance
R
egre
ssio
n B
: A
ctiv
e st
ud
ent
par
tici
pat
ion
Var
iab
le
β
SE
W
ald
χ2
OR
[9
5%
CI]
β
S
E
Wal
d χ
2
OR
[9
5%
CI]
Dem
ogra
ph
ics
Gen
der
-
0.8
0
0.5
5
2.1
0
0.4
5 [
0.1
5,
1.3
2]
0.2
7
0.4
5
0.3
6
1.3
1 [
0.5
4,
3.1
9]
Age
0
.32
0.1
9
2.8
8
1.3
8 [
0.9
5,
1.9
9]
- 0.36
0.15
5.38*
0.70 [0.52, 0.95]
Eth
nic
ity (
com
par
ed t
o C
auca
sian
)
0
.20
6.20*
Afr
ican
Am
eric
an
- 0
.17
0.5
0
0.1
1
0.8
5 [
0.3
2,
2.2
6]
- 1.10
0.49
5.03*
0.33 [0.13, 0.87]
Oth
er
- 0
.22
0.5
6
0.1
5
0.8
1 [
0.2
7,
2.4
1]
- 0
.75
0.5
4
1.9
5
0.4
7 [
0.1
7,
1.3
5]
Mai
n l
ang
uag
e
- 0
.63
0.6
5
0.9
4
0.5
3 [
0.1
5,
1.9
0]
- 0
.23
0.5
4
0.1
9
0.7
9 [
0.2
8,
2.2
7]
Ho
use
ho
ld i
nco
me
0.4
2
0.2
6
2.5
0
1.5
2 [
0.9
1,
2.5
4]
0.0
5
0.2
2
0.0
5
1.0
5 [
0.6
8,
1.6
3]
Par
ent
educa
tio
n l
evel
0
.23
0.2
6
0.7
9
1.2
6 [
0.7
6,
2.0
8]
- 0
.30
0.2
0
2.3
5
0.7
4 [
0.5
0,
1.0
9]
Co
mm
unit
y (
com
par
ed t
o S
ub
urb
an)
5.6
2
3
.85
Rura
l -
0.1
0
0.6
7
2.2
4
0.3
7 [
0.1
0,
1.3
6]
-1.1
5
0.7
1
2.5
8
0.3
2 [
0.0
8,
1.2
9]
Urb
an
0.6
7
0.4
3
2.4
0
1.9
6 [
0.8
4,
4.5
8]
0.2
8
0.3
3
0.7
3
1.3
2 [
0.7
0,
2.5
0]
Stu
den
t ch
arac
teri
stic
s
Stu
den
t has
ID
0
.76
0.5
7
1.8
1
2.1
4 [
0.7
1,
6.4
9]
- 0
.58
0.6
1
0.9
3
0.5
6 [
0.1
7,
1.8
3]
Fu
nct
ional
co
gnit
ive
skil
ls
0.0
0
0.7
0
0.0
0
1.0
0 [
0.8
7,
1.1
5]
0.1
1
0.0
6
3.2
3
1.1
2 [
0.9
9,
1.2
6]
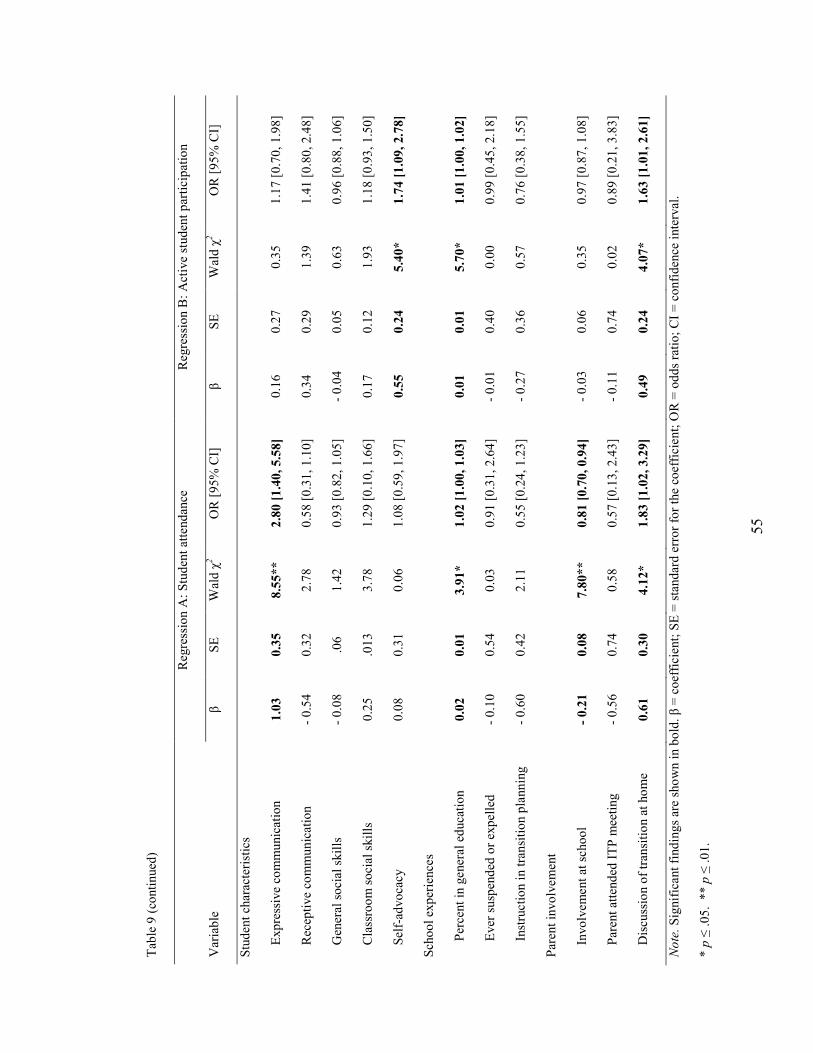
55
Tab
le 9
(co
nti
nued
)
R
egre
ssio
n A
: S
tud
ent
atte
nd
ance
R
egre
ssio
n B
: A
ctiv
e st
ud
ent
par
tici
pat
ion
Var
iab
le
β
SE
W
ald
χ2
OR
[9
5%
CI]
β
S
E
Wal
d χ
2
OR
[9
5%
CI]
Stu
den
t ch
arac
teri
stic
s
Exp
ress
ive
com
mu
nic
atio
n
1.03
0.35
8.55**
2.80 [1.40, 5.58]
0.1
6
0.2
7
0.3
5
1.1
7 [
0.7
0,
1.9
8]
Rec
epti
ve
com
mu
nic
atio
n
- 0
.54
0.3
2
2.7
8
0.5
8 [
0.3
1,
1.1
0]
0.3
4
0.2
9
1.3
9
1.4
1 [
0.8
0,
2.4
8]
Gen
eral
so
cial
skil
ls
- 0
.08
.06
1.4
2
0.9
3 [
0.8
2,
1.0
5]
- 0
.04
0.0
5
0.6
3
0.9
6 [
0.8
8,
1.0
6]
Cla
ssro
om
so
cial
skil
ls
0.2
5
.01
3
3.7
8
1.2
9 [
0.1
0,
1.6
6]
0.1
7
0.1
2
1.9
3
1.1
8 [
0.9
3,
1.5
0]
Sel
f-ad
vo
cacy
0
.08
0.3
1
0.0
6
1.0
8 [
0.5
9,
1.9
7]
0.55
0.24
5.40*
1.74 [1.09, 2.78]
Sch
oo
l ex
per
ience
s
Per
cent
in g
ener
al e
duca
tio
n
0.02
0.01
3.91*
1.02 [1.00, 1.03]
0.01
0.01
5.70*
1.01 [1.00, 1.02]
Ever
su
spen
ded
or
exp
elle
d
- 0
.10
0.5
4
0.0
3
0.9
1 [
0.3
1,
2.6
4]
- 0
.01
0.4
0
0.0
0
0.9
9 [
0.4
5,
2.1
8]
Inst
ruct
ion i
n t
ran
siti
on p
lann
ing
- 0
.60
0.4
2
2.1
1
0.5
5 [
0.2
4,
1.2
3]
- 0
.27
0.3
6
0.5
7
0.7
6 [
0.3
8,
1.5
5]
Par
ent
invo
lvem
ent
Invo
lvem
ent
at s
cho
ol
- 0.21
0.08
7.80**
0.81 [0.70, 0.94]
- 0
.03
0.0
6
0.3
5
0.9
7 [
0.8
7,
1.0
8]
Par
ent
atte
nd
ed I
TP
mee
tin
g
-
0.5
6
0.7
4
0.5
8
0.5
7 [
0.1
3,
2.4
3]
- 0
.11
0.7
4
0.0
2
0.8
9 [
0.2
1,
3.8
3]
Dis
cuss
ion o
f tr
ansi
tio
n a
t ho
me
0.61
0.30
4.12*
1.83 [1.02, 3.29]
0.49
0.24
4.07*
1.63 [1.01, 2.61]
No
te.
Sig
nif
ican
t fi
nd
ing
s ar
e sh
ow
n i
n b
old
. β
= c
oef
fici
ent;
SE
= s
tand
ard
err
or
for
the
coef
fici
ent;
OR
= o
dd
s ra
tio
; C
I =
co
nfi
den
ce i
nte
rval
.
* p
≤ .
05
. *
* p
≤ .
01
.

56
The variables that significantly predicted active student participation were self-
advocacy ability; percentage of time in general education; ethnicity; age; and frequency
of discussions about transition with parents. First, African American students were less
likely than Caucasian students to actively participate in transition planning (p ≤ .05, OR =
0.33). Likewise, older students were less likely to actively participate in transition planning
(p ≤ .05, OR = 0.70). Additionally, higher functioning students were more likely to take
an active role in transition planning. Specifically, having higher self-advocacy skills was
positively related to active student participation (p ≤ .05, OR = 1.74), as was greater
percentage of time in general education (p ≤ .05, OR = 1.01). Finally, greater frequency of
discussions at home about post-school plans was positively related to active student
participation (p ≤ .05, OR = 1.63).
As shown in Table 10, both the percentage of time spent in general education
settings and how often transition is discussed at home are significant predictors in
Regression A and in Regression B. However, several variables also uniquely predict both
(a) student presence in transition planning meetings, and (b) active participation in
transition planning meetings. In Regression A, the unique variables that significantly
predicted student attendance were expressive communication skills and parent
involvement at school. In Regression B, the unique variables that significantly predicted
active participation were student age, ethnicity, and self-advocacy ability. These findings
indicate that the outcome variable should not be considered an ordinal scale, and that
conducting two separate logistic regressions was appropriate.
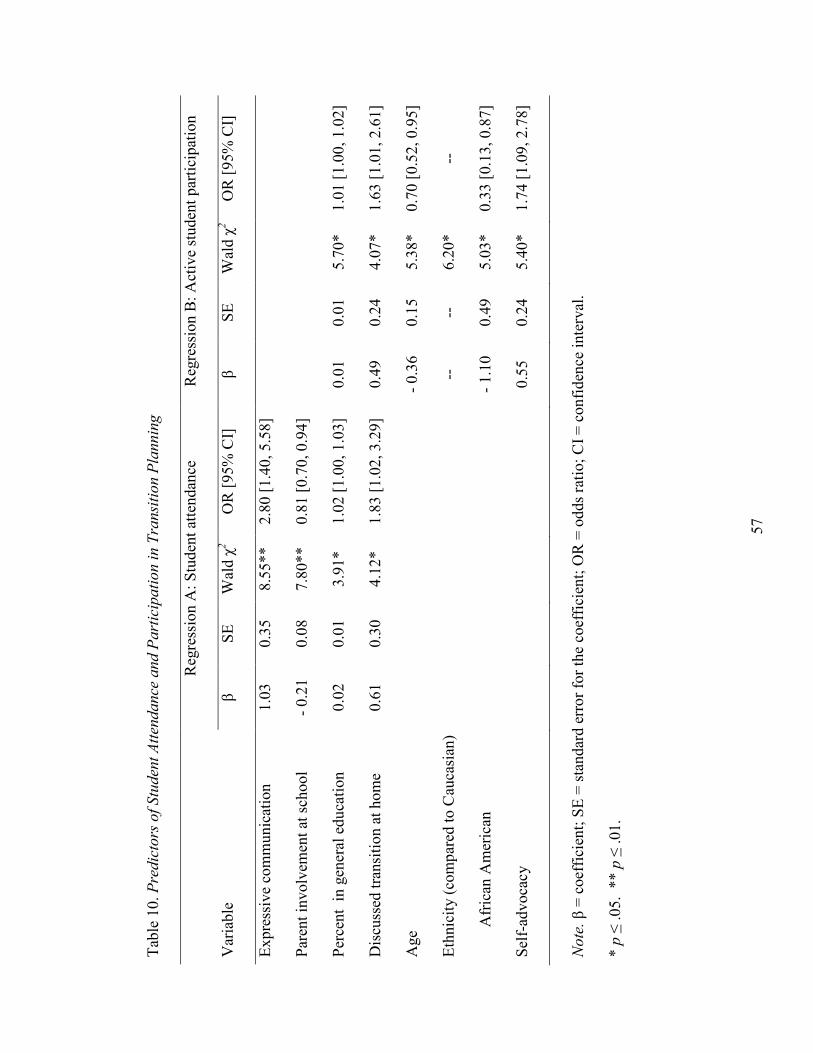
57
Tab
le 1
0. P
redic
tors
of
Stu
den
t A
tten
dance
and P
art
icip
ati
on i
n T
ransi
tion P
lannin
g
R
egre
ssio
n A
: S
tuden
t at
tendan
ce
Reg
ress
ion B
: A
ctiv
e st
uden
t par
tici
pat
ion
Var
iable
β
S
E
Wal
d χ
2
OR
[95%
CI]
β
S
E
Wal
d χ
2
OR
[95%
CI]
Ex
pre
ssiv
e co
mm
unic
atio
n
1.0
3
0.3
5
8.5
5**
2.8
0 [
1.4
0, 5.5
8]
Par
ent
involv
emen
t at
sch
ool
- 0.2
1
0.0
8
7.8
0**
0.8
1 [
0.7
0, 0.9
4]
Per
cent
in g
ener
al e
du
cati
on
0.0
2
0.0
1
3.9
1*
1.0
2 [
1.0
0, 1.0
3]
0.0
1
0.0
1
5.7
0*
1.0
1 [
1.0
0, 1.0
2]
Dis
cuss
ed t
ransi
tion a
t hom
e 0.6
1
0.3
0
4.1
2*
1.8
3 [
1.0
2, 3.2
9]
0.4
9
0.2
4
4.0
7*
1.6
3 [
1.0
1, 2.6
1]
Age
-
0.3
6
0.1
5
5.3
8*
0.7
0 [
0.5
2, 0.9
5]
Eth
nic
ity (
com
par
ed t
o C
auca
sian
)
--
--
6.2
0*
--
Afr
ican
Am
eric
an
- 1.1
0
0.4
9
5.0
3*
0.3
3 [
0.1
3, 0.8
7]
Sel
f-ad
voca
cy
0.5
5
0.2
4
5.4
0*
1.7
4 [
1.0
9, 2.7
8]
Note
. β
= c
oef
fici
ent;
SE
= s
tandar
d e
rro
r fo
r th
e co
effi
cien
t; O
R =
odds
rati
o;
CI
= c
on
fiden
ce i
nte
rval
.
* p
≤ .05. *
* p
≤ .01.

58
Post-hoc Analyses
To follow up these results, chi-square statistics were calculated between each of
the significant predictor variables and the outcome. Both sets of follow-up analyses
mirrored the categories used in the regressions. As shown in Table 11, the follow-up
analyses for Regression A document a significant relationship between three of the four
predictor variables and the outcome variable. Although a significant predictor in the
regression, parental involvement in school was not related to the outcome in the
univariate analysis. Thus, taking the other variables into account in the regression reveals
that parental involvement at school is significantly related to student attendance and
participation at transition planning meetings among students with ASD.
As shown in Table 11, the follow-up analyses for Regression B document a
significant relationship between student participation in transition planning and all five
predictor variables identified by the regression. Though percentages presented for
African American students and students of other ethnicities are similar in Table 11, only
African American students differed significantly from Caucasian students in the
regression. Thus, taking the other variables into account in the regression reveals that
only African American students with ASD differed significantly from Caucasian students
with ASD in terms of active participation in transition planning.
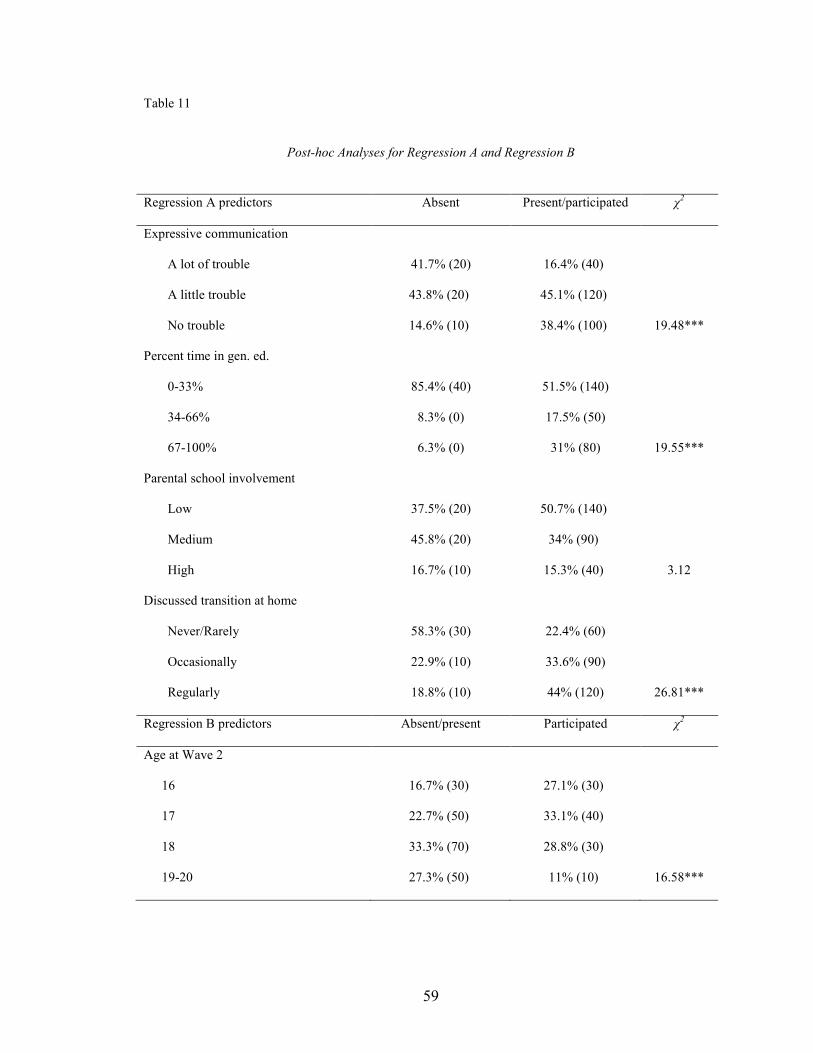
59
Table 11
Post-hoc Analyses for Regression A and Regression B
Regression A predictors Absent Present/participated χ2
Expressive communication
A lot of trouble 41.7% (20) 16.4% (40)
A little trouble 43.8% (20) 45.1% (120)
No trouble 14.6% (10) 38.4% (100) 19.48***
Percent time in gen. ed.
0-33% 85.4% (40) 51.5% (140)
34-66% 8.3% (0) 17.5% (50)
67-100% 6.3% (0) 31% (80) 19.55***
Parental school involvement
Low 37.5% (20) 50.7% (140)
Medium 45.8% (20) 34% (90)
High 16.7% (10) 15.3% (40) 3.12
Discussed transition at home
Never/Rarely 58.3% (30) 22.4% (60)
Occasionally 22.9% (10) 33.6% (90)
Regularly 18.8% (10) 44% (120) 26.81***
Regression B predictors Absent/present Participated χ2
Age at Wave 2
16 16.7% (30) 27.1% (30)
17 22.7% (50) 33.1% (40)
18 33.3% (70) 28.8% (30)
19-20 27.3% (50) 11% (10) 16.58***
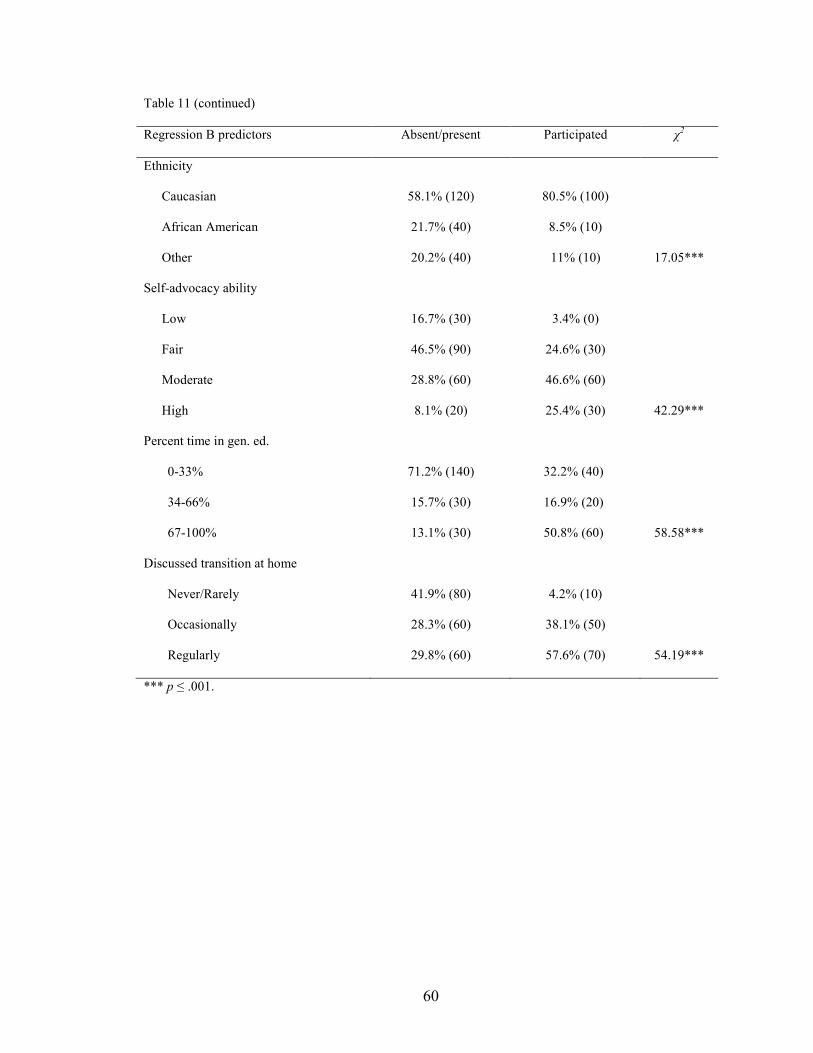
60
Table 11 (continued)
Regression B predictors Absent/present Participated χ2
Ethnicity
Caucasian 58.1% (120) 80.5% (100)
African American 21.7% (40) 8.5% (10)
Other 20.2% (40) 11% (10) 17.05***
Self-advocacy ability
Low 16.7% (30) 3.4% (0)
Fair 46.5% (90) 24.6% (30)
Moderate 28.8% (60) 46.6% (60)
High 8.1% (20) 25.4% (30) 42.29***
Percent time in gen. ed.
0-33% 71.2% (140) 32.2% (40)
34-66% 15.7% (30) 16.9% (20)
67-100% 13.1% (30) 50.8% (60) 58.58***
Discussed transition at home
Never/Rarely 41.9% (80) 4.2% (10)
Occasionally 28.3% (60) 38.1% (50)
Regularly 29.8% (60) 57.6% (70) 54.19***
*** p ≤ .001.
61
CHAPTER IV
DISCUSSION
Using data from a large-scale, national study, this investigation identified the
characteristics that related to differences in attendance and participation in transition
planning among students with ASD, the group least likely to attend and participate
actively. Because the intervention literature provides little evidence regarding the
effectiveness of interventions among this population, the current study provides needed
information about this neglected group. This chapter presents a discussion of the findings,
provides implications for research and practice around promoting participation in
transition planning among students with ASD, and notes study limitations.
Summary of Findings
Nature of the Outcome Variable
To determine whether the outcome variable constitutes a single ordinal scale, two
logistic regressions were conducted. The first identified predictors of student attendance
(versus absence) at transition planning meetings. The second identified predictors of
active student participation in transition planning (versus absence or attendance but little
participation). Though these analyses identified a few common predictors, there were
also a few predictors unique to only one regression. Thus, for Regression A, expressive
communication skills and parental involvement at school were uniquely related to student
62
attendance. For Regression B, student age, ethnicity, and self-advocacy ability were
uniquely related to active student participation.
The unique predictor variables identified in Regression A and in Regression B
document that the outcome variable does not constitute a single ordinal scale, but that
student attendance and active student participation are different outcomes with different
associated predictors. Wagner et al. (2012) also took this approach in studying
participation in transition planning among students with disabilities overall. Like the
current study, Wagner and colleagues identified both predictor variables common to the
two regressions, as well as predictors that uniquely related to student attendance and to
active student participation. Thus, recent studies have found that student attendance at
transition planning meetings is related to different predictor variables than active student
participation in these meetings.
Regression A: Predictors of Attendance
Regression A identified the variables that significantly predicted attendance at
transition planning meetings among students with ASD. Higher functioning was
positively related to student attendance; specifically, higher expressive communication
skills and a greater percentage of time in general education positively related to student
attendance. As shown in Table 11, 85% of students who did not attend transition planning
meetings were students who spent the least amount of time (0-33%) in general education
settings. Though the connection between functioning level and student attendance is not
readily apparent, it may be that the perceptions of teachers and parents are related to a
63
student’s expressive communication skills and inclusion in general education settings. If
students’ teachers and parents do not perceive them as able to participate in transition
planning meetings, these involved adults might be less likely to encourage attendance.
Regression A also identified two predictors related to parent involvement.
Interestingly, these predictors produced contrasting results. Whereas student attendance
was positively related to more frequent discussions at home about post-school plans, it
was negatively related to greater parent participation at school (e.g., volunteering at the
school; attending general school meetings and class events). This distinction between
home- and school-based support has been noted before: among typically developing
adolescents, “school-based” parental involvement has been found to be less desired by
students and less effective (Hickman, Greenwood, & Miller, 1995; Hill & Tyson, 2009).
Additionally, it has been suggested that students with disabilities who have overly
involved parents might be less likely to advocate for themselves (Korbel, McGuire,
Banerjee, & Saunders, 2011). Sometimes pejoratively referred to as “helicopter parents,”
overly involved parents are thought to excessively “hover” around their children,
interjecting in situations (particularly at school) in a way that inhibits the engagement of
their children. Thus, overly involved parents have the potential to inhibit the development
of their child’s ability to plan, problem-solve, and engage in self-advocacy. This issue is
particularly relevant in considering possible effects among young adults as they transition
from greater dependence on parents in high school to greater independence in college, the
workplace, and social engagement in the community.

64
The recent study conducted by Wagner et al. (2012) identified variables that
predicted attendance in transition planning among students with various disabilities as a
group. Similar to the current study, Wagner and colleagues found that a greater percentage
of time spent in general education settings was positively related to student attendance. Also,
Wagner and colleagues found that greater parent involvement at home (a scale which
included the variable regarding frequency of discussions about transition planning) was
positively related to student attendance. Though Wagner and colleagues did not include
expressive communication skills in their regression model, they found that functional
cognitive skills were positively related to student attendance. Among students with ASD in
this sample, functional cognitive skills were correlated with expressive communication skills,
rs (320) = .51, p < .01.
Though this study’s findings were similar to the findings of Wagner et al. (2012),
they also differed in some respects. For example, the current study found that greater
parent participation at school was negatively related to student attendance. Additionally,
Wagner et al. identified several predictors of attendance among students of various
disabilities that were not significant predictors among this sample of students with ASD.
These included: student age, functional cognitive skills, parent attendance at transition
planning meetings, and whether the student had received instruction in transition
planning at school. Wagner et al. also found parent expectations of student participation
in postsecondary education to be a significant predictor; because data from this variable
were missing for 61% of the sample, it was not included in the current study.
65
Regression B: Predictors of Participation
Regression B identified the variables that significantly predicted active student
participation in transition planning meetings. Higher self-advocacy skills were positively
related to active student participation. This relationship seems intuitive, in that self-
advocacy involves both understanding personal limitations and communicating needs—
skills that would help students participate effectively in transition planning meetings.
Likewise, a greater percentage of time spent in general education settings was positively
related to active student participation. Students who spend a greater percentage of time in
general education settings are likely to be higher functioning. Thus, they are more likely
to have the skills needed to participate effectively in transition planning. Further, they are
more likely to be perceived by teachers and parents as able, and may therefore have more
opportunities to participate than peers who are not perceived this way.
Several demographic variables were also related to the outcome variable.
Consistent with prior findings, African American students were less likely than
Caucasian students to actively participate in transition planning (e.g., Wagner et al.,
2012). Notably, student attendance did not differ significantly by ethnicity; this
difference in findings may be due to the IDEA transition mandates that require IEP teams
to invite students to attend transition planning meetings. In addition to ethnicity, age was
also related to student participation in transition planning. Compared to younger students,
older students with ASD were less likely to be active participants in the transition
planning process. This contrasts with results of the study conducted by Wagner et al.
(2012), who found that age was positively related to active participation. In this sample,
66
age was related to functional skills, χ2 (6, N = 320) = 16.27, p = .01, and to percentage of
time in general education, χ2 (6, N = 320) = 21.08, p = .002. Among students aged 19-20,
73% spent the least amount of time in general education settings (0-33%). Thus,
compared to younger students, older students were lower functioning and less likely to be
in general education settings.
Finally, more frequent discussions at home about post-school plans were
positively related to student participation in transition planning. As shown in Table 11,
96% of students who took an active role in transition planning had occasional or regular
discussions at home about post-school plans, compared to 4% who had such discussions
rarely or never. Like this study, Wagner et al. (2012) found that attendance and active
participation among students with disabilities was positively related to greater parent
involvement at home (a scale that included the item regarding discussion of transition at
home). However, in contrast with the findings of Wagner et al., participation among
students with ASD did not relate to instruction in transition planning. Thus, conversations
with parents about post-school plans were more influential than school-based instruction
in preparing students with ASD to actively engage in the transition planning process.
Similar to the current study, Wagner et al. (2012) found that a greater percentage
of time spent in general education was positively related to active participation among
students with disabilities overall. Though Wagner et al. did not include self-advocacy skills
in their model, functional cognitive skills were positively related to student attendance.
Among students in this sample, functional cognitive skills were correlated with self-advocacy
skills, rs (320) = .38, p < .01. Also, like the current study, Wagner and colleagues found that
67
African American students were less likely to actively participate, compared to Caucasian
students.
Despite these similarities, some interesting differences also emerge from the two
studies. First, Wagner et al. (2012) found that Hispanic students were less likely to
actively participate, compared to Caucasian students. Due to a low sample size, the
current study grouped Hispanic students into the Other ethnicity category; students in this
category were not less likely to actively participate than Caucasian students. Additionally,
Wagner et al. (2012) identified several predictors of attendance among students with
disabilities that were not significant predictors among this sample of students with ASD.
These included: household income, functional cognitive skills, student social skills,
parental involvement at school, and whether the student had received instruction in
transition planning. They also found parent expectations of participation in postsecondary
education to be a significant predictor; because data from this variable were missing for
61% of the sample, it was not included in the current study.
Recurrent Themes and Divergent Findings
Inclusion in general education and higher functioning. Though differences in
predictors were found between Regression A and B, and despite differences between the
findings of this study and the study conducted by Wagner et al. (2012), the percentage of
time a student spent in general education settings remained influential. For all analyses,
students who spent a greater percentage of time in general education settings were more
likely to attend and participate actively in transition planning.
68
This finding runs parallel to findings in both the current study, as well as the study
conducted by Wagner et al. (2012). Though these studies included different combinations
of predictor variables in regression analyses, both found that higher functioning was
positively related to attendance and active participation in transition planning. Wagner et
al. found higher functional cognitive skills to be a significant predictor of both student
attendance and active participation among students with disabilities. In the current study
of students with ASD, higher functioning was similarly related to these outcomes.
Specifically, expressive communication skills were positively related to student
attendance, and self-advocacy skills were positively related to active participation.
Instruction in transition planning. Among students with disabilities overall,
having received instruction in transition planning was a significant predictor of both
student attendance and active participation in transition planning meetings (Wagner et al.,
2012). Among students with ASD, however, this variable was not significantly related to
either outcome. The initial univariate analyses presented in Table 6 show that attendance
and participation rates of students who received instruction in transition planning did not
differ significantly from participation rates of students who did not receive such
instruction. Thus, though instruction focused on transition planning was positively related
to attendance and active participation among students with disabilities overall, the same
cannot be said of this sample of students with ASD.
Parent involvement. In contrast, aspects of parent involvement were significant
predictors of both outcomes. However, the relationship of parent involvement to
attendance and participation in transition planning among students with ASD is complex.
In considering this issue, it is important to note that involvement of parents of students

69
with ASD diverges from involvement among parents of students with disabilities as a
group. Notably, parents of students with ASD are much more likely than other parents to
attend IEP and transition planning meetings (Wagner et al., 2012). In the current study,
almost 94% of parents attended their child’s transition planning meeting (see Table 6).
Thus, though Wagner et al. identified parent attendance at transition planning meetings as
a predictor of attendance among students with disabilities overall, parent attendance did
not significantly relate to the attendance of students with ASD.
Interestingly, Regression A produced contrasting results related to different facets
of parent involvement. Like Wagner et al. (2012), I had hypothesized that greater parent
involvement in school events would positively relate to student attendance, as parents
modeling engagement in these activities would hypothetically promote student
engagement. However, this hypothesis was not confirmed within the current study’s
sample of students with ASD and their families. Rather, student attendance was
negatively related to greater parent participation at school (e.g., volunteering at the
school; attending general school meetings and class events). Thus, it may be that overly
involved “helicopter parents” inadvertently discourage the involvement of their children.
As noted previously, this negative association with greater parent involvement at
school is counterbalanced by a positive relationship with greater frequency of
conversations at home about post-school plans. More frequent conversations between
parents and their adolescent children about their plans after high school were positively
associated with student attendance. Likewise, more frequent conversations were also
positively associated with active participation among students with ASD. This variable

70
was one of only two factors that significantly related to both student attendance and
participation. These findings can empower parents of youth with ASD that such
conversations play an important role in preparing students to hold similar conversations
in the context of more formal school-based transition planning.
In considering these different aspects of parent participation, the experiences of
parents of young adults with ASD offer important context. Among parents of children
with disabilities, the transition out of high school has been cited as particularly stressful--
filled with concerns about securing adult services, identifying employment or
postsecondary educational opportunities, and considering social and residential needs
(Taylor, 2009). And, compared to parents of students with other disabilities, parents of
youth with ASD might experience relatively greater stress. Consider that youth with ASD
are more likely than students with other disabilities to have a variety of support needs,
and are the least likely to have no support needs (Shogren & Plotner, 2012). At the same
time, youth with ASD exiting high school face a “steep decline in service receipt”
(Shattuck, Wagner, Narendorf, Sterzing, & Hensley, 2011, p. 143), and are the least
likely to participate in postsecondary employment or education (Shattuck et al., 2012).
Thus, compared to parents of students with other disabilities, parents of students
with ASD consider transition planning to be the least useful (Shogren & Plotner, 2012).
Within the context of this stressful period, it seems likely that parents view the transition
planning process as a way to address some of the aforementioned challenges for their son
or daughter with ASD. Though educators and researchers may consider student
participation in transition planning as an opportunity for students to develop self-
71
determination skills, it might be the case that parents perceive the transition planning
process differently. Instead, parents may primarily consider the transition planning
meeting to be a challenging, often frustrating experience in which they must actively
advocate for needed supports and services (Hetherington et al., 2010). These potential
differences in perspective point to the need for greater communication between teachers
and parents about transition planning (Lehmann, Bassett, & Sands, 1999).
Implications for Research and Practice
First, this study has revealed that instruction in transition planning is not
significantly related to the attendance or active participation of students with ASD. This
contrasts with findings of Wagner et al. (2012) that instruction in transition planning is
positively related to student attendance and participation among students with disabilities
overall. Among the students included in this sample, almost 69% of students received
instruction in transition planning; this is similar to other studies based on NLTS2 data
that report 71% of students with ASD receive this type of instruction (Cameto et al.,
2006; Shogren & Plotner, 2012). Though a large percentage of students with ASD
receive such instruction, it does not appear to affect their participation outcomes.
As noted by Shogren and Plotner (2012), research about the nature of this
instruction is needed. Further, research is needed on the effectiveness of instruction in
transition planning among students with ASD. Improved instruction and interventions to
promote student participation in transition planning might be guided by this study’s
findings. Notably, student attendance and active participation in transition planning are
related to higher student functioning (e.g., higher expressive communication and self-

72
advocacy skills; greater percentage of time spent in general education settings). This
finding has implications for both research and practice.
Regarding research, future studies should focus on improving attendance and
participation among students with lower expressive communication skills and self-
advocacy skills. Interventions should incorporate research-based methods to support the
communication of students with ASD in the transition planning context (e.g., picture
exchange communication system [PECS]). Additionally, researchers might employ
currently available interventions among youth with ASD (e.g., Self-Directed IEP; Arndt,
Konrad, & Test, 2006), or adapt intervention packages to meet the individual needs of
students. For example, Held, Thoma, and Thomas (2006) described the process one
teacher used to facilitate self-determined transition planning with a high school student
with ASD. The Next S.T.E.P. curriculum was used in conjunction with strategies that
capitalized on the student’s particular interests, and with technology that facilitated his
participation.
Regarding practice, teachers and parents alike should work to ensure that students
with lower expressive communication and self-advocacy skills are afforded the
opportunity and support needed to attend and participate in their own transition planning.
Because students with lower communication skills are likely to spend a greater
percentage of time in self-contained settings, instruction in transition planning might be
more easily incorporated into their school day (compared to peers who spend a greater
percentage of time in general education settings). However, for teachers to incorporate
effective transition planning, they will need appropriate training and support from
administrators.
73
Beyond focusing on students with lower expressive communication and self-
advocacy skills, researchers and practitioners should focus on encouraging more active
participation in transition planning among African American students. In their study of
students with disabilities overall, Wagner and colleagues (2012) found that African
American students were less likely to participate actively in transition planning
(compared to Caucasian students). The same result was found in this sample of students
with ASD. In addition to lower participation rates in transition planning, African
American students with ASD also experience worse post-school outcomes—lower rates
of involvement in postsecondary education and employment, and a greater risk of
receiving no services after exiting high school (Shattuck et al., 2012; Shattuck et al.,
2011). These findings together document the need for a focus on improving the transition
out of high school for African American youth with ASD.
In addition to implications related to the students themselves, these findings also
have implications related to the parents of students with ASD. This study has shown that
parent involvement influences the involvement of their adolescent children in the
transition planning process. In both Regression A and Regression B, the more frequently
students had discussions at home about post-school plans, the more likely students were
to attend and actively participate in transition planning meetings. Given that these
discussions are so influential, schools and support groups for families of children with
ASD might develop resources that encourage and assist parents to broach these
conversations more often. Additionally, researchers and practitioners should consider
how best to partner with parents in the transition planning process (and particularly with
regard to student involvement), so that efforts at home and school work in tandem.
74
Limitations
This study is the first to investigate the predictors of attendance and participation
in transition planning among students with ASD. However, several limitations must be
noted. First, participants who were missing data on the outcome and key predictor
variables were excluded. Thus, the final sample was more likely to include students who
were Caucasian, higher-income, and higher functioning. Despite this limitation, the
excluded participants and the final sample did not differ on the outcome variable and
most predictors. A related limitation was that several variables were missing data for over
20% of the sample, and were therefore excluded.
A second set of limitations relates to the questions included in the NLTS2
surveys. For example, the only question related to instruction in transition planning was
dichotomous: whether the student received such instruction. Though important,
additional items regarding this instruction would have been informative (e.g., frequency
and length of instruction). Ultimately, this study was constrained to the focus and
phrasing of items included in the NLTS2 surveys.
A final set of limitations concerns the sources of these data. Because teachers
and parents were the source of all ratings of student skills and behavior, it is unclear
whether observational data would differ from these ratings. Likewise, it is unclear
whether students would rate their own skills and behaviors differently. Though NLTS2
included questions for students, the questions of interest were missing so much data that
their inclusion was not feasible. For example, one question asked students whether they
wanted to be more involved in IEP decisions; unfortunately, data were only available for

75
25% of the final sample. In future research, student perspectives would add much to our
current understanding of the role that students play in their own transition planning.
Despite these limitations, analysis of the NLTS2 data has allowed insight into the
various factors that predict attendance and active participation in transition planning
among over 300 students with ASD. Due to the lack of research in this area among
students with ASD, these findings can help practitioners and researchers target the
students most in need of intervention, and can inform the instruction provided to students
with ASD. Perhaps more importantly, this study revealed the influential role parents play
in the lives of their transition-age children. By taking a holistic approach, practitioners
and researchers might better support the transition out of high school for students with
ASD and their families.
76
REFERENCES
Arndt, S. A., Konrad, M., & Test, D. W. (2006). Effects of the “Self-Directed IEP” on student participation in planning meetings. Remedial and Special Education, 27,
194-207. Baer, R. M., Flexer, R. W., Beck, S., Amstutz, N., Hoffman, L., Brothers, J., Stelzer, D.,
& Zechman, C. (2003). A collaborative follow-up study on transition service utilization and post-school outcomes. Career Development for Exceptional
Individuals, 26, 7-25. Cameto, R., Levine, P., & Wagner, M. (2004). Transition planning for students with
disabilities. A special topic report from the National Longitudinal Transition
Study-2 (NLTS2). Menlo Park, CA: SRI International. Carlson, C., Uppal, S., & Prosser, E. C. (2000). Ethnic differences in processes
contributing to the self-esteem of early adolescent girls. The Journal of Early
Adolescence, 20, 44-67. Carter, E. W., Austin, D., & Trainor, A. A. (2012). Predictors of postschool employment
outcomes for young adults with severe disabilities. Journal of Disability Policy
Studies, 23, 50-63. Cohen, J., Cohen, P., West, S. G., & Aiken, L. S. (2003). Applied multiple
regression /correlation analysis for the behavioral sciences.(3rd ed.). Mahwah, NJ: Erlbaum.
Davis-Kean, P. E. (2005). The influence of parent education and family income on child
achievement: The indirect role of parental expectations and the home environment. Journal of Family Psychology, 19, 294-304.
deFur, S. (2003). IEP transition planning: From compliance to quality. Exceptionality, 11,
115- 128. Eaves, L. C., & Ho, H. H. (2008). Young adult outcomes of autism spectrum disorders.
Journal of Autism and Developmental Disorders, 38, 739-747. Grigal, M., Test, D., Beattie, J., & Wood, W. (1997). An evaluation of transition
components of IEPs. Exceptional Children, 63, 357-372. Griffin, M. M. (2011). Promoting IEP participation: Effects of interventions,
considerations for CLD students. Career Development for Exceptional
Individuals, 34, 153–164.

77
Harrell, F. E., (2001). Regression modeling strategies. New York, NY: Springer. Held, M. F., Thoma, C. A., & Thomas, K. “The John Jones Show:” How one teacher
facilitated self-determined transition planning for a young man with autism. Focus on Autism and Other Developmental Disabilities, 19, 177-188.
Hetherington, S. A., Durant-Jones, L., Johnson, K., Nolan, K., Smith, E., Taylor-Brown, S., & Tuttle, J. (2010). The lived experiences of adolescents with disabilities and their parents in transition planning. Focus on Autism and Other Developmental
Disabilities, 25, 163-172.
Hickman, C. W., Greenwood, G., & Miller, M. D. (1995). High school parent involvement: Relationships with achievement, grade level, SES, and gender. Journal of Research and Development in Education, 28, 125-134.
Hill, N. E., & Tyson, D. F. (2009). Parental involvement in middle school: A meta-analytic assessment of the strategies that promote achievement. Developmental
Psychology, 45, 740-763.
Howlin, P., Goode, S., Hutton, J., & Rutter, M. (2004). Adult outcome for children with autism. Journal of Child Psychology and Psychiatry, 45, 212-229.
Hughes, C. & Avoke, S.K. (2010). The elephant in the room: Poverty, disability, and employment. Research and Practice for Persons with Severe Disabilities, 35, 5-14.
Individuals with Disabilities Education Act of 1990 (IDEA), P. L. 101-476, § 602a, 20
U.S.C. 1401. Javitz, H. & Wagner, M. (2005). Analysis of potential bias in the Wave 1 and Wave 2
respondents to the National Longitudinal Transition Study-2 (NLTS2). Menlo Park, CA: SRI International.
Korbel, D. M., McGuire, J. M., Benerjee, M., & Saunders, S. A. (2011). Transition
strategies to ensure active student engagement. New Directions for Student
Services, 2011, 35–46. Lehmann, J. P., Bassett, D. S., & Sands, D. J. (1999). Students’ participation in
transition-related activities: A qualitative study. Remedial and Special Education,
20, 160-169. Lovitt, T. C., Cushing, S. S., & Stump, C. S. (1994). High school students rate their IEPs:
Low opinions and lack of ownership. Intervention in School and Clinic, 30, 34-37.
78
Magnuson, K. (2007). Maternal education and children’s academic achievement during middle childhood. Developmental Psychology, 43, 1497–1512.
Martin, J. E., Marshall, L. H., & Sale, P. (2004). A 3-year study of middle, junior high, and high school IEP meetings. Exceptional Children, 70, 285-297.
Martin, J. E., Van Dycke, J. L., Greene, B. A., Gardner, J. E., Christensen, W. R., Woods,
L. L., & Lovett, D. L. (2006). Direct observation of teacher-directed IEP meetings: Establishing the need for student IEP meeting instruction. Exceptional
Children, 72, 187-200. Mason, C., Field, S., & Sawilowsky, S. (2004). Implementation of self-determination
activities and student participation in IEPs. Exceptional Children, 70, 441-451. Menard, S. W. (2002). Applied logistic regression analysis. Newbury Park, CA: Sage. Morningstar, M. E., Turnbull, A. P., & Turnbull, H. R. (1995). What do students with
disabilities tell us about the importance of family involvement in the transition from school to adult life? Exceptional Children, 62, 249-260.
Newman, L., Wagner, M., Cameto, R., & Knokey, A. M. (2009). The Post-High School
Outcomes of Youth with Disabilities up to 4 years after High School. A Report of
Findings from the National Longitudinal Transition Study-2 (NLTS2). Menlo Park, CA: SRI International.
Rabren, K., Dunn, C., & Chambers, D. (2002). Predictors of post-high school
employment among young adults with disabilities. Career Development for
Exceptional Individuals, 25, 25-40. Shattuck, P. T., Narendorf, S. C., Cooper, B., Sterzing, P. R., Wagner, M., & Taylor, J. L.
(2012). Postsecondary education and employment among youth with an autism spectrum disorder. Pediatrics, 129, 1042-1049.
Shattuck, P. T., Wagner, M., Narendorf, S. C., Sterzing, P. R., & Hensley, M. (2011).
Post-high school service use among young adults with an autism spectrum disorder. Archives of Pediatrics & Adolescent Medicine, 165, 141-146.
Shogren, K. A., & Plotner, A. J. (2012). Transition planning for students with intellectual
disability, autism, or other disabilities: Data from the National Longitudinal Transition Study-2. Intellectual and Developmental Disabilities, 50, 16-30.
Tager-Flusberg, H., Paul, R., & Lord, C. (2005). Language and communication in autism.
In F. R. Volkmar, R. Paul, A. Klin, & D. J. Cohen (Eds.), Handbook of autism
and pervasive developmental disorders (3rd ed.) (pp. 335–364). Hoboken, NJ: Wiley and Sons.
79
Taylor, J. L. (2009). The transition out of high school and into adulthood for individuals with autism and for their families. International Review of Research in Mental
Retardation, 38, 1–32. Taylor, J. L., & Seltzer, M. M. (2011a). Changes in the autism behavioral phenotype
during the transition to adulthood. Journal of Autism and Developmental
Disorders, 40, 1431-1446. Taylor, J. L., & Seltzer, M. M. (2011b). Changes in the mother-child relationship during
the transition to adulthood for youth with autism spectrum disorders. Journal of
Autism and Developmental Disorders, 41, 1397-1410. Test, D. W., Mason, C., Hughes, C., Konrad, M., Neale, M., & Wood, W. M. (2004).
Student involvement in individualized education program meetings. Exceptional
Children, 70, 391-412. Trach, J. S., & Shelden, D. L. (2000). Meeting attendance and transition outcomes as
reflected in students’ IEPs. In D.R. Johnson & E. J. Emmanuel (Eds.), Issues
influencing the future of transition programs and services in the United States. (pp. 137-152). Minneapolis, MN: University of Minnesota.
Volkmar, F. R., & Klin, A. (2005). Issues in the classification of autism, related
conditions. In F. R. Volkmar, R. Paul, A. Klin, & D. J. Cohen (Eds.), Handbook
of autism and pervasive developmental disorders (3rd ed.) (pp. 5-41). Hoboken, NJ: Wiley and Sons.
Wagner, M., Marder, C., Blackorby, J., Cameto, R., Newman, L., Levine, P., & Davies-
Mercier, E. (with Chorost, M., Garza, N., Guzman, A., & Sumi, C.). (2003). The
achievements of youth with disabilities during secondary school. Menlo Park, CA: SRI International.
Wagner, M., Newman, L., Cameto, R., Javitz, H., & Valdes, K. (2012). A national
picture of parent and youth participation in IEP and transition planning meetings.
Journal of Disability Policy Studies. doi: 10.1177/1044207311425384 Watts-Taffe, S., & Truscott, D. M. (2000). Using what we know about language and
literacy development for ESL students in the mainstream classroom. Language
Arts, 77, 258-265. Wehmeyer, M. L., & Lawrence, M. (1995). Whose future is it anyway? Promoting
student involvement in transition planning. Career Development for Exceptional
Individuals, 18, 69-83. Wehmeyer, M. L., & Sands, D. J. (1998). Making it happen: Student involvement in
education planning, decision-making and instruction. Baltimore, MD: Brookes.