participation. what are all of the ways you can participate in politics?
Post on 19-Dec-2015
214 views
TRANSCRIPT

Participation
What are all of the ways you can participate in politics?
Why is participation important?
Why don’t some people participate?

Probability of voting = Benefit - Cost

Voter Turnout, 2004 & 2008
72 71
89 89.6
64 63.6
0
10
20
30
40
50
60
70
80
90
Percent Registered % Registered whovoted
Percent Voted (ofeligible population)
What makes a person more likely to vote?
Higher Education Why? More interest in politics (higher
benefit) More background information to
understand politics, and skills to get through the registration and voting process (lower costs)
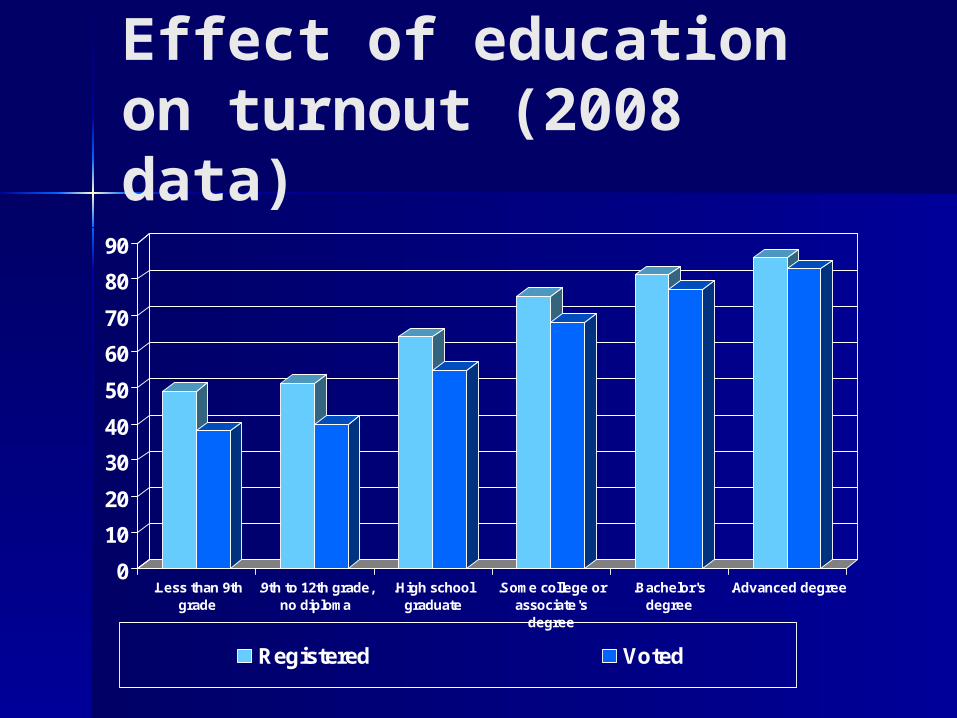
Effect of education on turnout (2008 data)
0
10
20
30
40
50
60
70
80
90
.Less than 9thgrade
.9th to 12th grade,no diploma
.High schoolgraduate
.Some college orassociate's
degree
.Bachelor'sdegree
.Advanced degree
Registered Voted
What makes a person more likely to vote?
Higher Education Higher Income Why? Free time (lower costs) Stake in community (taxes etc.—
higher benefit)
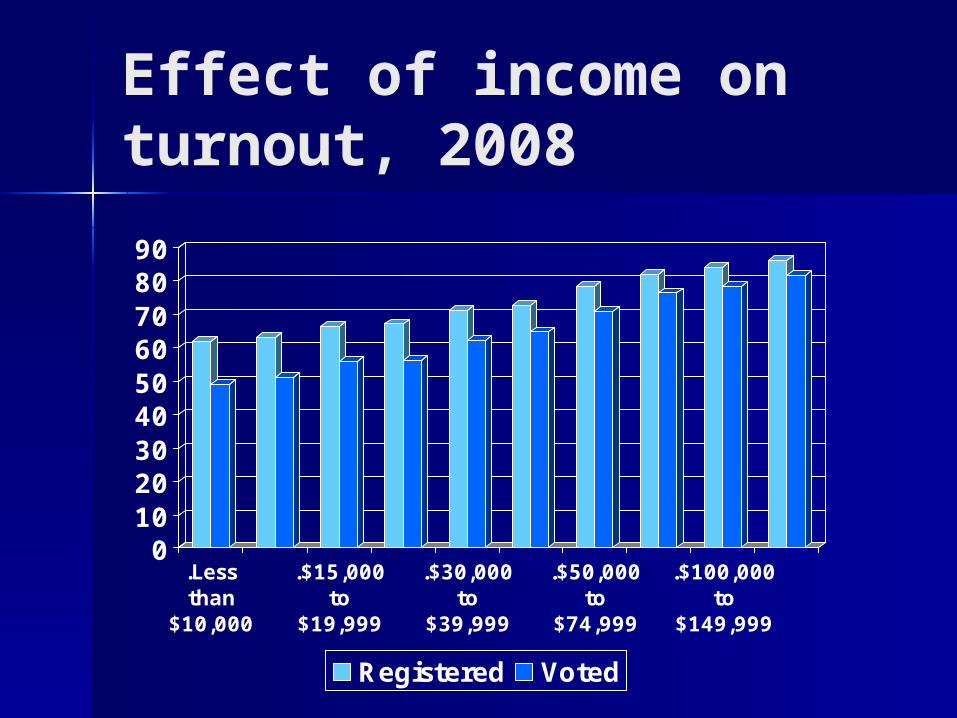
Effect of income on turnout, 2008
0102030405060708090
.Lessthan
$10,000
.$15,000to
$19,999
.$30,000to
$39,999
.$50,000to
$74,999
.$100,000to
$149,999
Registered Voted

Effect of race on turnout? (2008)
0
10
20
30
40
50
60
70
80
White Black Hispanic Asian
Registered Voted
What makes a person more likely to vote?
Higher Education Higher Income / more resources Lack of language/cultural barriers
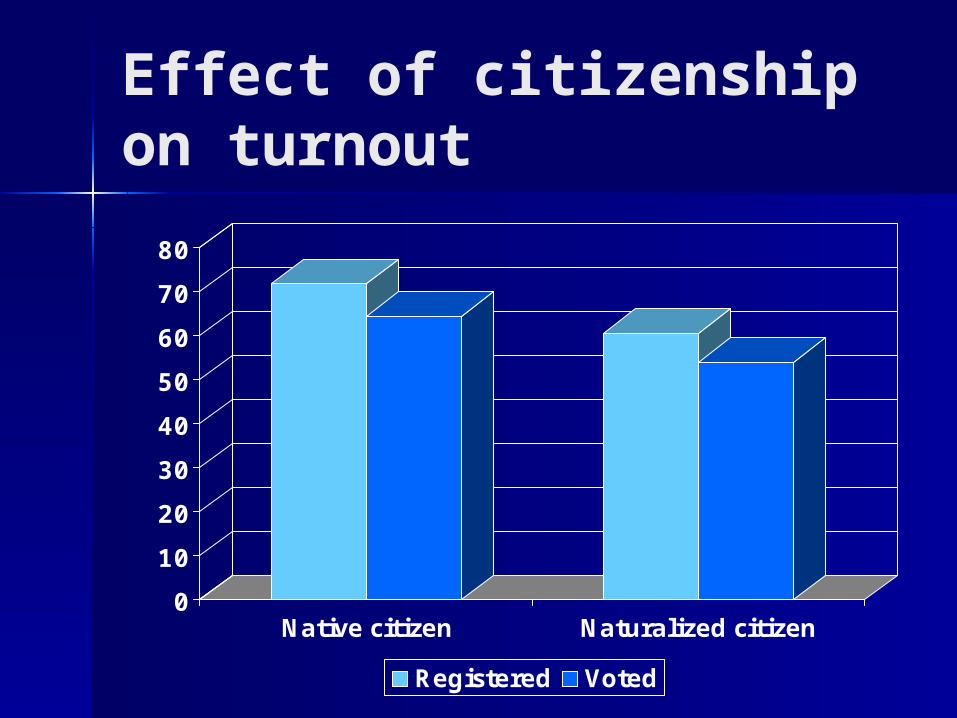
Effect of citizenship on turnout
0
10
20
30
40
50
60
70
80
Native citizen Naturalized citizen
Registered Voted

What makes a person more likely to vote?
Higher Education Higher Income / more resources Lack of language/cultural barriers Easy registration

Effect of Registration laws on turnout (2004 data)
0
10
20
30
40
50
60
70
80
Oregon (vote by mail) Minnesota (same dayregistration)
National average
% Voted
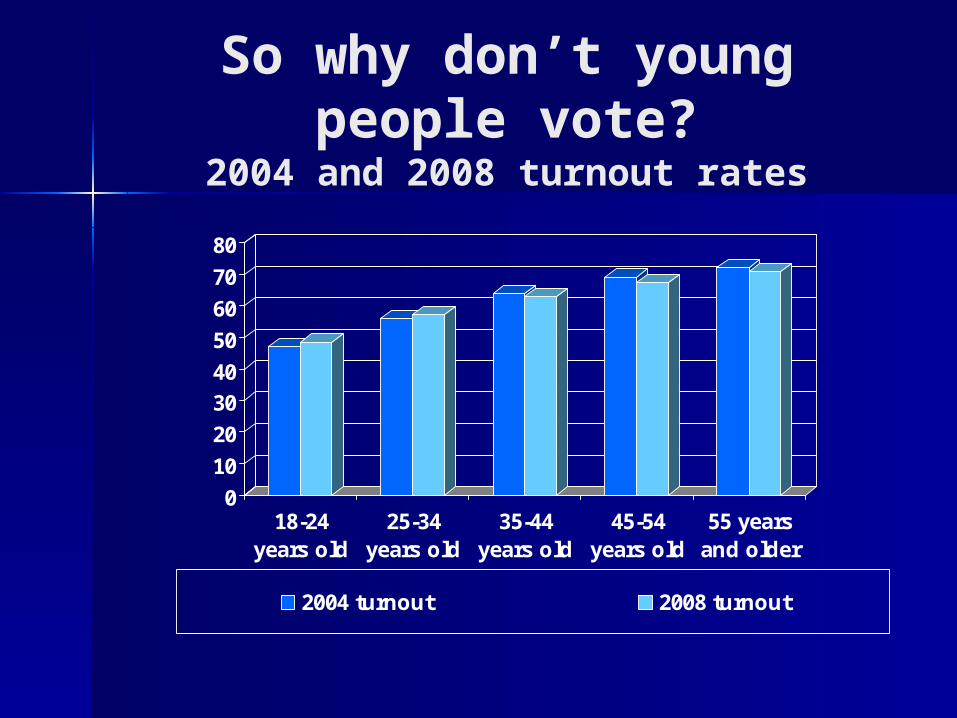
So why don’t young people vote?
2004 and 2008 turnout rates
0
10
20
30
40
50
60
70
80
18-24years old
25-34years old
35-44years old
45-54years old
55 yearsand older
2004 turnout 2008 turnout

Newspaper readership, 2004
0
10
20
30
40
50
60
70
80
1957 1967 1975 1978 1983 1986 1988 1990 1993 1996 2000 2004
Percent reading a newspaper every day of the week
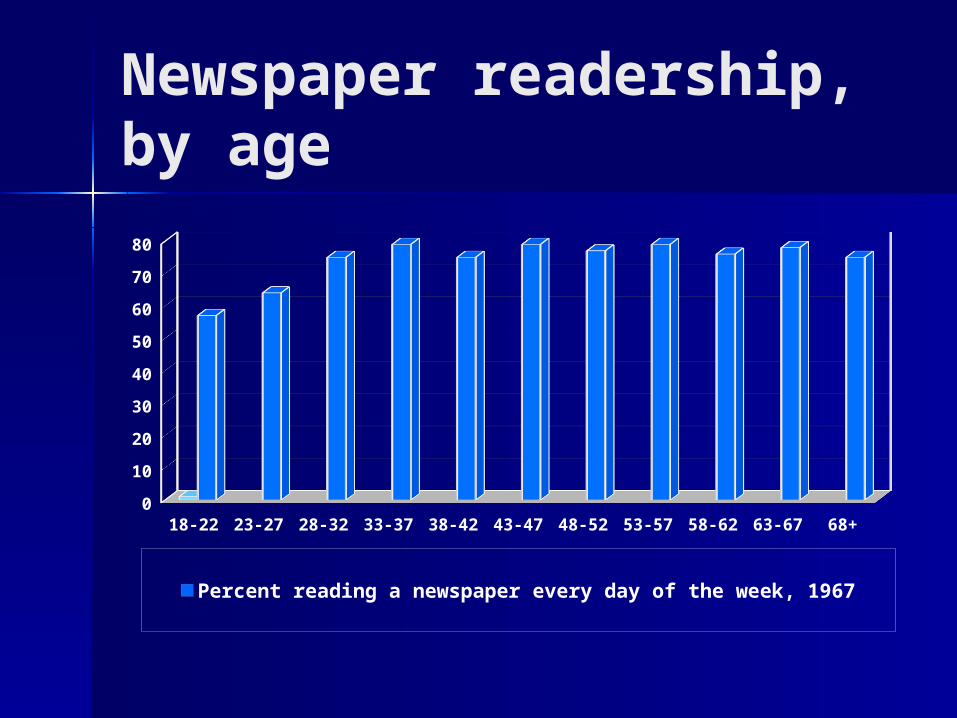
Newspaper readership, by age
18-22 23-27 28-32 33-37 38-42 43-47 48-52 53-57 58-62 63-67 68+0
10
20
30
40
50
60
70
80
Percent reading a newspaper every day of the week, 1967
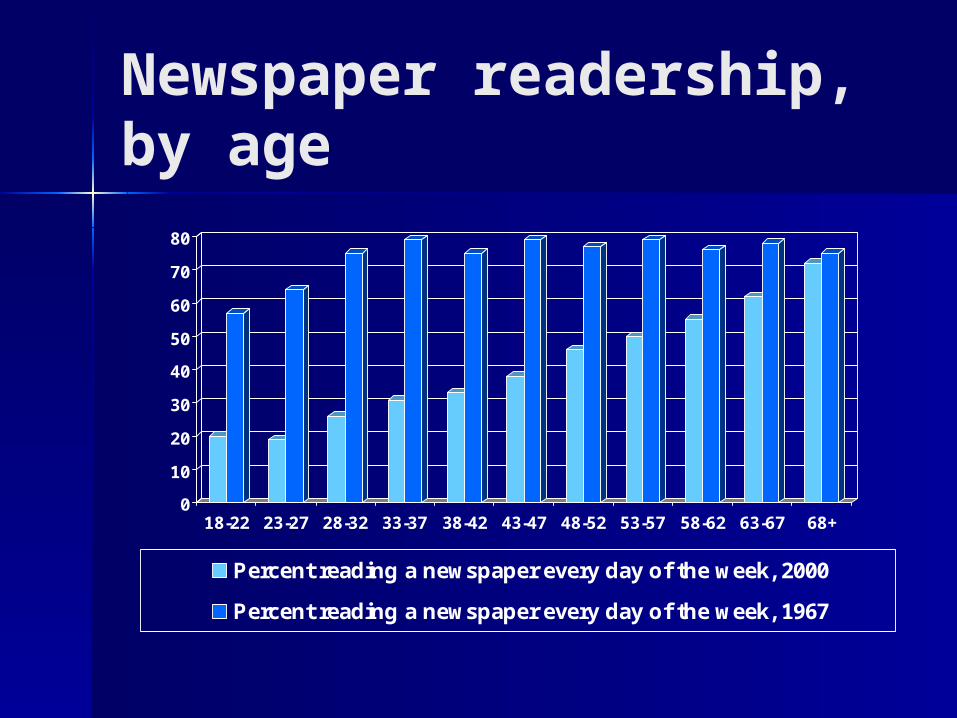
Newspaper readership, by age
0
10
20
30
40
50
60
70
80
18-22 23-27 28-32 33-37 38-42 43-47 48-52 53-57 58-62 63-67 68+
Percent reading a newspaper every day of the week, 2000
Percent reading a newspaper every day of the week, 1967

What makes a person more likely to vote?
Higher Education Higher Income / more resources Lack of language/cultural barriers Easy registration Interest Social Connectedness

What makes a person more likely to vote?
Social connectedness
Why? Learn civic skills in a group (lower
costs) Feel responsibility to a particular
community (higher benefit) Group norms (higher social benefit)
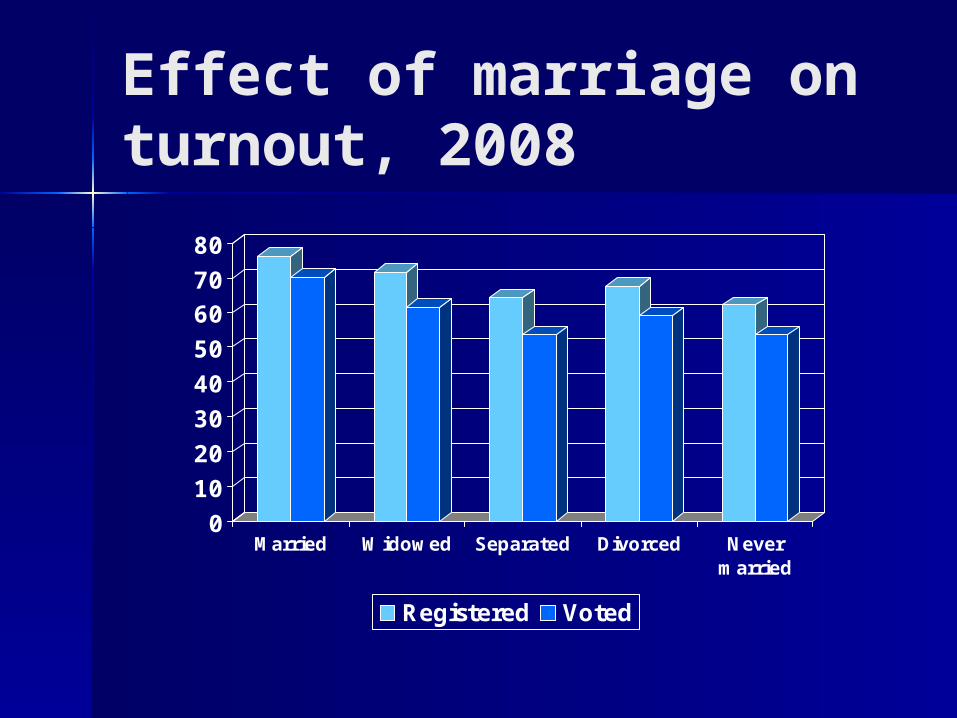
Effect of marriage on turnout, 2008
0
10
20
30
40
50
6070
80
Married Widowed Separated Divorced Nevermarried
Registered Voted

Effect of residency on turnout
0102030405060708090
..Lessthan 1month
..1 to 6months
..7 to 11months
..1 to 2years
..3 to 4years
..5 yearsor longer
Registered Voted

Effect of home ownership on turnout
0
10
20
30
40
50
60
70
80
Registered Voted
Renter Homeowner
What does a healthy democracy really need?
Do you think the system will be biased against people who don’t participate?
So who might the system be biased against?
Does that make for a healthy democracy?
Or maybe democracy can be enhanced through other kinds of participation…

What is social capital?
The norms and trust that develop from interpersonal social relationships
A byproduct of other activities, not something created on its own
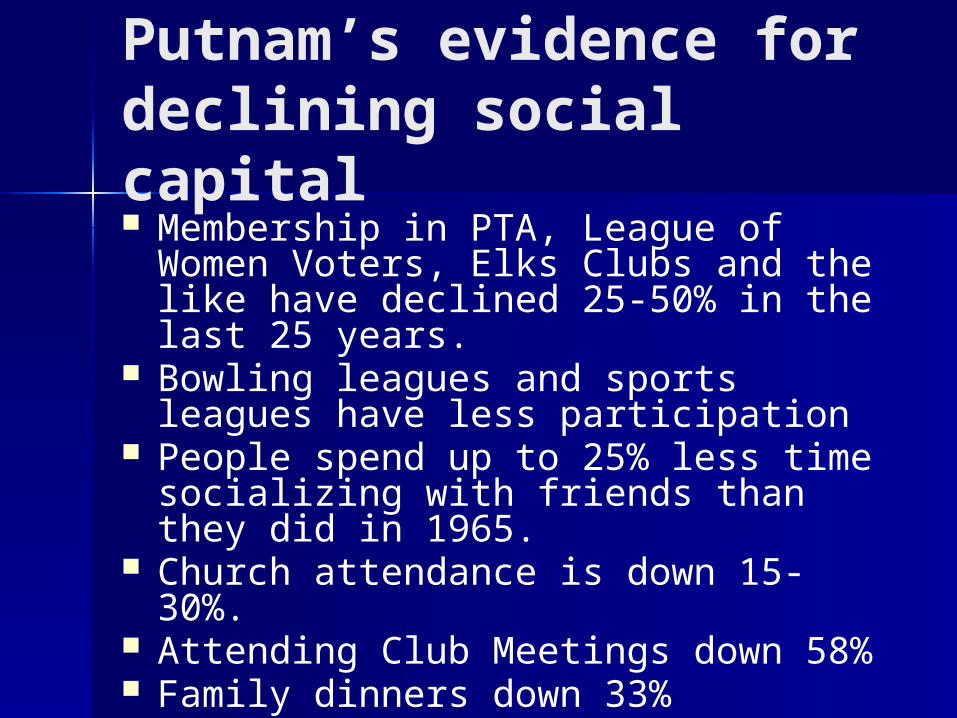
Putnam’s evidence for declining social capital Membership in PTA, League of Women
Voters, Elks Clubs and the like have declined 25-50% in the last 25 years.
Bowling leagues and sports leagues have less participation
People spend up to 25% less time socializing with friends than they did in 1965.
Church attendance is down 15-30%. Attending Club Meetings down 58% Family dinners down 33% Having friends over down 45%
Why the decline of social capital?

What are ways we can build social capital?

What do we really need if we want more people to participate?
Do we want more people to participate??