participatory impact assessment: africa community
TRANSCRIPT

Strengthening the humanity and dignity of people in crisis through knowledge and practice
Participatory Impact Assessment:
Africa Community Resilience ProgrammeTsaeda Amba Woreda, Eastern Tigray, EthiopiaResearch Program on Livelihoods Change Over Time — Final Report
Study Team:Daniel Maxwell, Jennifer Coates, Girum Tadesse, Fayera Abdissa, Shimelis Hailu, Eyasu Shishigu, Woldegebrial Zeweld Nugussie, Kinfe Mezgebe, Abraha Gebrekiros
DECEMBER 2010
©2010 Feinstein International Center. All Rights Reserved.
Fair use of this copyrighted material includes its use for non-commercial educational purposes, such as teaching, scholarship, research, criticism, commentary, and news reporting. Unless otherwise noted, those who wish to reproduce text and image fi les from this publication for such uses may do so without the Feinstein Interna-tional Center’s express permission. However, all commercial use of this material and/or reproduction that alters its meaning or intent, without the express permission of the Feinstein International Center, is prohibited.
Feinstein International CenterTufts University200 Boston Ave., Suite 4800Medford, MA 02155USAtel: +1 617.627.3423fax: +1 617.627.3428fi c.tufts.edu
Feinstein International CenterAddis Ababa Offi ceP.O. Box 1078Addis AbabaEthiopiatel: +251 (0)11 651 8619 fax: +251 (0)11 651 6333fi c.tufts.edu
Cover Photos:
An agriculturalist inspects maize growing in highly eroded fi eld in Irob Mountains, on the escarpment between Eastern Tigray and the Dalul Depression. Maize crops here fail three years out of fi ve.

contents
December 2010 • Participatory Impact Assessment
i
Terminology . . . . . . . . . . . . . . . . . . . . . . . . . . . . . . . . . . . . . . . iv
Executive Summary . . . . . . . . . . . . . . . . . . . . . . . . . . . . . . . . . . .v
Section 1. Introduction. . . . . . . . . . . . . . . . . . . . . . . . . . . . . 1
Disaster Reduction in Ethiopia . . . . . . . . . . . . . . . . . . . . . . . . . . . .1
The Africa Community Resilience Project . . . . . . . . . . . . . . . . . . . .1
Update on the ACRP Program in Tsaeda Amba . . . . . . . . . . . . . . .2
The LCOT program . . . . . . . . . . . . . . . . . . . . . . . . . . . . . . . . . . .2
Objectives of the study . . . . . . . . . . . . . . . . . . . . . . . . . . . . . . . .2
Research questions . . . . . . . . . . . . . . . . . . . . . . . . . . . . . . . . . . .2
Objectives of the 2010 Participatory Impact Assessment . . . . . . . . . . .2
Field methods . . . . . . . . . . . . . . . . . . . . . . . . . . . . . . . . . . . . . . . .3
Sampling . . . . . . . . . . . . . . . . . . . . . . . . . . . . . . . . . . . . . . . . .3
Limitations of the study . . . . . . . . . . . . . . . . . . . . . . . . . . . . . . .3
Section 2. Livelihoods Change in Tsaeda Amba, 2009-2010 . . . . 6
Livelihoods in Tsaeda Amba woreda . . . . . . . . . . . . . . . . . . . . . . . .6
Livelihood hazards in Tsaeda Amba . . . . . . . . . . . . . . . . . . . . . . .6
Ranking main hazards and changes in perception, 2009–2010 . . . . . . .7
Livelihood zones and characteristics of livelihood systems. . . . . . . . . .8
Assessment of livelihood conditions 2009–2010 . . . . . . . . . . . . . . . . .9
Wealth groups and changes in wealth groups . . . . . . . . . . . . . . . . .9
Livelihoods changes, 2009–2010 . . . . . . . . . . . . . . . . . . . . . . . . . 14
Thresholds for overcoming chronic vulnerability . . . . . . . . . . . . . . . 17
Discussion of participatory livelihoods assessment . . . . . . . . . . . . . . 18

Feinstein International Center
ii
contentsComparison with results of household survey . . . . . . . . . . . . . . . . . 19
New constraints or hazards . . . . . . . . . . . . . . . . . . . . . . . . . . . . 21
Section 3. The Africa Community Resilience Project . . . . . . . 22
Description of ACRP . . . . . . . . . . . . . . . . . . . . . . . . . . . . . . . . . . 22
ACRP Implementation . . . . . . . . . . . . . . . . . . . . . . . . . . . . . . . 22
Strengths and constraints to implementation . . . . . . . . . . . . . . . . 22
Outcomes analyzed . . . . . . . . . . . . . . . . . . . . . . . . . . . . . . . . . 23
The Kebele Disaster Preparedness Committees (KDPCs) . . . . . . . . . 23
KDPC roles and responsibilities . . . . . . . . . . . . . . . . . . . . . . . . . 23
KDPC capacity . . . . . . . . . . . . . . . . . . . . . . . . . . . . . . . . . . . . 24
Section 4. Conclusions of the Two-Year study . . . . . . . . . . . . 27
Objectives of the study . . . . . . . . . . . . . . . . . . . . . . . . . . . . . . . . 27
Institutional factors infl uencing livelihoods . . . . . . . . . . . . . . . . . 27
Changes in key national policies . . . . . . . . . . . . . . . . . . . . . . . . . 28
Changes . . . . . . . . . . . . . . . . . . . . . . . . . . . . . . . . . . . . . . . . . 29
Recommendations to ACRP . . . . . . . . . . . . . . . . . . . . . . . . . . . . . 29
References . . . . . . . . . . . . . . . . . . . . . . . . . . . . . . . . . . . . 32
Annex 1: A framework for DRR analysis and programming . . 33
Annex 2: Statistical results of second household surveyround in June 2010 and comparison with 2009 . . . . . . . . . . . 34

December 2010 • Participatory Impact Assessment
iii
Acknowledgements
The research team consisted of individuals from World Vision (Girum Tadesse, Eyasu Shishigu and Shimelis Hailu), Mekelle University (Wolde Gebreal Zewold), Tigray Agricultural Research Institute (Kinfe Mezgebe) and Tufts University (Dan Maxwell
and Fayera Abdissa). The team would like to thank many other individuals and organizations for their support of the study. These include, fi rst and foremost, Francis Dube of the World Vision Africa Regional Offi ce; members of the World Vision Ethiopia National Offi ce—Shimelis Abate, Dedebe Taye, Taye Yadessa and Saba Yosef; staff of the Mekelle Program Of-fi ce—Endale Eshete and Haile Selassie Desta. We would especially like to thank the Tsaeda Amba ADP staff—Melesse Worku (ADP manager), Alemu Tolera (project coordinator), and other members of the staff as well as the whole ADP team at Tsaeda Amba.
Many members of the Tsaeda Amba staff were also members of the fi eld team. This included Samuel Getachew, Tesfay Gebrekristos Hagos, Teame Kahsay Teklehalmanot, and Yirgalem Negash Asu. The authors constituted the other members of the fi eld team.
We would especially like to thank Mekonnen Tesfay and Mulu Gebremedhin—members of staff from Government Departments of the woreda headquarters in Freweini. They joined the fi eldwork team for the duration of the study and organized community to fully participate in the research assessment. We would also like to thank various members of staff of woreda of-fi ces: the woreda chairman and vice chairman and other members of woreda staff interviewed.
We would like to thank the Dean of the College of Dryland Agriculture and Natural Re-sources at Mekelle University, Dr. Girmay Tesfay, who lent enormous support to the study and helped us identify two able members of the team as research assistants. We would also like to thank the President of Mekelle University, Dr. Mitiku Haile, for his support and for mak-ing the connection with the College of Dryland Agriculture. We would also like to thank staff at REST who have been supportive of the study throughout.
At the Feinstein International Center offi ce in Addis Ababa we would like to thank Andy Catley, John Burns, Yacob Aklilu, Berhanu Admassu, Hirut Demissie, and Fasil Yemane. At the home offi ce in Medford, we would like to thank Peter Walker, Anita Robbins, Rosa Pendenza, Ann O’Brien and Beth O’Leary for their support to the study. Lastly, we would like to thank our families and the many people in Tsaeda Amba who shared with generously their knowledge, their time, and their hospitality.
The Research TeamSeptember 2010
Feinstein International Center
iv
Acronyms
ACRP . . . . . Africa Community Resilience ProjectADP . . . . . . Area Development Program (World Vision)CDPC . . . . . Community Disaster Preparedness CommitteeCFW . . . . . . Cash for workCMAM . . . . Community management of acute malnutritionDPPA . . . . . Disaster Preparedness and Prevention Agency (Government of Ethiopia)DRM . . . . . . Disaster risk managementDRR . . . . . . Disaster risk reductionEPRDF . . . . Ethiopian People’s Revolutionary Democratic FrontETB . . . . . . . Ethiopian birr—national unit of currencyEW . . . . . . . Early warningFFW . . . . . . Food for workGOE . . . . . . Government of EthiopiaHARITA . . . Horn of Africa Risk Transfer for AdaptationHH . . . . . . . HouseholdHHH . . . . . . Head of HouseholdHIV/AIDS . Human Immunodefi ciency Virus/Acquired Immune Defi ciency SyndromeIRB . . . . . . . Institutional Review BoardKDPC . . . . . Kebele Disaster Preparedness CommitteeLCOT . . . . . Livelihoods Change over Time (research program)LEAP . . . . . . Livelihoods Early Assistance ProgramLIU . . . . . . . Livelihoods Integration Unit (DPPA)NGO . . . . . . Non-governmental organizationPRA. . . . . . . Participatory rural appraisal or participatory rapid AppraisalPSNP . . . . . . Productive Safety Net ProgramREST . . . . . Relief Society of TigraySMART . . . . Specifi c, measurable, attainable, relevant and time-boundUN . . . . . . . . United NationsWFP . . . . . . World Food ProgrammeWVI . . . . . . . World Vision International
Terminology
Several terms related to local administration are used throughout this report. These include:Kebele . . . The smallest administrative unit in Ethiopia, equivalent to a ward or townshipKushet . . A subdivision of a kebele, equivalent to a villageWoreda . . The next larger administrative unit, equivalent to a districtTimad . . . One fourth of a hectare, literally a day’s (eight hours’) plowing activities done with
a pair of oxenUqub . . . . A group of people that come together and contribute equal amounts of money
within in a defi ned time (e.g., month) and give the total sum to one member to use. This will continue turn by turn until it enriches all.
Idir . . . . . Idir is a social gathering to contribute money monthly and help members during funerals. In recent times, the self-help nature of Idir has sometimes extended beyond the cost of funerals.
December 2010 • Participatory Impact Assessment
v
Executive Summary
Disaster Risk Reduction (DRR) programs encompass many different kinds of activi-ties, but share the fundamental objective of
enhancing the capacity of vulnerable communities to identify, reduce and manage risk, whether it be at the local, regional or national level. Generally outlined in the International Strategy for Disaster Reduction and in the Hyogo Framework of Ac-tion (UNISDR 2005), DRR includes improving governance and early warning, building a culture of resilience, reducing underlying risk factors and strengthening disaster preparedness.
Ethiopia is one of the most food-insecure coun-tries in the world, but only recently has the food security problem begun to be understood in terms of a complete analysis of livelihoods, rather than simply a food supply problem. Food insecurity has long been dealt with as an issue of humanitarian response, but it clearly is an underlying develop-mental issue. Beginning in 2005, the Productive Safety Net Program has been implemented to ad-dress the issue of chronic food insecurity on a pro-grammatic basis (i.e., not on the basis of annual assessments, humanitarian appeals, and emergency response). Concurrently, the issue of evolving away from a disaster-response approach towards a disas-ter risk management approach has been the policy of the government of Ethiopia.
The Africa Community Resilience Project (ACRP) was designed by World Vision International in line with the Hyogo Framework for Action as a blue-print to creating resilient communities. The project is research-based and will build capacity for im-proving resilience through disaster risk manage-ment programming and mainstreaming. The proj-ect will also defi ne key indicators of resilience, and seek to infl uence policies and programming aimed at supporting disaster risk reduction. Tsaeda Amba woreda in Eastern Tigray was selected as the site for ACRP, and Tufts University was engaged to con-
duct the research side of the program. This study sought to understand baseline conditions related to both the implementation of the ACRP program, and to the broader question of livelihood change in response to repeated hazards or protracted crises. This study was based on participatory approaches to research. A household survey within the ACRP project area was conducted earlier in 2009, and its statistical results offer some triangulation of the fi ndings of this study.
This serves as the fi nal report of this study. This re-port has four main objectives. The fi rst is to update the participatory livelihoods assessment, the fi rst round of which was conducted in July 2009. This report compares results for 2009 and 2010, both in the participatory assessment and in the household survey. The attempt is to understand trends, and in particular to assess the impact of the drought and high food price infl ation in 2008–09 in compari-son with a relatively more normal year in 2010. The second was to use indicators suggested by the fi rst assessment to consider the impact of ACRP—bearing in mind that the time between the two rounds of the assessment was only one year, which is a very short time frame to be looking for im-pact in a DRR program. The third objective is to briefl y summarize the results of other reports that were part of the study, particularly the January 2010 report on institutional and policy enabling and constraining factors. On the basis of these, the last objective is to suggest recommendations on fu-ture disaster risk reduction interventions in Tsaeda Amba or more broadly.
The 2010 participatory assessment relied on a ret-rospective baseline, so that income sources, sources of food, expenditure and household demographics and assets could be compared for the same house-holds. These results demonstrate the impact of the drought and other shocks including the high price of food that affected households in Tsaeda Amba

Feinstein International Center
vi
in 2009. The participatory assessment results show a generally smaller proportion of food and income in Tsaeda Amba coming from the Productive Safe-ty Net Programme (PSNP). Results also demon-strate a substantial loss of livestock assets between 2009 and 2010, although the baseline comparison for these results—it was determined through fo-cus group discussions—was really the beginning of 2009, not July 2009 when the baseline assessment took place. Much of the loss of animals took place during the dry season of 2009, between January and April. These losses were heavier in higher-income households and male-headed households that had larger herds to begin with—implying that smaller herd sizes are easier to manage in a drought. While people realize this, there is still a tendency to stock up during good years, and a reluctance to de-stock, even if drought conditions appear to be imminent. This problem remains a signifi cant challenge to disaster risk management in Tsaeda Amba. Survey results show that in 2010, food security indicators are generally improved, and household income has shifted towards the sales of agricultural produce. In comparison, in 2009, household income heavily relied on livestock sales and various forms of ex-ternal support—predominantly the PSNP, but also some smaller NGO programs that offered food for work or cash for work forms of support.
A number of institutional factors constrain efforts to reduce risk and overcome food insecurity, in-cluding land access, credit, traditional practices, and access to the Productive Safety Net Programme. Signifi cant changes in the Productive Safety Net Programme were evident in the 2010 research, but it was too soon to gauge their impact. Ethiopia has
a new Disaster Risk Management policy. While still in draft format, the new policy is already the basis for much of the activity on the ground.
The major impact of ACRP has been in the area of capacity building—at both the woreda and kebele level, particularly in analytical skills. Kebele Disas-ter Preparedness Committees (KDPCs) have been formed in all cooperating kebeles, most of which also have disaster preparedness plans. The project was well integrated with government planning and programs, and the approach is being integrated into other World Vision projects in Tsaeda Amba.
The participatory assessment also assessed the question of the level of assets a household would require to be able to withstand a bad year and be able to recover without substantial public support. The results of this analysis, while far from a con-sensus, imply levels of assets that are so high (in excess of the levels of even the wealthiest groups currently) as to imply environmental degradation problems that future DRR and development in-terventions must do more than simply increase household asset holdings under current techno-logical constraints
The report concludes with a series of recom-mendations to ACRP managers. These include gradually shifting the focus of ACRP focus from awareness-raising to more specifi c interventions; enhancing the focus on capacity building; incor-porating ACRP objectives into integrated develop-ment programs; enhancing the geographic focus of interventions to achieve impact; matching staff time allocation to the requirements of programming; and treating ACRP as a learning laboratory.
December 2010 • Participatory Impact Assessment
1
Section 1: Introduction
Disaster Reduction in Ethiopia
Ethiopia is one of the most food-insecure coun-tries in the world, but only recently has the food security problem begun to be understood in
terms of a complete analysis of livelihoods, rather than simply a food supply problem. Ethiopia has long had standing national capacity for disaster response as well as the support of the international donor community in re-sponding to famines or livelihood crises. In recent times there has been much more emphasis on the prevention, mitigation and reducing the risk of disasters (Coates et al. 2010). Several major programs and policies now un-derpin this approach to disaster risk management.
The fi rst of these policies is the linkage between the Productive Safety Net Program (PSNP) and DRR. The PSNP, introduced in 2005, addresses the predict-able needs of chronically vulnerable groups who re-quire assistance during the hunger gap season even in good years. It provides support to vulnerable households through an employment guarantee (food and/or cash—either through food/cash for work or by direct transfer, depending on circumstances). Labor-defi cit households qualify for free transfers. Early evaluations of the PSNP focus on targeting and linkages to other programs (such as the “household package program”) that promote the development of sustainable livelihoods (Devereux et al. 2006). Linkages with these other food security programs have yet to be fully realized (Gilligan et al. 2008).
Since 2004 the Government of Ethiopia and a set of donors and UN, led by WFP, have been designing a drought risk-transfer scheme as one component of the PSNP. “Weather index insurance” is linked to the un-derlying systemic risk, in this case low rainfall. Rainfall levels are indexed and recorded at a regional level such as a local weather station. When rainfall is received be-low a certain level within a certain region, the insurance plan provides payment to individuals living within that area. The key innovation of this approach is that insur-ance payments are not linked to the extent of the loss or damage to livelihoods resulting from poor rainfall, but are tied instead to amount of rainfall received. Once the existence of a suffi cient degree of correlation between rainfall and yield is established, contracts can be devel-
oped under which payments would be made if rainfall levels fall below the selected levels. Advantages of such a program include that it is inexpensive to administer since it allows for standardization and avoids the need to draw up individual insurance policies. This approach is being tried at the national level in Ethiopia (the LEAP project) and at a much more localized (kebele) level (the HARITA project). The HARITA project is piloted by REST and Oxfam America, partnering with a local in-surance company to provide similar insurance coverage, to individuals who sign up at the beginning of each sea-son (Oxfam America 2009).
Boudreau (2009) highlights the new approach to in-tegrating disaster risk assessment into the management of and response to humanitarian crises in Ethiopia. For most of the past thirty years, crises in Ethiopia have been responded to after the fact, with signifi cant time lost to the predictable cycle of post-crisis assessment, appeals, and response. While the Productive Safety Net Program has been critical in responding to predictable need (i.e., the so called “chronically vulnerable” groups that re-quire assistance to make it through the hungry season even in good years), the same approach to proactive management of risk will now be incorporated into an overall national disaster preparedness and management strategy. This has culminated in a new national disaster-risk-management policy (described in detail below and in Coates et al. 2010).
The Africa Community Resilience Project
The Africa Community Resilience Project (ACRP) was designed as a DRR project by World Vision Interna-tional in line with the Hyogo Framework for Action as a blueprint to creating resilient communities. The project is research-based and will build capacity for improving resilience through disaster risk management program-ming and mainstreaming. The project also defi nes key indicators of resilience, and seeks to infl uence policies and programming aimed at supporting disaster risk re-duction. Ethiopia is one of three countries involved in the program, and the Tsaeda Amba project in Tigray is one of four Area Development Programs involved.
Feinstein International Center
2
Update on the ACRP Program in Tsaeda Amba
Since the fi rst round of fi eldwork completed in July 2009, ACRP has been engaged in a number of activities. These include identifying partner organizations, includ-ing Government of Ethiopia offi ces, other NGOs, and universities; running training workshops with govern-ment offi ce staff, kebele chairpersons and managers from each of the eleven targeted kebeles of the woreda on 2009 implementation and 2010 planning; and forming of a task force to oversee operations. Other activities are detailed in Section 3 below.
Several factors constrained ACRP activities. Challenges included high staff turnover and the limited level of staffi ng at the ADP level, with all staff having multiple commitments and limited time for project activities; late approval of annual plans by the National Offi ce; limited community resource mobilization (World Vision 2009). The research fi eld team also noted limited staff time, multiple obligations, and long working hours by pro-gram staff. ACRP activities in 2010 and further discus-sion of constraints are discussed below in Section 3.1
The LCOT program
The Livelihoods Change over Time (LCOT) program was proposed to capture major livelihood adaptations in situations of protracted or repeated humanitarian emergencies, taking into consideration both the inter-ventions of humanitarian agencies and the institutional, environmental and policy constraints that defi ne liveli-hoods. The purpose of LCOT is to capture livelihood dynamics longitudinally over time, including the impact of shocks or crises in real time when they occur.
The Tsaeda Amba study is one of three planned stud-ies under LCOT, capturing the elements of protracted vulnerability to slow onset crises, with major causal fac-tors being drought and other climatic factors, chronic poverty, resource degradation, and increasingly, infl ation and other economic hazards. In reality, of course, Tsaeda Amba residents face multiple hazards but the case study intended to capture these as the main hazards.
Objectives of the study
Undertaken in collaboration with World Vision, the Tsaeda Amba study intends to capture the dynamics of livelihood change over time in a given location, and
1 For a complete description of the ACRP project, see the fi rst report in the study (Maxwell et al. 2009) https://wikis.uit.tufts.edu/confl uence/display/FIC/Baseline+Report+--+Africa+Community+Resilience+Project. This report is an impact assessment, but also a measure of changes in livelihoods—whether these changes were brought about by the project or by other causes.
to capture the impact of the DRR interventions that World Vision is implementing through ACRP. Insofar as ACRP is a pilot program, it is intended to develop a risk management strategy that can be scaled up to ap-ply to other areas of Ethiopian and Africa more broadly. Thus strategy development is also part of the objective. Specifi c objectives include efforts to
• assess the impact of a specifi c, community-driven Disaster Risk Reduction program in Northern Ethi-opia;
• assess change in livelihoods over time, including an understanding of the dynamics of changes in liveli-hood assets, strategies and outcomes in response to repeated shocks;
• understand the major factors driving these changes—all causal factors including but not limited to interven-tions of ACRP;
• understand community perceptions of hazards and risk;
• develop the means to measure the impact of DRR intervention in chronically risk prone areas; and
• provide feedback to project management in the de-velopment of a risk management strategy.
Research questions
Two sets of research questions guide this study:
1. In northern Ethiopia, what is the evidence that a set of community-driven interventions to reduce or mitigate the risk of specifi c hazards will enable people to anticipate, prepare for, mitigate, cope with, and recover from the impact of a shock and become more resilient to future shocks? Are peo-ple less at risk after the program? Are their assets better maintained? Do livelihood outcomes (food security, nutrition, health) deteriorate less in the face of shocks?
2. How do communities perceive risk and what do they perceive is necessary to overcome the risk of repeated humanitarian emergencies? What do communities consider to be the appropriate mix and threshold of assets necessary for overcoming the risk of repeated crisis at the household level? What are the main institutional constraints to risk reduction irrespective of household strategies and assets?
Objectives of the 2010 Participatory Impact Assessment
This assessment was the second round of annual data collection, comparing changes in livelihood status in
December 2010 • Participatory Impact Assessment
3
from all groups interviewed using IRB-approved con-sent forms. Other government offi cials and ADP staff were interviewed separately. At the end of each day of data collection, team members typed or hand-wrote their notes and submitted them to the Principal Inves-tigator along with all completed consent forms. De-briefi ng sessions conducted with the full team were helpful to dig more deeply into the enumerators’ im-pressions of the focus group results. The Ethiopian team members were able to assist in interpreting the data based on their own in-depth knowledge of the local context.
Sampling
The team utilized a purposive sampling approach to site selection for this phase of the research. The same kebeles and kushets visited during the baseline in 2009 were revisited, enabling a direct comparison of results. The number of kushets sampled in each livelihood zone was roughly proportionate to the geographic coverage of the ACRP program in that area. See Table 1. Kebeles vis-ited for the participatory assessment included Hawile, Raele (Atsbi-Wonberta), Marwa (Irob Mountains), Ge-blen and Tahtay Ziban (Eastern Plateau). Two kushets were sampled in Geblen and Tahtay Ziban, only one kushet was visited in the others. The study was limited to the kebeles included in the ACRP program, which is not all the kebeles in the woreda. Figure 1 is a map of the woreda, depicting the different livelihood zones. Table 1 shows the kebeles included in the ACRP program, and the purposive sample selected for the study, and gives an indication of the levels of chronic vulnerability by showing the proportion of the population included in the PSNP. The purposive selection was based on maxi-mizing the diversity of livelihoods, livelihood systems, hazards, and management practices from kebeles within the ACRP area. The Participatory Impact Assessment team visited the same kebeles and kushets in 2010 as in 2009.
The household survey, summarized in Annex 1, was conducted by World Vision staff (with assistance from the Tufts team in 2009; on their own in 2010). It was a based on a sample of 400 households in the ACRP op-erational kebeles selected through a two-stage sampling process, with kushets as the primary sampling unit. The same questionnaire was used in both rounds of the sur-vey, but different households were selected.
Limitations of the study
The selection of informants and some of the actual in-terviewing was done collaboratively with the kebele ad-ministrator. Inevitably, this makes for a certain amount of “administrator bias” in both the selection of partic-ipants and in some of the information provided. The request was for a purposively selected sample that rep-
Tsaeda Amba woreda with 2009. Specifi c objectives were to
• assess livelihood conditions in 2010
• compare livelihood conditions and resilience in 2010 with 2009
• assess local understandings of thresholds required to overcome chronic vulnerability
• assess the capacity of Kebele Disaster Prepared-ness Committees (KDPCs) and the contribution of ACRP to KDPC capacity and preparedness
Field methods
As in 2009, two different data collection activities took place—a participatory impact assessment led by the Tufts team (this report), and a household survey undertaken directly by World Vision. The results of the household survey are in Annex 2. This report is based on participa-tory, qualitative data; but, where comparisons with the household survey data are possible, they are presented to greater understand the phenomena being discussed.
The fi eld team was comprised of researchers from Tufts University, Mekelle University, Tigray Agricultural Re-search Institute, World Vision staff (the national offi ce, the Mekelle program offi ce, and the Tsaeda Amba Area Development Program offi ce), and Government staff.
The participatory impact assessment was based on re-cent methodologies (Catley et al. 2008), including a participatory assessment of current livelihoods status, but also included a retrospective baseline, asking re-spondents to compare 2010 with 2009 status. Key in-formant interviews were conducted with kebele, kushet, and woreda leaders to assess changes in capacity and to understand better the thresholds of livelihood assets and diversifi cation needed to constitute resiliency in the face of hazards faced in Tsaeda Amba. Focus group discussion were held with a wide range of community participants, and included a specifi cally designed live-lihoods analysis (the results of which are depicted in Section 3). Members of the team also reviewed com-munity plans with the KDPC leadership. The team spent one day in each kebele. Two teams worked on focus group interviews for the livelihoods assessment, interviewing groups of six households (separate groups for men and women).2 A third team interviewed key informants. Informed voluntary consent was obtained
2 The focus groups were intended to be male household heads and female household heads. It subsequently became apparent that a small handful of female respondents were not household heads, but results are interpreted in terms of the sex of the household head.

Feinstein International Center
4
resented a cross section of the community, but consist-ing of male and female heads of households.3 The team did its best to ensure the independence of the research by assuring all informants of complete confi dentiality of their answers, and attempted to deal with this potential bias by asking questions from various different angles to compare responses. Nevertheless it is not possible to conduct research completely independently of local ad-ministration. For this reason, there is some comparison of results found from the (purposively sampled) partici-
patory results with the (randomly sampled) household survey (See Annex 2).
Team members believed that respondents were routine-ly underestimating the extent of their assets. Respon-dents—particularly key informants—tended to answer questions as if the study was a needs assessment—hence the tendency to understate assets. Also, when trying to rank hazards, “needs” would often be the answers to questions (as in 2009, lack of potable water would rou-tinely be mentioned as one of the top “hazards,” but of course potable water isn’t a hazard—it is a need, and obviously a very serious one). But this tendency intro-duced a second form of bias to answers. This was gener-ally easy to recognize and mitigate.
3 It subsequently emerged that a small number of the women interviewed were not heads of household.
TABLE 1. The Study Area (2009)
Kebele Population ACRP Study Livelihood Zone % in PSNP
Geblen 2,920 X X Eastern Plateau 66.2
Marwa 3,130 X X Irob Mountains 63.1
Taltay Ziban 3,261 X X Eastern Plateau 51.6
Saesie 8,299 X Eastern Plateau 58.9
Korma Sebha 5,723 X Eastern Plateau 71.0
Mesihul 1,186 X Irob Mountains 65.3
Sewene 3,059 X Eastern Plateau 62.3
Wolwalo 4,205 X Eastern Plateau 67.3
Emba Simena 5,795 Eastern Plateau 66.1
Hadish Hiwot 8,879 Eastern Plateau 48.9
Edaga Hamus 9,675 Eastern Plateau 23.0
Beleso 3,059 Eastern Plateau 62.3
Hadish Adi 5,482 Eastern Plateau 61.5
Raele 4,581 X X Atsbi-Wonberta Highlands 77.5
Hawile 6,064 X X Atsbi-Wonberta Highlands 73.1
Mai-Megelt 8,291 Eastern Plateau 42.6
Hangoda 3,790 Eastern Plateau 51.0
Agazi 8,574 Eastern Plateau 39.2
Sinkata 5,173 Eastern Plateau 38.3
Freweni 11,392 Eastern Plateau 19.5
Guila Abena 7,673 Eastern Plateau 35.9
Gemse Agamet 8,353 Eastern Plateau 42.6
Sendada 9,358 X Eastern Plateau 48.1
Saze 7,979 Eastern Plateau 42.4
Tsenkanet 4,497 Eastern Plateau 52.1
150,398 48.8%
Source: Woreda administration

December 2010 • Participatory Impact Assessment
5
broadly than presented here. The household survey in-terviewed different households in 2010 from 2009, so the statistical results in the annex are not a panel study but rather two cross sectional snapshots using the same methodology.
The impact of a program like ACRP may take a long time to be fully manifested in the livelihoods of people in the communities served. There was only one year be-tween the baseline and this assessment—far too short a period to observe major changes in livelihoods. And there are many other factors infl uencing people’s liveli-hoods beyond this particular project. These factors are noted and discussed in Section 2. In many ways, this as-sessment, as well as the original baseline in 2009, should be seen as a combined baseline that captures the general beginning of a focused effort in DRR by World Vision, not a “before” and “after” assessment related to one spe-cifi c short-term project.
The kebeles selected for the study (and the project) are not representative of the whole woreda. They were selected for the project because they are the most drought-prone in the woreda, and therefore they are likely to present a generally less well-off picture in terms of livelihoods compared to the rest of the woreda—no attempt was made to assess conditions elsewhere. (This is the case for both the Participatory Impact Assessment and the household survey).
Although numeric or semi-quantitative results are pre-sented from the current study and particularly from the proportional piling responses to the livelihoods baseline, this report (with the exception of Annex 2) is not in-tended to be statistically representative of the eleven ke-beles of the ACRP, and there is no attempt to extrapolate any of the fi ndings on the basis of statistics. Rather, the results of the participatory assessment have logical infer-ence—that is the logic of the fi ndings can be used more
Feinstein International Center
6
Section 2: Livelihoods Changein Tsaeda Amba, 2009-2010
Livelihoods inTsaeda Amba woreda
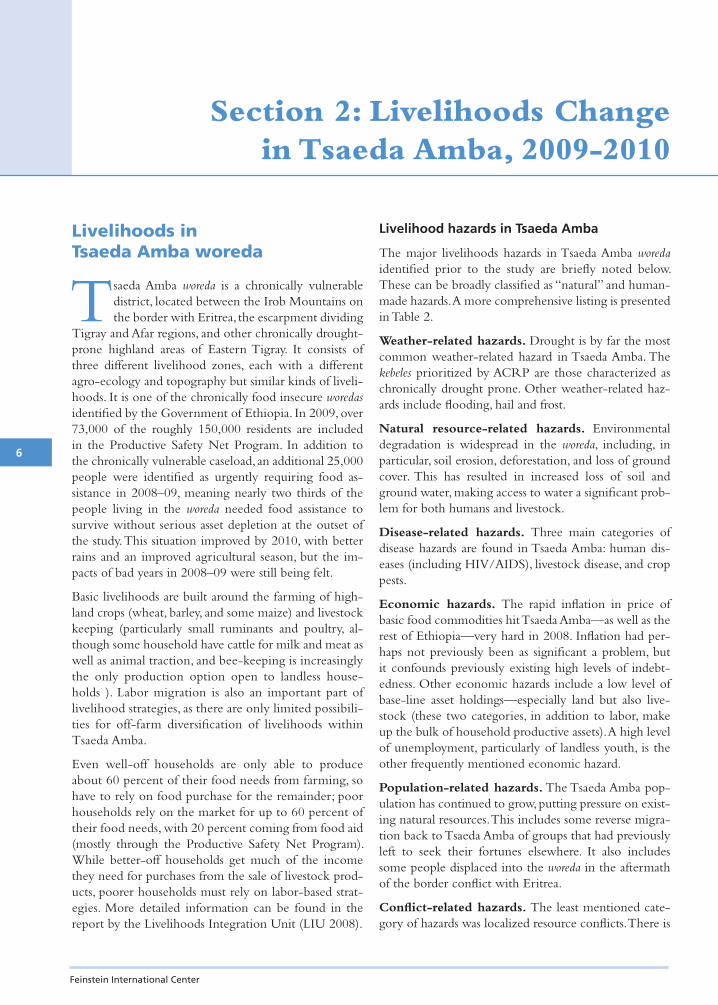
Tsaeda Amba woreda is a chronically vulnerable district, located between the Irob Mountains on the border with Eritrea, the escarpment dividing
Tigray and Afar regions, and other chronically drought-prone highland areas of Eastern Tigray. It consists of three different livelihood zones, each with a different agro-ecology and topography but similar kinds of liveli-hoods. It is one of the chronically food insecure woredas identifi ed by the Government of Ethiopia. In 2009, over 73,000 of the roughly 150,000 residents are included in the Productive Safety Net Program. In addition to the chronically vulnerable caseload, an additional 25,000 people were identifi ed as urgently requiring food as-sistance in 2008–09, meaning nearly two thirds of the people living in the woreda needed food assistance to survive without serious asset depletion at the outset of the study. This situation improved by 2010, with better rains and an improved agricultural season, but the im-pacts of bad years in 2008–09 were still being felt.
Basic livelihoods are built around the farming of high-land crops (wheat, barley, and some maize) and livestock keeping (particularly small ruminants and poultry, al-though some household have cattle for milk and meat as well as animal traction, and bee-keeping is increasingly the only production option open to landless house-holds ). Labor migration is also an important part of livelihood strategies, as there are only limited possibili-ties for off-farm diversifi cation of livelihoods within Tsaeda Amba.
Even well-off households are only able to produce about 60 percent of their food needs from farming, so have to rely on food purchase for the remainder; poor households rely on the market for up to 60 percent of their food needs, with 20 percent coming from food aid (mostly through the Productive Safety Net Program). While better-off households get much of the income they need for purchases from the sale of livestock prod-ucts, poorer households must rely on labor-based strat-egies. More detailed information can be found in the report by the Livelihoods Integration Unit (LIU 2008).
Livelihood hazards in Tsaeda Amba
The major livelihoods hazards in Tsaeda Amba woreda identifi ed prior to the study are briefl y noted below. These can be broadly classifi ed as “natural” and human-made hazards. A more comprehensive listing is presented in Table 2.
Weather-related hazards. Drought is by far the most common weather-related hazard in Tsaeda Amba. The kebeles prioritized by ACRP are those characterized as chronically drought prone. Other weather-related haz-ards include fl ooding, hail and frost.
Natural resource-related hazards. Environmental degradation is widespread in the woreda, including, in particular, soil erosion, deforestation, and loss of ground cover. This has resulted in increased loss of soil and ground water, making access to water a signifi cant prob-lem for both humans and livestock.
Disease-related hazards. Three main categories of disease hazards are found in Tsaeda Amba: human dis-eases (including HIV/AIDS), livestock disease, and crop pests.
Economic hazards. The rapid infl ation in price of basic food commodities hit Tsaeda Amba—as well as the rest of Ethiopia—very hard in 2008. Infl ation had per-haps not previously been as signifi cant a problem, but it confounds previously existing high levels of indebt-edness. Other economic hazards include a low level of base-line asset holdings—especially land but also live-stock (these two categories, in addition to labor, make up the bulk of household productive assets). A high level of unemployment, particularly of landless youth, is the other frequently mentioned economic hazard.
Population-related hazards. The Tsaeda Amba pop-ulation has continued to grow, putting pressure on exist-ing natural resources. This includes some reverse migra-tion back to Tsaeda Amba of groups that had previously left to seek their fortunes elsewhere. It also includes some people displaced into the woreda in the aftermath of the border confl ict with Eritrea.
Confl ict-related hazards. The least mentioned cate-gory of hazards was localized resource confl icts. There is

December 2010 • Participatory Impact Assessment
7
also the memory of the confl ict with Eritrea—now ten years in the past—and the displacement of people from border area, or people from Tsaeda Amba who were ex-pelled from Eritrea. The area has not been directly af-fected by confl ict since the war against the Derg regime that ended in 1991.
Ranking main hazards and changes in perception, 2009–2010
Table 2 depicts the cumulative results of the hazard ranking exercises done in 2009. Table 2 was constructed by allocating “points” according the rank given each hazard in each exercise and then totaling up the points. Some hazards were mentioned in all fi ve kebeles, others less frequently. If a hazard was not mentioned in a given exercise, it was accorded zero “points.”
it probably would not have been on anyone’s list prior to 2007, and the rate of infl ation had cooled considerably by July 2010 but remained a real fear in many commu-nities (and it is entirely possible that another round of food price infl ation is in store, given current assessments of the expected 2010 northern hemisphere harvest). Human disease, livestock disease and crop pests often show up, but are somewhat lower in priority.
While the ranking of the threat of hazards was not ex-pected to change in the short term, actual conditions on the ground were improved signifi cantly in 2010 com-pared to 2009, particularly in terms of the major hazards. Table 3 outlines perceived changes in the level of threat from various hazards in 2010 compared to 2009 from the participatory impact assessment. While the agricul-tural season was late in some of the most marginal areas (Hawile is in the Atsbi-Wonberta highlands and Marwa
Drought is without exception the highest priority haz-ard, to no one’s surprise. Population pressure and envi-ronmental degradation—two clearly linked issues—are close behind. In the cumulative ranking, “potable water” is ranked as the third highest priority hazard. Though not a hazard per se, this points out the priority of wa-ter access in many communities, and points out the dif-fi culty in distinguishing between a hazard, and a poor outcome. Food price infl ation was ranked high in 2009;
is a lowland area in the Irob mountains), both had re-ceived signifi cantly more rain by the end of July than in 2009. Food price infl ation was lower across the boards, and there were slow but perceptible changes in environ-mental degradation conditions in some locations.
Likewise, data from the household survey on the level of perceived threat of various hazards in 2010 was gener-ally lower, although the ranking of such hazards changed somewhat in 2010 compared to 2009 (Table 4).
TABLE 2. 2009 Cumulative Hazard Ranking
HazardCumulative Score
(“points”) Overall RankNumber of Times
Mentioned
Drought 58 1 5
Environmental degradation 40 2 5
Potable water 39 3 5
Unemployment 35 4 5
Food price infl ation 32 5 5
Population pressure 31 6 3
Isolation/inaccessibility 30 7 5
Livestock disease 29 8 4
Human disease 28 9 5
Flooding 22 10 4
Crop pest 11 11 5
Local confl ict 7 12 3
Indebtedness 5 13= 2
“Cold wind”/frost 5 13= 2
Hail 3 15= 1
HIV/AIDS 3 15= 1
Source: 2009 fi eldwork (= indicates a tie in ranking between two hazards)

Feinstein International Center
8
Livelihood zones and characteristics oflivelihood systems
The 2009 Livelihoods Information Unit report on Tsaeda Amba (DPPA 2008) describes three different livelihood zones in Tsaeda Amba woreda, and all of them are represented in the ACRP program area. By far the largest, in terms of both land area and population is the Eastern Plateau livelihood zone with a population of almost 107,000. The Atsbi-Wonberta Highlands liveli-hood zone has a population of about 6,500—with most of the rest of the zone falling into a neighboring woreda). And the Irob Mountains livelihood zone has a popula-tion of about 19,500—again most of this livelihood zone falls into a different woreda (Figure 1). See the previous
section for further information on the kebeles selected.
Although the physical characteristics of these livelihood zones are different and the size of land holdings is very different, the primary crops grown are the same. Barley and wheat predominate, with chickpeas and fava beans being grown in the Atsbi-Wonberta Highlands, maize and hanfets (a barley and wheat mixture) in the Eastern Plateau, and maize and lentils in the Irob Mountains. Gathering of cactus is a supplementary food source in July and August across the entire woreda—an extremely important food source during the hungry season. Rain-fall is uni-modal, falling mainly in July and August, but with some rainfall in the months leading up to July/August (DPPA 2008). Labor migration plays a signifi -cant part of livelihoods in Tsaeda Amba, particularly at certain times of the year.
TABLE 3. Perceived Change in Hazards Condition, 2010–2009
Hazard Perceived change of conditions by location
Hawile Marwa Tahtay Ziban
Drought same improved improved
Environmental degradation same improved improved
Food price infl ation improved improved improved
Population pressure same increased increased
Isolation/inaccessibility improved same improved
Livestock disease improved increased improved
Human disease improved improved improved
Flooding improved same same
Crop pests same same same
Unemployment same increased increased
Indebtedness same increased same
HIV same same Same
Source: 2010 fi eldwork
TABLE 4. Ranking Current Hazard Levels, 2009–2010
Hazard 2009 2010
Mean Rank Mean Rank
Drought 3.53 2 2.70 1
Agricultural Pests and Diseases 1.38 6 1.39 6=
Livestock Pests and Diseases 1.63 3= 1.43 5
Flooding 1.16 9 1.27 9
Hail 1.43 5 1.39 6=
Frost 1.63 3= 1.66 3
Food Price Infl ation 3.56 1 2.44 2
Human Illness 1.36 7 1.47 4
HIV/AIDS 1.07 10 1.19 10
Other 1.33 8 1.00 8
Source: 2010 fi eldwork (= indicates a tie in ranking between two hazards)

December 2010 • Participatory Impact Assessment
9Assessment of livelihood conditions 2009–2010
Wealth groups and changes in wealth groups
The Livelihoods Integration Unit (DPPA 2008) cat-egorized livelihood activities and assets by wealth in
Tsaeda Amba in 2008. Table 5 summarizes the main characteristics of wealth groups in the livelihood sys-tems and livelihood zones and shows the proportion of the estimated population in each wealth group in 2008. Results for the proportions of the population in differ-ent wealth groups from the 2010 assessment (both for current status, and for the retrospective baseline) are de-
TABLE 5. Characteristics of Livelihood Zones
Wealth GroupHousehold
SizeLand Area (Timads) Average Livestock Holding
Proportion of Population
Atsbi-Wonberta Livelihood ZoneVery Poor 6–7 0–2 2–3 shoats, 3–5 chickens 25
Poor 5–7 1.5–2 0–1 cows, 4–6 shoats, 0–1 donkey, 3–5 chickens 35
Middle 5–7 2.5–3 1 cow, 1 ox, 8–10 shoats, 0–2 donkeys, 3–5 chickens 30
Better off 4–6 4–6 1–3 cows, 1–3 oxen, 12 shoats, 1–2 donkeys, 7 chickens 10
Eastern Plateau ZoneVery Poor 5–7 0–1 0–3 shoats 20%
Poor 5–7 0–2 1–3 cattle, 0–1 oxen, 3–5 shoats 35
Middle 6–8 2–4 2–4 cattle, 1 ox, 6–12 shoats, 2 beehives 30
Better off 7–8 3–5 3–7 cattle, 2 oxen, 10–15 shoats, 1–3 beehives 15
Irob Mountain Livelihood ZoneVery Poor 5 0–0.4 4 chickens 20
Poor 7 0.4–0.8 4 chickens, 0–1 oxen, 1–2 cows, 0–8 shoats 35
Middle 7 0.4–0.8 5 chickens, 0–2 oxen, 2–4 cows, 15 shoats, 2 beehives 35
Better off 7 0.6–1.0 5 chickens, 1–2 oxen, 4–8 cows, 30 shoats, 3–4 beehives 10
Source: DPPA (2008)
FIGURE 1. Map Depicting Livelihood Zones in Tsaeda Amba Woreda
Source: DPPA 2008
Feinstein International Center
10
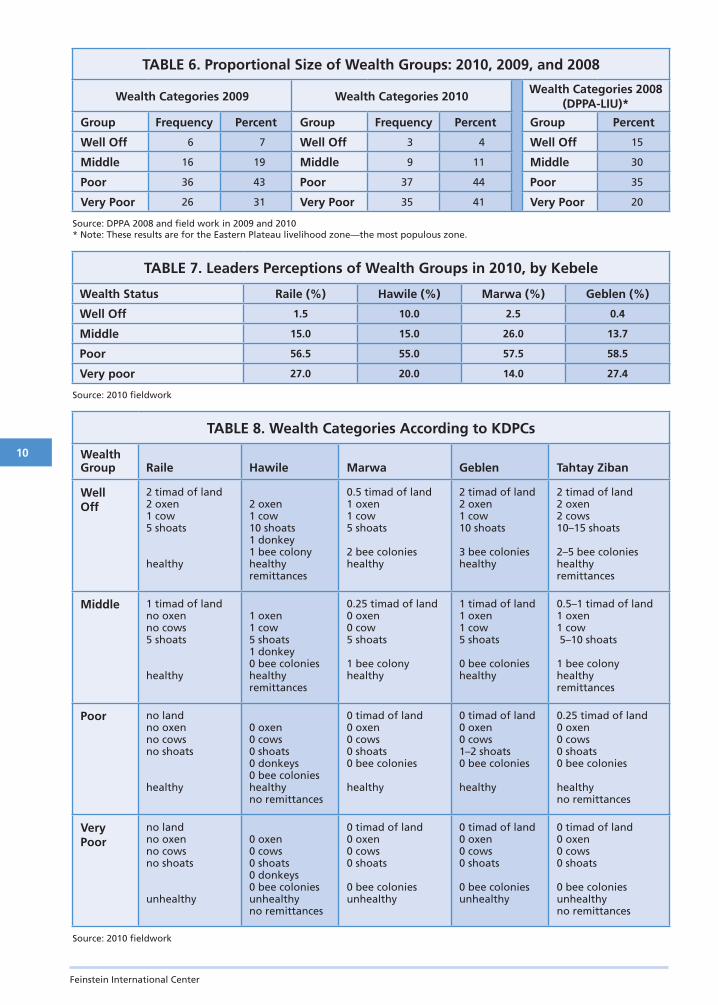
TABLE 6. Proportional Size of Wealth Groups: 2010, 2009, and 2008
Wealth Categories 2009 Wealth Categories 2010
Wealth Categories 2008 (DPPA-LIU)*
Group Frequency Percent Group Frequency Percent Group Percent
Well Off 6 7 Well Off 3 4 Well Off 15
Middle 16 19 Middle 9 11 Middle 30
Poor 36 43 Poor 37 44 Poor 35
Very Poor 26 31 Very Poor 35 41 Very Poor 20
Source: DPPA 2008 and fi eld work in 2009 and 2010* Note: These results are for the Eastern Plateau livelihood zone—the most populous zone.
TABLE 7. Leaders Perceptions of Wealth Groups in 2010, by Kebele
Wealth Status Raile (%) Hawile (%) Marwa (%) Geblen (%)
Well Off 1.5 10.0 2.5 0.4
Middle 15.0 15.0 26.0 13.7
Poor 56.5 55.0 57.5 58.5
Very poor 27.0 20.0 14.0 27.4
Source: 2010 fi eldwork
TABLE 8. Wealth Categories According to KDPCs
Wealth Group Raile Hawile Marwa Geblen Tahtay Ziban
WellOff
2 timad of land2 oxen1 cow5 shoats
healthy
2 oxen1 cow10 shoats1 donkey1 bee colonyhealthyremittances
0.5 timad of land1 oxen1 cow5 shoats
2 bee colonieshealthy
2 timad of land2 oxen1 cow10 shoats
3 bee colonieshealthy
2 timad of land2 oxen2 cows10–15 shoats
2–5 bee colonieshealthyremittances
Middle 1 timad of landno oxenno cows5 shoats
healthy
1 oxen1 cow5 shoats1 donkey0 bee colonieshealthyremittances
0.25 timad of land0 oxen0 cow5 shoats
1 bee colonyhealthy
1 timad of land1 oxen1 cow5 shoats
0 bee colonieshealthy
0.5–1 timad of land1 oxen1 cow 5–10 shoats
1 bee colonyhealthyremittances
Poor no landno oxenno cowsno shoats
healthy
0 oxen0 cows0 shoats0 donkeys0 bee colonieshealthyno remittances
0 timad of land0 oxen0 cows0 shoats0 bee colonies
healthy
0 timad of land0 oxen0 cows1–2 shoats0 bee colonies
healthy
0.25 timad of land0 oxen0 cows0 shoats0 bee colonies
healthyno remittances
Very Poor
no landno oxenno cowsno shoats
unhealthy
0 oxen0 cows0 shoats0 donkeys0 bee coloniesunhealthyno remittances
0 timad of land0 oxen0 cows0 shoats
0 bee coloniesunhealthy
0 timad of land0 oxen0 cows0 shoats
0 bee coloniesunhealthy
0 timad of land0 oxen0 cows0 shoats
0 bee coloniesunhealthyno remittances
Source: 2010 fi eldwork

December 2010 • Participatory Impact Assessment
11
picted in Table 6. Note that these wealth groups were constructed using the DPPA characteristics (particu-larly in terms of assets held). Both the DPPA results and the 2010 assessment results were obtained from purposively selected samples, intended to represent the community. The proportion of people in the higher wealth groups is considerably lower in the 2010 assess-ment than in the DPPA report, and the proportions in the lower groups is considerably higher. This is prob-ably for two major reasons. First, the sample selected for the baseline and the 2010 assessment were from the eleven most drought-prone kebeles in the woreda, so are likely to be somewhat worse off in general liveli-hood terms. But second and more importantly, the im-pact of the 2008–09 drought and the food price crisis are refl ected in the 2010 fi ndings, whereas the 2008 DPPA report was based on data collected before either of these—data collection was in 2007 and early 2008. Actual livelihood conditions have worsened as a result of both these shocks.
Tables 7 and 8 depict the proportions of populations falling into various wealth groups according to either
the records of the kebele manager or Development Agents, or simply according to the perceptions of the Kebele Disaster Preparedness Committee (KDPC).
The determination of wealth groups was according to the leaders or DA’s own criteria, making these data somewhat non-comparable with the DPPA fi ndings. These are presented below in Table 8. The criteria are in the form of household asset holdings: land, livestock and labor—as well as access to alternative types of in-come, such as remittances from family members living and working elsewhere.
The results of all this wealth group analysis are impor-tant for two reasons. First, they give a sense of the per-ceived loss of wealth in the past two years—a fi nding strongly corroborated by other results. Second, they give a strong impression of the relative proportion fall-ing into the better-off groups—a fi nding with signifi -cance for the discussion about thresholds for overcom-ing chronic vulnerability to shocks and hazards.
Sources of income. Figure 2 depicts the results for income sources of one focus group involving six
FIGURE 2.Marwa Women’s Group Income Sources, 2009–2010
HH1 HH2 HH3 HH4 HH5 HH6
Sources of Income Counters (proportional piling)2009 2010 2009 2010 2009 2010 2009 2010 2009 2010 2009 2010
Livestock sales ••• •• • ••••
Livestock products sales
•
Honey sales
Crop sales
Labor •••••••
••••• ••••••••
•••••••
•••••••
••••••
••••••••
••••••••
•••••••••
•••••••••
••
Petty trading ••• ••
Natural resource extraction/salesArtisanal services
Productive Safety Net Program
•••••••••••••
•••••••••••••••
••••••••••
••
•••••••••••••
••••••••••
••••••••••
•
•••••••••
••••••••••
••••••••••
•
••••••••••
•
•••••••••
•••••••
Other assistance •••••••••
•••••••••
Remittances
Credit
Other
Source: 2010 fi eldwork

Feinstein International Center
12
households, relying on proportional piling methodol-ogy (Catley et al. 2008). Figure 3 depicts the cumula-tive results of the Participatory Assessment for income sources and the changes in proportions of income in 2009 and 2010. This is a measure of livelihood diversifi -cation, and the changes over the year. There were nota-ble changes in income sources between 2009 and 2010. The biggest is a decline in income from the PSNP. This was an expected outcome: First, 2010 had been a better year, meaning that there were fewer requirements for PSNP support; and second, there were changes in tar-geting practices that were intended to reduce the num-ber of households receiving support, but provide greater levels of support to those households. Livestock sales and
FIGURE 3. Sources of Income, Tsaeda Amba, 2009–2010
Source: 2010 Fieldwork
livestock products sales were both slightly increased in 2010—again a function of improved rainfall, grazing ac-cess to water. Crop sales were up, although it was too early in the season to see much difference in this. Labor income remained about the same, which was somewhat unexpected—it might have been expected that reliance on labor was higher in a bad year, such as 2009. In fact it is an indication of the degree to which labor is a per-manent part of livelihoods, not just a coping strategy for a bad year.
Remittance income, on the other hand, is lower in 2010, implying that remittances may be tied to how good or bad other sources of income are for a given year.
FIGURE 4.Marwa Women’s Group Food Sources, 2009–2010
HH1 HH2 HH3 HH4 HH5 HH6
Sources of Food Counters2009 2010 2009 2010 2009 2010 2009 2010 2009 2010 2009 2010
Own production •• •• •• ••• •• ••• •• ••
Purchase •••••••••
••••••
••••••
••••••
••••••••
••••• ••••••••••
••••••
•••••••••
••••••••••
••••••••••
••
•••••••••
Borrowing •• •• •• •• ••••••
•••• ••••• •••
Safety net/food aid •••••••
••••••
••••••••••
••••• •••• ••••• ••••• ••••••
••••••••••
•
••••••
••••••••
••••••
Assistance (formal) •• ••
Assistance (informal) ••
Wild foods •• •• ••• ••• •• •••
Other
Source: 2010 Fieldwork
2009 Income (All) 2010 Income (All)

December 2010 • Participatory Impact Assessment
13
Sources of food. Figure 4 depicts the results for sources of food for one focus group involving six households, relying on proportional piling methodology. Figure 5 depicts the cumulative results of the Participatory As-sessment for sources of food and the changes in pro-portions of food sources between 2009 and 2010. Pur-chase of food in the market is the biggest single source of food, but the PSNP is a close second. The amount of food coming from the PSNP dipped slightly in 2010 compared to 2009, for the same reasons mentioned above regarding income from PSNP. Consumption of wild food (mainly beles or prickly pears from cactus) is signifi cantly up. The drought and an insect infestation
FIGURE 5. Sources of Food, Tsaeda Amba, 2009–2010
Source: 2010 Fieldwork
in 2009 limited the availability of beles, the prickly pear from cactus that grows throughout Tsaeda Amba. This fruit becomes available as early as June in many parts of the woreda, and constitutes a signifi cant part of food intake during the rainy (hungry) season. A new hazard to beles was noted during the course of the research (see section below on livelihoods constraints and new hazards).
Otherwise, own-production of food is slightly up and purchase is slightly down. But overall, there isn’t much change in sources of food. Some of the quantitative in-dicators of food security suggest much improved overall
FIGURE 6.Marwa Women’s Group Expenditures, 2009–2010
HH1 HH2 HH3 HH4 HH5 HH6
Expenditures Counters2009 2010 2009 2010 2009 2010 2009 2010 2009 2010 2009 2010
Food (staple) ••••• ••••••
••• ••••• ••••••••••
•••••••
••••••••••
••••••
•••••••
••••• ••••• •••••
Food (non-staple) •••• ••••• •••• •••• •• •••• ••• •••• ••• ••• ••• •••••
Agricultural inputs/ fodder
•••
Household items •• •••
Water • • • • • •
Health •• • • •• •• •• • ••• ••
Clothing •••• •••• ••••••
•••• • •• •• ••• ••••• ••• •••• ••••
Education ••• •• •••• ••• •• •• •• •• ••• •••• ••• ••
Tax • • • • • • • • • •
Other • • • • • • • •
Source: 2010 Fieldwork
2009 Sources of Food (All) 2010 Sources of Food (All)

Feinstein International Center
14
FIGURE 7. Expenditures, Tsaeda Amba, 2009–2010
Source: 2010 Fieldwork
food security in 2010; one indicator suggests more mar-ginal improvement (see Annex 2).
Expenditure. Figure 6 depicts the results for house-hold expenditure for one focus group involving six households, relying on proportional piling methodol-ogy. Figure 7 depicts the cumulative results of the Par-ticipatory Assessment for household expenditure, and the changes in proportions of in expenditure between 2009 and 2010. Not surprisingly, given the above, food is the biggest single expense listed by household in-formants, accounting for 40 percent of the total. The
proportion of household budgets devoted to food did not change much between 2009 and 2010—slightly less was spent in 2010 on staple foods—refl ecting a somewhat lower price. This enabled slightly more ex-penditure on non-staple foods. The total was about the same. There is little appreciable difference in other ex-penditures. A relatively high proportion of the house-hold budget is devoted to the purchase of clothing. It was not clear entirely why this is the case. When asked, the typical response was, “you have to clothe your children!”
A Baseline Livelihood Assessment Focus Group Discussion
2009 Expenditures (All) 2010 Expenditures (All)
TABLE 9. Demographics and Assets (Entire Sample)
CategoryMean
2009 2010
Working adults 1.85 1.90
Children and dependents 4.23 4.14
Timads of cultivable land* 1.61 1.62
Oxen/cows* 3.20 2.59
Shoats* 10.30 6.16
Donkeys* 1.79 1.43
Chickens* 3.58 3.71
Beehives* 3.17 2.05
Source: 2009 and 2010 fi eldwork*Assets listed are only for households reporting owning some of those assets

December 2010 • Participatory Impact Assessment
15
TABLE 10. Comparative Analysis of Livelihoods Assessment by Category, 2010
By LH Zone By Gender By Wealth GroupTotal EP AWH IM M W VP P M/BO
N 84 48 24 12 42 42 26 36 22
Proportion 57% 29% 14% 50% 50% 31% 43% 26%
Sources of IncomeLivestock sales (%) 12 12 15 5 13 11 11 11 16
Livestock products sales (%) 7 8 8 2 5 8 7 7 4
Honey sales (%) 2 1 4 1 3 0 1 1 7
Crop sales (rain fed) (%) 10 7 19 3 9 11 10 8 15
Crop sales (irrigated) (%) 2 3 1 0 3 1 2 2 5
Labor (%) 13 14 6 21 12 14 14 15 4
Petty trading (%) 3 3 3 1 2 3 2 3 5
Natural resource extraction (%) 1 1 1 0 1 0 0 1 1
Artisanal services (%) 2 2 3 0 2 2 3 2 0
PSNP (%) 37 35 32 56 35 39 42 36 26
Other assistance (formal) (%) 10 12 5 11 13 6 7 12 13
Remittances (%) 2 3 1 0 2 2 2 2 4
Other (%) 0 0 1 0 0 0 1 0 0
Sources of FoodOwn Production (%) 16 15 23 9 19 13 12 18 24
Purchase (%) 27 26 25 33 24 29 31 24 21
Borrowing (%) 8 8 7 10 6 10 10 6 5
Safety net/food aid (%) 27 26 30 29 25 30 29 28 22
Assistance (formal) (%) 6 7 4 5 8 3 4 6 7
Assistance (informal) (%) 1 2 1 1 2 1 1 1 3
Wild foods (%) 15 18 10 13 17 13 13 16 18
ExpendituresFood (staple) (%) 26 27 21 30 25 26 28 24 23
Food (non-staple) (%) 13 13 11 15 10 16 13 13 11
Ag. inputs/fodder (%) 10 10 14 5 12 9 10 9 14
Household items (%) 7 6 9 5 8 6 6 8 6
Water (%) 1 0 4 1 1 2 2 1 1
Health (%) 7 6 7 8 8 5 6 7 7
Clothing (%) 14 15 14 15 15 14 13 14 19
Education (%) 12 13 10 13 13 12 12 13 12
Tax (%) 6 6 7 5 7 5 5 7 6
Other (%) 3 4 3 3 2 5 4 4 1
Assets*Working Adults 1.90 2.04 1.70 1.67 2.40 1.40 1.51 2.03 2.67
Children and dependents 4.14 3.96 3.92 5.33 4.71 4.57 3.71 4.24 5.08
Timads of cultivable land 1.39 1.30 1.79 1.02 1.89 0.88 0.76 1.55 2.71
Cattle 1.79 1.91 1.17 2.50 2.74 0.83 0.74 2.05 4.00
Shoats 4.11 3.79 6.04 1.67 6.17 2.05 1.63 3.70 12.56
Donkeys 0.48 0.45 0.37 0.83 0.74 0.21 0.29 0.38 1.23
Chickens 3.18 3.47 2.67 3.00 4.10 2.26 2.03 3.84 2.93
Beehives 0.46 0.30 0.79 0,50 0.83 0.10 0.20 0.32 1.49
Source: 2010 fi eldwork* Assets reported are averages for all households, including household that have none
Feinstein International Center
16
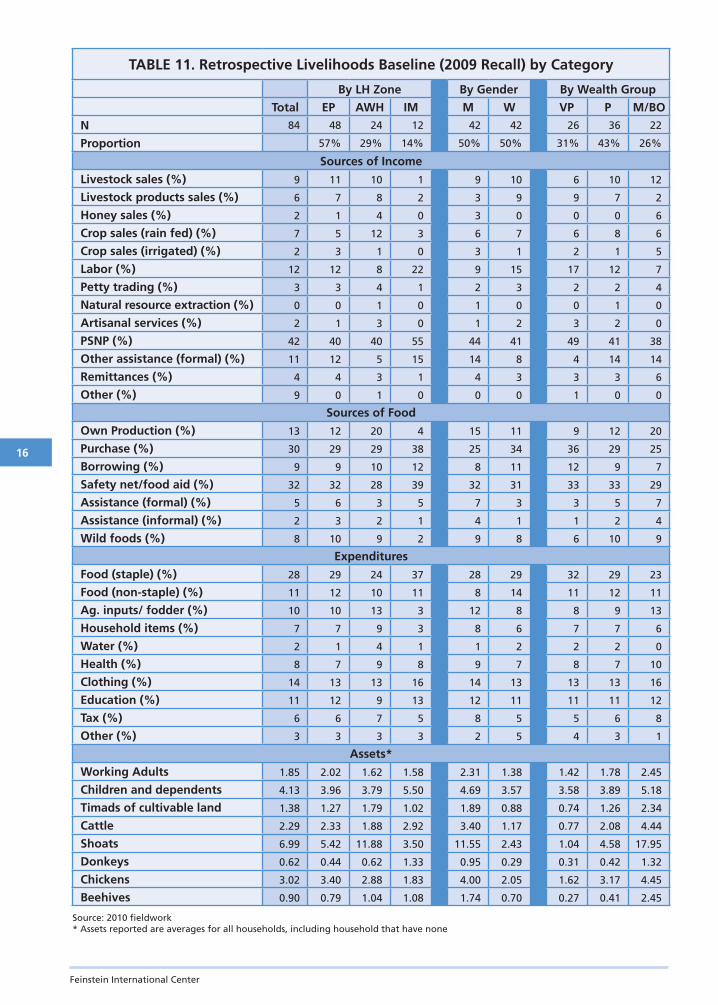
TABLE 11. Retrospective Livelihoods Baseline (2009 Recall) by Category
By LH Zone By Gender By Wealth GroupTotal EP AWH IM M W VP P M/BO
N 84 48 24 12 42 42 26 36 22
Proportion 57% 29% 14% 50% 50% 31% 43% 26%
Sources of IncomeLivestock sales (%) 9 11 10 1 9 10 6 10 12
Livestock products sales (%) 6 7 8 2 3 9 9 7 2
Honey sales (%) 2 1 4 0 3 0 0 0 6
Crop sales (rain fed) (%) 7 5 12 3 6 7 6 8 6
Crop sales (irrigated) (%) 2 3 1 0 3 1 2 1 5
Labor (%) 12 12 8 22 9 15 17 12 7
Petty trading (%) 3 3 4 1 2 3 2 2 4
Natural resource extraction (%) 0 0 1 0 1 0 0 1 0
Artisanal services (%) 2 1 3 0 1 2 3 2 0
PSNP (%) 42 40 40 55 44 41 49 41 38
Other assistance (formal) (%) 11 12 5 15 14 8 4 14 14
Remittances (%) 4 4 3 1 4 3 3 3 6
Other (%) 9 0 1 0 0 0 1 0 0
Sources of FoodOwn Production (%) 13 12 20 4 15 11 9 12 20
Purchase (%) 30 29 29 38 25 34 36 29 25
Borrowing (%) 9 9 10 12 8 11 12 9 7
Safety net/food aid (%) 32 32 28 39 32 31 33 33 29
Assistance (formal) (%) 5 6 3 5 7 3 3 5 7
Assistance (informal) (%) 2 3 2 1 4 1 1 2 4
Wild foods (%) 8 10 9 2 9 8 6 10 9
ExpendituresFood (staple) (%) 28 29 24 37 28 29 32 29 23
Food (non-staple) (%) 11 12 10 11 8 14 11 12 11
Ag. inputs/ fodder (%) 10 10 13 3 12 8 8 9 13
Household items (%) 7 7 9 3 8 6 7 7 6
Water (%) 2 1 4 1 1 2 2 2 0
Health (%) 8 7 9 8 9 7 8 7 10
Clothing (%) 14 13 13 16 14 13 13 13 16
Education (%) 11 12 9 13 12 11 11 11 12
Tax (%) 6 6 7 5 8 5 5 6 8
Other (%) 3 3 3 3 2 5 4 3 1
Assets*Working Adults 1.85 2.02 1.62 1.58 2.31 1.38 1.42 1.78 2.45
Children and dependents 4.13 3.96 3.79 5.50 4.69 3.57 3.58 3.89 5.18
Timads of cultivable land 1.38 1.27 1.79 1.02 1.89 0.88 0.74 1.26 2.34
Cattle 2.29 2.33 1.88 2.92 3.40 1.17 0.77 2.08 4.44
Shoats 6.99 5.42 11.88 3.50 11.55 2.43 1.04 4.58 17.95
Donkeys 0.62 0.44 0.62 1.33 0.95 0.29 0.31 0.42 1.32
Chickens 3.02 3.40 2.88 1.83 4.00 2.05 1.62 3.17 4.45
Beehives 0.90 0.79 1.04 1.08 1.74 0.70 0.27 0.41 2.45
Source: 2010 fi eldwork* Assets reported are averages for all households, including household that have none

December 2010 • Participatory Impact Assessment
17
Thresholds for overcoming chronic vulnerability
Part of the objective of the second round of the assess-ment was to understand the threshold of self-reliance necessary to enable households to survive and recover from expected shocks, and maintain a sustainable liveli-hood. This is a complicated question, and it was only asked of the KDPCs and a limited number of other key informants. There was a surprising level of dissonance in the answers to this question, and at least some of the responses were clearly infl uenced by a similar discussion that has been going on for some time related to the question of graduation from the Productive Safety Net Programme (PSNP). In some ways, the two questions are similar, although the question asked in the 2010 as-sessment presumed that the PSNP (or a similar mecha-nism) would be available to help in times of extreme stress (i.e., it did not presume that once a certain thresh-old had been reached, public assistance would no longer be available).
Many of the responses revolved around a cash fi gure, and the fi gure was often close to ETB 35,000 in sav-ings—which is the fi gure that has been suggested by the PSNP as threshold necessary for graduation. However, after detailed discussion, it became clear that a mix of assets—including but not limited to cash—was critical, and rather than putting a cash fi gure on the cumulative value of these assets, the assets themselves were listed. These correspond roughly to the assets noted in the livelihoods assessment above. The answers are compiled in Table 12.
A related question was about the general degree of food of food security. These are general answers from key informants—not aggregated answers from individual households. These responses are found in Table 13.
Several points should be noted with regard to these re-sponses. First, in the case of every response from KDPCs, the “threshold” for overcoming chronic vulnerability
is well above the asset levels of even the most well-off members of the community at the moment.
Second, almost all the responses involve some amount of land, and therefore don’t deal with the issue of land-lessness, or seem to rule out the possibility of landless members of the community being able to survive or overcome the threat of persistent hazards. This question was asked in various different ways, including a greater emphasis on labor or on sustainable natural resource-use possibilities such as bee keeping. But in the end, all the KDPCs insisted that a minimum amount of land was necessary for resilience to prevailing hazards in Tsaeda Amba.
Third, currently only the most well-off groups in the community have no “gap” in their access to food on an annual basis. Other groups all face a gap of some amount of time and the worst-off groups face a food gap the majority of the time. Insofar as food security is a critical component of the threshold question, the implication is the same—in order to overcome chronic vulnerability, households must reach the level of assets held by those currently the most well-off in the community.
Fourth, and following logically from the last point, there is an apparent “fallacy of aggregation” implicit in these responses: that is, while it makes sense at the level of the individual household to increase asset holdings, if all households were to achieve this, there would doubt-less be an overall resource shortfall, particularly in terms of livestock grazing and water sources. Overgrazing and a distinct shortage of dry season grazing for animals is already a problem. If livestock numbers were to increase by the proportions suggested in these answers, the short-age of grazing and water would be greatly magnifi ed. When this question was posed to the KDPC key in-formants, however, they acknowledged the problem but said it could be overcome by practices such as the “cut and carry” system of animal keeping and an improved water supply. Given the lack of evidence on such ideas (which are practiced, but only to a limited degree), it
TABLE 12. Thresholds for Overcoming Chronic Vulnerability (KDPC responses)
Indicators Raele Hawile Marwa Geblen T/ZibanLand 1.2 timad 1 timad 2 timad 3 timad
Oxen 3 2 2 2
Cows 2 2 3 2
Shoats 30 20 20 15
Chicken 10
Bee colonies 15 3 5
Cash ETB 500 ETB 18,000 ETB 10,000
Remittances
Source: 2010 fi eldwork

Feinstein International Center
18
is diffi cult to ascertain whether such practices alone could address the shortfall. There is evidence, however, that managing smaller herds using such practices limited livestock losses during the drought in 2009, but the crit-ical part of that observation is that smaller herd sizes can be managed with such practices. Whether such practices suffi ce with larger numbers of animals remains unlikely.
Discussion of participatory livelihoods assessment
There are relatively few changes in livelihoods over the short period of time this assessment covered, and as not-ed at the outset of this report, none that can be attrib-uted directly to programmatic interventions in the short term. Levels of reliance on the PSNP—as both a source of income and a source of food—are lower in 2010 than
in 2009. This outcome was expected, since 2010 has proven to be a better agricultural season, and the impact of which is already being felt. There is more income in 2010 from agricultural production, particular the sales of crops and livestock. Reliance on labor as a source of income is about the same in both years, and few differ-ences were noted in other categories of income.
A major change was noted in the level of assets held, and the degree of losses between 2009 and 2010. Overall signifi cant asset loss was noted, but when this is bro-ken down by gender, if becomes clear that, while male-headed households had (and still have) greater levels of assets in nearly all categories, female headed households lost signifi cantly fewer assets in the drought.
Table 14 breaks out the changes in assets by men and women. The reasons for the losses were primarily two-fold. Most of the loss was attributed to animal mortality
TABLE 13. General Levels of Food Security by Wealth Group (KDPC responses)
Status Indicators Hawile Marwa Geblen T/Ziban
Well off Months of consumptionfrom own production 6 3 3 4
Months of food access 12 9 4 5
Months of food gaps 0 3 5 4
Proportion PSNP as asource of food None None None None
Middle Months of consumptionfrom own production 4 2 1 3
Months of food access 9 8 4 3
Months of food gaps 3 4 6 6
Proportion PSNP as asource of food None 1/6 1/3 1/4
Poor Months of consumptionfrom own production 2 0 0 2
Months of food access 6 6 3 3
Months of food gaps 6 6 9 9
Proportion PSNP as asource of food 2/3 1/6 1/3 1/4
Very poor Months of consumptionfrom own production 1 0 0 0
Months of food access 3 6 3 3
Months of food gaps 9 6 9 9
Proportion PSNP as asource of food 3/4 1/6 1/3 1/4
Source: 2010 fi eldwork

December 2010 • Participatory Impact Assessment
19associated with the drought (which actually began in 2008, but losses were especially heavy in 2009 as the cumulative impact of the drought). The second most signifi cant factor explaining the loss of livestock was livestock sales in order to repay loans taken out after the projects the loans fi nanced failed (again—most fre-quently as a result of the drought). There was mention of deliberate destocking in the face of the drought, but only occasional anecdotal evidence of any actual de-stocking taking place. And when it did take place, prices were very low, discouraging widespread engagement. It was only on the basis of individual effort—there were no organized efforts at commercial destocking to reduce animal numbers on a signifi cant scale.
As Table 14 depicts, male-headed households lost an av-erage of 0.76 head of cattle and over six small ruminants between 2009 and 2010. Female-headed households on the other hand lost less than half a head of cattle and less than one small ruminant. Female-headed households
actually reported an average gain in beehives, although this was a relatively small number of households.4
The results above all rely on the retrospective baseline conducted as part of the 2010 assessment, but using the 2009 assessment results as the baseline comparator re-veals few signifi cant differences. Reported reliance on the PSNP for both food and income was proportionally higher in the 2009 assessment than in the 2010 retro-spective baseline, but it was clear that the 2009 sample was more highly skewed towards lower income groups. Information on expenditure and food sources was simi-lar in the 2009 assessment and in the 2010 retrospective baseline.
Comparison with results of household survey
Annex 2 contains some of the results of the house-hold survey in June 2010 in the ACRP-served kebeles of Tsaeda Amba, and compares these results with the same survey a year earlier. The tables include results of the household survey on
• basic descriptive statistics of household demographics,
• comparisons with participatory baseline (sources of food and income),
• water sources and distance,
• savings and indebtedness,
TABLE 14. Changes in Assets 2009–2010, by Sex of HHH
Assets Men 2009 Men 2010
Minimum Maximum Mean Maximum Mean Ave. Loss
Land (Timads) 1 10 2.09 10 2.09 0.00
Cattle 1 10 3.76 7 3.03 0.74
Shoats 2 80 13.47 40 7.40 6.07
Donkeys 1 5 2.00 4 1.63 0.37
Chickens 1 10 4.20 14 4.41 (0.21)
Beehives 1 9 3.32 5 2.06 1.26
Assets Women 2009 Women 2010
Minimum Maximum Mean Maximum Mean Ave. LossLand (Timads) 1 2 1.08 2 1.10 (0.01)
Cattle 1 6 2.23 3 1.75 0.48
Shoats 1 15 4.86 8 4.10 0.76
Donkeys 1 3 1.33 1 1.00 0.33
Chickens 1 7 2.77 5 2.88 (0.10)
Beehives 1 2 1.50 2 2.00 (0.50)
Source: 2010 fi eldwork*Assets listed are only for households reporting owning some of those assets in 2009
4 Note: Figures in Table 14 refer only to households that re-ported having any assets in these categories, and there were signifi cant numbers of female-headed households that held no assets in many of these categories. Also note, as per the methodology that not all households interviewed in the women’s focus groups were female-headed—a small hand-ful turned out to be women members of male-headed households.

Feinstein International Center
20
• current food security status (DD, CSI, and HFIAS),
• disaster management results, and
• impact of disasters.
There is little change in household demographics be-tween 2009 and 2010, as would be expected. Many of the results of the participatory livelihoods assessment outlines above are echoed in the statistical results—al-though unlike the participatory assessment, the house-hold survey interviewed totally different samples in 2009 and 2010. Income from the sales of agricultural produc-tion was already up in 2010, compared to 2009, even though it was still very early in the agricultural season; income from the sale of livestock was down. And in-come from the PSNP was down dramatically: fi rst, many fewer households were targeted by the PSNP, and the average amount that each targeted household received was lower. Both of these results were expected—the tar-geting policy of the PSNP was changed signifi cantly in 2010; and t2010 is not as bad a year, so the amount of support even to recipient households was expected to be somewhat lower. These results hold fairly constant across different livelihood zones, income groups and by sex of household head. But these results differ signifi -cantly from the participatory assessment, where most
of the respondents were still receiving PSNP support in 2010—indicating that the sample of respondents we were provided with by village leaders was dispropor-tionately skewed towards the lower income groups, or those known to be PSNP benefi ciaries.
Overall, livelihoods were less diversifi ed in 2010 than they were in 2009—but this probably indicates a greater requirement for more coping strategies in 2009 than it does a longer-term trend towards less diversifi cation. This change was similar across all analytical groups. There was little difference in indicators such as home ownership, access to land, or amount of land owned—again all re-sults that were expected. The statistical results for owner-ship of livestock paint a somewhat different picture from the participatory assessment, but one that is probably explicable. The survey results show almost no change in numbers of livestock between 2009 and 2010, whereas the participatory assessment results show a big loss of livestock. The difference is that, whereas the survey asked for livestock numbers at the precise date of the survey, the participatory assessment was clearly getting livestock numbers from “last year” rather than “one year ago.” Par-ticipatory assessment respondent—when asked in follow up focus group discussions after the livelihood assessment was completed—noted that they were reporting their as-
The Importance of Beles to Food Consumption in Tsaeda Amba
Cochineal-infested beles Cochineal insects on the beles plant
Fresh beles being sold for consumption Beles growing (though called “wild” food, it is often grown near homesteads)

December 2010 • Participatory Impact Assessment
21
sets more or less at the beginning of 2009, not precisely one year ago on the date of the interviews. Hence the participatory assessment captured losses encountered in the 2009 dry season, which is when most of the livestock was reported being lost to the impact of the drought, or being sold in order to repay loans that had failed because of the impact of the drought.
There was a modest improvement in access to clean sources of water reported between 2009 and 2010, although it is not clear that this is the direct result of any project. The number of households reporting sav-ings increased in 2010, albeit very modestly. The num-ber of households reported taking out loans dropped fairly substantially. Whether this was because there was less need to borrow, or because people were more con-cerned about the possibility of default is not possible to determine on the basis of the statistical results. The participatory assessment results certainly indicate some amount of the latter.
Food consumption and food security indicators im-proved in 2010 compared to 2009, although in some cases the improvement was not signifi cant. Overall the HFIAS and CSI measures showed signifi cant improve-ment in 2010. More in-depth analysis of the food secu-rity indicators will be forthcoming.
Finally, as expected, the number of household report-ing having been affected by a shock in the previous 12 months dropped substantially—from nearly all house-holds in 2009 to only about one quarter in 2010. Levels of coping dropped concomitantly. The general ranking of hazards in the survey did not change substantially.
New constraints or hazards
Several constraints or hazards were noted in the fi eld-work. Some of these were also investigated in greater depth in the January 2010 report—including indebted-ness. A new potential hazard noted during this fi eld-work is the potential infestation of Cochineal insects (Dactylopius coccus). This is a species of insect valued for carmine dye, used for food coloring and cosmetics. It was introduced in Tigray for commercial production purposes, and feeds on cactus plants. While the insect was introduced under controlled circumstances, it has since been found outside of the controlled areas—nota-bly in Entalo Wajerat woreda South East of Mekelle and around Mekelle town.
Because it feeds on cactus, it is a threat to the prickly pear cactus (beles) that is critical to rainy season diets in areas of Eastern Tigray, including Tsaeda Amba. It has not yet been found in Eastern Tigray, and attempts are being made to quarantine the outbreak of the insect in the locations where it is already found. But this is an example of a new and potentially serious risk to the food security of rural populations in Tsaeda Amba. Beles is a signifi cant part of the diet during the period from May-June to September, depending on location. An in-festation of cochineal insects renders the prickly pear inedible. At the same time, however, the insect itself is valuable—currently selling for ETB 12.00 per kilo—so one of the control strategies is educate people about both the dangers and the value of the insect, and the value of it, to encourage people to collect and sell the insects before they are able to destroy the beles.
Feinstein International Center
22
Section 3. The AfricaCommunity Resilience Project
Description of ACRP
The Africa Community Resilience Project (ACRP) was designed to be research-based and to build capacity for improving resilience
through disaster risk management programming and mainstreaming. The project will defi ne key indicators of resilience, and seek to infl uence policies and program-ming aimed at supporting disaster risk reduction. The six-step implementation process on which the project was based is laid out below.
Step 1. Community selection and profi ling will ensure that an appropriate entry is made to the community, and essential general background information is col-lected.
Step 2. Hazard assessment will determine the differ-ent hazards that affect the community, the likelihood of experiencing a hazard, the principal characteristics of the hazard, and which groups of people are most likely to be affected.
Step 3. Vulnerability assessment will identify the condi-tions that are causing the vulnerability, including insti-tutional and policy factors. The assessment will rely on various vulnerability frameworks (the Pelling Vulnera-bility Framework, the Pressure-Release model, and the livelihoods approach) to disaggregate the vulnerabilities and assets of communities and households.
Step 4. A capacity assessment will identify people’s cop-ing strategies and the resources and technologies that can be mobilised in the face of a particular hazard. Ca-pacity assessment stresses the positive and seeks to iden-tify how people usually deal with adverse circumstances.
Step 5. Prioritisation of risks and risk reduction strate-gies begins to highlight key areas for potential action. The livelihoods strategy priorities should be guided by need to diversify income and food production strate-gies, advocate for creation of a supportive environment for better options while activities are guided by a bal-ance in provision of community services.
Step 6. Planning and implementation of activities pri-oritized by the vulnerability and capacity assessment will be incorporated into ADP plans through a number
of processes. These include mainstreaming Disaster Risk Reduction through strategies like the promo-tion of conservation farming, the inclusion of a Risk Reduction and Emergency Management sector in the provisional plan, and drafting a provisional project to develop policy and processes to incorporate risk man-agement as a transversal consideration in future infra-structure development.
ACRP Implementation
The activities of the ACRP in 2009 and the fi rst six months of 2010 included the formation and develop-ment of a woreda Task Force, and the Kebele Disaster Pre-paredness Committees (KDPCs). The main intent of the project was to strengthen the capacity of this commu-nity level institution, and to strengthen its linkages with the woreda level committee. The other main activity was training and awareness creation about disaster risk re-duction. The focus of the training was on analysis and planning, and specifi c training included how to conduct vulnerability and risk assessments, how to improve early warning, how to conduct livelihoods assessments, and the construction of seasonal livelihood calendars. Train-ing was conducted at the woreda level for woreda staff and kebele leaders and at the kebele level in all eleven kebeles for community members. Overall, the approach was one of: a) awareness creation, and b) mainstreaming DRR into ongoing Area Development Program (ADP) work. The working hypothesis of the project is that the Area Development Program will have much greater impact if the capacity to manage it on the ground at the local level has been enhanced.
Strengths and constraints to implementation
The ACRP faced several signifi cant strengths and con-straints. Strengths included the following:
1. Integration. The project is well integrated with woreda government planning and programs, and works closely with woreda staff.
2. Approach. The project’s approach is being main-streamed into other ADP activities.
3. Commitment. The approach is an on-going priority of WVI.
December 2010 • Participatory Impact Assessment
23
The KDPCs are not a new body—they were renamed in 2009 to refl ect a broader mandate. Previously they were called EW committees. ACRP led to name change, but not a new entity.
KDPC roles and responsibilities
The responsibilities of KDPCs are several-fold, including early warning, informing woreda government of localized shocks and their impact, and resolving the problems that they can. Often this requires outside help to solve prob-lems that arise from hazards and disasters. Responsibili-ties outlines in 2009 included the following:
1. Risk assessment and analysis. Assessing the risks to the community and their causes is a major task, and a major component of training.
2. Planning and preparedness. Risk assessment and early warning are components of disaster pre-paredness, but other things are included as well: pre-arranged mitigation planning, the identifi ca-tion of vulnerable groups (those most likely to be adversely affected fi rst by a shock), and the pre-identifi cation of internal (community) and exter-nal (government or NGO) resources to assist.
3. Early warning. This rainfall monitoring, mar-ket price monitoring and monitoring human and livestock health.
4. Reporting. If there is an impending shock or di-saster, the fi rst activity is to report it to the woreda. The fl ow of information is set up to be from the local level to the woreda level, not the other way around.
5. Response. To the extent that a shock or disas-ter can be managed locally, it is the committee’s responsibility to do so. Minor shocks (localized fl ooding for example) can be handled locally. Managing assistance from outside includes tar-geting, management of labor-based safety nets (PSNP), oversight of supplementary feeding (in-creasingly on a CMAM or community-based management of acute malnutrition approach), and other responses.
6. Public awareness-raising. This is one of the most often-mentioned activities of the project and the KDPCs, but the most diffi cult to clearly defi ne. It includes efforts to highlight awareness of disaster hazards generally; to decrease traditional ceremonies and their apparently wasteful usage of scarce food resources; to highlight the hazards of migration; and to promote specifi c interventions such as destocking in the fact of an imminent drought or other threat to livestock assets.
Constraints included the following:
1. Duration. The project was three years long, but the actual implementation period captured was about one and a half years, given that the fi rst year was devoted to preparatory activities, and the im-pact assessment was carried out in the middle of the fi nal year. Thus the period under assessment is far too short to capture impact at the level of live-lihoods. This has implications for further moni-toring.
2. Staff turnover and multiple duties of proj-ect staff. There was high turnover in manage-ment staff at the ADP and Program Offi ce levels, and at the project level. At the project level, there was some discontinuity in staff coverage after the transfer of one member of staff. Project manage-ment staff had multiple responsibilities—ACRP was only one of several responsibilities of the manager.
3. Turnover of kebele leadership. In at least some of the kebeles studied, there was also a high turn-over of both kebele leadership and government expertise seconded to the kebele—meaning that some of those who were trained were no longer in the kebele, and those who were there in 2010 had not participated in the training.
Outcomes analyzed
As noted at the outset of the report, it is unrealistic to look for impact of the ACRP program at the level of individuals or household livelihoods after a brief period of implementation. Given this constraint, and given that the main effort of the fi rst phase was on building the ca-pacity of the Kebele Disaster Preparedness Committees (KDPCs), this is the focus of this section of the report.5
The Kebele Disaster Preparedness Committees (KDPCs)
The Kebele Disaster Preparedness Committee (KDPC) is the body at the local administrative unit with which the ACRP works. The committee is made up of a mix of locally elected offi cials (the kebele chairperson and sub-kebele chairs, and the elected heads of the local farmer’s association, women’s association, and youth association) and appointed local government offi cials (the Develop-ment Agents from the Ministries of Agriculture, Health, and Water as well as the government-appointed kebele manager). Other individuals may be members as well.
5 More detailed feedback was provided to project manage-ment staff.

Feinstein International Center
24
7. Integration of DRR and longer-term objec-tives. The committee is also responsible for plan-ning and overseeing other activities that address some hazards or risk factors, but these would not necessarily be considered DRR activities per se. This has led to some confusion about what are specifi cally DRR activities, and what are general development activities (see below).
KDPC capacity
The 2009 report suggested several areas for impact as-sessment regarding the KDPCs. These included the fol-lowing:
1. KDPC perceptions of ACRP contribution to change
2. Improvements/changes in KDPC analysis and planning:
a. KDPC ability to differentiate between “needs,” “hazards,” and “outcomes”
b. KDPC ability to articulate an analysis of haz-ards and risk
c. Organization of KDPC plans and ability of KDPC to link analysis to activities in the plan
d. KDPC ability to implement plans, based on activities actually happening or already hap-pened and demonstrated
e. New activities undertaken in 2010 as a result of new capacities or improved planning
f. Extent to which KDPC plans meet SMART criteria
1. Increased identifi cation and tracking of early warning indicators at KDPC level
2. Improved knowledge of national policies, plans and priorities, and ability to articulate how they infl uence local plans
3. Improved reporting and two-way communication between kebele and woreda
4. Livelihoods impacts
Actual outcomes included the following:
1. KDPCs were formed in all kebeles. These replaced an already existing Early Warning Committee and the project is working on improving the capac-ity of the new committees. These committees may not have yet taken deep root in the com-munity. Another study that exhaustively studied institutions in one of the kebeles involved with ACRP—the Long Term Perspectives on Devel-opment Impacts in Rural Ethiopia—did not list the KDPC as one of the village governance struc-tures in work conducted earlier in 2010.
2. Seven of eleven kebeles have conducted a plan-ning exercise that resulted in a list of problems and suggested solutions. This was called a Com-munity Disaster Preparedness Plan, although it resembles a general development plan more than a specifi c Community Disaster Preparedness Plan (see example below in Table 16). While the intent of ACRP is that disaster risk management should be mainstreamed into development planning, in some cases, the plans were so generic that risk management was almost left out.
3. There is generally a good awareness of major haz-ards and major means of reducing and mitigat-ing risk, and preparing for onset of shock. Some of this was pre-existing (i.e., before ACRP), and some of it was not necessarily written down. ACRP has been instrumental in helping commu-nities to funnel awareness into actual planning.
Specifi c areas of KDPC capacity reviewed included analysis, planning, implementation, and monitoring and evaluation.
Analysis. The 2009 baseline noted some constraints across all the KDPCs in terms of analytical capac-ity. Committees particularly had a diffi cult time dis-tinguishing between hazards and poor outcomes, and between plans and interventions. Some KDPCs clearly had a good capacity for analyzing their situation—it is more a matter of providing some training or assistance on which areas constitute causes, which areas consti-tute interventions, and which areas constitute outcomes. One KDPC in 2009 came up with an excellent problem analysis depicted in Figure 8. But this kind of analysis was not resulting in plans of a similar quality.
Much of the activity of ACRP in 2009 and 2010 was oriented at improved analysis and planning. Early warn-ing—and particularly the reporting of early warning information—has improved. But it is evident from the A Kebele Disaster-Preparedness Committee
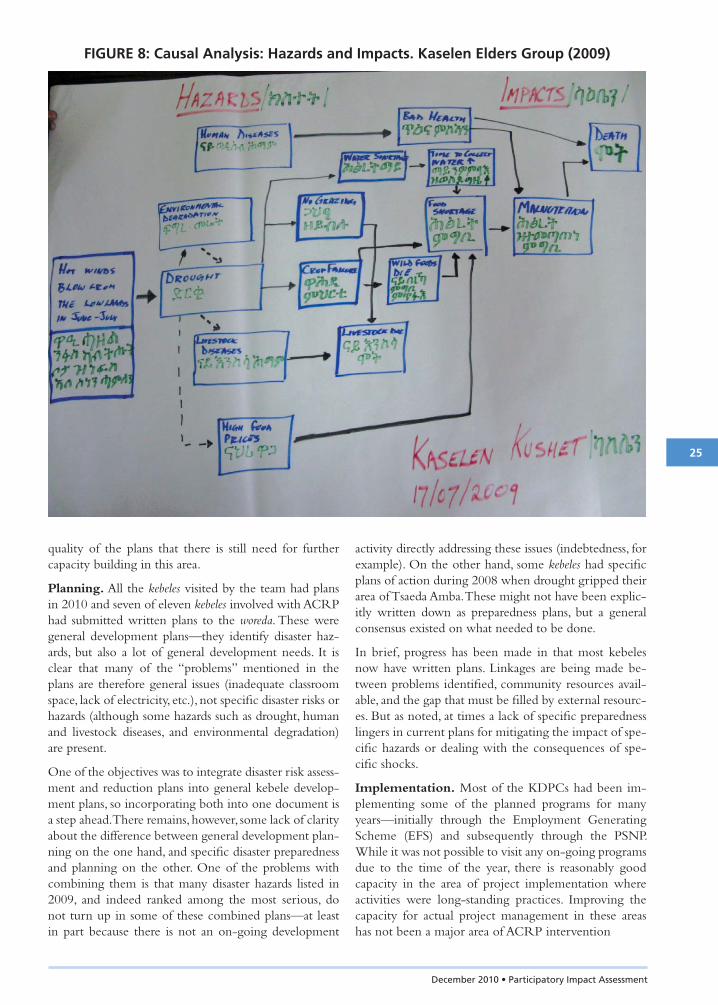
December 2010 • Participatory Impact Assessment
25
FIGURE 8: Causal Analysis: Hazards and Impacts. Kaselen Elders Group (2009)
quality of the plans that there is still need for further capacity building in this area.
Planning. All the kebeles visited by the team had plans in 2010 and seven of eleven kebeles involved with ACRP had submitted written plans to the woreda. These were general development plans—they identify disaster haz-ards, but also a lot of general development needs. It is clear that many of the “problems” mentioned in the plans are therefore general issues (inadequate classroom space, lack of electricity, etc.), not specifi c disaster risks or hazards (although some hazards such as drought, human and livestock diseases, and environmental degradation) are present.
One of the objectives was to integrate disaster risk assess-ment and reduction plans into general kebele develop-ment plans, so incorporating both into one document is a step ahead. There remains, however, some lack of clarity about the difference between general development plan-ning on the one hand, and specifi c disaster preparedness and planning on the other. One of the problems with combining them is that many disaster hazards listed in 2009, and indeed ranked among the most serious, do not turn up in some of these combined plans—at least in part because there is not an on-going development
activity directly addressing these issues (indebtedness, for example). On the other hand, some kebeles had specifi c plans of action during 2008 when drought gripped their area of Tsaeda Amba. These might not have been explic-itly written down as preparedness plans, but a general consensus existed on what needed to be done.
In brief, progress has been made in that most kebeles now have written plans. Linkages are being made be-tween problems identifi ed, community resources avail-able, and the gap that must be fi lled by external resourc-es. But as noted, at times a lack of specifi c preparedness lingers in current plans for mitigating the impact of spe-cifi c hazards or dealing with the consequences of spe-cifi c shocks.
Implementation. Most of the KDPCs had been im-plementing some of the planned programs for many years—initially through the Employment Generating Scheme (EFS) and subsequently through the PSNP. While it was not possible to visit any on-going programs due to the time of the year, there is reasonably good capacity in the area of project implementation where activities were long-standing practices. Improving the capacity for actual project management in these areas has not been a major area of ACRP intervention

Feinstein International Center
26
is destocking, or deliberately downsizing livestock herds in the face of drought or other threat. There is no base-line information on either of these practices. And while almost all groups report destocking as an area in which “awareness” has been changed, few groups reported ac-tual changed behavior. Livelihoods diversifi cation is a third area in which people report substantive changes in awareness, although data collected by the two rounds of both qualitative and qualitative methods show no sig-nifi cant difference in the degree of livelihood diversifi -cation in the short time frame of this study.
A fourth area of awareness-raising—and perhaps the one where awareness itself is the most critical—is aware-ness and recognition of new hazards. In this case, the two hazards that came to light in the course of the study that were previously not part of any awareness-raising campaign were indebtedness and the Cochineal insect infestation problem. The latter has yet to reach Tsaeda Amba, so in some ways it is not surprising that people are not aware of it (even some ACRP staff were not aware of it). But the problem of indebtedness is already affecting people in Tsaeda Amba—again, lack of detailed baseline information prior to the study makes it hard to reach any conclusions. The survey results indicate the number of households taking out loans during the two rounds of the household survey, 2009 and 2010, dropped from 54 percent in 2009 to 39 percent in 2010 (Annex 2). But it is the qualitative evidence that is the most worrying about the practice of borrowing, particularly during bad years. While the qualitative methods don’t permit numeric extrapolation, taking a loan for an in-vestment in either crops or livestock but then suffering losses (especially in the case of livestock) and having to liquidate other major assets to repay the loan, was a story that the study team heard repeatedly in all of the study areas. Further quantitative measurement will give a bet-ter estimate of this issue. Credit is clearly one means to improved livelihoods, but the qualitative evidence sug-gests a very mixed record in recent years. A program designed to help communities and households manage risk better needs to focus on this issue closely, because the implications are not straightforward or formulaic.
In newer programmatic areas, capacity was less clear. Managing destocking is one such example. While this was mentioned in nearly every KDPC interview, when asked for specifi cs, it was clear that most KDPCs did not yet have the capacity to manage or facilitate destocking, in many cases they didn’t agree among themselves as to what constitutes “destocking” and/or did not agree that it should be done. Many KDPC members and commu-nity members in general agreed with the sentiments of one respondent who noted that selling animals “is not in our interest, so we usually don’t do it unless we have to.” This continued to be the case in 2010. But with graphic results of the asset losses during 2009, this could be an important area of focus for further risk reduction work in Tsaeda Amba
Monitoring and evaluation of interventions was the other area in which KDPC capacity was noted in 2009 as low. Few changes were noted in this area in 2010—indeed it was not noted by KDPCs as a priority at this stage.
Other impacts and linkages. The planning function at the local level is focused at the kebele committee. At the woreda level, there are several linkages. As noted by the 2009 report, a woreda Early Warning committee re-ceives and reviews reports from KDPCs twice a month. This has led to better planning, better division of la-bor and better management. The committee is aware of any new national policy, but the impact of the policy has yet to be felt in Tsaeda Amba. ACRP has chosen to work primarily at the level of strengthening the capacity of the KDPCs and the link with the woreda. Accord-ing to both kebele and woreda offi cials, this link has been strengthened.
Awareness raising and behavior change. One of the major objectives of ACRP was awareness rising. There is generally good awareness of most of the issues raised in the interviews that focused specifi cally on hazards and risk. In the timeframe of this study, it is diffi cult to attri-bute changes in behavior to changes in awareness. Some constraints on behavioral change can be better attrib-uted to institutional factors than to awareness-raising. One of these is “harmful traditional practices.” Another

December 2010 • Participatory Impact Assessment
27
Section 4. Conclusions ofthe Two-Year study
Objectives of the study
As noted in the introduction, this study had fi ve overall objectives:
• Assess the impact of a specifi c, community-driven Disaster Risk Reduction program in Northern Ethiopia.
• Assess change in livelihoods over time, including an understanding of the dynamics of changes in liveli-hood assets, strategies, and outcomes in response to repeated shocks.
• Understand the major factors driving these chang-es—all causal factors including but not limited to interventions of ACRP.
• Understand community perceptions of hazards and risk.
• Develop the means to measure the impact of DRR intervention in chronically risk prone areas.
• Provide feedback to project management in the de-velopment of a risk management strategy.
This report has discussed the documented impacts of ACRP (Objective 1) and has assessed the change in livelihood assets, strategies, and outcomes (Objective 2). Understanding community perceptions of risk was a major purpose of the fi rst report (Maxwell et al. 2009) and these were briefl y recounted in Section 1. Many of the indicators developed to capture change (Objective 5) are evidenced in this report, although space did not allow the detailed discussion of these here. These will be described and analyzed in separate forthcoming peer-reviewed articles for broader dissemination. Feedback to project management (Objective 6) has been conducted through formal reports, as well as direct memos and in-formal discussions throughout the course of the study. Understanding causal factors outside the management purview of ACRP was the major purpose of the Janu-ary 2010 fi eldwork (Coates et al. 2010). That report ana-lyzed the institutional and policy context and it is briefl y summarized below.
Two general research questions guided this study: The fi rst was whether specifi c interventions can reduce or
mitigate the risk of hazards and enable people to prepare for, mitigate, and recover from the shocks and become more resilient to future shocks. The second was how communities perceive risk and thresholds of overcome the risk of repeated humanitarian emergencies.
The study team and the management of ACRP (and World Vision more broadly) are in general agreement that the time frame of the current study was inadequate to address the fi rst question fully. Although some trends were noted, and an excellent baseline has been con-ducted for future monitoring, the trends were distinctly mixed and attribution of any of the outcomes to ACRP activities is diffi cult. On the other hand, communities were able to articulate their perceptions of risk and their views of the livelihood characteristics—especially asset thresholds—they view necessary to overcome persistent risks. It is less clear, particularly in light of some of the institutional constraints, that these levels can be achieved in the short term. This implies that preparedness for and the capacity to respond to shocks will continue to be important in the short to medium term. But it is also clear that greater resilience in the medium to longer term is of equal or greater importance
Institutional factors infl uencing livelihoods
Informants attributed little of their current livelihood circumstances—for better or worse—directly to ACRP interventions. Research in January 2010 highlighted the major institutional and environmental constraints to livelihoods in Tsaeda Amba (Coates et al. 2010). Very briefl y, the areas highlighted in that report included ac-cess to land and natural resources (and the efforts made to address land and natural resource conservation); access to credit (and the links between credit and vulnerabil-ity reduction which can be both positive and negative); access to markets and market; traditional institutions and practices; labor, migration, and remittances (and the contribution of each to primary agricultural livelihood systems); gender and social relations; local government; and access to the Productive Safety Net Programme (PSNP). That research also detailed major changes in the national policy environment in Ethiopia.
Land, land access, and land quality. The small size of land holdings, the limits on land transactions, and the
Feinstein International Center
28
some individuals in a household might receive benefi ts but not others. This tended to distribute the benefi ts of the PSNP as widely as possible, but also meant that few households received the intended full benefi ts. In 2010, the targeting procedures were changed, meaning that fewer households were included in the PSNP, but more resources were targeted to those who were included. This is refl ected in the data above on food and income sources. It appears that other programs have stepped in to fi ll the void left in some households by the with-drawal of PSNP resources.
Changes in key national policies
A National Disaster Management policy is now be-ing considered by the cabinet of the Government of Ethiopia. It is expected to be implemented beginning sometime later in 2010, but many of its provisions have already started to take effect. The overall objective of the new National DRM policy is to “reduce the risk and impact of disasters through the establishment of a compressive disaster risk management system within the context of sustainable development.”6 Other elements of the objectives of the new policy include shifting the focus to proactive measures; to save lives and livelihoods during crises and move quickly to recovery and reha-bilitation in their aftermath; to promote resilience; and to ensure mainstreaming of DRM practices across gov-ernment and partners.
Under the new policy, the emphasis shifts from “disas-ter response” to “disaster risk management” implying a much more pro-active approach to dealing with hazards than in the past—in other words, hazards and risks are to be managed in such a way that they do not manifest themselves in disasters. This is a major step forward in promoting DRR in Ethiopia.
Disaster risk fi nancing is planned to become the major mechanism of early response. This will be triggered by indicators that track both major hazards (including rain-fall, but also including measures of livelihood outcome), and these indicators will be tied to pre-allocated funding for response by means of an index. This ensures that a certain level of crisis triggers the response mechanism, rather than the old way of declaring a disaster, conduct-ing ex-post needs assessments, and then appealing for re-sponse funding. Improved early warning will be based on new vulnerability profi les and hazard monitoring, tied directly to the index just described.
Responsibility for policy, management and oversight rests primarily with government, but involves many partners, including donors, UN agencies, international
absence of any major land redistribution subsequent to the redistribution held in the wake of the current gov-ernment coming to power in 1991, have all made access to land for primary agricultural livelihoods a major con-straint. Land is used continuously, resulting in soil-quali-ty degradation problems, but more importantly, a class of landless youth is growing for whom livelihood choices are a major constraint. While soil and water conserva-tions programs are an important part of DRR programs, they cannot directly address this issue. And the issue of land access is an increasingly important constraint par-ticularly to younger community members.
Credit. Access to credit and, through credit, to produc-tion-enhancing technology, has been a mainstay of the overall development strategy of the Ethiopian Govern-ment in Tigray, and it has a history of many successes. However, in the context of 2009–2010, this study found very high costs of borrowing compared to the earnings from saving. And the high cost of defaulting on loans is leading to behaviors that can undermine livelihoods—mainly the selling of major assets to avoid the stigma and high cost of defaulting on a loan, and the avoid-ance of credit-led interventions altogether. Hence one of the strategies intended to improve livelihoods has the potential to signifi cantly undermine the livelihoods of one group of people. This has signifi cant implications for further study, but also for programming. Offering rural fi nancial services that are savings-led rather than credit-led is one possible solution. Rainfall-indexed insurance schemes are one approach to micro-credit that could protect against losses to at least one major hazard—drought—and thus protect against the risk of credit default.
Traditional practices and institutions. Recogniz-ing and building on traditional institutions could address some of these concerns. But the analysis of traditional institutions reveals that some are potentially helpful in reducing risks, particularly uqub and idir—traditional sav-ings groups and ceremony groups (to help in paying for such unexpected events as funerals)—but some practices such as traditional feast days can be detrimental. These are both already addressed by ACRP interventions. The degree of behavior change regarding traditional prac-tices is very diffi cult to judge or measure. People report fewer ceremonies, and less wasteful practices, but there is a heavy expectation that they would report this way. There is no clear baseline on such practices, so even if observations could be made in the fi eld, there would be little basis for comparison.
Access to the PSNP. In theory, households are select-ed into the PSNP based on certain poverty criteria and according to woreda statistics half of the population in the woreda is included in the PSNP. However, in the past, targeting was done on an individual basis, meaning that
6 This was taken from interview notes—the wording in the policy document might differ. The draft policy is not yet in the public domain.

December 2010 • Participatory Impact Assessment
29
the whole country to analyze underlying causes of di-saster risk and DRR interventions for each woreda, and design early warning indicators that can trigger a re-sponse. Building on work done by the LIU, early warn-ing thresholds will note both a “survival threshold” and a “livelihood protection threshold” of response. While the livelihood protection threshold is obviously the ob-jective for DRM programs, these thresholds also serve a role in the allocation of limited resources in the event of a major disaster.
Changes
Measuring change in livelihoods by defi nition a slow process. Many of the interventions of ACRP and its woreda partners require signifi cant time to be imple-mented, and more time before measurable change can be noted. Most of the changes noted by the two rounds of qualitative and quantitative research by the Tufts team refl ect changes in the agricultural seasons, not the im-pact of ACRP or other programmatic inputs. Some of the short-term changes, particularly in terms of levels of household assets held, were negative—that is, levels of assets were lower in 2010 than in 2009.
Section 2 of this report detailed changes in livelihoods over the two years of this study. Both positive and nega-tive directions were documented. The combined impact of the food price crisis and the drought resulted in the loss of assets, although these losses were not even, and in many ways appear to have affected wealthier households more adversely than poorer households.
The results of the study indicate several areas of program impact. The most signifi cant of these is the capacity built at kebele community grass roots level that has improved early warning report and awareness through established kebele disaster-preparedness committee.
Recommendations to ACRP
The fi rst phase of ACRP is soon ending, but it is antici-pated that there will be follow on activities related to a DRR strategy in Tsaeda Amba. The following recom-mendations grow out of this research:
1. Gradually shift focus from awareness-rais-ing to more specifi c interventions. There is evidence of a generally good level of awareness among the population of the ACRP operational area, but it is less clear that awareness-raising alone leads to signifi cant behavior change. Going for-ward, ACRP should gradually shift its focus to changing actual behaviors. Programmatically, this could take several practical forms.
a. Emphasis on proactive, commercial destocking led by KDPCs, rather than passive advice-giving. There is
and Ethiopian NGOs, and increasingly, local commu-nities (which is where KDPCs and the link to ACRP is most pronounced) and private sector actors within Ethiopia.
The DRM policy envisions activities in three phases or categories including pre-disaster, during disaster, and post-disaster. The pre-disaster phase includes the pre-vention of shocks and the mitigation of shocks in the event that they happen. A third element of the pre-crisis phase is good emergency preparedness. These will all be incorporated into development planning. Declaring an emergency is the responsibility of the Federal Disaster Risk Management Council. More localized crises can be declared by the same authority at the regional level. Emergencies are to be declared when the capacities of local authorities to cope have been overwhelmed by events.
While disaster response in the past relied heavily on ex-ternal contributions, this new policy prioritizes national or internal resources to fund prevention, mitigation, preparedness, response, and rehabilitation, to the extent possible. Protecting against relatively predictable shocks and vulnerabilities will be incorporated into govern-ment recurrent development budgets. Large-scale pro-grams and response would still have a role for donors and international agencies. Finally, one of the steps in the new policy is to ensure that there is enabling legis-lation for the DRM policy, and that it strengthens the mechanisms of accountability.
Since 2004 the Government of Ethiopia and a set of donors, led by the World Bank and WFP, have been de-signing a drought shock scale-up of the PSNP, based on a national index, with localized early warning sys-tems providing information. Under the new policy, risk management will be more clearly linked to contingen-cy planning, capacity building, and more robust early warning systems. A new triggering index will be based on the Water Requirements Satisfaction Index (WRSI) and will have some livelihoods outcomes indicators as well. These indicators form the backbone of the LEAP (Livelihoods, Early Assessment, and Protection) index as the basis for triggering a contingency-risk fi nancing fund. The LEAP index will coordinate the key compo-nents of a DRM framework including early warning, local contingency planning, and capacity building.
Information systems are expected to be improved, and linked to an indexing system that will reduce the time lag in responding to crises. Under the current system, a major effort at livelihoods mapping was carried out by the DPPA through its Livelihoods Integration Unit (LIU). This has resulted in baseline assessments for all the drought-prone woredas in Ethiopia. Under the new policy, woreda vulnerability profi les are to be developed which will build on these baselines and extend them to

Feinstein International Center
30
evidence that efforts to make the connection between livestock producers and commercial livestock traders during drought can have a signifi cant impact on household income, con-sumption, and asset protection.7 But these pro-grams require more than just awareness-raising. The process described by Abebe et al. (2008) encourages not only intensive involvement in facilitating meetings and negotiations between communities and traders. It also encourages careful selection of animals to be destocked and kept, and provision of inputs (both fodder and medicines) to ensure that the core breed-ing herd survives and is able to reproduce again as soon as the drought ends.
b. Introduction of improved technologies and varieties. There are new varieties of crops being devel-oped all the time, many of which are more drought resistant than landrace varieties. In the face of persistent drought, and with evidence mounting that climate trends suggest increas-ingly variable weather patterns in the future, working to introduce these new varieties is a critical part of risk reduction.
c. Livelihood diversifi cation. It is clear that diversi-fying the sources of income already has well recognized benefi ts in Tsaeda Amba. Future programming can reinforce this diversifi ca-tion. Part of this might have to do with ac-cess to micro-fi nance services—not only credit (which is already widely available) but espe-cially savings-led interventions and possibly insurance. Diversifi cation can also be linked to more sustainable natural resource management, enabling income streams from natural resourc-es—particularly for households of younger members of the community who have not inherited any land. And it could be in value-added activities to the primary production already taking place (honey processing, butter production, etc.). New income-generating ac-tivities are urgently needed for both poverty reduction and resilience in the face of repeated hazards.
d. Future training should focus on these areas. All this is not to imply that there is no role for train-ing—indeed there is a need for training. But it should be on more focused, specifi c improve-ments, rather than awareness-raising per se.
2. Continue to emphasize focus on capacity building. Building local capacity—at both the woreda and the kebele level—has probably been the most important impact of ACRP. While good progress has been made, more could be done. Em-phasis on planning and improved management at the kebele level is still an important area to focus on, and one from which a larger strategy of en-gagement could be based.
a. Focus on improved analysis. And in particular, on the link of analysis to action. New “response analysis” tools are being developed all the time. Introducing training that relies on these tools could help to link analysis to action.
b. Differentiate disaster prevention and preparedness from general development planning. It is important to incorporate DRR into general development planning, but as of the moment, there is little to distinguish hazards from general needs in kebele-level plans. This makes disaster prepared-ness planning somewhat haphazard. In general Community Disaster Preparedness Plans should focus on specifi c hazards, not general needs.
3. ACRP objectives should be incorporated into integrated development programs. While there is still a need to differentiate hazards from needs at the level of specifi cs, there is also the more general need to incorporate risk reduc-tion and preparedness into broader development planning. The planning of preparedness, response, risk reduction and general development should be separate categories but part of the same overall plan—at both the woreda and kebele levels
4. Address specifi c constraints. Several specifi c constraints were identifi ed. These could be ad-dressed by greater geographic focus (perhaps only three or four kebeles, rather than eleven), by cre-ating the time and space for staff to really focus on a limited number of objectives, and by pro-viding incentives for staff to see an entire project through, to reduce staff turnover.
5. Treat ACRP as a learning laboratory. ACRP is a project, but also an important cru-cible in which signifi cant programmatic learning has taken place. Treating the project as a learn-ing laboratory—as well as the means to imple-ment improved programming—will increase the overall value of future programming. This means encouraging staff to experiment with local inno-vation, encourage them to keep on top of emerg-ing threats and hazards, and to think of inventive ways of addressing these threats. One example of this is the micro-insurance effort described in the
7 See Abebe, et al. 2008. “Impact of a commercial destocking relief intervention in Moyale district, southern Ethiopia.” See also the LEGS manual.

December 2010 • Participatory Impact Assessment
31
fi rst report, aimed at reducing the risk of default, indebtedness, and asset loss resulting from failed attempts with credit-based livelihood promotion interventions, or drought.
Overall, a DRR strategy must address the various ele-ments of the conceptual framework from the original proposal. These elements include the following:
1. Reduce the occurrence of adverse events.
2. Reduce the risk of negative human outcome through reducing exposure to adverse events that continue to occur.
3. Transfer risk within communities. Where shocks occur, the imperative is to improve the capacity of communities to deal with idiosyncratic risk.
4. Transfer risk or shifting some of the burden of a shock that affects most people in a community out of the local system.
5. Enable prudent risk taking.
Table 15 (reproduced from the 2009 report) depicts possible places where ACRP interventions address known hazards. Transferring risks within communities is all about dealing with idiosyncratic risk, and it is clear that most DRR activities in Ethiopia are (rightfully) fo-cused on covariate risk, particularly on drought. But a comprehensive risk management and reduction strategy would differentiate these two kinds of risk and deal with them separately. The Productive Safety Net Programme has provided the means for chronically at-risk popula-tions to survive back-to-back bad agricultural seasons without a major humanitarian emergency. ACRP has made good progress on capacity building and aware-ness-raising for resilience and risk management. To take this work to the next level, the capacity building and awareness raising can be paired with interventions that successfully and sustainably reduce these risks, as out-lined in Table 20. This could be taken as a template for planning future activities under a renewed or expanded ACRP program.
TABLE 15. DRR Strategies and Hazard Categories in Tsaeda Amba
DRR Strategies Categories of Hazard
ClimaticNatural-Resource Economic Disease Demographic Social
1. Reducing the occurrence of adverse events
? Y ? Y Y Y
2. Reducing risk of negative human outcome
Y Y ? Y Y Y
3. Transferringrisk withincommunities
Small-scale N ? N N Y
4. Transferringrisk outsidecommunities
Y ? Y N Y ?
5. Enabling prudent risk taking Y Y Y Y Y ?
Y = Interventions existN = Interventions probably do not exist? = Not clear whether existing interventions address the problem, or not

Feinstein International Center
32
References
Abebe, Dawit, Adrian Cullis, Andy Catley, Yacob Aklilu, Gedlu Mekonnen, and Yodit Ghebrechirstos. 2008. “Impact of a commercial destocking relief intervention in Moyale district, southern Ethiopia.” Disasters 32(2): 167–189.
Boudreau, Tanya. 2009. Solving the Risk Equation. Network Paper No. 66. Humanitarian Practice Network. London: Overseas Development Institute.
Catley, Andrew, John Burns, Dawit Abebe, and Omemo Suji. 2008. Participatory Impact Assessment: A Guide for Practitioners. Medford MA: Feinstein International Center.
Coates, Jennifer, Daniel Maxwell, Girum Tadesse, Shimelis Hailu, Wolde Gebreal Zewold, Abraha Gebrekiros. 2010. Institutional Assessment Report: Africa Community Resilience Project. Tsaeda Amba Woreda, Eastern Tigray, Ethiopia. Feinstein International Center Report. Medford MA: Tufts University.
Devereux, Stephen, and Rachel Sabates-Wheeler. 2006. Ethiopia’s Productive Safety Net Programme (PSNP). Trends in PSNP Transfers within Targeted Households. Brighton: Institute for Development Studies.
Dilly, Max, and Tanya Boudreau. 2001. “Coming to terms with vulnerability: A critique of the food security defi nition.” Food Policy 26(3): 229–247.
Disaster Preparedness and Prevention Agency. 2008. Saesie Tsaeda Amba Woreda. Report from the Livelihoods Information Unit of the Disaster Preparedness and Prevention Agency (DPPA). Addis Ababa: DPPA.
Hess Ulrich, et al. 2006. Ethiopia: Integrated Risk Financing to Protect Livelihoods and Foster Development. WFP, World Bank, and DFID Study, Discussion Paper.
Gilligan, Daniel, John Hoddinott, and Alemayehu Seyoum Taffesse. 2008. The Impact of Ethiopia’s Productive Safety Net Programme and its Linkages. IFPRI Discussion Paper 00839. Washington: IFPRI.
Government of Ethiopia. 2006. Ethiopia: Building on Progress. A Plan for Accelerated and Sustained Development to End Poverty (PASDEP). Addis Ababa: GFDRE.
Lautze, Sue, et al. 2003. Risk and Vulnerability in Ethiopia: Learning from the Past, Responding to the Present, Preparing for the Future. Medford, MA: Feinstein International Center.
LEGS. 2008. Livestock Emergency Guidelines and Standards. Available from http://www.livestock-emergency.net/.
Maxwell, Daniel, Girum Tadesse, Mary Mukwavi, Shimelis Hailu, Wolde Gebreal Zewold, Abraha Gebrekiros. 2009. Baseline Report: Africa Community Resilience Project. Tsaeda Amba Woreda, Eastern Tigray, Ethiopia. Feinstein International Center Report. Medford MA: Tufts University.
Oxfam America. 2009. Horn of Africa Transfer for Adaptation (Harita). Boston: Oxfam America.
World Bank and World Food Programme. 2008. “Livelihoods—Early Assessments—Protection (LEAP): LEAP livelihood stress and livelihood protection cost index. A short User Guide.” Addis Ababa: World Bank and WFP.
UN International Strategy for Disaster Reduction. 2005. The Hyogo Framework for Action 2005–2015: Building the Resilience of Nations and Communities to Disasters. Geneva: United Nations International Strategy for Disaster Reduction.

December 2010 • Participatory Impact Assessment
33
Annex 1:A framework for DRR analysis and programming
The generally agreed policy framework for DRR is the Hyogo Framework for Action. This en-compasses fi ve main points: ensuring that DRR
is a national and a local priority with appropriate insti-tutional linkages; identifying risks and enhancing early warning; promoting education and the use of scientifi c knowledge to reduce vulnerability; addressing underly-ing risk factors; and strengthening preparedness (UNIS-DR 2005). This framework has also been adopted by World Vision as its over-arching framework for DRR as well. In recent work on risk analysis (UN 2006, Dilly and Boudreau 2001), the proposed conceptual frame-work considers risk as the likelihood of a negative outcome in terms of human lives and livelihoods, and defi nes it as some function of the hazards that exist in the that environment and people’s vulnerability—or the combination of their exposure to those risks and their ability to cope with their consequences:
R = ƒ (H, V). Different hazards require different means of reducing risk. Some frameworks refer to risk reduction (the ex ante prevention of adverse events); risk mitigation (reducing the impact during an adverse event) and risk coping (the ex post limitation of the negative impact of an event that has already occurred). This leads to a clas-sifi cation of different risk-addressing or reducing activities that follows this schema, but breaks out risk according to whether it affects entire communities, or only some households in communities. 1. Reducing the occurrence of adverse events. This
includes measures to prevent or reduce the risk of a particular shock occurring. This would include, for example, reducing the risk of fl ooding through soil and water conservation—an area in which substan-tial investment has already been made. Not all haz-ards can be prevented, however.
2. Reducing risk of negative outcome through re-ducing exposure to adverse events that occur. For shocks that cannot be prevented, reducing the impact of shocks is critical. This would include, for example, reducing the impact of drought on through livelihoods diversifi cation to include activities that are not dependent on rainfall; promoting drought resistant technology, such as short-season seeds or other drought resistant crops; or protecting assets
such as livestock through commercial off-take at the outset of a drought.
3. Transferring risk within communities. Where shocks occur, the fi rst imperative is to improve the capacity of communities to deal with idiosyncratic risk (af-fecting only individuals or households with specifi c characteristics), through support for mechanisms that effectively share overall risk at the local level. This includes, for example, the introduction of savings groups or promotion of indigenous social networks, such as idirs or traditional funeral societies that help to spread the risks and the costs of adverse events.
4. Transferring risk or shifting some of the burden of a shock that affects most people in a com-munity out of the local system. A second impera-tive is improving community capacity to deal with covariate risk (affecting nearly everyone without respect to specifi c characteristics). This requires as-sistance from outside the local community. But this also includes community-based early warning and emergency preparedness. In the case of major hazards like drought, it might also include weather-indexed insurance at the national or regional level that is trig-gered by a rainfall index or some other combination of factors (Hess et al. 2006, World Bank 2008).
5. Prudent risk taking. Lastly, recent work has shown that while reducing risk is imperative, in order to overcome some forms of chronic vulnerability, households and communities have to take certain kinds of risk—most prominently investment in dif-ferent kinds of productive livelihood strategies. For example, in the Tsaeda Amba context, indebtedness is a serious risk factor that households do their best to avoid, but at the same time, credit is one of the few ways to improve livelihood options, and credit is an integral part of “household package” approaches to graduation from the Productive Safety Net Program (PSNP). Determining what is acceptable, prudent risk-taking to improve livelihoods possibilities, and reducing other kinds of risks to make this necessary risk taking possible, presents both analytical and pro-grammatic challenges that have yet to be compre-hensively addressed (Oxfam, 2009).

Feinstein International Center
34
Annex 2:Statistical results of second household surveyround in June2010 and comparison with 2009
The tables in this annex present a summary of the sta-tistical information gathered during the household survey in June 2010, and a comparison with baseline conditions recorded in May and June 2009. The tables presented here include 2009–2010 comparisons of the following:
1. Basic descriptive statistics of HH characteristics (size, Sex of HHH, education of HHH)
2. Measures of income sources and assets at house-hold level (by gender of household head, by liveli-hood zone and by income group—using reported income fi gures)
3. Assets (land and livestock) and comparison of pro-portions by wealth group, gender and livelihood zone
4. Measure of livelihood diversifi cation (number of reported income sources and number of house-holds reporting each)
5. Water sources and distance
6. Savings and indebtedness
7. Current food security status: DD, CSI and HFIAS
8. Disaster management results
9. Impact of disasters
There is a discussion of the comparison between these results and those of the participatory livelihoods baseline focus groups in the main report.
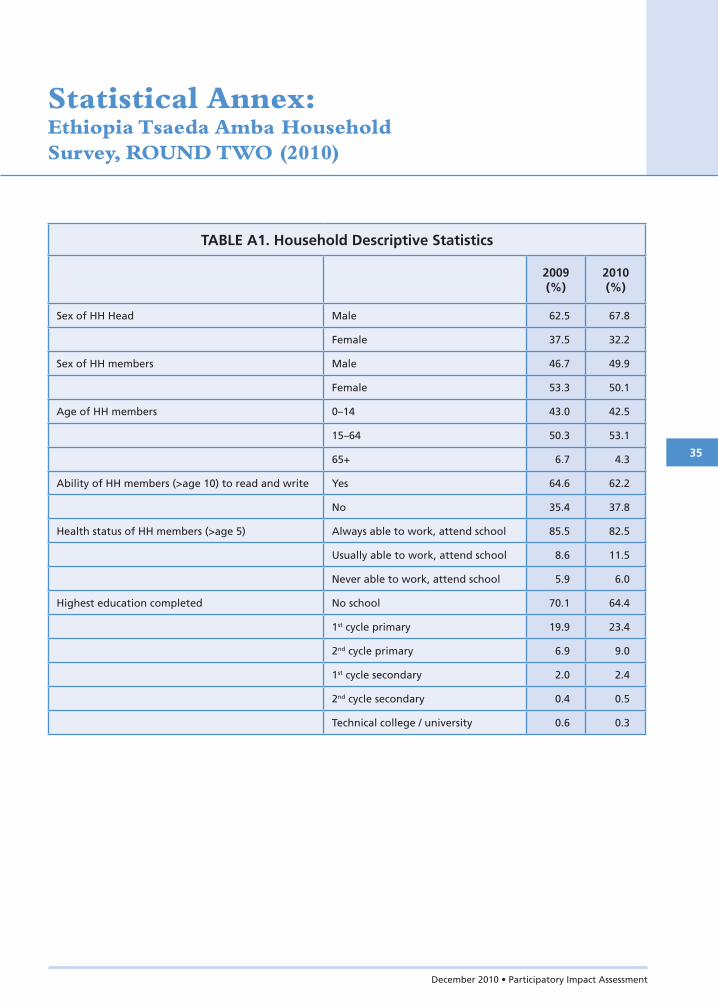
December 2010 • Participatory Impact Assessment
35
Statistical Annex:Ethiopia Tsaeda Amba HouseholdSurvey, ROUND TWO (2010)
TABLE A1. Household Descriptive Statistics
2009(%)
2010(%)
Sex of HH Head Male 62.5 67.8
Female 37.5 32.2
Sex of HH members Male 46.7 49.9
Female 53.3 50.1
Age of HH members 0–14 43.0 42.5
15–64 50.3 53.1
65+ 6.7 4.3
Ability of HH members (>age 10) to read and write Yes 64.6 62.2
No 35.4 37.8
Health status of HH members (>age 5) Always able to work, attend school 85.5 82.5
Usually able to work, attend school 8.6 11.5
Never able to work, attend school 5.9 6.0
Highest education completed No school 70.1 64.4
1st cycle primary 19.9 23.4
2nd cycle primary 6.9 9.0
1st cycle secondary 2.0 2.4
2nd cycle secondary 0.4 0.5
Technical college / university 0.6 0.3

Feinstein International Center
36
TABLE A2a. Household Income Sources and Assets
Totals By sex of HH head
2009 2010
2009 2010 Male(n=250)
Female (n=150)
Male(n=265)
Female(n=135)
Total meanincome (ETB)
1645 1460 1951 1137 1693 1003
Source of income(%—percent refers to % of HHs reporting source)
sales of own agricultural products 18.0 43.5 20.0 14.7 43.8 43.0
sales of livestock 54.8 26.5 59.6 46.7 25.3 28.9
sales of livestock products 6.0 8.0 5.6 6.7 9.8 4.4
sales of honey 1.0 0.3 1.2 0.7 0.4 0.0
sales of wild products 3.2 0.3 2.8 4.0 0.4 0.0
farm labor 1.5 1.8 1.2 2.0 2.6 0.0
non-farm labor 3.5 3.0 3.2 4.0 3.8 1.5
petty trade (specify goods) 1.0 1.5 1.2 0.7 1.9 0.7
own business 6.5 5.8 8.0 4.0 7.2 3.0
work in another household 0.0 0.0 0.0 0.0 0.0 0.0
professional/ civil servant 2.2 0.5 2.8 1.3 0.8 0.0
productive safety nets program (PSNP) 89.2 25.3 88.0 91.3 25.7 24.4
other food for work or cash for work program 4.5 3.0 5.2 3.3 4.2 0.7
remittances 4.8 4.0 5.2 4.0 3.4 5.2
other 0.5 0.8 0.0

December 2010 • Participatory Impact Assessment
37
TABLE A2b. Household Income Sources and Assets
By livelihood zone
2009 2010
Atsbi-Wonberta Highlands
(n=80)
Eastern Plateau (n=300)
Irob Mountains
(n=20)
Atsbi-Wonberta Highlands
(n=100)
Eastern Plateau (n=280)
Irob Mountains
(n=20)
Total meanincome (ETB)
1506 1702 1348 1298 1512 1540
Source of income(%—percent refers to % of HHs reporting source)
sales of ownagricultural products 22.5 18.0 0.0 43.0 45.7 15.0
sales of livestock 51.2 56.0 50.0 28.0 25.4 35.0
sales of livestockproducts 3.8 7.0 0.0 4.0 9.6 5.0
sales of honey 2.5 0.7 0.0 1.0 0.0 0.0
sales of wild products 2.5 3.7 0.0 0.0 0.4 0.0
farm labor 1.2 1.7 0.0 1.0 2.1 0.0
non-farm labor 5.0 3.3 0.0 4.0 2.5 5.0
petty trade(specify goods) 0.0 1.3 0.0 1.0 1.4 5.0
own business 1.2 8.3 0.0 3.0 6.1 15.0
work in anotherhousehold 0.0 0.0 0.0 0.0 0.0 0.0
professional/civil servant 0.0 3.0 0.0 0.0 0.4 5.0
productive safetynets program (PSNP) 95.0 87.0 100.0 26.0 25.0 25.0
other food for work orcash for work program 3.8 3.3 25.0 2.0 3.6 0.0
remittances 7.5 4.0 5.0 5.0 2.9 15.0
other 1.0 0.4 0.0

Feinstein International Center
38
TABLE A2c. Household Income Sources and Assets
By household wealth group
2009 2010
Very Poor: <1650 ETB
(n=256)
Poor: 1650–2249 ETB
(n=61)
Middle Income: 2250–2999 ETB
(n=41)
Better-off:
3000+ ETB
(n=42)
Very Poor: <1650 ETB
(n=282)
Poor: 1650–2249 ETB
(n=45)
Middle Income: 2250–2999 ETB
(n=26)
Better-off:
3000+ ETB
(n=47)
Total meanincome (ETB)
835 1890 2568 5261 805 1900 2583 4353
Source of income(%—percent refersto % of HHs reporting source)
sales of own agricultural products 16.0 19.7 30.0 16.3 45.4 46.7 34.6 34.0
sales of livestock 41.4 75.4 80.0 81.4 35.0 33.3 42.3 25.5
sales of livestock products 7.0 4.9 2.5 4.7 5.0 8.9 7.7 8.5
sales of honey 0.8 0.0 2.5 2.3 0.0 0.0 0.0 0.0
sales of wild products 2.7 1.6 0.0 11.6 0.0 0.0 0.0 0.0
farm labor 1.2 4.9 0.0 0.0 0.0 4.4 7.7 4.3
non-farm labor 2.7 4.9 0.0 9.3 0.0 6.7 15.4 2.1
petty trade (specify goods) 0.8 0.0 0.0 0.0 5.0 2.2 0.0 6.4
own business 4.3 8.2 10.0 14.0 15.0 2.2 11.5 19.1
work in another household 0.0 0.0 0.0 0.0 0.0 0.0 0.0 0.0
professional/civil servant 0.4 3.3 0.0 14.0 5.0 0.0 0.0 2.1
productive safety nets program (PSNP) 92.6 88.5 77.5 81.4 25.0 17.8 30.8 14.9
other food for work or cash for work program 4.7 4.9 5.0 2.3 0.0 6.7 3.8 8.5
remittances 2.7 3.3 15.0 9.3 15.0 4.4 0.0 12.8

December 2010 • Participatory Impact Assessment
39
TABLE A2d. Household Income Sources and Assets
Totals By sex of HH head
2009 2010
2009 2010 Male(n= 250)
Female(n= 150)
Male(n= 265)
Female(n= 135)
Total mean income (ETB) 1645 1460 1951 1137 1693 1003
Mean Income amount by source (ETB)
sales of own agricultural products 88.74 515.57 114.76 45.37 546.40 466.93
sales of livestock584.26 388.59 723.89 351.55 430.18 306.96
sales of livestock products 7.62 25.25 8.64 5.93 19.25 0.00
sales of honey3.00 2.50 3.20 2.67 3.77 0.00
sales of wild products6.36 2.00 6.44 6.23 3.02 0.00
farm labor5.50 27.25 2.20 11.00 41.13 0.00
non-farm labor25.77 46.13 19.90 35.53 60.19 18.52
petty trade (specify goods) 4.75 39.75 5.80 3.00 54.72 7.41
own business62.42 147.27 91.04 14.73 201.91 40.00
work in another household .00 0.00 .00 .00 0.00 0.00
professional/ civil servant 176.96 21.00 262.33 34.67 31.70 0.00
productive safety nets program (PSNP) 553.91 140.36 578.21 513.40 160.34 101.15
other food for work or cash for work program 7.55 13.55 8.80 5.47 19.51 1.85
remittances72.12 76.83 79.20 60.33 95.92 39.33
other10.34 0.88 3.30 22.07 1.32 0.00
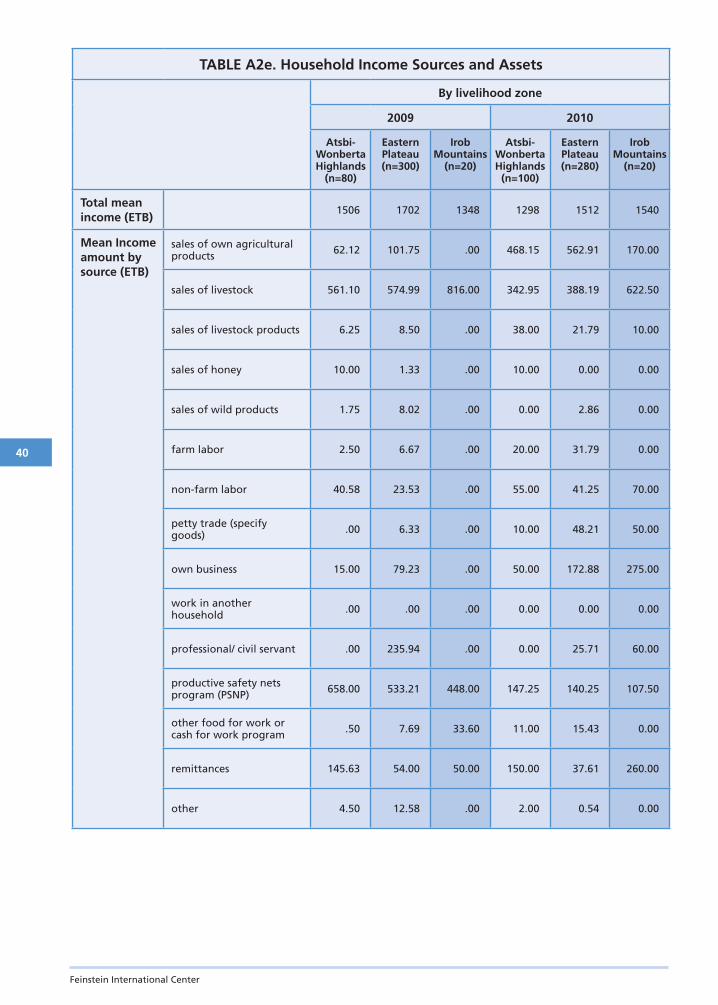
Feinstein International Center
40
TABLE A2e. Household Income Sources and Assets
By livelihood zone
2009 2010
Atsbi-Wonberta Highlands
(n=80)
EasternPlateau(n=300)
IrobMountains
(n=20)
Atsbi-Wonberta Highlands
(n=100)
EasternPlateau(n=280)
IrobMountains
(n=20)
Total mean income (ETB)
1506 1702 1348 1298 1512 1540
Mean Income amount by source (ETB)
sales of own agricultural products 62.12 101.75 .00 468.15 562.91 170.00
sales of livestock 561.10 574.99 816.00 342.95 388.19 622.50
sales of livestock products 6.25 8.50 .00 38.00 21.79 10.00
sales of honey 10.00 1.33 .00 10.00 0.00 0.00
sales of wild products 1.75 8.02 .00 0.00 2.86 0.00
farm labor 2.50 6.67 .00 20.00 31.79 0.00
non-farm labor 40.58 23.53 .00 55.00 41.25 70.00
petty trade (specify goods) .00 6.33 .00 10.00 48.21 50.00
own business 15.00 79.23 .00 50.00 172.88 275.00
work in another household .00 .00 .00 0.00 0.00 0.00
professional/ civil servant .00 235.94 .00 0.00 25.71 60.00
productive safety nets program (PSNP) 658.00 533.21 448.00 147.25 140.25 107.50
other food for work or cash for work program .50 7.69 33.60 11.00 15.43 0.00
remittances 145.63 54.00 50.00 150.00 37.61 260.00
other 4.50 12.58 .00 2.00 0.54 0.00
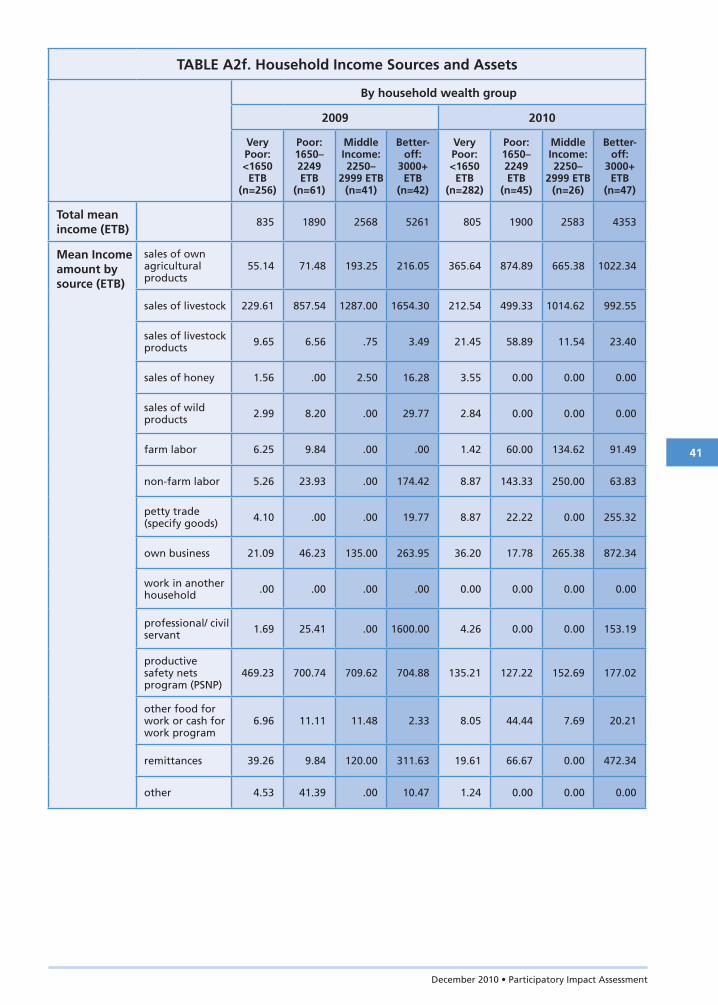
December 2010 • Participatory Impact Assessment
41
TABLE A2f. Household Income Sources and Assets
By household wealth group
2009 2010
VeryPoor: <1650ETB
(n=256)
Poor: 1650–2249ETB
(n=61)
Middle Income: 2250–
2999 ETB (n=41)
Better-off:
3000+ETB
(n=42)
VeryPoor: <1650ETB
(n=282)
Poor: 1650–2249ETB
(n=45)
Middle Income: 2250–
2999 ETB (n=26)
Better-off:
3000+ETB
(n=47)
Total mean income (ETB)
835 1890 2568 5261 805 1900 2583 4353
Mean Income amount by source (ETB)
sales of own agricultural products
55.14 71.48 193.25 216.05 365.64 874.89 665.38 1022.34
sales of livestock 229.61 857.54 1287.00 1654.30 212.54 499.33 1014.62 992.55
sales of livestock products 9.65 6.56 .75 3.49 21.45 58.89 11.54 23.40
sales of honey 1.56 .00 2.50 16.28 3.55 0.00 0.00 0.00
sales of wild products 2.99 8.20 .00 29.77 2.84 0.00 0.00 0.00
farm labor 6.25 9.84 .00 .00 1.42 60.00 134.62 91.49
non-farm labor 5.26 23.93 .00 174.42 8.87 143.33 250.00 63.83
petty trade (specify goods) 4.10 .00 .00 19.77 8.87 22.22 0.00 255.32
own business 21.09 46.23 135.00 263.95 36.20 17.78 265.38 872.34
work in another household .00 .00 .00 .00 0.00 0.00 0.00 0.00
professional/ civil servant 1.69 25.41 .00 1600.00 4.26 0.00 0.00 153.19
productivesafety nets program (PSNP)
469.23 700.74 709.62 704.88 135.21 127.22 152.69 177.02
other food for work or cash for work program
6.96 11.11 11.48 2.33 8.05 44.44 7.69 20.21
remittances 39.26 9.84 120.00 311.63 19.61 66.67 0.00 472.34
other 4.53 41.39 .00 10.47 1.24 0.00 0.00 0.00

Feinstein International Center
42
TABLE A2g. Household Income Sources and Assets
TotalsBy sex of HH head
2009 2010
2009 2010Male
(n=250)Female (n=150)
Male(n=265)
Female(n=135)
Livelihood diversifi cation
# of income sources
1.96 1.24 2.04 1.83 1.30 1.12
House ownership (%) Yes 97.0 97.5 97.2 96.7 97.4 97.8
Iron sheet roofi ng (%) Yes 16.8 18.5 18.1 14.8 18.5 18.8
Access to land(%) Yes 93.8 95.3 93.6 94.0 95.1 95.6
Land owned (timad) Amount 1.77 1.68 1.96 1.46 1.84 1.37
Livestock owned (TLU)
Tropical Livestock Units
2.33 2.32 2.64 1.84 2.66 1.66
TABLE A2h. Household Income Sources and Assets
By livelihood zone
2009 2010
Atsbi-Wonberta Highlands
(n=80)
EasternPlateau(n=300)
IrobMountains
(n=20)
Atsbi-Wonberta Highlands
(n=100)
EasternPlateau(n=280)
IrobMountains
(n=20)
Livelihood diversifi cation
# of income sources
1.96 1.97 1.80 1.19 1.25 1.25
House ownership (%) Yes 97.50 97.30 90.00 99.0 97.5 90.0
Iron sheet roofi ng (%) Yes 5.10 20.70 5.00 1.0 26.4 0.0
Access to land (%) Yes 92.50 94.30 90.00 96.0 95.0 95.0
Land owned (timad) Amount 1.49 1.89 1.15 1.69 1.68 1.74
Livestock owned (TLU) Tropical Livestock Units
2.15 2.45 1.39 2.24 2.39 1.82

December 2010 • Participatory Impact Assessment
43
TABLE A2i. Household Income Sources and Assets
By household wealth group
2009 2010
VeryPoor: <1650ETB
(n=256)
Poor:1650–2249ETB
(n=61)
Middle Income: 2250–2999ETB
(n=41)
Better-off:
3000+ETB
(n=42)
VeryPoor:<1650ETB
(n=282)
Poor:1650–2249ETB
(n=45)
Middle Income: 2250–2999ETB
(n=26)
Better-off:
3000+ETB
(n=47)
Livelihood diversifi cation
# of income sources
1.77 2.20 2.22 2.51 1.17 1.33 1.54 1.38
House ownership(%) Yes 96.90 96.70 97.40 97.7 96.8 100.0 96.2 100.0
Iron sheet roofi ng (%) Yes 17.30 14.80 12.80 20.90 16.0 24.4 26.9 23.4
Access to land(%) Yes 93.80 95.10 100.00 86.00 95.0 100.0 96.2 91.5
Land owned(timad) Amount 1.71 1.75 2.15 1.77 1.61 1.69 2.08 1.93
Livestock owned (TLU)
Tropical Livestock Units
2.13 2.50 2.64 3.03 2.21 3.02 2.60 2.13

Feinstein International Center
44
TABLE A3. Water Sources and Distance
2009 (%) 2010 (%)
Primary HH Water Source
Bore hole (via faucet) 21.1 31.8
Hand-dug well with hand pump 36.3 45.3
Protected spring with faucet or pipe 6.0 2.3
Rainwater surface catchment (protected) 2.0 0.0
River (direct) 9.3 5.3
Unprotected spring 20.6 13.8
Pond/surface water catchment (unprotected) 4.8 1.0
Type oftoilet used
None 11.8 14.8
Wooden standard pit latrine 77.5 74.3
Cementer standard pit latrine 4.8 7.5
Ventilation improved pit latrine 5.0 3.3
Other 1.0 0.0
Year Minimum Maximum Mean MedianStd.
Deviation
Minutes to fetch water from primary water source
2009 1 375 35.28 20 55.067
2010 0 240 41.21 30.0 30.327
TABLE A4. Savings and Debt
2009 (% of HHs) 2010 (% of HHs)
Existence of HH Savings
Yes 1.5 5.3
No 98.5 94.7
Existence of HH Debt
Yes 54.5 39.0
No 45.5 61.0
Source of loans
DECSI/ MFI/DEDEBIT 78.9 80.1
Money lender 0.4 0.6
Friend/neighbor/ relatives 11.8 8.1
Cooperatives 0.4 10.6
Other 8.1 0.6
Reason for loan
To buy food 22.9 8.8
Housing materials expenses 0.4 0.6
To buy agricultural inputs 6.9 18.7
To buy livestock 68.2 70.6
To start new business 0.8 2.5
Health expenses 0.4 0.0
Educational expenses 0.4 0.0

December 2010 • Participatory Impact Assessment
45
TABLE A5a. Food Security Status—FCS (Dietary Diversity)
Year Minimum Maximum MeanStd.
Deviation
Food consumption score (aggregate)
2009 12 98 37.9650 11.46144
2010 10 101 37.4511 17.053
Range 2009 (%) 2010 (%)
Food consumption score (disaggregated)
0–21 10.8 17.5
21.5–35 24.8 36.0
>35 64.5 46.5
2009 2010
MeanStd.
Deviation MeanStd.
Deviation
# of days eating grains in the last week 6.69 0.759 6.62 0.981
# of days eating tubers in the last week 0.42 0.972 1.34 1.829
# of days eating pulses or legumes in the last week 5.06 2.555 4.16 2.633
# of days eating vegetables in the last week 0.44 1.027 1.15 1.604
# of days eating fruits in the last week 0.09 0.429 0.43 1.070
# of days eating meat in the last week 0.87 1.408 0.44 1.181
# of days eating eggs in the last week 0.50 0.896 0.59 1.197
# of days eating fi sh in the last week 0.06 0.612 0.09 0.627
# of days eating dairy products in the last week 0.41 1.271 0.98 1.847
# of days eating sugar or honey in the last week 1.54 2.270 2.89 2.534
# of days eating oils in the last week 4.04 2.676 3.53 2.593

Feinstein International Center
46
TABLE A5b. Food Security—HFIAS*
Year Minimum Maximum MeanStd.
Deviation
HFIAS access score(1 week recall, 0–63 scale)
2009 0 49 25.68 8.822
2010 0 45 13.3945 10.96790
2009 (%) 2010 (%)
HFIAS access score(aggregate)
0–9 2.5 40.7
10–19 22.9 25.1
20–29 41.3 25.6
30–39 31.5 7.8
40+ 4.3 0.8
HFIAS questions (modifi ed) 2009 2010
MeanStd.
Deviation MeanStd.
Deviation 1. # of days in the past week that you worried HH would
not have enough food 4.59 2.196 2.29 2.253
2. # of days in the past week that HH relied on less preferred foods 6.22 1.504 2.64 2.893
3. # of days in the past week any HH member had to eat a limited variety of foods 5.06 2.174 3.49 2.923
4. # of days in the past week that HH gathered wild food, hunted, or harvested immature crops .00 .100 .31 .884
5. # of days in the past week any HH member had to limit portion size 3.96 2.377 1.80 2.351
6. # of days in the past week HH had to reduce the number of meals in a day 3.62 2.512 1.83 2.506
7. # of days in the past week that there was no food to eat in the HH .98 1.868 .20 .728
8. # of days in the past week any HH member had to go to bed hungry 1.08 1.778 .65 1.338
9. # of days in the past week any HH member had to skip entire days without eating .21 .769 .21 .675
2009 (%) 2010 (%)
Modifi ed HFIAS foodsecurity categories
Food secure 1.0 26.4
Mildly food insecure 1.2 6.5
Moderately food insecure 28.5 31.2
Severely food insecure 69.2 35.9
* Categories modifi ed slightly
Year Minimum Maximum MeanStd.
Deviation
Household Hunger Scale(HFIAS questions 7, 8, 9)
2009 3 8 3.90 1.071
2010 3 7 3.27 .604
*Categories modifi ed slightly* 0–1 days = scored as “1”; 2–4 days = “2”; 5–7 days = “3”

December 2010 • Participatory Impact Assessment
47
TABLE A5c. Food Security—The Coping Strategies Index
Year Minimum Maximum Mean
Std.
Deviation
Coping Strategies Index(0–189 scale)
2009 0 109 41.03 20.139
2010 0 123 17.299 19.19589
2009 (%) 2010 (%)
CSI score categories 0–19 (Food secure) 12.5 59.3
20–39 (Borderline food insecure) 40.9 28.1
40–59 (Moderately food insecure) 26.3 9.5
60–79 (Very food insecure) 17.3 2.0
80–99 (Extremely food insecure) 2.7 0.7
100+ (??) 0.3 0.7
CSI questions (modifi ed) 2009 2010
MeanStd.
Deviation MeanStd.
Deviation
# of days in the past week rely on less preferred or less expensive food?
6.22 1.504 2.64 2.893
# of days in the past week borrow food, or rely on help from a relative?
1.29 1.912 .63 1.361
# of days in the past week purchase food on credit?
.57 1.303 .26 .895
# of days in the past week gather wild food, hunt, or harvest immature crops?
.01 .100 .31 .884
# of days in the past week consume seed stock held for next season?
2.76 2.603 .62 1.245
# of days in the past week send household members to eat elsewhere?
.13 .695 .35 .926
# of days in the past week send household members to beg?
.04 .465 .16 .768
# of days in the past week limit portion size at mealtimes?
3.97 2.377 1.80 2.351
# of days in the past week restrict consumption by adults in order for small children to eat?
2.49 2.470 1.04 1.704
# of days in the past week reduce the number of meals eaten in a day?
3.62 2.512 1.83 2.506
# of days in the past week skip entire days without eating?
.21 .769 .21 .675

Feinstein International Center
48
TABLE A6a. Disaster Management
Totals By sex of HH head
2009 2010
2009 (%)
2010 (%)
Male (n=250)
Female (n=150)
Male (n=265)
Female (n=135)
Knowledge of government body concerned with disaster management
Yes 80.5 24.0 81.5 78.7 23.8 24.4
Knowledge of government policies in addressing disaster in local area
Yes 77.4 23.8 77.5 77.3 24.2 23.0
Knowledge of committee in the community dealing with disaster management
Yes 74.9 21.8 75.5 74.0 21.9 21.6
How often in the past year HH member has attended public meeting about management of disaster risks?
Never 61.9 84.8 62.7 60.7 86.4 81.5
Sometimes 32.1 14.8 30.5 34.7 13.6 17.0
Many times 6.0 0.5 6.8 4.7 0.0 1.5
Any HH members trained in risk/ vulnerability assessment in past year
Yes 13.5 7.5 14.5 12.0 7.9 6.7
Local early warning system in community
Yes 68.9 20.0 69.1 68.7 20.8 18.5
No 7.0 14.2 8.4 4.7 15.8 11.1
Don’t know 24.1 65.8 22.5 26.7 63.4 70.4
Presence of disaster preparedness plan in community
Yes 63.2 20.0 64.7 60.7 20.8 18.5
No 7.8 14.0 8.8 6.0 14.7 12.6
Don’t know 264 66.0 26.5 33.3 64.5 68.9

December 2010 • Participatory Impact Assessment
49
TABLE A6b. Disaster Management
By livelihood zone
2009 2010
Atsbi-Wonberta Highlands
(n=80)
Eastern Plateau (n=300)
Irob Mountains
(n=20)
Atsbi-Wonberta Highlands
(n=100)
Eastern Pslateau (n=280)
Irob Mountains
(n=20)
Knowledge of government body concerned with disaster management
Yes 83.8 79.9 75.0 24.0 23.2 35.0
Knowledge of government policies in addressing disaster in local area
Yes 78.8 77.3 75.0 22.0 23.6 35.0
Knowledge of committee in the community dealing with disaster management
Yes 72.5 76.3 65.0 22.0 20.8 35.0
How often in the past year HH member has attended public meeting about management of disaster risks?
Never 70.0 60.9 45.0 80.0 86.1 90.0
Some-times 20.0 33.8 55.0 19.0 13.6 10.0
Many times 10.0 5.4 0.0 1.0 0.4 0.0
Any HH members trained in risk/ vulnerability assessment in past year
Yes 12.5 13.7 15.0 6.0 7.5 15.0
Local early warning system in community
Yes 70.0 68.9 65.0 18.0 20.0 30.0
No 2.5 8.7 0.0 9.0 17.1 0.0
Don’t know 27.5 22.4 35.0 73.0 62.9 70.0
Presence of disaster preparedness plan in community
Yes 60.0 63.9 65.0 17.0 20.4 30.0
No 6.2 8.7 0.0 15.0 14.6 0.0
Don’t know 33.8 27.4 35.0 68.0 65.0 70.0
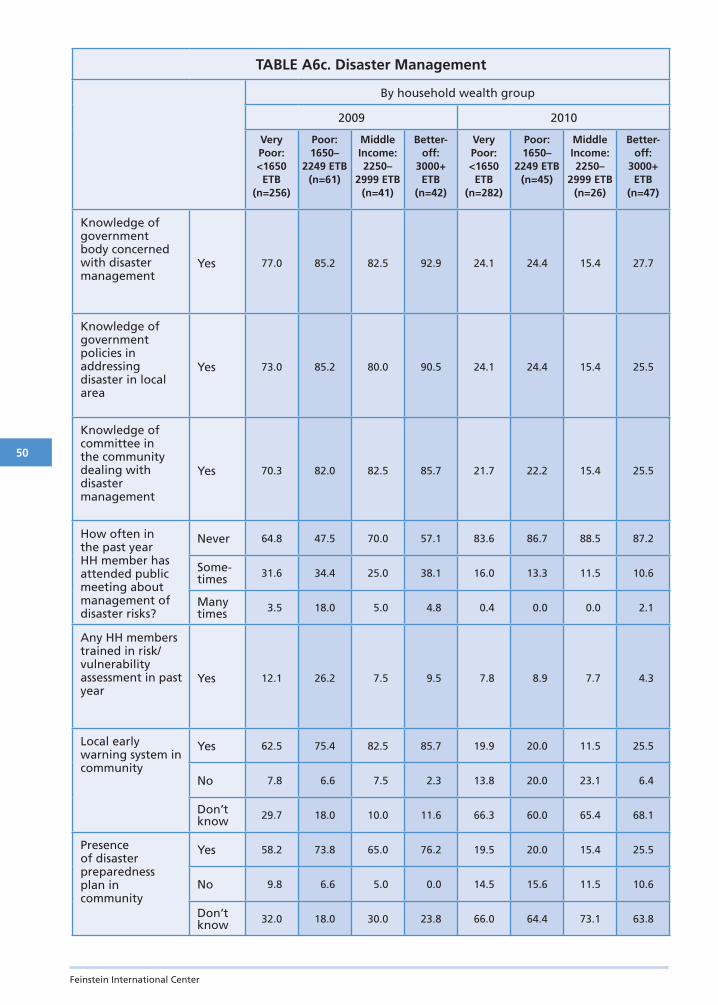
Feinstein International Center
50
TABLE A6c. Disaster Management
By household wealth group
2009 2010
Very Poor: <1650 ETB
(n=256)
Poor: 1650–
2249 ETB (n=61)
Middle Income: 2250–
2999 ETB (n=41)
Better-off:
3000+ ETB
(n=42)
Very Poor: <1650 ETB
(n=282)
Poor: 1650–
2249 ETB (n=45)
Middle Income: 2250–
2999 ETB (n=26)
Better-off:
3000+ ETB
(n=47)
Knowledge of government body concerned with disaster management
Yes 77.0 85.2 82.5 92.9 24.1 24.4 15.4 27.7
Knowledge of government policies in addressing disaster in local area
Yes 73.0 85.2 80.0 90.5 24.1 24.4 15.4 25.5
Knowledge of committee in the community dealing with disaster management
Yes 70.3 82.0 82.5 85.7 21.7 22.2 15.4 25.5
How often in the past year HH member has attended public meeting about management of disaster risks?
Never 64.8 47.5 70.0 57.1 83.6 86.7 88.5 87.2
Some-times 31.6 34.4 25.0 38.1 16.0 13.3 11.5 10.6
Many times 3.5 18.0 5.0 4.8 0.4 0.0 0.0 2.1
Any HH members trained in risk/ vulnerability assessment in past year
Yes 12.1 26.2 7.5 9.5 7.8 8.9 7.7 4.3
Local early warning system in community
Yes 62.5 75.4 82.5 85.7 19.9 20.0 11.5 25.5
No 7.8 6.6 7.5 2.3 13.8 20.0 23.1 6.4
Don’t know 29.7 18.0 10.0 11.6 66.3 60.0 65.4 68.1
Presence of disaster preparedness plan in community
Yes 58.2 73.8 65.0 76.2 19.5 20.0 15.4 25.5
No 9.8 6.6 5.0 0.0 14.5 15.6 11.5 10.6
Don’t know 32.0 18.0 30.0 23.8 66.0 64.4 73.1 63.8
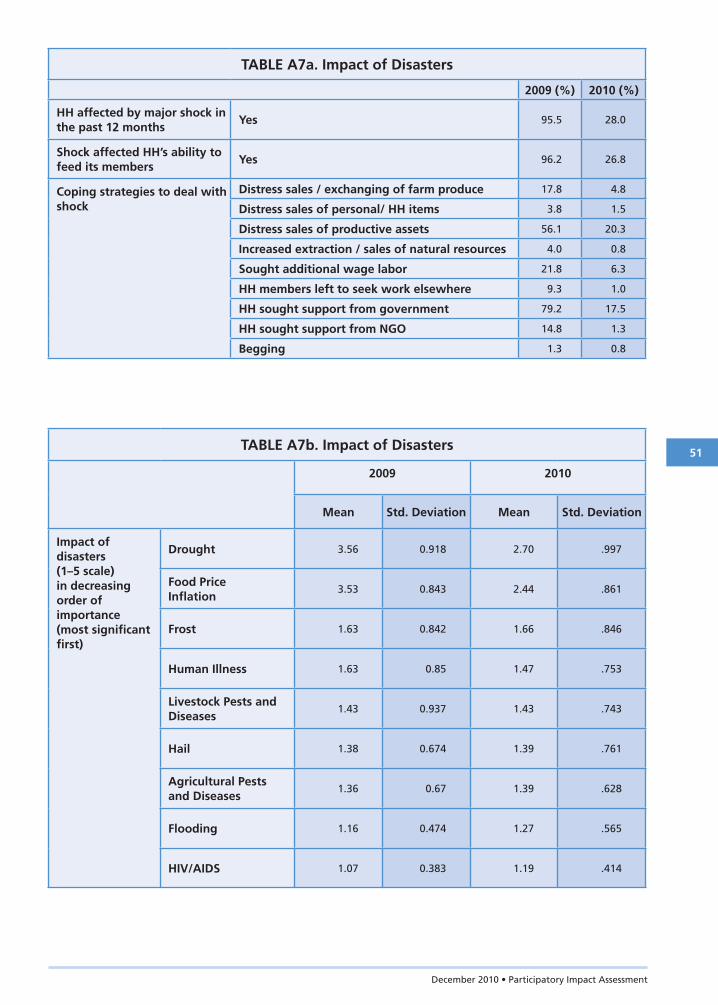
December 2010 • Participatory Impact Assessment
51
TABLE A7a. Impact of Disasters
2009 (%) 2010 (%)
HH affected by major shock in the past 12 months Yes 95.5 28.0
Shock affected HH’s ability to feed its members Yes 96.2 26.8
Coping strategies to deal with shock
Distress sales / exchanging of farm produce 17.8 4.8
Distress sales of personal/ HH items 3.8 1.5
Distress sales of productive assets 56.1 20.3
Increased extraction / sales of natural resources 4.0 0.8
Sought additional wage labor 21.8 6.3
HH members left to seek work elsewhere 9.3 1.0
HH sought support from government 79.2 17.5
HH sought support from NGO 14.8 1.3
Begging 1.3 0.8
TABLE A7b. Impact of Disasters
2009 2010
Mean Std. Deviation Mean Std. Deviation
Impact of disasters(1–5 scale)in decreasing order of importance(most signifi cant fi rst)
Drought 3.56 0.918 2.70 .997
Food PriceInfl ation
3.53 0.843 2.44 .861
Frost 1.63 0.842 1.66 .846
Human Illness 1.63 0.85 1.47 .753
Livestock Pests and Diseases
1.43 0.937 1.43 .743
Hail 1.38 0.674 1.39 .761
Agricultural Pestsand Diseases
1.36 0.67 1.39 .628
Flooding 1.16 0.474 1.27 .565
HIV/AIDS 1.07 0.383 1.19 .414

Feinstein International CenterTufts University200 Boston Ave., Suite 4800Medford, MA 02155USAtel: +1 617.627.3423fax: +1 617.627.3428fi c.tufts.edu