particle and bubble interactions in flotation systems
TRANSCRIPT

PARTICLE AND BUBBLE INTERACTIONS IN FLOTATION SYSTEMS
Except where reference is made to the work of others, the work described in this dissertation is my own or was done in collaboration with my advisory committee.
This dissertation does not include proprietary or classified information.
________________________
Zachery Ian Emerson
Certificate of Approval:
________________________ ________________________
Gopal A. Krishnagopalan Steve R. Duke Professor Associate Professor, Chair Chemical Engineering Chemical Engineering
________________________ ________________________
Thomas S. Denney W. Robert Ashurst Professor Assistant Professor Electrical & Computer EngineeringChemical Engineering
______________________
George T. Flowers Interim Dean Graduate School

ii
PARTICLE AND BUBBLE INTERACTIONS IN FLOTATION SYSTEMS
Zachery Ian Emerson
A Dissertation
Submitted to
the Graduate Faculty of
Auburn University
in Partial Fulfillment of the
Requirements for the
Degree of
Doctor of Philosophy
May 10, 2007 Auburn, Alabama

iii
PARTICLE AND BUBBLE INTERACTIONS IN FLOTATION SYSTEMS
Zachery I Emerson
Permission is granted to Auburn University to make copies of this dissertation at its discretion, upon request of individuals or institutions and at their expense.
The author reserves all publication rights.
________________________
Signature of Author
________________________
Date of Graduation

iv
VITA
Zachery Ian Emerson was born on January 23, 1979. He graduated with honors
from Hartselle High School in 1997. He received a Bachelor’s Degree in Chemical
Engineering in 2001 and a Master of Science degree in 2003 from Auburn University.
He is a member of Phi Lamda Upsilon and Omega Chi Epsilon and is a certified FE.

v
Journal used: TAPPI Journal Computer software used: Microsoft Office, Corel PhotoPaint 9 and 10, Jasc Animation Shop, Jasc PaintShop Pro, ImageJ, and ImageTool

vi
DISSERTATION ABSTRACT
PARTICLE AND BUBBLE INTERACTIONS IN FLOTATION SYSTEMS
Zachery Ian Emerson
Doctor of Philosophy, May 10, 2007
(M.S. Auburn University 2003)
(B.S. Auburn University 2001)
133 type pages
Directed by Steve R. Duke
Flotation separation is an important process in mineral processing and paper
recycling. Flotation is a separation process used to remove particles from a liquid stream.
Bubbles are introduced into the liquid stream, and, as they rise, particles may adsorb to
the bubble surface. The bubbles may then carry the particles to the surface of the liquid,
where they are removed. This dissertation focuses on flotation deinking. Flotation
deinking is used to remove ink particles and other contaminants from recycled paper
streams.
Flotation is a complicated combination of fluid mechanics, thin-film dynamics,
and surface chemistry. The fundamental process in flotation, the adhesion of a particle to
a bubble, was studied using high-speed and high-magnification imaging techniques.
Facilities for the study of particle interactions with stationary and flowing bubbles in
several different system chemistries are discussed.
These techniques were used to study the interactions between toner ink particles
and bubble surfaces. Toner ink particles were observed to adsorb to bubble surfaces. In

vii
the presence of calcium oleate surfactant, toner particle formed networks at the bubble
surface. These networks were observed to be very stable. The role of particle size and
system chemistry in the adhesion of toner particles to bubbles was examined. Calcium
oleate resulted in a larger percentage of bubble coverage than sodium lauryl sulfate
chemistry; however, the percentage of bubble surface covered with ink particles did not
depend upon the particle size. Estimates were obtained for the volume and mass of toner
ink particles attached to the bubble surface. For sodium lauryl sulfate chemistry, the
mass of adsorbed toner ink increased from 3.0 mg of ink per bubble for particles less than
75 μm in size to 6.0 mg of ink per bubble for particles with a size range of 250 to 475
μm. When calcium chloride is added to sodium lauryl sulfate surfactant, the mass of
adsorbed ink increased. For sodium oleate surfactant with calcium chloride, the mass of
adsorbed toner ink increased from 5.9 mg of ink per bubble for particles less than 75 μm
in size to 12.5 mg of ink per bubble for particles with a size range of 250 to 475 μm.
When the calcium chloride was not used with sodium oleate surfactant, the mass of
attached ink decreased. The mass of attached ink particles was largest for the calcium
oleate chemistry and increased as particle size increased. No change was seen with the
addition of calcium ions to a surfactant-free system. No particle agglomeration was
observed in the absence of calcium, suggesting that the proposed “Calcium Bridge”
mechanism for particle agglomeration does not occur in this system.
Imaging of model glass beads was also used to study the fundamentals of particle
/ bubble interactions. The Stokes number (the ratio of inertial forces and viscous drag
forces on a particle in a fluid) was used as a criteria to study the mechanism of particle to
bubble collision. Particles with a high Stokes number (> 1) were observed to undergo
impact collision at the bubble surface. Particles with lower Stokes numbers (< 1) were
observed to follow the sliding collision mechanism. These observations confirm the
Schulze prediction for the mechanism of collision between a particle and a bubble.
Flotation models were examined for the toner deinking system. Estimates for the
probability of particle to bubble collision, probability of particle adhesion, and
probability of stable attachment were found experimentally and compared to modeling
results. Experimental and data analysis methods were developed to directly measure the

viii
probabilities of the subprocesses from visualization measurements. Model predictions do
not match experimental observations. Specifically, estimates for the probability of
particle to bubble adhesion were very different from experimental observations.

ix
TABLE OF CONTENTS
LIST OF FIGURES ........................................................................................................... xi
LIST OF TABLES ............................................................................................................xv
CHAPTER 1 INTRODUCTION .........................................................................................1
CHAPTER 2 BACKGROUND ...........................................................................................4
2.1 Paper Recycling Overview ..............................................................................4
2.2 Flotation Processes ...........................................................................................8
2.3 Previous Work of the Research GrouP ..........................................................17
2.4 Previous Imaging of Particle Bubble Adsorption ...........................................18
2.5 Flotation Modeling .........................................................................................19
2.6 Purpose of Research........................................................................................36
CHAPTER 3 EXPERIMENTAL METHODS ..................................................................37
3.1.1 Stationary Bubble Facility ...........................................................................37
3.1.2 Suspending Bubble Flow Facility................................................................41
3.1.3 Particle to Bubble Collision Apparatus........................................................45
3.1.4 Imaging System ...........................................................................................46
3.2 Model Particles Preparation............................................................................48
3.3 Flotation System Preparation..........................................................................50
3.4 Image Processing ............................................................................................51

x
CHAPTER 4 VISUALIZATION RESULTS ....................................................................55
4.1.1 Imaging of the Effect of Toner Particle Size and System Chemistry ..........55
4.1.2 Quantification of the Effect of Toner Particle Size and System Chemistry 66
4.2 Adsorption and Collision of Model Glass Particles........................................70
CHAPTER 5 DISCUSSION..............................................................................................86
5.1 Effect of System Chemistry and Particle Size in Flotation.............................86
5.2 Study of the Mechanisms of Particle to Bubble Collision..............................87
5.3 Study of Toner Particle Impact and Collision.................................................91
CHAPTER 6 EVALUATION OF FLOTATION MODELS ............................................96
6.1 Flotation Modeling Calculations.....................................................................96
6.2 Visual Estimation of Adhesion Subprocesses...............................................102
CHAPTER 7 CLOSURE .................................................................................................104
BIBLIOGRAPHY............................................................................................................106
APPENDIX A Table of Experimental Movie Data.........................................................111
APPENDIX B Particle – Bubble Adhesion Model Results.............................................117

xi
LIST OF FIGURES
Figure 2.1: Illustration of the paper recycling process. .......................................................7 Figure 2.2: Proposed mechanisms of the role of calcium ions and surfactants in ink particle agglomeration (Pugh and Rutland, 1997). ............................................................16 Figure 2.3: Diagram of capture radius. Particle to bubble collision occurs when a particle enters on a streamline within RC. ......................................................................................22 Figure 2.4: Diagram of attachment by sliding parameters. Particle must approach within hCrit from the bubble surface for attachment to occur. ......................................................28 Figure 2.5: Illustration of the forces of attachment and detachment important to the probability of particle adhesion stability. ..........................................................................31 Figure 2.6: Illustration of stably adsorbed particle at the bottom of a bubble. ................33 Figure 3.1: Stationary bubble suspending tank schematic. ..............................................40 Figure 3.2: Examples of stationary bubbles. a.) Stationary bubble on the tip of an inverted needle. b.) Stationary bubble on the tip of an upwardly oriented needle. c.) Higher magnification image of the surface of a stationary bubble. .............................40 Figure 3.3: Suspending bubble flow facility schematic. ..................................................43 Figure 3.4: Example images of suspended bubbles of various sizes, their terminal velocities, and the flow rates needed to suspend them [Davies and Duke, 2000]. All bubbles are spherical, with the larger sized bubbles becoming more ellipsoidal. ............44 Figure 3.5: Particle to bubble collision apparatus schematic. ..........................................46 Figure 3.6: Illustration of calculation of adsorbed ink area. .............................................54 Figure 4.1: Frames from an injection of 75 to 150 μm toner particles onto the surface of a stationary bubble in sodium lauryl sulfate / sodium silicate chemistry. The particles remain adsorbed to the bottom of the bubble long after the injection. .............................58

xii
Figure 4.2: Final images (after an elapsed time of at least 1.5 seconds) from the injection of varying sized toner particles in sodium lauryl sulfate / sodium silicate chemistry. a.) < 75 μm b.) 75 to 150 μm c.) 150 to 225 μm d.) 225 to 450 μm. ........................................59 Figure 4.3: Final images from the injection of varying sized toner particles in calcium oleate chemistry. Particle size: a.) < 75 μm b.) 75 to 150 μm c.) 150 to 225 μm d.) 225 to 450 μm. Networks of agglomerated toner particles are formed in each case. ..................60 Figure 4.4: High magnification image of small adsorbed toner particle. The particle is attached to the bubble by a very small point. ....................................................................61 Figure 4.5: High magnification image of a toner network in calcium oleate chemistry. Particles adsorb to each other and to the bubble by small sharp points. Large gaps are seen in the network. ..........................................................................................................61 Figure 4.6: Final images from the injection of 250 to 450 μm toner particles in varying chemistries. a.) 100 mg/L oleate b.) 100 mg/L oleate and 100 mg/L calcium chloride c.) 100 mg/ L lauryl sulfate d.) 100 mg/L lauryl sulfate and 100 mg/L calcium chloride. ....62 Figure 4.7: Stills taken from suspending bubble movies in the sodium lauryl sulfate / sodium silicate chemistry. Particle adsorption is observed in all particle size ranges. Particle Size: a.) < 75 μm b.) 75 to 150 μm c.) 150 to 225 μm d.) 225 to 450 μm. .........63 Figure 4.8: Selected images taken from suspending bubble movies in the calcium oleate chemistry. Particle adsorption is observed in all particle size ranges. Particle Size: a.) < 75 μm b.) 75 to 150 μm c.) 150 to 225 μm d.) 225 to 450 μm. ........................................64 Figure 4.9: Final images from the injection of 250 to 450 μm toner particles in varying chemistries. a.) 100 mg/L oleate b.) 100 mg/L oleate & 100 mg/L calcium chloride c.) 100 mg/ L lauryl sulfate d.) 100 mg/L lauryl sulfate & 100 mg/L calcium chloride. ......65 Figure 4.10: Estimated mass of ink adsorbed per bubble for four system chemistries and four particle size ranges. ...................................................................................................68 Figure 4.11: Mass of toner ink adsorbed per bubble for clear water at pH = 9.5 in the presence and absence of calcium chloride. .......................................................................69 Figure 4.12: Images from an injection of fine (<106 micron) glass beads onto a bubble surface. In b.) a large amount of glass particles are adsorbed to the bottom of the bubble. ...............................................................................................................................74 Figure 4.13: Image taken after an injection of fine glass particles onto a bubble surface in calcium oleate chemistry. The particles remain adsorbed on the bottom of the bubble. ...............................................................................................................................75
xiii
Figure 4.14: Images from an injection of 225 to 300 micron glass particles onto a bubble surface. No particles adsorbed to the bubble. ..................................................................76 Figure 4.15: Images from an injection of 425 to 500 micron particles. The particles strike the bubble surface and bounce off. .........................................................................77 Figure 4.16: Sequence of images showing the impacting of a large glass particle on a bubble surface. The indicated particle strikes the bubble in b.) and bounces away in d.). .................................................................................................................................78 Figure 4.17: Sequence of images showing the injection of fine (<106 micron) particles onto a bubble surface. The particles follow the flow field around the bubble, but do not appear to strike the bubble surface. ...................................................................................79 Figure 4.18: Sequence of images from an injection of 225 to 300 micron particles onto the bubble surface. The indicated particle strikes the bubble and then rolls along the surface. ..............................................................................................................................80 Figure 4.19: Sequence of images from an injection of large glass particles onto a bubble surface. The indicated particle strikes the bubble in c.) and bounces away in d.), finally falling out of the frame in f.). ............................................................................................81 Figure 4.20: Sequence of images from the adsorption of a very small glass particle to the bubble surface. The indicated particle strikes the bubble in b.) slides along the surface and remains attached until it falls out of frame. ................................................................82 Figure 4.21: Sequence of images from the collision of a 90 μm particle at the bubble surface. The particle begins in contact with the bubble and slides along the surface. When it reaches the downstream side of the bubble, the inertia of the particle carries it off of the surface. ....................................................................................................................83 Figure 4.22: Sequence of images from an injection of large glass beads. The indicated particle strikes the bubble surface in c.), and bounces off of the bubble in d.). The deformation of the bubble surface is visible in d.) and e.). ...............................................84 Figure 4.23: Sequence of images from the collision of a 1.2 mm bubble with 212-300 μm glass particles. The indicated particle appears to follow a streamline around the rising bubble. .....................................................................................................................85 Figure 5.1: Sequence of images from the injection of 250 to 450 micron toner particles. The indicated particle approaches the bubble surface, but does not appear to strike it. The indicated particle stalls on the top of the bubble in b.) before falling out of view in d.). .................................................................................................................................93

xiv
Figure 5.2: Sequence of images from an injection of large (>450 microns) toner particles. The indicated particle impacts the bubble surface in c.) and bounces, but is not repelled away from the bubble surface. ..........................................................................................94 Figure B-1: Illustration of the Three- Phase Contact Angle (θ). ....................................117
Figure B-2: Measurement images of the maximum coverage angle for glass particles. a.) Spherical glass particles <75 microns. b.) Amorphous glass particles <75 microns. .....118

xv
LIST OF TABLES
Table 5.1: Stokes Number for Various Particle Size Ranges for Glass Beads .................89 Table 5.2: Stokes Number for Various Particle Sizes of Toner Ink .................................90 Table 6.1: Properties used in PC calculations. ...................................................................96 Table 6.2: Properties used in PASL calculations. ...............................................................97 Table 6.3: Results of model calculations for toner ink for four particle size ranges and
representative images. ...................................................................................100 Table 6.4: Comparison of results of imaging estimations to model calculations for the
probability of the sub-processes of particle to bubble adhesion. ..................103

1
CHAPTER 1
INTRODUCTION
Adhesion at a solid / liquid / gas interface is controlled by the surface forces and
fluid dynamics of the system. Adhesion occurs when a bubble, droplet, or particle of
material transfers to and remains at the interface of two other materials due to surface
forces. The adhering species has a greater affinity for residing at the interface than for
either of the other two phases.
Adhesion is an important phenomenon in several systems. Bubble adhesion to
solid substrates in a fluid is important to packed bed multiphase reactors. Liquid droplet
adhesion to bubbles is observed in oil flotation and in petroleum exploration. Particle
adhesion to a liquid / solid interface is found in many processes including powder
manufacture, semiconductor production, and in biological systems. Solid particle
adhesion to a gas / liquid interface is important to environmental systems and to slurry-
bed catalysis.
The ability of a solid particle to attach to a bubble surface in a liquid is dependant
upon the surface properties of the system. For adhesion to occur, a three-phase contact
must exist such that the attractive and repulsive forces of the solid species are in
equilibrium. Often, the liquid is an aqueous solution and the bubbles consist of air. An
adhering particle will therefore be at least slightly hydrophobic; that is, it will prefer the

2
air phase to the water phase. Wastewater treatment processes take advantage of this
phenomenon to remove suspended particulates from water streams.
Flotation processes remove particles from a water system by introduction of air
bubbles. The bubbles rise by buoyancy, and suspended particles adhere to the bubble
surfaces. The net effect is a transport of particles to the top of the fluid, where they may
be removed. As the particles and bubbles are in relative motion, the short-range
hydrodynamics of the system are as important to adhesion as the surface phenomenon.
Particle to bubble attachment can be modeled as a series of subprocesses. Each of
these subprocesses has a probability of occurrence, so that the overall probability of
adhesion of a particle to a rising bubble, P, is defined as
StabTPCAC PPPPP ⋅⋅⋅= (1)
where PC is the probability of bubble particle collision, PA is the probability of particle
attachment, PTPC is the probability of the formation of a stable three-phase contact, and
PStab is the probability that an adsorbed particle will remain stably attached. The first and
second of these probabilities depend strongly on the fluid dynamics of the system, while
the third and fourth probabilities depend upon the surface phenomena.
This work explores the interactions of particles with bubble surfaces using high
speed and high magnification imaging. The effect of important flotation parameters, such
as particle size and flotation chemistry, is examined by direct observation of their impact
on the attachment of particles to bubble surfaces. Each of these adhesion subprocesses is
observed in order to gain a better understanding of their role in flotation, and to allow
evaluation of the available flotation models. This research aims to improve the

3
understanding of particle to bubble attachment in flotation systems by expanding the
experimental knowledge of the phenomena.

4
CHAPTER 2
BACKGROUND
This document presents the development of and results from techniques to image
and quantify the parameters and fundamental processes important to flotation. The
hypothesis is that the flow behavior of the fluid between the particle and the surface of
the bubble plays a role as important as the surface properties of the system. The research
approach is that by analyzing high spatial and temporal resolution images the fluid flow
and surface processes governing the adsorption of particles onto bubble surfaces can be
examined. This document describes the application and advancement of the methods
developed by Davies [2000, 2002] for study of the adsorption of ink particles, and it
provides quantitative study of the effects of system parameters on flotation and the
effectiveness of the subprocesses involved. These techniques are used to demonstrate a
systematic method for evaluating the effectiveness of froth flotation and dissolved air
flotation (DAF) for processes relating to the recycling of post-consumer paper products.
The optical methods are also shown to be useful in evaluation of the fundamental
subprocesses at work in flotation.
2.1 Paper Recycling Overview
The importance of fiber recovery has grown dramatically in recent years as the
demand for recycled paper has grown. According to the 2000 RPA Federal Timber

5
Assessment (USDA, 2000), recycled materials are expected to be the fastest growing
source of papermaking fiber through 2050; recycled fiber production is expected to
increase 130% from 42 to 94 million tons per year. Twenty-nine states and the federal
government have mandated minimums on the purchase of recycled paper for government
services.
An important, and difficult, step in the recycling process is the removal of
contaminants from the repulped fiber slurry. This must be done to improve the recycled
paper product and for process viability reasons. Common contaminants include many
different forms of ink, stickies (adhesives and other polymers found in stamps, tape, and
paper coatings) and filler (non-fiber paper material used to increase brightness and
printability). Ink particles in the mill process water redeposit onto fibers causing specks
and a drop in brightness. Agglomerated stickies particles plug holes in screens, deposit
on the paper machine wire, and can cause paper strength quality issues when deposited
onto paper fibers. Contaminants are often classified by their method of removal.
Figure 2-1 presents an overview of a typical paper recycling process. The first
step in the recycling process is the repulping of the reclaimed material. The paper is sent
to the repulper where it is mechanically agitated and cut in water to form a slurry. Often,
all of the chemicals needed for the recycling process are added at this stage due to the
large degree of mixing in the repulper. The slurry is then sent through banks of screens:
the course screens remove large debris such as sand and dirt, paperclips, and staples from
the slurry; the fine pressure screens remove light contaminants such as large stickies
particles. The pulp slurry may be cleaned using centrifugal cleaners. The pulp is then
processed with flotation deinking. This step uses bubbles to remove hydrophobic

6
contaminants (such as oil-based inks, toner inks and polymeric contaminants) from the
fiber surface and from the suspension water. The pulp is then washed to remove soluble
contaminants to make it ready for use in papermaking.
The washing step involves removing ink and other contaminants from the fiber
using sodium hydroxide, sodium silicate, and hydrogen peroxide; these chemicals are
often added in the repulping unit. A dispersent is often used to prevent redeposition of
contaminants onto fibers; micelle formation is usually induced with stearic acid, causing
the grease and oil binders of the ink to become dispersible in water. The fibers can then
be separated from the wash water, which can then be treated by dissolved air flotation to
allow reuse of the water. [Smook, 2002] The wash water may then be sent through a
dissolved air flotation step to prepare it for use in the repulper and other mill processes.
The effectiveness of the recycling operation is evaluated by testing the optical and
strength properties of the recovered pulp.
Thickening and bleaching bring the pulp slurry to the state in which it can be used
to manufacture the product. Thickening is the dewatering of the pulp slurry to bring its
consistency to a value useful for papermaking. Bleaching is used to increase the
brightness of the pulp; this operation is especially important for copy paper, newsprint,
and tissue where the “whiteness” of the paper is very important.

7
Figure 2.1: Illustration of the paper recycling process.
Water-based Inks Adhesives
Oil-based Inks Toners
Adhesives
Product: Secondary
Fibers
Flotation Deinking
(Froth Flotation)
Dissolved Air
Flotation Separation
(DAF)
Washing
Wash Filtrate
Raw Material
Cleaning and
Screening
Large Contaminants
Repulping
Clarified Water
Fibers and Water
Fibers and Water
Fibers and Water
New Process Water

8
2.2.1 Flotation Processes
The first patent for a flotation deinking process was granted in 1933 (Hines,
1933). The first domestic commercial flotation deinking plant opened in 1955, with the
first European plant following in 1959. In 1992, it was reported that there are
approximately 325 flotation deinking plants worldwide (Poyry, 1993).
There are two forms of flotation common to the recycled paper industry: froth
flotation and dissolved air flotation. Froth flotation, sometimes called induced air
flotation (IAF), is the injection or production of air bubbles into a vessel to remove
contaminant particles. The particles adsorb onto the surface of the bubble and float to the
top; they are then skimmed off to separate the floated particulates from the water. IAF
usually yields bubbles between 1.0 and 2.0 mm in diameter. IAF cells are best suited to
remove large hydrophobic contaminants (from 100 to 500 μm). This form of flotation is
well established in the mining industry (Gaudin, 1957; Leja, 1982) to separate fine or
precious metals from ore-stock and also has seen use in the petrochemical industry for
removal of oils from water (Zheng and Zhao, 1993). Typical IAF processes involve an
air jet impinging upon a high speed impeller in the bottom of the flotation vessel. The air
stream is broken up into bubbles. Nozzle flotation is a specialized froth flotation process
which produces bubbles of 400 to 800 microns. The contaminated flow is mixed with air
and is injected into the flotation vessel. Bubbles are produced as the air water mixture is
sprayed into the vessel. This process has the advantage of fewer moving parts when
compared to typical IAF processes (Gopalratnam et al., 1988). In paper recycling, froth
flotation is used to separate ink and other contaminants from the pulp slurry water and
also from the fiber surface. Some fiber is lost in the froth layer in this process.
9
Another flotation process is dissolved air flotation (DAF). DAF units involve
putting the contaminated water under pressure. The stream is saturated with air. A
pressure drop in the system causes the excess air to leave solution, forming very small
(30 – 200 μm) bubbles. These small bubbles collect contaminant particles and float them
to the top. DAF cells are more suited to remove smaller sized contaminants than those
found in froth flotation units.
DAF is used to remove particles in many applications. It is used to clarify
wastewater, separate solids from potable water, separate biological flocs and algae,
remove ions and charged metal complexes, and separate very fine particles of similar
density (Rubio et al. 2002). The DAF unit is used in the paper recycling process for
process water clarification. The process water from the washing of the secondary fibers
contains ink and other small particulates, which are removed by a DAF unit. Unlike a
froth float cell, a DAF cell operates on a largely fiber free water stream (Smook, 2002).
DAF is also widely used for water clarification in other industries.
Typical froth flotation separation processes consist of a complicated system of
multiple banks of several flotation cells. Each bank may serve a specific separation
purpose (e.g. removing large contaminants, cleaning of a dilution stream or scavenging of
recycle stream). An example froth flotation circuit used by Minera Escondida Ltd. in
Chile consists of 6 banks of 9 flotation cells (Yianatos et al. 2005). Rubio et al. (2002)
present an excellent overview of the various forms of flotation equipment.
Other forms of flotation are used in niche applications in other industries.
Electro-flotation involves the production of micro-bubbles of hydrogen via electrolysis in
the flotation cell. Aqueous waste is passed through the cell over embedded electrodes

10
(often aluminum) which produce micro-bubbles of hydrogen gas. The hydrogen bubbles
collect solid contaminant particles and rise to the surface of the cell, just as in IAF and
DAF. Problems associated with electro-flotation include cost and maintenance of
electrodes and dangers associated with the production of hydrogen gas. This process has
seen industrial use in the removal of emulsified oils, toxic ions, and pigments from water
(Zabel, 1992; Zouboulis 1992a, 1993). Electro-flotation has been proposed by Zouboulis
for use in deinking, but no applications of such are known.
The fundamental mechanisms of flotation are common to both froth flotation and
DAF, and for all forms of flotation. The processes differ in the manner in which bubbles
are created, in bubble size, and in size of particulates suited for removal, but each is
governed by the fundamental behavior of a particle at a bubble surface. A better
understanding of this fundamental behavior therefore has potential for improvement of
wastewater treatment as a whole. Of particular interest is the flotation of non-impact inks
(toners), flexographic inks and polymeric contaminates in de-inking flotation.
2.2.2 Contaminants Removed by Flotation
There are several different kinds of contaminants targeted for removal in the
flotation cells of a paper recycling process. The major categories are dirt and other trace
material, inks, and stickies. Dirt and sand are often found when recycled paper is
repulped. Due to their relatively large size and large density, dirt particles are usually
very easy to remove. Most dirt is removed by the pre-flotation screens and cleaners. The
amount of dirt present often determines the number of froth flotation cells needed to

11
properly clean the fiber, as well as the degree of washing required. Dirt is not
particularly difficult to remove from the fiber or from the wash water.
Stickies are polymeric contaminants found in recycled paper. Typical sources of
stickies include stamp and envelope adhesives, magazine coatings, and hot melt glues. If
stickies are not removed effectively from the wash water, they will cause problems in
other parts of the papermaking process. Stickies can plug screens in a paper mill, as well
as the papermaking wire. Also, stickies can redeposit onto the fiber creating paper
strength issues. Stickies can be water dispersible and hydrophobic.
Inks can be categorized into two types: hydrophobic and hydrophilic inks. All
black inks are made up of carbon black with a binder that attaches them to the paper
surface. Examples of hydrophobic inks are offset inks and toner ink. They are difficult
to remove from fibers. However, their hydrophobic nature causes them to be very easy to
remove from water using flotation deinking and DAF.
An example of a hydrophilic ink is flexographic ink. Flexographic ink is used
because of its ability to be easily cleaned from printing presses and the absence of the
need for volatile organics in the printing and cleaning process. Its hydrophilic nature
allows presses using it to be cleaned with water, instead of the harsh organic solvents
used to clean offset ink. Flexographic ink responds poorly to deinking flotation and once
in the wash water is very difficult to remove. Most recycle plants limit the amount of
flexographic printed paper they accept due to this problem in removing it from process
water. The clarification of water containing flexographic ink is a key problem in the
expansion of paper recycling.

12
Toner ink is a non-impact ink used in personal computer printers and in
xerography machines. It is primarily found in mixed office waste (MOW). Mixed office
waste accounts for 6-10 percent of the commercial solid waste stream; MOW is 3 percent
of the total solid waste stream in the United States (WMD-SW-13, 1998). Toner printed
papers account for a relatively small fraction of reclaimed fiber; in 2005 1.4 million tons
of printing and writing papers were recovered, compared to 51 million tons of total
reclaimed paper products (Franklin Assoc., 2006). The increasing amount of MOW
being used for recycled pulp and the increase in the use of the personal printers has led to
a desire to improve the floatability of toner inks.
Toner inks are a combination of a carbon black pigment and a resin binder. A
typical toner resin is poly (methyl methacrylate) or poly (acrylic acid) (Ferguson, 1995).
In printing the resin is heat-set or photo-set and forms a solid printed layer on the paper
surface. The toner, once set, is very difficult to remove from the fiber surface. When the
toner is dislodged from the fiber during recycling, it forms relatively large flat flakes
(Theander and Pugh, 2004). The size of the released particles depends on a number of
factors in the repulping system, including system pH, presence of surfactants, and type of
repulping equipment (Miller et al., 1999).
2.2.3 Flotation Chemistry
The chemistry of a deinking flotation cell is very complex. In addition to pulp fibers,
fillers, and contaminants, many different process chemicals are present. Each step in the
recycling process requires the addition of different chemicals. Washing agents, fiber

13
conditioners, coagulants, dispersants, foaming agents, bleaching chemicals, and
surfactants may all be found in a flotation cell (Fergusson, 1992).
Surfactants play a key role in deinking operation. They aid in removing ink from
the fiber surface by helping to dislodge ink from paper in the repulper. They also help in
washing by keeping the ink particles suspended in the wash water and preventing
redeposition of ink onto fiber. They can be used as collectors in the flotation cell by
causing ink particles to agglomerate. Surfactants can also serve as foaming regulators in
the flotation cell by controlling the stability of the froth. Often, a single surfactant is
chosen to perform all of these tasks (Ferguson, 1992). Several of these roles are
competing and contradictory (e.g. dispersant vs. collector, or frother vs. defoamer).
Surfactant choice and dosage must therefore be carefully studied.
Surfactants in the flotation cell directly impact the flotation efficiency. Decreased
surface tension at the air bubble / water interface allows particles to more readily adsorb,
but also decreases adsorption stability. Collector chemicals may cause agglomeration of
particles, affecting the average particle size. Dispersing agents can prevent particle to
bubble adsorption by making the particle (now a particle / surfactant molecule complex)
more hydrophilic.
Deinking flotation is performed in a basic system (pH often ~9.5) and the targeted
contaminants (inks) are polymer based materials, so anionic or non-ionic surfactants are
usually used. Two common surfactant types in flotation are fatty-acid based soaps and
sodium silicate / sulfonic acid based surfactants.

14
Fatty-acid soaps, such as calcium oleate, are often used in flotation to promote ink
particle agglomeration. Particle agglomeration serves two purposes. First, small
particles may be prevented from forming colloidally stable dispersions by agglomeration.
Second, small particles can form larger flocs which may aid in flotation. Sodium silicate
and sulfonic acid based surfactant systems, such as sodium lauryl sulfate, are used in
paper recycling as dispersants. Dispersants (also called wetting agents or detergents)
cause particles to be more stable in water and prevent particle to particle agglomeration
or particle deposition on the fiber surface. They therefore aid in pulping and washing
operations. An unwanted side effect of dispersants is hindered flotation by reducing
particle size and the hydrophobicity of the particles (Fergusson, 1992). Sodium silicate
also serves as a chelating agent by precipitating large metal ion complexes from the
repulper.
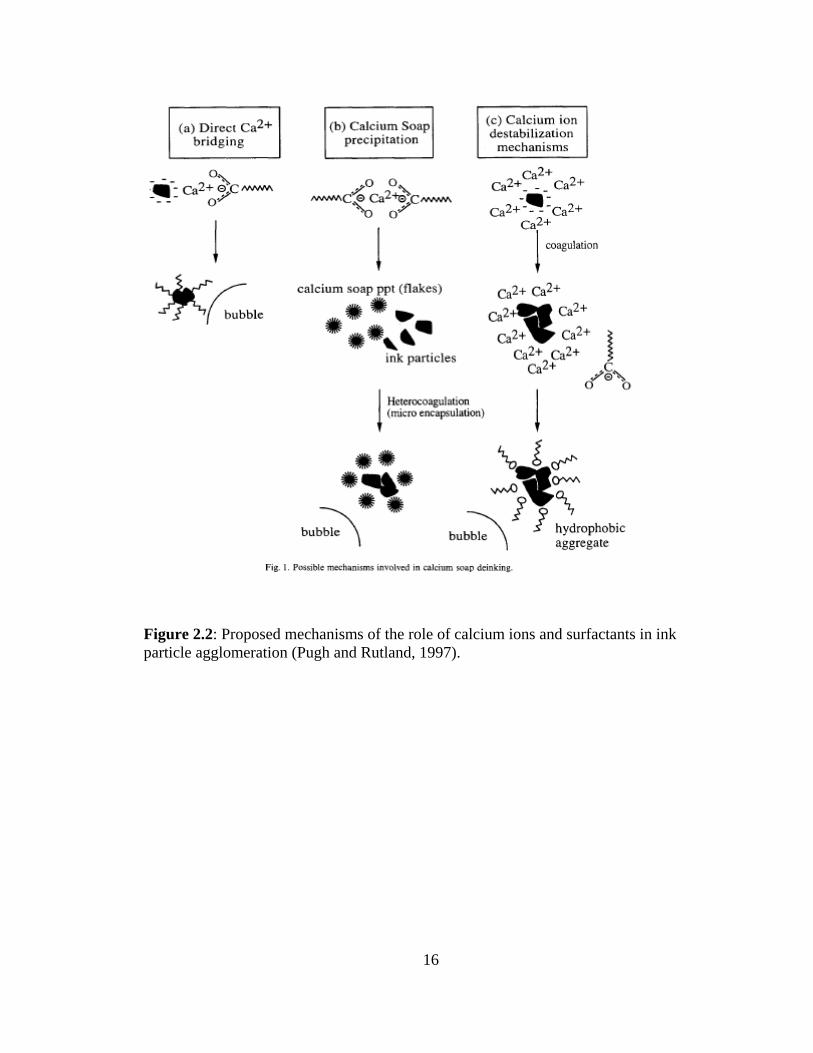
Using surface force and coagulation measurements, Pugh and Rutland
(1997)investigated the mechanisms of particle agglomeration in flotation deinking.
Figure 2.2 presents the three proposed mechanisms: a.) Direct calcium ion bridging
between ink particles b.) Particle agglomeration by precipitation of calcium soap at the
particle surface and c.) Destabilization of ink particles by calcium ions. Their work
suggests that, while the surfactant ions do not promote particle agglomeration, surfactant
salts can precipitate on the particle surface and act as “bridges” between particles. These
proposed mechanisms of particle agglomeration will be discussed in Chapter 5.
Fatty-acid soaps increase the particle size of flotation contaminants, and increase the
three phase contact angle between the particle / air / water solution. Sodium silicate /
sulfonic acid based systems lower the contact angle. Both surfactant systems lower the

15
surface tension. The role of these parameters in flotation modeling will be presented in
Section 2.5.
16
Figure 2.2: Proposed mechanisms of the role of calcium ions and surfactants in ink particle agglomeration (Pugh and Rutland, 1997).

17
2.3 Previous Work of the Research Group Previous work by this research group on flotation includes the work of Davies
(2000, 2002), Rossi (2000), Bonometti (2001, 2006), Emerson (2003, 2006), and Ham
(2004). Davies and Rossi designed and built the experimental apparatus used for most of
this work: the stationary bubble facility and the suspending bubble flow facility. They
created the procedure for suspension of bubbles in a flotation flow field and determined
that, in the presence of surfactant, the flow around a suspended bubble most resembled
the flow around a rigid sphere. They also developed the protocol for creating the image
sequences of particle adsorption. Davies work involved the flotation of flexographic and
offset inks (Davies et al. 2000, 2002). Flexographic ink was not seen to adsorb to the
bubble surface in either of the experimental systems used.
Bonometti extended the work of Davies and imaged the behavior of toner inks at
bubble surfaces. Toner ink was seen to adsorb very well to bubble surfaces. Toner ink
was also seen to form networks of toner particles, and these particle networks were
shown to be extremely stable. He developed a method by which the amount of ink
adsorbed at a bubble surface could be estimated from image data. He calculated the
percent of bubble coverage and mass of adsorbed ink over time for toners and for offset
inks (Bonometti 2001, Emerson et al. 2006). Ham studied the effect of enzymes on the
flotation of toner inks. He demonstrated that enzymes can improve the flotation removal
of toner ink from repulped fiber and performed the first imaging of flotation processes in
the presence of fiber (Ham, 2004).
We have also imaged the adsorption of stickies particles. A method to evaluate
the adsorption of pressure sensitive adhesives to bubble surfaces was developed by

18
processing of images from high-speed video sequences. Coagulated stickies particles
were seen to adsorb strongly to bubble surfaces in both the stationary bubble facility and
in the suspending bubble flow facility. The adhesion of stickies particles was shown to
be very stable (Emerson 2003).
2.4 Previous Imaging of Particle Bubble Adsorption
Other authors have used imaging to study the adsorption of particles to bubble
surfaces. Thompson et al. (1997a, 1997b) studied the adsorption of toner particles to
stationary bubbles. He observed that large flat toner particles adsorb to bubbles by small
sharp points. Kim et al. (2004) used CCD imaging to study the interaction of stickies
particles with bubbles in the presence of fiber. They demonstrate that the mass of
adsorbed stickies particles increased as the residence time of the bubble in cell increased,
similar results to those of Bonometti for toner ink. They also showed that calcium fatty
acid chemistry allows much more adsorption of stickies than clear water chemistry,
consistent with observations for toner ink in our laboratories (Emerson et al. 2006).
Nguyen and Evans (2004) used high-speed imaging to observe the behavior of
model hydrophobic spheres at a bubble surface. They used high-speed movies to
determine the polar position for colliding particles over time in order to investigate the
flow phenomena around the particle. By determining when the particle ruptures the thin
liquid film around the bubble, they postulate that surface forces do not play as active a
role in particle adsorption as previously believed. The authors use their measurements to
determine the induction time of a particle at a bubble surface. The induction time, or

19
particle to bubble contact time, is the minimum time a particle must slide along a bubble
surface for adhesion to occur by drainage of the film between the particle and the bubble.
Other imaging of bubble / particle interactions investigated the increased mass
transfer properties observed in gas slurry reactors. When sufficiently small catalyst
particles are used, an increased reaction rate is observed; this increase is thought to be
due to better mass transfer among the three phases in the reactor. Wimmers and Fortuin
(1988) postulated that the cause of the increase is adhesion of catalyst particles to the gas
liquid interface. Vinke et al. (1991, 1993) confirmed this by using equilibrium imaging of
adsorption of catalyst particles adsorbed to different gas bubbles (hydrogen, argon, and
oxygen) in aqueous solution. Using equilibrium images to measure the maximum polar
angle of bubble coverage and performing a force balance on the adsorbed particles, the
authors developed an expression for the three phase contact angle, a difficult to obtain
parameter useful in flotation modeling. Roizard et al. (1999) performed similar dynamic
experiments and found that for some catalyst / gas systems no adsorption occurred, but
increased mass transfer is observed. Bliek et al. (2001) found that hydrogen gas was
superior to nitrogen gas which was superior to air in causing carbon particle adhesion to
bubbles. This was a surprising result, suggesting that electrostatic properties of the
bubble or particle are not as important to fostering adsorption as thought.
2.5 Flotation Modeling The process of flotation combines fluid and particle mechanics, thin film theory,
and surface science. Many of the isolated fundamental phenomena are well developed
theoretically, but there is little overlap between theoretical developments, experimental

20
work and industrial observations. Most experiments consist of comparison to bench-top
or pilot-scale flotation cell results, with little experimental examination of the
fundamental processes at work. An understanding of the fundamentals of flotation is
needed in order to evaluate the results of experiments or to propose changes to published
models. This section will present the development of the current state of flotation
modeling, with emphasis on the description of the individual subprocesses at work.
For years, flotation has been modeled as a series of subprocesses. Each of these
subprocesses is characterized by a probability of occurrence; the probability of the
successful flotation of a single particle by a single bubble is therefore described as the
product of the probabilities of the individual subprocesses (Woodburn, 1970). The overall
probability of flotation is
StabTPCAC PPPPP = (1)
where PC is the probability of particle collision by a bubble, PA the probability of
attachment of a particle to a bubble, PTPC is the probability of the formation of a stable
three-phase contact, and PStab is the probability of stability of the bubble / particle
complex. This form of the flotation model has become accepted to the point that the
modeling has become focused on development of models for probability of the separate
subprocesses. The various models for each subprocess and their combination to form a
single kinetic model for flotation operation will be discussed.
Several assumptions are uniform throughout this development and review of
flotation modeling. The different subprocesses are assumed to be independent of each
other. The models assume spherical bubbles and particles. The flow around the bubble
is modeled as if the bubble were stationary in a flow field giving the equivalent bubble

21
rise velocity. The particle is assumed to be smaller than the bubble. Also, the models
assume only one particle interacts with each bubble. The validity of these assumptions
will be discussed.
2.5.1 Probability of Particle Interception (Collision)
The first subprocess of interest is the interception of the particle by the bubble. This
probability is an indication of the particle moving into range of the bubble surface where
surface forces and thin-film phenomena become important. Other terms used for this
subprocess are probability of capture and probability of collision. For a bubble particle
collision to occur, the particle must travel towards a bubble (with radius RB) in a
streamline that lies within a capture radius, RC, from a vertical line from the bubble
center, as shown in Figure 2.3. Collision probability between two spheres, PC, was
defined by Sutherland (1948) as
2
⎟⎟⎠
⎞⎜⎜⎝
⎛=
B
CC R
RP
(2)
The difficulty therefore becomes estimating the capture radius.

22
Figure 2.3: Diagram of capture radius. Particle to bubble collision occurs when a particle enters on a streamline within RC.
2.5.1.1 Collision with No Particle Inertia
The probability of collision derived from stream functions by Gaudin (1957), with the
assumption of Stokes flow at the bubble and particle surface and very small bubbles
(inertia effects of the particles were ignored), was
2
23
⎟⎟⎠
⎞⎜⎜⎝
⎛=
B
PC R
RP
(3)
where RP is the particle radius. Yoon (1991) found this model to be applicable for
bubbles smaller than 100 microns in diameter, which is unsatisfactory for flotation
modeling due to the assumption of very small bubble sizes. Reay and Ratliff (1987) used
numerical solutions of the Navier-Stokes equations to derive
Rc
RB
Rc
RBRP
Rc
RB
Rc
RBRP

23
n
B
PC R
RAP ⎟⎟
⎠
⎞⎜⎜⎝
⎛∝ (4)
which indicates a power law relationship between the ratio of particle and bubble size and
the probability of collision with coefficients A and n. They also indicate that the collision
is a function of the flow behavior of the particle and bubble, e.g. the Reynolds number of
the bubble, ReB. Weber and Paddock (1988) used the power law relationship and
numerical methods to derive expressions for A and for n to obtain
( ) 2
56.0Re29.01
Re163
123
⎟⎟⎠
⎞⎜⎜⎝
⎛
⎟⎟⎟
⎠
⎞
⎜⎜⎜
⎝
⎛
++=
B
P
B
BC R
RP (5)
which was the first collision model to apply for wide ranges of particle and bubble sizes.
Yoon et al (1999) used stream functions for intermediate Reynolds numbers to obtain
272.0
15Re4
23
⎟⎟⎠
⎞⎜⎜⎝
⎛⎟⎟⎠
⎞⎜⎜⎝
⎛+=
B
PBC R
RP (6)
Yoon reports that, despite the functional difference in these relations, the predicted
probabilities from both models closely match one another (2000). Note that both models
agree with Gaudin in that they reduce to equation (3) for low Reynolds number (Stokes
flow). Nguyen (1994) presents collision probabilities from several different sources for
many sets of Reynolds number values.
2.5.1.2 Collision with Particle Inertia
The preceding developments assume that, since particle mass density is often low,
particle inertia can be ignored. The particles are therefore assumed to closely follow the
streamlines around the bubble. If particle inertia is high, as is always the case in mineral

24
flotation, impact collision can occur. The particles will directly strike and deform the
bubble surface. For adsorption to occur in these circumstances, the attractive surface
forces must stabilize before the particle is repelled by the reformation of the bubble.
Particles with a very small Stokes number are dominated by streamline contact (they
follow the streamlines around the bubble), and large Stokes numbers are controlled by
impact collisions. The collision of particles with intermediate Stokes numbers from
0.001 to 1, the intermediate range reported by Schulze (1984), will be controlled by both
mechanisms. Deinking particles usually have very small Stokes numbers due to their
small size and small density.
29 Bl
BPP
dvdSt
μρ
= (7)
Here, ρP and dP are the density and diameter of the particle, vB and dB are the rise velocity
and diameter of the bubble, and μl is the viscosity of the water. Typical Stokes number
values for spherical glass particles in water (25° C) are 0.003 for a particle diameter of 75
μm and 0.55 for a particle diameter of 450 μm. Schulze (1989) proposed that the
contributions of interception collision, gravitational collision, and inertial collision are
additive to obtain the overall collision probability as shown in equation (8).
( ) In
B
P
CgCOverallC E
RR
EEPP ⋅
⎥⎥⎥⎥⎥
⎦
⎤
⎢⎢⎢⎢⎢
⎣
⎡
⎟⎟⎠
⎞⎜⎜⎝
⎛⎟⎠⎞⎜
⎝⎛+
−++=2
11
(8)
Here, PC is the probability of sliding, or incident, collision as described in section 2.5.1.1,
Eg is a term representing the contribution of gravitational motion, and EIn represents the

25
contribution of inertial forces. The effect of inertia is therefore to shift the path-line
followed by the particle toward the bubble surface. The effect of gravity is expressed as
c
B
P
B
P
B
Pg
vv
vv
RRE φ2
2
sin1
1
⎥⎥⎥⎥⎥
⎦
⎤
⎢⎢⎢⎢⎢
⎣
⎡
⎟⎟⎠
⎞⎜⎜⎝
⎛+
⎟⎠⎞⎜
⎝⎛ +=
(9)
where vP and vB are the terminal settling and rising velocities of the particle and bubble,
respectively and φc is the critical tangential flow angle, defined by as
( )Bc Relog37.71.78 −=φ
for 20 < ReB < 400
(10)
The inertial effects were defined, in terms of the Stokes number as
( )
b
B
PIn aSt
StR
RE ⎥⎦
⎤⎢⎣
⎡+
⎟⎠⎞⎜
⎝⎛ +=
2
1
(11)
with a and b being system parameters depending upon the Reynolds number of the rising
bubble.
Dai et al. (1998) modified the work of Dukhin (1982) to develop a separate
relation for collision taking into account the inertial forces and the centrifugal action on
the particle as it slides around the bubble. Dukhin (1982) used a parameter called the
angle of tangency, which is the polar location where the centrifugal force and the inertial
force cancel each other, to combine the effect of each in the probability of particle
capture:
( )[ ]{ } 5.05.0212arcsin βββθ −+=C (12)
26
where B
P
RR
St⋅
⋅=
32β
Equation 8 becomes
⎪⎪⎭
⎪⎪⎬
⎫
⎪⎪⎩
⎪⎪⎨
⎧
⎥⎥⎥⎥
⎦
⎤
⎢⎢⎢⎢
⎣
⎡
⎟⎠⎞⎜
⎝⎛
−+−⎟⎟
⎠
⎞⎜⎜⎝
⎛−⋅⋅⋅=
tB
P
tt
P
Btt
B
PC
RRR
RStR
RPθ
θθθφ
2
32
sin6
cos3cos28.1lncos3expsin3
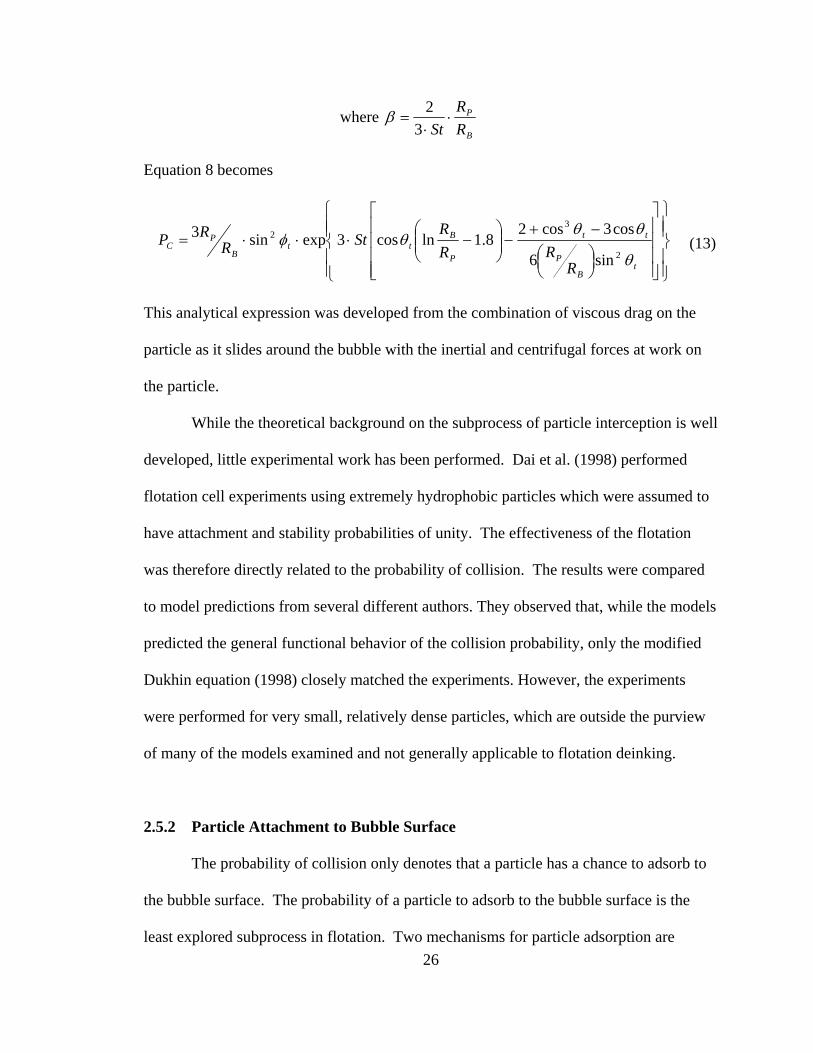
(13)
This analytical expression was developed from the combination of viscous drag on the
particle as it slides around the bubble with the inertial and centrifugal forces at work on
the particle.
While the theoretical background on the subprocess of particle interception is well
developed, little experimental work has been performed. Dai et al. (1998) performed
flotation cell experiments using extremely hydrophobic particles which were assumed to
have attachment and stability probabilities of unity. The effectiveness of the flotation
was therefore directly related to the probability of collision. The results were compared
to model predictions from several different authors. They observed that, while the models
predicted the general functional behavior of the collision probability, only the modified
Dukhin equation (1998) closely matched the experiments. However, the experiments
were performed for very small, relatively dense particles, which are outside the purview
of many of the models examined and not generally applicable to flotation deinking.
2.5.2 Particle Attachment to Bubble Surface
The probability of collision only denotes that a particle has a chance to adsorb to
the bubble surface. The probability of a particle to adsorb to the bubble surface is the
least explored subprocess in flotation. Two mechanisms for particle adsorption are

27
possible. The particle may slide around the bubble surface along a streamline; as it
slides, the aqueous film between the particle and the bubble can thin and eventually
rupture. If the film thins to some critical value, the particle will adsorb to the bubble
surface. The particle also may directly impact the bubble surface. As the particle strikes
the bubble, the bubble is deformed. If a stable contact is achieved before the particle is
repulsed by the reformation of the bubble surface, adsorption will occur. Both
mechanisms will be discussed.
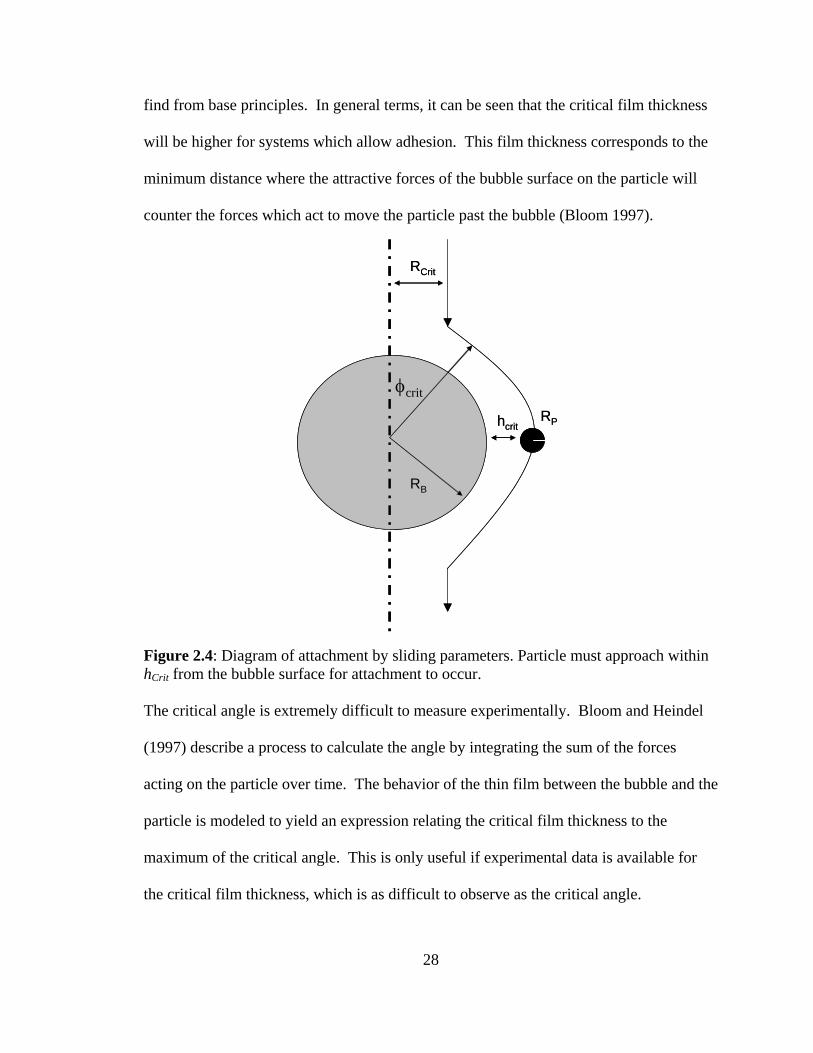
2.5.2.1 Particle Adhesion by Sliding
For a particle to attach, it must slide along the bubble surface and the thin aqueous
film at the surface must drain to some critical thickness, hCrit, as shown in Figure 2.4. A
particle approaching the bubble in a streamline that lies within RCrit will reach this film
thickness. Similar to the development of Sutherland (1948) the probability that a
particular particle will do this then becomes
( )2
2
PB
CritASL RR
RP
+= (14)
and can be expressed in terms of the critical angle as
CritASLP φ2sin= (15)
The critical film thickness, and therefore the critical angle, depends upon the surface and
hydrodynamic forces of the system. The forces at work include the weight of the
particle, the centrifugal force as the particle slides around the bubble, the flow force due
to the streamlines, the drag force opposite to the flow, and the resistive force of the film
draining. These are all very complicated and interconnected and thus very difficult to
28
find from base principles. In general terms, it can be seen that the critical film thickness
will be higher for systems which allow adhesion. This film thickness corresponds to the
minimum distance where the attractive forces of the bubble surface on the particle will
counter the forces which act to move the particle past the bubble (Bloom 1997).
Figure 2.4: Diagram of attachment by sliding parameters. Particle must approach within hCrit from the bubble surface for attachment to occur. The critical angle is extremely difficult to measure experimentally. Bloom and Heindel
(1997) describe a process to calculate the angle by integrating the sum of the forces
acting on the particle over time. The behavior of the thin film between the bubble and the
particle is modeled to yield an expression relating the critical film thickness to the
maximum of the critical angle. This is only useful if experimental data is available for
the critical film thickness, which is as difficult to observe as the critical angle.
RB
hcrit
φcrit
RCrit
RP
RB
hcrit
φcrit
RCrit
RP

29
Other authors have proposed formulations for the probability of adhesion by
sliding based upon flow and fluid parameters. The development of Yoon et al. (2000):
( )
⎪⎪
⎭
⎪⎪
⎬
⎫
⎪⎪
⎩
⎪⎪
⎨
⎧
⎥⎥⎥⎥⎥
⎦
⎤
⎢⎢⎢⎢⎢
⎣
⎡
⎟⎟⎠
⎞⎜⎜⎝
⎛+
+−=
130
Re845exparctan2sin
72.02
P
BB
iBBASL
RRR
vP
τ (16)
applies for intermediate Reynolds numbers. The authors avoid the problem of
determination of the critical angle by using a parameter, τi, which is the minimum
induction or sliding time of the particle needed to cause attachment. Much flotation
research involves determination of this induction time analytically or experimentally (Gu
et al., 2003 & 2004; Peng, 1996; Yoon et al., 2000).
2.5.3 Probability of Formation of Three-Phase Contact
Once the thin film has ruptured, three-phase contact points must form between the
bubble, particle, and liquid. A contact point must form quickly to prevent the particle
from immediately detaching from the surface. Schulze (1984) proposes that the turbulent
vortices in the cell are the main source of disruption of this formation and that for
formation to occur, the time needed to form the three-phase contact, τTPC, must be less
than the average lifetime of the turbulent vortices, τv. He proposes that the probability of
this formation has the form
⎟⎟⎠
⎞⎜⎜⎝
⎛ −−=
TPC
vTPCP
ττ
exp1 (17)

30
Schulze also shows that this probability is equal to 1 for many particles sizes. Indeed,
most authors neglect this probability in their models (Heindel & Bloom, 1997; Dai et al.
2000; Yoon, 1991).
2.5.4 Probability of Attachment Stability
If attachment does occur, a particle must remain adsorbed to the bubble surface in
order to be successfully floated. The probability of attachment stability is also
complicated, but can be developed by performing a force balance on the adsorbed particle
(Heindel, 1997). It is generally assumed that the particle has moved to the bottom of the
rising bubble surface. The experimental work of Plate (1991) shows that the probability
of stability has the functional form
⎟⎠⎞
⎜⎝⎛ −−=
'11exp1
BoPStab (18)
where Bo’ is the modified Bond number as defined by Schulze (1989):
Attach
Detach
FF
Bo =' (19)
The important parameter therefore is the ratio of the forces of detachment, FDetach and the
forces of attachment, FAttach. The forces of attachment include the apparent weight of the
particle, FWt, the drag on the particle from the incident flows, FD, and the capillary force
on the bubble side due to surface tension, Fσ
σFFFF DWtDetach ++= (20)
The forces of attachment consist of the capillary force on the liquid side, FCa, and the
hydrostatic pressure force, FHyd:

31
HydCaAttach FFF += (21)
These forces and their directions are summarized in Figure 2.5 (Heindel 1997).
Figure 2.5: Illustration of the forces of attachment and detachment important to the probability of particle adhesion stability.
The apparent weight of the particle combines the gravitational force on the particle and
the buoyancy force of the liquid on the particle. For spherical particles, it is expressed by
(22)
The drag force is caused by the flow friction which is due to the local fluid motion in the
flotation cell.
( )gRF lppwt ρρπ −= 3
34

32
cppd aRF ρπ 3
34
= (23)
Schulze assumes that only the centrifugal acceleration, ac, due to turbulent eddies is
significant so that the acceleration term in the drag force becomes
(24)
Here the turbulent energy density, ε, is necessary to calculate the drag force. For a
typical flotation cell, Schulze gives this to be between 10-3 and 10-1 kW/kg or 104 to 107
mm2s3 (1984). The capillary force on the bubble surface, Fσ, is the measure of the
tendency of the bubble to minimize its surface area. The bubble / water interface
contracts, which ejects the particle from the three-phase contact point. This force is given
by the following:
ωρσπσ22 sin22
⎟⎟⎠
⎞⎜⎜⎝
⎛−= gR
RRF lB
Bp
(25)
Here σ is the interfacial surface tension between the liquid and gas and ω is the angle
shown in Figure 2.6.
( )31
32
9.1
pB
c
RRa
+=
ε

33
Figure 2.6: Illustration of stably adsorbed particle at the bottom of a bubble.
The attachment forces consist of the capillary force on the liquid side and the
hydrostatic pressure force due to the thin film surrounding the bubble. Most authors
neglect the hydrostatic pressure, so the force of attachment consists only of the capillary
forces acting at the three phase contact line. The capillary force acting on the particle is
)sin(sin2 θωωσπ +−= pca RF (26)
where θ is the contact angle of the three-phase system. Schulze makes the assumption to
maximize both capillary forces by setting
ω = π − θ/2. (27)
Equations 25 and 26 become
(28)
)2sin()2sin(2 θπθπσπ +−−= PCa RF (29)
⎟⎠⎞
⎜⎝⎛ −⎟⎟
⎠
⎞⎜⎜⎝
⎛−=
2sin22 22 θπρσπσ gR
RRF lB
Bp

34
The overall forces of attachment and detachment therefore can be expressed as
)2sin()2sin(6 θπθπσ +−=AttachF (30)
( )
)2(sin2239.1
4 2
31
32
2 θπρσερρ −⎟⎟
⎠
⎞⎜⎜⎝
⎛−+⎟
⎟
⎠
⎞
⎜⎜
⎝
⎛
++Δ= gR
RR
RRgRF lB
BP
BP
PPPDetach (31)
The value and nature of the three phase contact angle is a source of some contention.
Some authors assume it to be that determined by the sessile drop method common to
surface science characterization as described in Shaw (1992). However, Vinke et al.
(1991) used equilibrium images of catalyst particles adsorbed to stationary bubbles to
determine the maximum bubble coverage angle. They derived an expression for the
three-phase contact angle. Their experimental results do not match those of classical
goniometry measurements, such as those described in Shaw (1992).
2.5.5 Kinetic Modeling of Flotation
The probabilities of each subprocess can be combined to form kinetic constants for a
population based kinetic model. The flotation process can be modeled as a reversible
reaction (Gochin, 1990),
between the bubbles and the particles. The k1 term is the rate constant of particle
adsorption and k2 is the rate constant of desorption. If the number of bubbles in the
flotation cell remains constant and large, then the rate of formation for bubble/particle
aggregates is a function of the number of particles and bubbles. The form of k1 is
Bubbles + Particles Aggregates k2
k1
35
StabTPCASLC PPPPZk =1 (32)
where Z is the number of bubble particle collisions per unit volume and time. Remember
that Pc is the probability that a particle entering on a streamline within radius of RB from
the vertical with respect to the bubble will be contained in a streamline Rc away from the
vertical. The parameter Z can be seen to be the rate at which a particle enters the RB
streamline. Liepe and Mockel (1976) determined this collision frequency empirically for
small metal particles to be
( ) 21
34
914
34
914
2
32
31
94
97
352 ⎟⎟
⎠
⎞⎜⎜⎝
⎛Δ+Δ+
⎟⎟⎟
⎠
⎞
⎜⎜⎜
⎝
⎛=Ζ BBppBp
ll
RRRR ρρρν
ε (33)
The apparent densities, Δρp and ΔρΒ, are the difference between the density of the fluid
and the density of the particle and bubble, respectively. As the motion of the suspended
particles is a strong function of their size and density, this expression may not be
applicable to flotation deinking. The rate that particles desorb from the bubble surface is
given by
( )StabDestab PZPZk −== 1''2 (34)
Here, Z’ is the rate at which the particles become destabilized. Heindel states “This term
could be thought of as a collision rate between the bubble-particle aggregates and the
“thing” that makes the aggregate unstable, like a turbulent eddy or another aggregate”
(1997). The term is assumed to be the rate at which the destabilizing phenomena occurs,
and can only be determined through experiment.

36
2.6 Purpose of This Research
This document will present the use imaging of particle / bubble interactions to
better understand the phenomena of flotation. Some of the important process parameters
will be examined by direct observation of particle to bubble interaction. The
subprocesses important to successful flotation will be studied to evaluate the currently
available models and theories. It is hypothesized that the flow behavior of the fluid
between the particle and the surface of the bubble plays a role as important as the surface
properties of the system.

37
CHAPTER 3
EXPERIMENTAL METHODS The approach of this research was to use the experimental methods developed by
Davies et al. (2000), Davies and Duke (2000), and Emerson et al. (2006) for the study of
deinking flotation to investigate the fundamental phenomena important to the process.
These methods are useful for examination of the important system parameters and for
study of the fundamental subprocesses of flotation.
3.1 Experimental Apparatus
Two experimental apparatus were used: 1.) the stationary bubble tank, in which a
stationary bubble is created and particles introduced so as to allow the study of the bubble
/ particle interactions and 2.) the suspended bubble flow facility, which simulates the
rising of a bubble in a flotation cell. These facilities allow advanced imaging of the
phenomena with high spatial and temporal resolution imaging equipment. The images
can then be processed to allow observation of the data, or to quantify bubble coverage
and particle sizes.
3.1.1 The Stationary Bubble Facility
Andrew Davies constructed the stationary bubble facility in 1998. The facility
allows the analysis of particle / bubble interactions in a quiescent fluid. The interactions

38
are then imaged. The use of the stationary bubble facility has several advantages. The
imaging system and particle solutions can be prepared and tested without the additional
problem of a moving bubble. Also, the experiment time and cleanup are much easier
with the stationary bubble facility, allowing fast studies of particle adsorption to be
performed. Third, the surface forces involved in particle adsorption can be studied
independent of the bulk fluid and surface fluid motions found in the suspended bubble
column. This advantage can also be a weakness, as the flow field around a bubble is very
important to each of the fundamental flotation subprocesses.
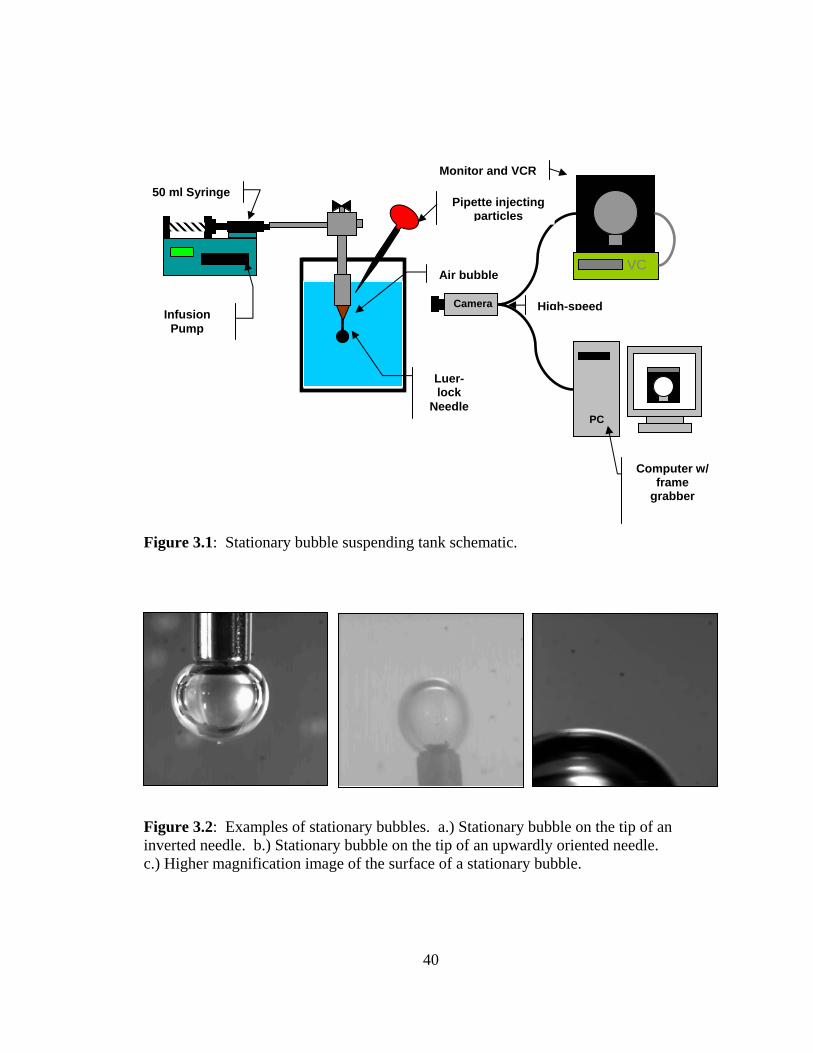
Figure 3.1 shows a schematic of the stationary bubble facility. A needle is placed
in a quiescent fluid in a 3.5-liter clear plastic tank. It is then fed air very slowly from a
KD Scientific 50-ml syringe pump (model number 210) to create and suspend a bubble at
the tip of the needle but not allow the bubble to detach. A check valve prevents back
flow of air. A pipette is then used to inject contaminant particles onto the bubble surface.
The high-speed camera is used to record the injection.
The stationary bubble facility also allows for the stability of the adsorption of
particles onto the bubble surface to be examined. By placing a stir bar in the stationary
bubble tank and putting the tank onto a magnetic stir plate, adsorbed particles or
networks can be imaged in the presence of flowing and turbulent flow fields. The
Reynolds number of the flow, based upon the bubble size and the local velocity, can be
varied considerably by the adjustment of the stirrer RPM. Reynolds number values (ReB)
similar to those found in a flotation cell, from 1 to 150, are easily obtainable.
Figure 3.2 shows three example images of stationary bubbles in different
apparatus configurations. The first bubble is on the tip of a needle which is inverted in

39
the stationary tank. This configuration is best suited to qualitative study the effectiveness
of system chemistry and particle size. It is also useful in observing the formation of
particle networks and their stability. Figure 3.2b. is a bubble on the tip of a needle
oriented upwards. This orientation is more appropriate for the study of the mechanisms
of particle collision. Flotation modeling assumes that a particle approaches a bubble in a
cylinder above the surface before striking the bubble or flowing around its surface; an
obstruction, such as the needle, does not allow the observation of this process. Figure
3.2c is a high magnification image of the top of the bubble surface. This configuration is
most useful in the study of the of the interaction between one particle and the bubble.
40
Figure 3.1: Stationary bubble suspending tank schematic.
Figure 3.2: Examples of stationary bubbles. a.) Stationary bubble on the tip of an inverted needle. b.) Stationary bubble on the tip of an upwardly oriented needle. c.) Higher magnification image of the surface of a stationary bubble.
Camera
PC
Monitor and VCR
High-speed
Pipette injecting particles
50 ml Syringe
Computer w/ frame
grabber
Infusion Pump
Air bubble
Luer-lock
Needle
VC

41
3.1.2 The Suspended Bubble Facility
In order to better simulate industrial conditions, a bubble must be imaged in a
flow field. A moving camera is not feasible, so the suspended bubble flow facility was
created in 1998. A carefully controlled flow of water is used to keep a bubble in place in
front of the imaging area by countering the buoyant motion of the bubble. By carefully
controlling the flow of water, the buoyancy of the bubble can be matched, and the bubble
will remain suspended in the flow field. The facility stands 9 feet tall and holds 8 liters
of solution. Figure 3.3 shows a schematic of the flow facility.
The imaging column is a plexiglas pipe; it is held in place with flanges so that
different columns may be used. A 1.5” (38 mm) pipe used to reduce the wall effects.
The air is injected through medical grade needles and supplied directly from a
compressed air cylinder. The flow from the cylinder and the needle size can both be
altered to control the size and number of suspended bubbles. The water pump is a 1/8 HP
Cole-Palmer Magnetic Drive Pump; it is rated at 3200 RPM and delivers 14 GPM (73
LPM) with 10 feet of head (3.05 m of H2O). The rotometers are Cole-Palmer
polysolfanone direct-reading in-line flowmeters with 316 stainless steel floats. There are
three flowmeters in parallel to measure three different flow ranges: 0.1-1.0 GPM (0.37 –
3.7 LPM), 0.2-2.0 GPM (0.74-7.4 LPM), and 2.0-20.0 GPM (3.7 – 14.8 LPM). At the
top of the column is a holding chamber that allows bubbles to leave the flow loop prior to
reaching the pump. At the bottom of the holding chamber are vertical ¼ inch tubes that
smooth the velocity profiles in the downflow entering the imaging column: Davies et al.
(2000) determined that the flow will be fully developed at a distance of about 1 foot

42
(0.3m) down the length of the column. Therefore, all imaging occurs along the lower
half of the column.
Figure 3.4 shows several different sizes of suspended bubbles and their terminal
velocities. The smaller bubbles are more spherical than the larger bubbles, as expected.
Larger bubbles require a higher flow rate in the column to be suspended. The bubbles
may deform from a spherical shape and take a more elliptical shape. Davies et al. (2000)
determined that the terminal rise velocities of the bubbles most closely match those found
by theoretical modelling of flow around a rigid sphere. Most flotation modelling,
especially that for deinking flotation, assumes a rigid sphere model for bubble flow.
Experiments involving the flow facility are performed much the same as those for
the stationary facility. The desired chemistry is prepared and placed in the flow loop.
Next, the water pump is turned on. Then, bubbles are released from the needle; the
desired bubble size is controlled by the needle size and by the flow rate of air. The valve
positions on the flow facility are controlled to suspend the bubble in the field of view of
the camera. Particles are then introduced into the top of the column. The camera is
often operated in “Center” mode, where data is continuously being recorded. As the
camera memory fills, old data is replaced by new data. When an interesting event is
observed on the monitor, the record command is entered. The camera then keeps some of
the data prior to the recording and fills the memory with new data. For example, at 250
fps, the camera will keep 2.7 seconds prior to the record command and 2.7 seconds after.
The suspended bubble flow facility more closely models the flow fields of the
bubble / particle system. As demonstrated in section 2.5, the flow field around the bubble
is crucial to all facets of flotation modeling. By evaluating images from suspended

43
bubble experiments, the process scale parameters such as effect of particle size, system
chemistry, and bubble size can be observed as well.
Figure 3.3: Suspending bubble flow facility schematic.
Plexiglass pipe (diameter: 1.75 in, length: 4-5 ft)
Control valves
Bypass
Pump
Flow meters (Rotameters)
PVC pipe (diameter: 3.5 in) Evacuation chamber
Air injector
Air bubble
White screen Thermocouple
CCD Camera
Shutoff valve
Flanges
Electric Solenoid Valve
Injection Chamber

44
Figure 3.4: Example images of suspended bubbles of various sizes, their terminal velocities, and the flow rates needed to suspend them [Davies and Duke, 2000]. All bubbles are roughly spherical, with the larger sized bubbles becoming more ellipsoidal.
Flowrate = 2.5 LPMTerminal velocity =
5.7 cm/sDiameter = 0.25 mm
Flowrate = 3.2 LPMTerminal velocity =
6.6 cm/sDiameter = 0.33 mm
Flowrate = 3.6 LPMTerminal velocity =
8.2 cm/sDiameter = 0.46 mm
Flowrate = 6.5 LPMTerminal velocity =
14.8 cm/sDiameter = 0.90 mm
Flowrate = 2.9 LPMTerminal velocity =
7.3 cm/sDiameter = 0.36 mm
Flowrate = 2.7 LPMTerminal velocity =
6.2 cm/sDiameter = 0.26 mm

45
3.1.3 Particle to Bubble Collision Apparatus In order to better examine the collision of a particle with a rising bubble, the
particle to bubble collision apparatus was constructed. A bubble is created in a vertical
piece of capillary tubing filled with fluid. Particles are released at the top of the capillary,
and timed such that a bubble collides with the particles in view of the high-speed camera
system. Figure 3.5 is a schematic of the particle to bubble collision apparatus. The
apparatus stands 1.3 meters tall, and holds approximately 50 mL of solution.
The bubble rise area is a 1.0 meter glass tube, with an inside diameter of 5 mm.
The tubing is attached to an air injection system and sealed at the bottom. Air is injected
into the column by a syringe pump which produces bubbles through a Luer-lock medical
needle. Bubble size can be controlled by a combination of flow rate and needle size.
To ensure that a particle – bubble collision is more easily viewed, a steady stream
of rising bubbles is created in the tubing. Particles are introduced at the top of the
apparatus. The camera is operated in “Center” mode; in this mode, the camera system,
upon the record command, records the previous 1.3 seconds and following 1.3 seconds.
When the particles fall in view of the camera, a movie sequence is recorded. Data from
this apparatus is used to directly observe and estimate the probability of particle to bubble
collision.

46
Figure 3.5: Particle to bubble collision apparatus schematic. 3.1.4 Imaging System
A high speed imaging system is used to analyze the adsorption of ink and glass
particles onto the bubble surface. The camera used is a Kodak SR-500 Motion Corder
Analyzer. The camera allows high temporal resolution by recording up to 1000 frames
per second. Many of the experiments presented were performed at a speed of 250 frames
per second. The camera has an image resolution of 512 by 480 pixels at 250 fps. The
system has an online memory of 1365 frames, which, at 250 frames per second,
corresponds to about 5.5 seconds of elapsed time. The shutter speed of the unit is
controlled electronically to reduce motion blur. A tradeoff exists between adequate
Infusion Pump
Air
Check Valve
Luer-lock Needle
High Speed Camera
8 mm Glass Capillary

47
lighting and shutter speed; the default speed of 250 Hz was suitable for the toner ink
studies. The collision studies presented in section 4.2 required variation of the shutter
speed from 500 to 1000 Hz to control the blurring caused by the motion of the glass
particles. The Motion Corder outputs to a VCR and monitor for an analog copy of data
and to a PC so that the collected frames can be captured and rendered into a video.
Digital image output directly to the computer allows for image processing of individual
frames with no loss in spatial or temporal resolution.
Several lens systems are available for use in this imaging system. A Micro-
Nikkor 60mm AF close-up lens was used for much of the toner ink studies. This lens is
very easy to use as the lighting is not difficult to arrange. This lens has a field of view of
9.7 cm2 to wide shots of 25.8 cm2. It has a deep plane of resolution, making it best suited
for the suspending bubble flow facility. Typical spatial resolutions for this lens system
are 7 microns per pixel for the stationary bubble facility and 25 microns per pixel for the
suspending bubble flow column. For the fundamental impact collision studies presented
in Section 4.2 an Edmund Video Zoom Microscopic VZM 3001 was used. This lens
allows for a more resolved close up image of the bubble surface. The depth of field of
the lens is smaller, which can cause blurring of large particles. This lens has a
magnification of up to three times, and a minimum field of view of 4 mm2. For much of
this work the microscopic lens was operated at a magnification of 1.5 times with a field
of view of 25 mm2. A typical image resolution is 5.5 microns per pixel. A very high
magnification lens system consisting of a Questar QM 1000 MKII has also been used to
image the behavior of adsorbed particles and particle networks very near to the bubble
surface.
48
3.2 Preparation of Model Particles
The experimental facilities described above allow for the observation of many
different types of particles. Several types of particles have been used in this work,
including different inks, polymer contaminants, and glass beads.
3.2.1 Toner Particle Solution Preperation
The source of toner used for these studies was that used in laserjet printers. Two
methods were used to prepare toner particles: scraping from toner printed transparencies,
and grinding and fractionating from heat-set ink.
The scraped particles were obtained using the methods of Paulsen (1997).
Overhead transparency films were printed with a full page of text by an inkjet printer
using Hewlett Packard cartridges (Model 92298A). The transparencies were trimmed to
remove the unprinted edges and soaked in distilled water for 3 hours. The toner was
scraped off of the surface of the films using a metal spatula. The particles sink to the
bottom of the collection vessel. Excess water over the particles was removed for ease of
storage. Scraped ink particles were thin and planar, and vary greatly in size and shape.
Ground particles are obtained by heating toner powder in an oven at 80°C. The
raw toner powder was obtained from Hewlett Packard cartridges (Model 92298A)
intended for use in a LaserJet 4 high speed printer. Oven-baking fused the toner particles
into a large solid block which was broken up by a hammer. The pieces of toner were
then ground using a mortar and pestle and fractionated into different size categories using
a Retsch AS 200 screening system. A series of screens with mesh sizes of 40, 60, 100,

49
and 200 were used. The particles were weighed and mixed with the desired water and
surfactant solution. This procedure yields particles amorphous in shape, but of a similar
size and general shape.
Both sources of toner have advantages and disadvantages. The scraped toner has
a shape more similar to that found in the deinking process. The toner is also heat-set by
the printer; the oven-cooking process may not simulate all facets of printing. However,
there is no way to separate the scraped particles by size and the yield of particles is very
small. Also, as the toner cannot be removed from the water solution, it is difficult to
measure the amount of toner (on a dry basis) in the solution. Ground toner is easy to
separate by size and easy to weigh on a dry basis. The shape of the larger ground toner
particles does not correspond to that found in a flotation cell, however.
3.2.2 Glass Particle Preparation
Glass beads were used as model particles in the imaging studies.
Flotation modeling assumes that the adsorbing particle is spherical and that the
surface and physical properties of the particles are known. Contaminant particles found in
deinking flotation processes are often amorphous or large in aspect ratio. Their physical
and surface properties vary with the grade of source paper and the printing process.
Glass beads are useful in this regard as their physical properties are easily obtained.
Particle size can be carefully controlled. The particles are spherical, making them more
similar to the shape of particles used in flotation modeling. Surface properties such as
surface contact angle of an air / glass / surfactant solution are well documented and easily
measured. Amorphous glass particles can also be obtained by grinding and fractionating.

50
The glass beads used in this work (Product # G-9193, G-8893, and G-9268) were
manufactured by Sigma for use in disintegration of microorganisms by grinding. Particle
size ranges of less than 106 μm, 212 to 300 μm, 250 to 450 μm, and 425 to 600 μm were
used. The particles were rinsed twice with distilled water and stored in distilled water
prior to use. When the flotation chemistry was altered with a surfactant or the pH was
adjusted, the particle fluid was similarly altered so that the chemistry of the water
carrying the particles matched that of the flotation system. A typical injection contained
0.5 grams of glass particles.
3.3 Flotation System Preparation
Multiple system chemistries were used in this work. The procedure of Davies
(2000) was used to prepare a fatty acid flotation chemistry based upon in-system creation
of calcium oleate. Calcium oleate is an organic fatty acid-based surfactant commonly
used in industrial flotation. In a flotation cell, calcium oleate breaks up into calcium and
oleate ions. The oleate ions form oleaic acid, which is the active surfactant in the system.
Flotation with oleaic acid in the presence of calcium ions is more effective than that with
oleaic acid alone. It is thought that the calcium ions promote ink agglomeration by
binding the surfactant tails on the surface of the ink. This causes the ink particles to form
into larger flocs (Beneventi and Carre, 2000).
Sodium oleate and calcium chloride obtained from Fisher Chemicals were mixed
with distilled water at 40° C and stirred for 1 hour. The pH of the mixture was adjusted
to 9.5 using dilute sodium hydroxide and hydrochloric acid. The solution was heated to
remain at 40° C to prevent the calcium oleate from crystallizing. The concentration of
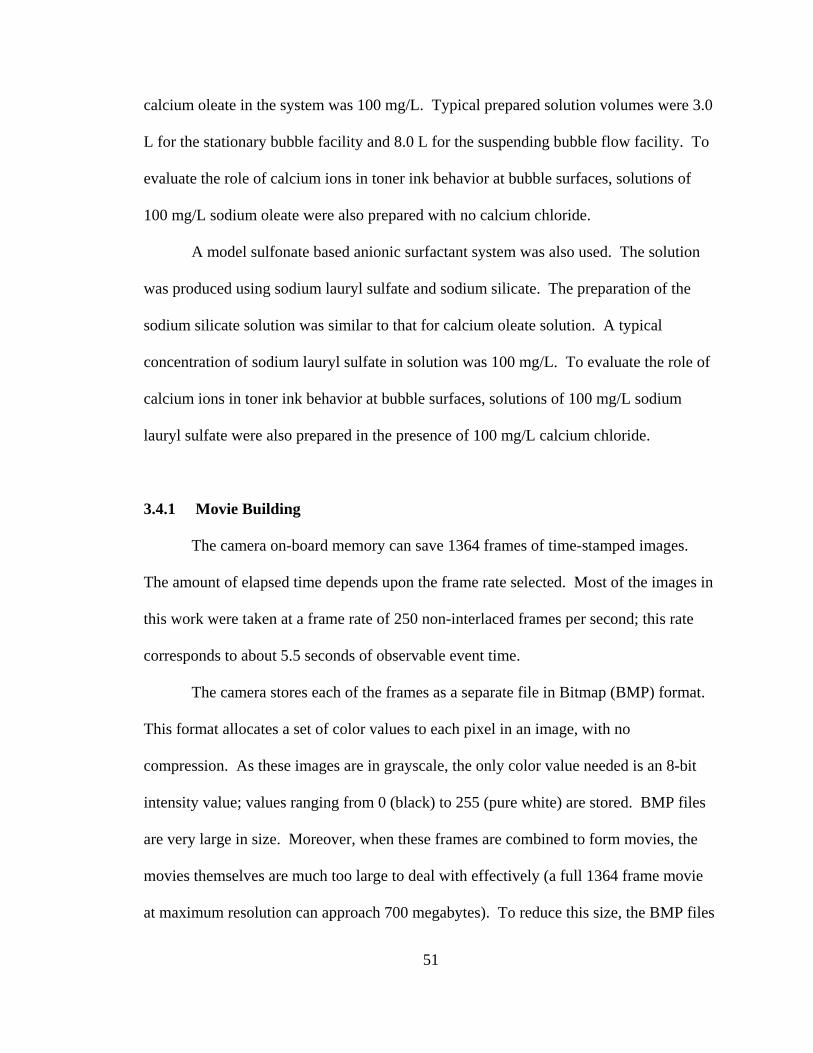
51
calcium oleate in the system was 100 mg/L. Typical prepared solution volumes were 3.0
L for the stationary bubble facility and 8.0 L for the suspending bubble flow facility. To
evaluate the role of calcium ions in toner ink behavior at bubble surfaces, solutions of
100 mg/L sodium oleate were also prepared with no calcium chloride.
A model sulfonate based anionic surfactant system was also used. The solution
was produced using sodium lauryl sulfate and sodium silicate. The preparation of the
sodium silicate solution was similar to that for calcium oleate solution. A typical
concentration of sodium lauryl sulfate in solution was 100 mg/L. To evaluate the role of
calcium ions in toner ink behavior at bubble surfaces, solutions of 100 mg/L sodium
lauryl sulfate were also prepared in the presence of 100 mg/L calcium chloride.
3.4.1 Movie Building
The camera on-board memory can save 1364 frames of time-stamped images.
The amount of elapsed time depends upon the frame rate selected. Most of the images in
this work were taken at a frame rate of 250 non-interlaced frames per second; this rate
corresponds to about 5.5 seconds of observable event time.
The camera stores each of the frames as a separate file in Bitmap (BMP) format.
This format allocates a set of color values to each pixel in an image, with no
compression. As these images are in grayscale, the only color value needed is an 8-bit
intensity value; values ranging from 0 (black) to 255 (pure white) are stored. BMP files
are very large in size. Moreover, when these frames are combined to form movies, the
movies themselves are much too large to deal with effectively (a full 1364 frame movie
at maximum resolution can approach 700 megabytes). To reduce this size, the BMP files

52
are converted into a different digital image format, JPG using a Corel PhotoPaint 10
script. JPG files are compressed to a much smaller size than BMP files; in most cases,
this compression causes little data loss, as the individual frames can be decompressed
rather quickly. These JPG files are then formed into a digital video in the AVI format
using Corel PhotoPaint 10 or Jasc Animation Shop 3. The conversion of the collection of
individual frames into a single movie causes some small, but acceptable, loss of intensity
resolution, with no loss in spatial resolution.
3.4.2 Quantification of Particle Adsorption
The amount of adsorbed particles on the bubble surface was quantified. For each
experiment, an image was taken of an object of known length, typically a ruler, to obtain
a spatial calibration. Typical resolutions for experiments were 7 μm per pixel in the
stationary bubble facility and 25 μm per pixel in the suspending bubble flow facility.
Image Tool, a freeware image analysis software package distributed by the University of
Texas Health and Science Center, was used for quantification of the adsorption of
adsorbed particles.
Individual frames from suspending bubble movies were used to find the size of
the bubble, the area or volume of adsorbed ink, and the ink-free area of the bubble.
Multiple still images were used for the quantification of each set of parameters.
The percent of the bubble covered by the ink is measured by determining the size
of the bubble and the area of the bubble that is free from ink. The remaining area is
assumed to be covered with ink. The fraction of bubble coverage is then found from

53
( )Bubble
FreeBubbleCovered A
AAF
−=
3-1
where ABubble is the area of the bubble based upon the measure bubble radius and AFree is
the measured ink-free bubble area.
In a similar manner, the volume of adsorbed ink can be calculated by measuring
the area of ink adsorbed in a frame from a suspended bubble movie. Figure 3.6 presents
an overview of this process. First, the area of the adsorbed ink is added to the area of the
bubble to get a total aggregate area. The effective radius of circle of an identical area is
determined from equation 3-3:
ATotal = ABubble + AInk 3-2
ATotal = π (Reff)2 3-3
This radius is used to find the effective volume of the aggregate, which is used to obtain
the effective volume of the adsorbed ink by subtracting out the volume of the bubble,
VBubble:
VTotal = 4/3 π (Reff)3 3-4
VInk = VTotal - VBubble 3-5

54
Figure 3.6: Illustration of calculation of adsorbed ink area.
The mass of adsorbed ink per bubble is then calculated by assuming the density and
concentration of the adsorbed ink particles.
ABlob Reff
RBubble

55
CHAPTER 4
VISUALIZATION RESULTS
This chapter focuses on the results of imaging experiments related to deinking
flotation. Imaging of the interaction between particles and bubbles is shown to be useful
in both the measurement of the effectiveness of system parameters and in studying the
fundamental mechanisms of flotation. The effect of surfactant and particle size on
flotation efficiency is examined by quantification of the amount of adsorbed ink on
bubbles in the suspending bubble flow facility. The mechanisms of particle to bubble
collision is studied for toner particles and for model glass beads using high-speed
imaging of particles injected onto a stationary bubble surface.
4.1 Adsorption of Toner
The imaging of toner inks is useful in determining the effect of system parameters
on the efficiency of flotation. By comparing measurements of percent bubble coverage
and mass of adsorbed ink, the effectiveness of flotation system chemistries can be
predicted.
4.1.1 Imaging of the Effect of Toner Particle Size and System Chemistry
Several different size ranges of toner particles were prepared by pulverizing and
fractionating oven-cooked toner. Studies of the effect of particle size were done at
stationary and suspending bubble surfaces in sodium oleate and sodium lauryl sulfate

56
surfactants in the presence and absence of 100 mg/L calcium chloride. Imaging of the
effect of particle size was done by Emerson and Susanna Presta Maso (2003).
Descriptions of the video data files for the toner ink studies are presented in Appendix A.
Figure 4.1 presents frames from a movie to illustrate the injection of 75 to 150
micron oven-cooked toner in 100 mg/L sodium lauryl sulfate. The stream of injected
particles strike the bubble and some attach to the bubble surface. The adsorbed particles
orient themselves with the flow from the injection, and then slide to the bottom of the
bubble. Figure 4.2 presents final images from several different injections of different
sized particles for 100 mg/L sodium lauryl sulfate. The images in Figure 4.3 were taken
from the end of injection movies for a solution of 100 mg/L sodium oleate and 100 mg/L
calcium chloride. Adhesion of particles was observed in all cases. The adsorbed
particles in the calcium oleate chemistry demonstrate the toner particle networks first
observed by Bonometti (2001). The networks consist of particles adsorbed to one
another by small contact points. As the fluid motion moves the networks, gaps between
particles can be seen. No such networks were seen to form in the sodium lauryl sulfate /
sodium silicate system.
Large toner particles were observed to adsorb to stationary bubbles by sharp
contact points (Thompson 1997, Emerson 2003). Figure 4.4 is a high magnification
image of a small particle adsorbed to a stationary bubble. The particle is attached
securely by a single sharp point. Agglomerated toner particles also display such behavior
when adsorbing to one another. Figure 4.5 is a high magnification image of an adsorbed
toner network. The network structure is seen to be quite complex, with individual
particles adsorbing to each other by sharp contact points. These networks are highly

57
mutable; individual particles are observed to rotate about the contacting points while
leaving the network intact.
In order to investigate the role of calcium ions in the behavior of toner ink
particles at bubble surfaces, additional studies were performed. Figure 4.6 presents final
frames from the injection of 250 to 450 μm toner particles onto bubble surfaces for
several different system chemistries. Figures 4.6 a. and b. compare the effect of calcium
chloride with sodium oleate surfactant. Toner particle tails and networks were seen in the
presence of calcium chloride, but not in its absence. To a lesser degree, similar behavior
was observed for sodium lauryl sulfate surfactant.
The suspending bubble flow facility was used to image the adsorption of particles
of different sizes in different flotation system chemistries. All suspending bubble movies
were recorded 15 to 45 seconds after ink particles were introduced into the bubble
column. The actual collision of a toner particle and a bubble was not observed, but many
bubble/particle aggregates were imaged for each case. Figures 4.7 and 4.8 present two
series of still images taken from several different suspending bubble movies. Figure 4.9
presents frames from suspended bubble sequences for several different chemistries.
Adhesion of particles is seen for each particle size range in each system chemistry. No
particle-free bubbles were seen for any system.
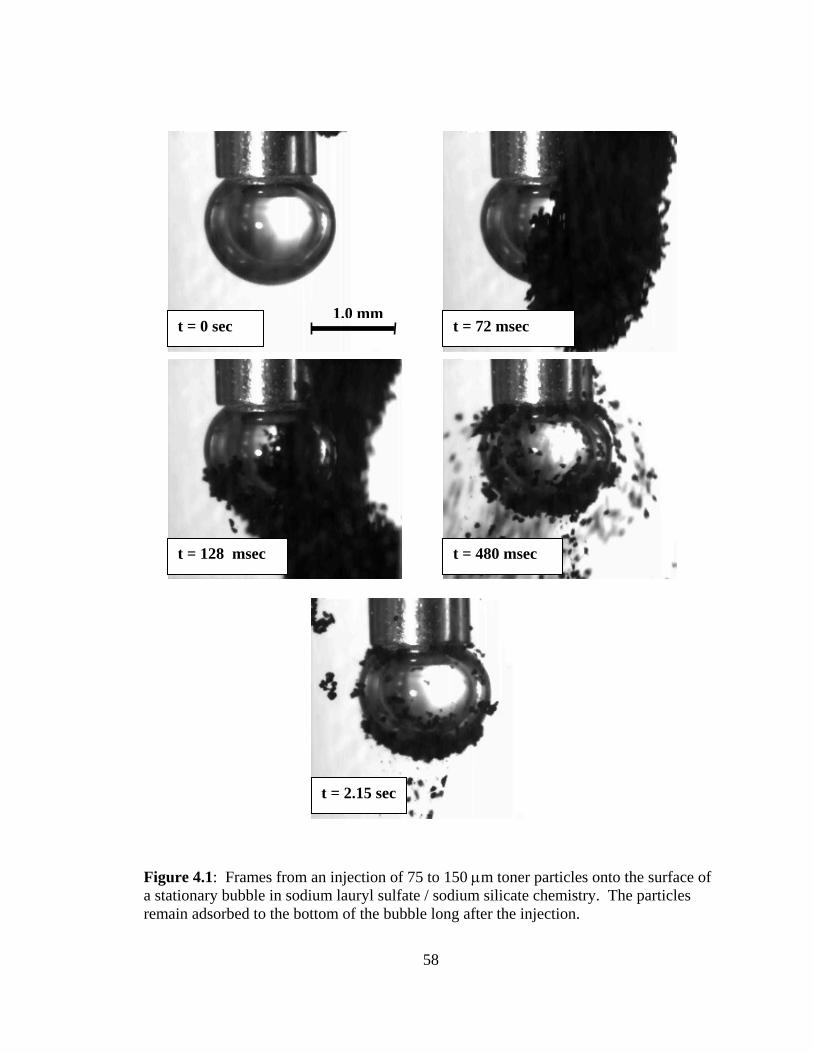
58
Figure 4.1: Frames from an injection of 75 to 150 μm toner particles onto the surface of a stationary bubble in sodium lauryl sulfate / sodium silicate chemistry. The particles remain adsorbed to the bottom of the bubble long after the injection.
t = 0 sec
t = 128 msec t = 480 msec
t = 72 msec
t = 2.15 sec
1.0 mm

59
Figure 4.2: Final images (after an elapsed time of at least 1.5 seconds) from the injection of varying sized toner particles in sodium lauryl sulfate / sodium silicate chemistry. a.) < 75 μm b.) 75 to 150 μm c.) 150 to 225 μm d.) 225 to 450 μm.
1.0 mm
1.0 mm1.0 mm
1.0 mm

60
Figure 4.3: Final images from the injection of varying sized toner particles in calcium oleate chemistry. Particle size: a.) < 75 μm b.) 75 to 150 μm c.) 150 to 225 μm d.) 225 to 450 μm. Networks of agglomerated toner particles are formed in each case.
1.0 mm

61
Figure 4.4: High magnification image of small adsorbed toner particle. The particle is attached to the bubble by a very small point.
Figure 4.5: High magnification image of a toner network in calcium oleate chemistry. Particles adsorb to each other and to the bubble by small sharp points. Large gaps are seen in the network.
0.5 mm
0.5 mm

62
Figure 4.6: Final images from the injection of 250 to 450 μm toner particles in varying chemistries. a.) 100 mg/L oleate b.) 100 mg/L oleate and 100 mg/L calcium chloride c.) 100 mg/ L lauryl sulfate d.) 100 mg/L lauryl sulfate and 100 mg/L calcium chloride.
a.) b.)
d.) c.)
1.0 mm1.0 mm
1.0 mm 1.0 mm
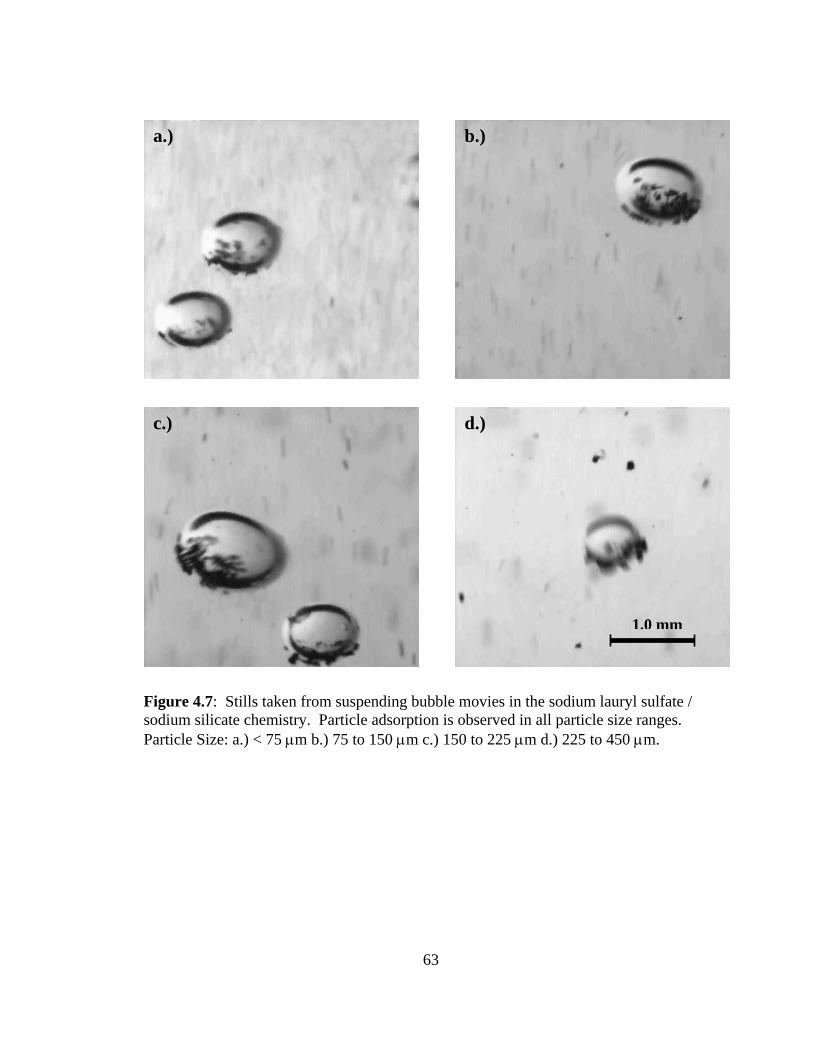
63
Figure 4.7: Stills taken from suspending bubble movies in the sodium lauryl sulfate / sodium silicate chemistry. Particle adsorption is observed in all particle size ranges. Particle Size: a.) < 75 μm b.) 75 to 150 μm c.) 150 to 225 μm d.) 225 to 450 μm.
1.0 mm
a.) b.)
c.) d.)

64
Figure 4.8: Selected images taken from suspending bubble movies in the calcium oleate chemistry. Particle adsorption is observed in all particle size ranges. Particle Size: a.) < 75 μm b.) 75 to 150 μm c.) 150 to 225 μm d.) 225 to 450 μm.
1.0 mm
b.) a.)
c.) d.)
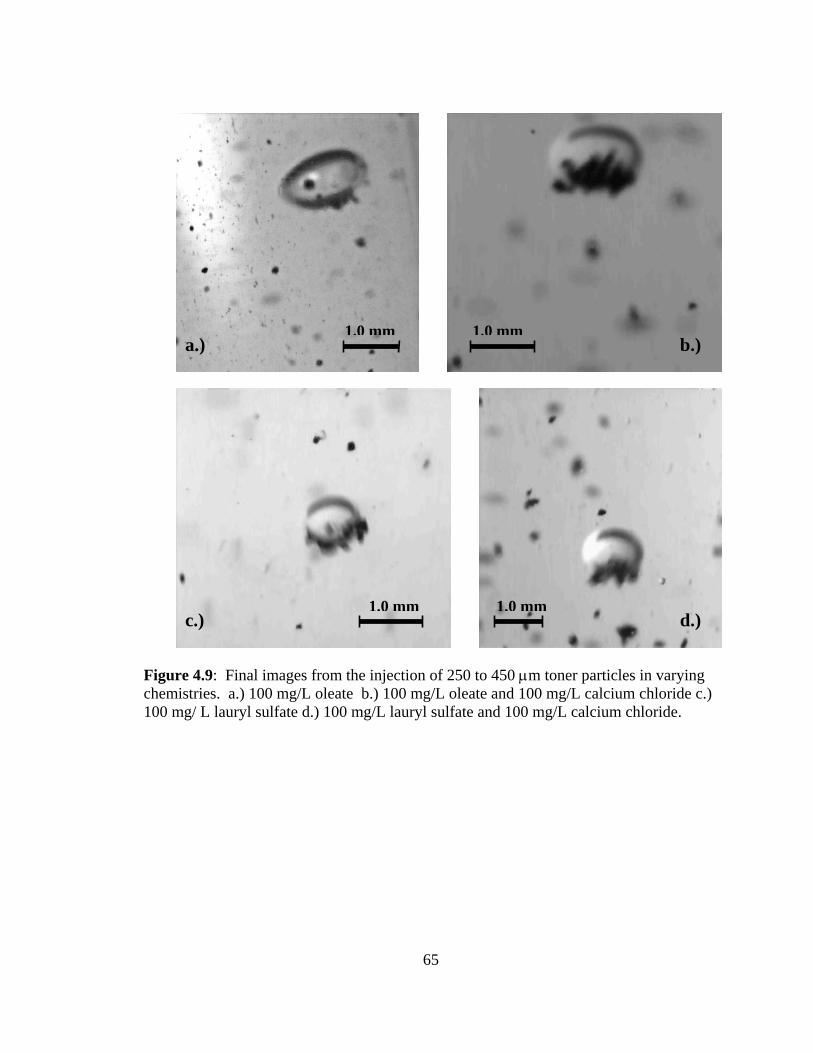
65
Figure 4.9: Final images from the injection of 250 to 450 μm toner particles in varying chemistries. a.) 100 mg/L oleate b.) 100 mg/L oleate and 100 mg/L calcium chloride c.) 100 mg/ L lauryl sulfate d.) 100 mg/L lauryl sulfate and 100 mg/L calcium chloride.
a.)
c.)
b.)
d.)
1.0 mm
1.0 mm1.0 mm
1.0 mm

66
4.1.2 Quantification of the Effect of Toner Particle Size and System Chemistry
Still images were used to quantify toner ink adsorption at bubble surfaces in the
suspending bubble flow facility. The amount of adsorbed ink was measured by the
methods described in section 3.4.2. The bubble surface coverage, volume of adsorbed
ink, and mass of adsorbed ink per bubble were measured for the different toner particle
size fractions in sodium oleate, sodium oleate + calcium chloride, sodium lauryl sulfate,
and sodium lauryl sulfate + calcium chloride. Ten to fifteen bubbles were measured for
each data point; multiple adjacent frames were measured for each bubble.
The density of adsorbed toner ink has not been determined. The amount of water
absorbed by the toner particles is not known. Additionally, as seen in Figure 4.5, toner
particle networks often have large voids in them. An ink density of 1.1 g/mL and an ink
in toner network concentration of 50 % was assumed for these measurements. Figure
4.10 is a plot of mass of adsorbed ink per particle size for both system chemistries. The
mass of ink increased as particle size increased.
Figure 4.10 presents a plot of the estimated mass of adsorbed ink on the bubble
surface for the four system chemistries. For each surfactant system, the mass of
attached ink particles increased as the particle size increased. For sodium oleate +
calcium chloride, the mass of ink per bubble increased from 5.7 mg to 12.5 mg. Without
calcium, the mass of ink per bubble increased from 2.95 mg to 6.15 mg. For sodium
lauryl sulfate + calcium chloride, the mass of ink per bubble increased from 4.4 mg to 7.7
mg; in the absence of calcium chloride, mass of ink increased from 3.1 to 6.1 mg. There
appears to be no significant difference between the two surfactants in the absence of
calcium chloride. For both sodium oleate and sodium lauryl sulfate, a significant

67
increase in adsorbed ink was observed in the presence of calcium chloride. Sodium
oleate with calcium chloride promotes the most toner ink adsorption of the systems
studied.
The effect of calcium on toner ink adsorption was also studied in clear water.
Figure 4.11 presents quantification results for the attachment of toner ink particles to
suspended bubble surfaces in clear water at a pH of 9.5 in the presence and absence of
100 mg/L calcium chloride. No significant difference between the two systems was
observed. Very little adsorption was observed for each system for all particle size ranges.
It should be noted that the amount of adsorbed ink for the surfactant-free experiments is
close to the minimum that can be discerned by the visualization methods used.

68
12.5
7.7
8.6
7.4
5.7
6.1
4.23.1
2.7
6.15
3.352.95
4.94.4 4.5
6.4
0
2
4
6
8
10
12
14
16
< 75 75 to 150 150 to 250 250 to 475
Particle Size (μm)
Mas
s of
ink
/ bub
ble
(mg)
Calcium Oleate
Sodium Lauryl Sulfate
Sodium Oleate
Sodium Lauryl Sulfate + Calcium
Figure 4.10: Estimated mass of ink adsorbed per bubble for four system chemistries and four particle size ranges.

69
Figure 4.11: Mass of toner ink adsorbed per bubble for clear water at pH = 9.5 in the presence and absence of calcium chloride.
0.65
0.440.375
0.76
0.755
0.6250.405
0.6
0
0.2
0.4
0.6
0.8
1
1.2
< 75 75 to 150 150 to 250 250 to 475
Particle Size (μm)
Mas
s of
ink
/ bub
ble
(mg)
Clear Water
Water + Calcium

70
4.2 Adsorption and Collision of Model Glass Particles
Flotation modeling generally assumes that adsorbing particles are spherical. In
order to better compare experiments to models, spherical glass beads of varying size
ranges were used for visualization studies. The physical properties and surface properties
for glass beads are well established and easy to obtain. They are therefore very suitable
for fundamental studies of the mechanisms of flotation.
High speed imaging was used to study the behavior of untreated fine glass spheres
at bubble surfaces. Particle size ranges of 425 to 500 microns, 225 to 300 microns, and
less than 106 microns were used to resemble the toner particle size studies. The silicate
beads were untreated and found have a contact angle of 105° by the sessile drop method.
A listing of the glass bead movies are presented in Appendix A.
Figure 4.12 shows a sequence of images from a video of an injection of fine (less
than 106 microns) glass beads onto a bubble surface in the calcium oleate system
chemistry. The surfactant concentration is 100 mg / L. The stream of particles (beads)
strike the bubble surface and some particles adsorb to it. A small amount of adsorbed
particles remain on the bottom of the bubble surface in what appears to be a monolayer
after the injection. The bead layer does not fall off. In Figure 4.13, a bubble in calcium
oleate solution is shown with a layer of adsorbed particles (106 microns).
Larger size glass particles do not appear to adsorb to the bubble surface for either
calcium oleate or lauryl sulfate chemistry. Figure 4.14 shows images from a movie of an
injection of 225 to 300 micron particles onto a bubble in water at a pH of 9.5. Particles
strike the bubble, slide around the bubble surface, and fall to the bottom of the vessel.
They do not attach to the bubble surface.

71
No adsorption was observed for the 425-500 sized particles (Figure 4.15). These
particles appeared to bounce off of the surface of the bubble and fall out of the frame. In
order to better track the behavior of the particles, the recording speed was changed from
250 to 1000 fps. Figure 4.16 shows a sequence of frames from a 1000 fps video of an
injection of the large glass particles. And example particle is highlighted as it strikes the
bubble, dimples the bubble surface, and bounces away from the bubble. The elapsed
time for this event is about 5 milliseconds.
High speed images of the top of a bubble as the particles impact the bubble
surface were used to better characterize their behavior. For consistent analysis, the
different particle size ranges were injected onto the same bubble. The large particles
were injected first, and the video showed that the particles would not remain on the
bubble surface and interfere with the flow field. Figure 4.17 shows a sequence of frames
from a movie of an injection of < 106 μm glass beads. The particles travel in chaotic
streamlines which flow around the bubble surface. No particles were seen striking the
bubble, but some traveled close to the bubble surface. The images in Figure 4.18 are
from a movie of 225 to 300 μm glass particles. These particles demonstrated two
different behaviors: some bounced off of the bubble surface, while some struck the
bubble and rolled along it out of the frame. The frames in Figure 4.19 are from an
injection of the 425 to 500 μm particles. Particles near the bubble struck it and were
deflected away. Notable bubble deformation (dimpling) was observed. After the
collision the bubble surface quickly reforms.
A particle must remain on the bubble surface until it reaches the bottom of the
bubble for stable attachment to occur. The particles in Figures 4.17 and 4.18 which roll

72
along the bubble surface should therefore continue to do so when the image focus is on
the side of the bubble. Figure 4.20 shows a single small particle (~45 μm) strike the
bubble surface and roll along the bubble surface to the bottom of the bubble. This
particle would probably remain attached to the bottom of the bubble were it visible. The
side view in Figure 4.21 is from an injection of 225 to 300 μm particles. The beads strike
the top of the bubble and some of them roll along the surface. When the particles reach
the downstream side of the bubble, they leave the bubble surface. Figure 4.22 presents
images from a movie of an injection of 425 to 500 μm particles onto a bubble surface.
All of the particles bounce off of the bubble; none are seen sliding or rolling along the
surface of the bubble.
If a particle slides or rolls along the bubble surface, then attachment by sliding
may occur. The thin film between the particle and the bubble will drain as the particle
moves along the bubble surface. If this film drains sufficiently, the particle will adsorb to
the bubble surface. If a particle directly impacts the surface, and additional force is
introduced. The bubble will reform the impacted surface, which will result in a repulsive
force being placed on the particle. If a particle has sufficient attractive forces to
overcome this repulsion, the particle will adsorb to the surface. However, particles that
do not adsorb at the instant of impact collision (such as those in Figures 4.15 and 4.22)
will be bounced away from the bubble to such a distance that adhesion by sliding cannot
occur.
Figure 4.23 presents frames from an injection of 212-300 μm glass beads in the
particle – bubble collision apparatus. The indicated particle approaches the rising
bubble, but does not strike it. It appears to follow the streamline around the bubble until

73
it passes out of range. Figure 4.24 presents frames from an injection of a large number of
212-300 mm glass beads into the particle – bubble collision apparatus. Many particles
are seen to approach the bubble; some of the particles strike the bubble surface. Data
from this sequence and similar sequences is used to estimate the probability of particle to
bubble collision.

74
Figure 4.12: Images from an injection of fine (<106 micron) glass beads onto a bubble surface. In b.) a large amount of glass particles are adsorbed to the bottom of the bubble.
a.)
b.)
1.0 mm

75
Figure 4.13: Image taken after an injection of fine glass particles onto a bubble surface in calcium oleate chemistry. The particles remain adsorbed on the bottom of the bubble.
1.0 mm
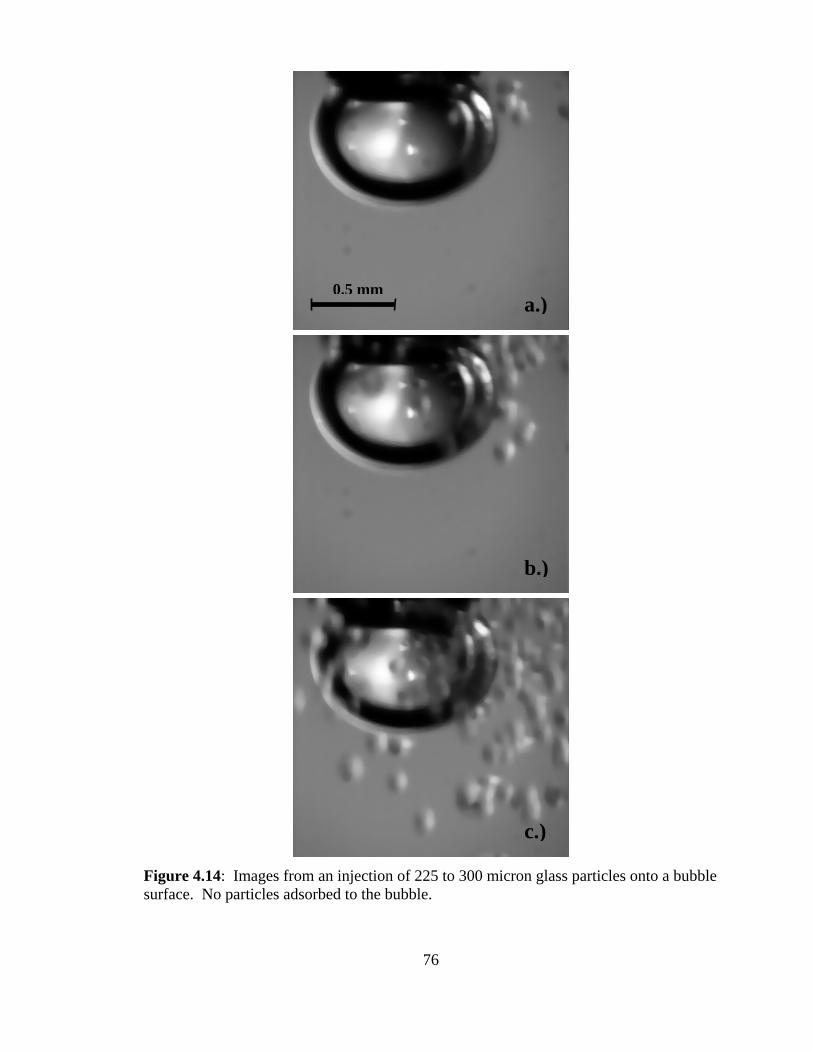
76
Figure 4.14: Images from an injection of 225 to 300 micron glass particles onto a bubble surface. No particles adsorbed to the bubble.
a.)
c.)
b.)
0.5 mm

77
Figure 4.15: Images from an injection of 425 to 500 micron particles. The particles strike the bubble surface and bounce off.
a.)
c.)
b.)
1.0 mm
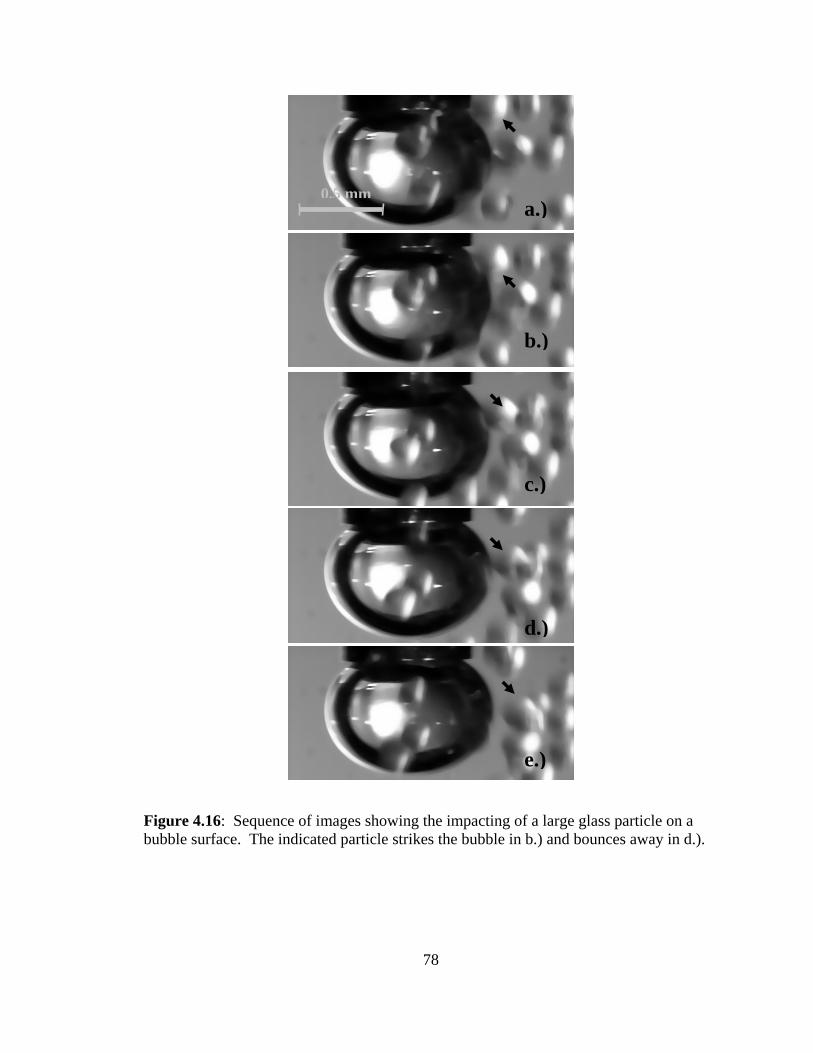
78
Figure 4.16: Sequence of images showing the impacting of a large glass particle on a bubble surface. The indicated particle strikes the bubble in b.) and bounces away in d.).
b.)
c.)
d.)
a.)
e.)
0.5 mm

79
Figure 4.17: Sequence of images showing the injection of fine (<106 micron) particles onto a bubble surface. The particles follow the flow field around the bubble, but do not appear to strike the bubble surface.
a.) b.)
c.) d.)
0.5 mm

80
Figure 4.18: Sequence of images from an injection of 225 to 300 micron particles onto the bubble surface. The indicated particle strikes the bubble and then rolls along the surface.
a.) b.)
c.) d.)
0.5 mm

81
Figure 4.19: Sequence of images from an injection of large glass particles onto a bubble surface. The indicated particle strikes the bubble in c.) and bounces away in d.), finally falling out of the frame in f.).
a.) b.)
d.) c.)
e.) f.)
0.5 mm

82
Figure 4.20: Sequence of images from the adsorption of a very small glass particle to the bubble surface. The indicated particle strikes the bubble in b.) slides along the surface and remains attached until it falls out of frame.
a.) b.) c.) d.)
0.5 mm

83
Figure 4.21: Sequence of images from the collision of a 90 μm particle at the bubble surface. The particle begins in contact with the bubble and slides along the surface. When it reaches the downstream side of the bubble, the inertia of the particle carries it off of the surface.
d.)
a.) b.)
c.)
e.) f.)
0.5 mm

84
Figure 4.22: Sequence of images from an injection of large glass beads. The indicated particle strikes the bubble surface in c.), and bounces off of the bubble in d.). The deformation of the bubble surface is visible in d.) and e.).
a.) c.)
d.) e.) f.)
b.)
0.5 mm

85
Figure 4.23: Sequence of images from the collision of a 1.2 mm bubble with 212-300 μm glass particles. The indicated particle appears to follow a streamline around the rising bubble.

86
CHAPTER 5
DISCUSSION OF VISUALIZATIONS
5.1 The Effect of System Chemistry and Particle Size in Flotation
Calcium based fatty acid chemistry has been widely used in industrial flotation for
many years. Flotation based upon fatty acid surfactants has long been know to perform
better in the presence of calcium than without it, although it is unknown why (Beneventi
and Carre, 2000). It is thought that calcium ions allow ink particles to form agglomerates
which increase the mass of ink that may be carried by each bubble, although the
mechanism of this phenomenon is not certain (Pugh and Rutland, 1997). Also, it has
been postulated that the calcium ions allow ink to more readily adhere to the bubble
surface (Drenlich et al. 2001).
The toner particle networks seen in figure 4.3 appear to support the theory that
calcium ions lead to particle agglomeration at the bubble surface. The results presented in
figures 4.10 and 4.11 appear to support each of these theories, and to elucidate the
mechanism of ink particle agglomeration. Figure 4.10 demonstrates that, for all particle
sizes, and each surfactant, a larger mass of toner adsorbs to a bubble surface in the
presence of calcium ions. In clear water, however, no change in attached ink mass and
no toner ink agglomeration are observed. This suggests that the mechanism of ink
particle agglomeration illustrated by Rutland and Pugh in Figure 2.2a does not occur for
toner ink particles.

87
The results from figures 4.10 and 4.11 also give some insight into the effect of
particle size on the flotation of toner ink. While the fraction of bubble covered by ink did
not change significantly for the different particle sizes, the volume and mass of ink
adsorbed increased as particle size increased. The difference can be explained by the fact
that the larger particles have more mass, but may still only adsorb to the same bubble
area. It is unknown why the particle size does not affect bubble coverage. The amount
of ink particles per bubble in the system was much higher than in industrial conditions
(we are essentially assuring that some particle collisions occur). The results suggest that
ink particle size controls the likelihood of collision, but does not greatly affect the degree
of particle attachment once collision occurs.
5.2 Study of the Mechanisms of Particle to Bubble Collision
The fact that the smallest glass particles adsorb to the bubble and the larger sizes
do not is at first perplexing, as the surface properties of the beads are the same. However,
Schulze (1992) postulates that two mechanisms of adsorption exist, with each being
applicable to different sized particles of identical material. He states that the Stokes
number for the particle / bubble system is a parameter that can be evaluated to determine
which mechanism is appropriate. The Stokes number (St) is defined, generally, as the
ratio of the inertial forces of the particle to the viscous drag force on the particle due to
the flow of the fluid film around the bubble:
2
22
9Re
9 BW
PPB
B
PPP
dd
dvd
ρρ
μρ
== 4-7 St

88
where ReB is the Reynold’s number of the bubble based upon the rise velocity of the
bubble, dP is the diameter of the particle, ρW is the density of water and dB is the diameter
of the bubble. For identical bubble, water and particle properties, the Stokes number
depends only upon particle size. For a very small Stokes number (less than 0.1, such as
for fine or light particles) the viscous drag on the particle dominates the particle motion.
These particles will follow the fluid stream lines around the bubble surface and will never
strike it. The mechanism of attachment for these particles is film thinning and drainage,
as described in section 2.5.2.1. However, if the Stokes number is greater than 1, the
inertia of the particle dominates its motion; the collision mechanism in this regime is
called impact collision. A particle approaching the bubble surface will not follow the
streamline around the bubble, but instead will strike and deform the bubble surface. The
bubble will reform and force the particle away, causing it to “bounce.” If the particle
forms a stable three-phase contact point before being forced away, adsorption occurs.
Otherwise, the particle is forced away from the bubble. If the Stokes number lies
between 0.1 and 1, then both mechanisms have varying degrees of importance.
By assuming that the particles are at their terminal settling velocity (experimentally
confirmed for the larger particle sizes), the Stokes number for each particle size can be
found. The Stokes equation for the settling velocity of a sphere is
μρρ
18)( 2
PWPP
dgv
−=
4-8
In this equation the settling velocity of the particle, vP is calculated from ρP and ρW, the
densities of the particle and water, g, the gravitational constant, dP, the diameter of the
particle and μ, the viscosity of water. A glass specific gravity of 2.5 and an assumed

89
bubble size of 1.0 mm was used to calculate the Stokes number for several particle size
ranges. The results of these calculations are presented in Table 5-1:
Glass Particle Size Stokes Number < 106 μm < 0.05
225 – 300 μm 0.095 – .29 425 – 500 μm 12 – 23
Table 5-1: Stokes Number for Various Particle Size Ranges for Glass Beads
The smallest particle size range, less than 106 microns, gives a Stokes number of less
than 0.05, which is well within the attachment by sliding range. The next size range is
within the intermediate realm, but is more closely located by the sliding regime. The
largest size range is entirely within the impact collision regime.
For smooth spheres, the probability of attachment by impact collision is much
lower than that for attachment by sliding, even for particles that are highly hydrophobic.
Schulze reports that the probability of adhesion by collision for very hydrophobic
particles decreases as the particle size increases. For slightly hydrophillic particles, such
as beads used in this study, the probability of attachment by impact collision is negligible.
The results presented in 4.2.1 confirm Schulze’s analytical predictions that
spherical particles with relatively large Stokes number values bounce off of the surface of
a bubble and are thus less likely to adsorb. The path of the particles that are smaller than
106 μm is governed by the streamlines of the flow. They roll or slide along the bubble
and are the particles which are seen to adhere to the bubble surface. The largest particles,

90
425 to 500 μm, bounce off of the surface and do not adsorb. The medium (225 to 300
μm) particles exhibit both flow behaviors, but do not attach to the bubble due to inertia.
5.3 Study of Toner Particle Impact and Collision
The analysis presented for glass beads was applied to toner inks as well. The
major differences between toner particles and glass particles are toner is much less dense
and toner is far more hydrophobic. However, the Stokes number criterion does not
include any term that would depend upon the hydrophobicity of the toner particle surface.
Indeed, such a term is unnecessary, as the criterion is used to predict how the particle
behaves as it approaches and strikes the bubble surface and not the degree of affinity the
particle has for the surface. Another important difference is the fact that while the model
glass particles are spherical, the toner particles are not.
Similar calculations were performed for the toner ink particle size ranges studied
in section 4.1. The terminal settling velocity was calculated assuming spherical particles
and an ink specific weight of 1.5. The results of these calculations are presented in Table
5-2:
Toner Ink Particle Size Stokes Number < 75 μm < 0.0003
75 – 150 μm 0.0003 – 0.0055 150 – 250 μm 0.0055 – 0.042 250 – 475 μm 0.042 – 0.55
Table 5-2: Stokes Number for various particle sizes of toner ink.
As seen in Table 5-2, the Stokes number values for toner are much smaller than those for
glass beads. Only the largest toner particle size gives a Stokes number that lies outside

91
the attachment by sliding regime. The 250 to 475 μm particle size range lies partly
within the transition regime. It should be noted however, that the film drag on an
amorphous particle is larger than that on a sphere of the same size (Happel and Brenner,
1983), so the terminal velocities used in the above calculations are the maximum possible
for the indicated particles. The actual settling velocity is probably much lower. Also, the
density of toner ink in water is unknown (assumed here to be the dry value of 1.5 g/mL),
but is thought to be very close to that of water. As the density of ink approaches that of
water, the Stokes number approaches zero. The Stokes number values in Table 5-2 are
therefore a maximum possible value for the toner particles; the actual values are probably
lower.
From the data presented in Table 5.2, predictions on the behavior of toner ink as it
collides with the bubble surface can be made. For ink particles ranging up to 300
microns in size, the particles should follow the streamlines. The particles will not
actually collide with the bubble surface, but will instead slide around the bubble. For
particles larger than 300 microns, viscous streamline flow will still dominate, but some
impacting of the surface of the bubble may be observed. Imaging of the bubble surface
during the injection of different particle sizes supports these predictions. Figure 5.1
presents frames from the imaging of 125 to 250 μm toner particles onto the top of a
stationary bubble. The particles follow the fluid flow and do not impact the bubble
surface. The particle shown in Figure 5.1 does not collide with the bubble, but instead
flows around it; a thin film between the indicated particle and the bubble can be seen in
Figures 5.2.b and 5.2c. However, the large particle in Figure 5.2 does appear to impact
the surface of the bubble. The particle approaches the bubble, strikes the surface, and

92
bounces. It then slides along the surface of the bubble until it falls out of frame. There is
no evidence of the particle being rejected as the bubble reforms, so this particle may be in
the similar intermediate range as the glass beads in Figure 4.18, or it may form a stable
impact adhesion before being ejected. This particle also appears to be adsorbed to
another toner particle. The added inertia or drag of the attached particle may prevent the
impacting particle from bouncing off of the bubble surface.
Toner ink particles are seen to follow the same Stokes number criterion as glass
beads. The analysis of Schulz predicts that attachment by sliding is the predominant
mechanism of toner ink adhesion, and this prediction has been confirmed by high speed
imaging. It is predicted that larger toner particles (~ 600 microns for an ink particle
density of 1.1 g / mL) will have impact collisions with the bubble surface, and therefore
may not adsorb as readily as more moderately sized ink particles.
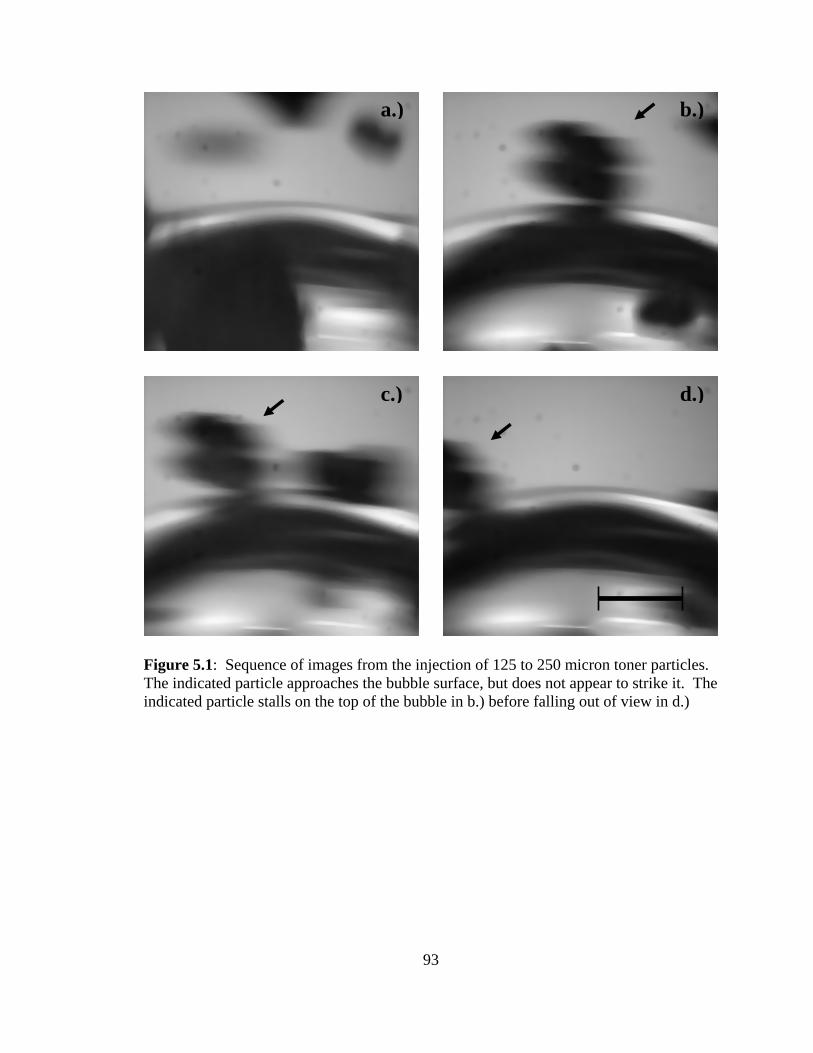
93
Figure 5.1: Sequence of images from the injection of 125 to 250 micron toner particles. The indicated particle approaches the bubble surface, but does not appear to strike it. The indicated particle stalls on the top of the bubble in b.) before falling out of view in d.)
a.) b.)
c.) d.)

94
Figure 5.2: Sequence of images from an injection of large (250 to 450 microns) toner particles. The indicated particle impacts the bubble surface in c.) and bounces, but is not repelled away from the bubble surface.
b.)
d.)c.)
a.)
0.5 mm

95
CHAPTER 6
EVALUATION OF FLOTATION MODELS
The probabilities associated with each important flotation subprocess were
presented in Section 2.5. These probabilities can be combined to obtain an estimate for
the overall probability of particle adsorption using Equation 1.
StabTPCAcOverall PPPPP = (1)
In this section we will use observations and measurements from the visualization
studies to estimate or evaluate the probabilities associated with each subprocess.
It should be noted that several of the assumptions made in the development of the
models presented in Section 2.3 do not apply to the experimental system or to the general
deinking flotation system. The assumption of one particle per bubble is not valid.
Flotation contaminant particles are not usually spherical and are not always much smaller
than the bubble size.
6.1 Flotation Modeling Calculations
Not all of the parameters pertaining to the author’s experimental system are known, but
probabilities for each of the subprocesses have been estimated based upon best available
data. The results of the model calculations are presented in Table 6.1.
Probability of Collision
The probability of particle collision was estimated from equation 6:

96
272.0
15Re4
23
⎟⎟⎠
⎞⎜⎜⎝
⎛⎟⎟⎠
⎞⎜⎜⎝
⎛+=
B
PBC R
RP (6)
Four particle size ranges, corresponding to the toner particles discussed in Section 4.1,
were used. The average diameter within a range was used in the model equations.
Assumed bubble and water properties are presented in Table 6-1.
. Bubble and Water Properties Bubble Diameter 1 mm
Bubble Rise Velocity 0.148 m/s Density of Water 992 kg/m3
Viscosity of Water 0.6560 cp Bubble Reynolds Number 224
Table 6.1: Properties used in PC calculations.
The probability of collision for the four particle size ranges are PC = 0.015 for a particle
size of 36 μm, PC = 0.133 for a particle size of 113 μm, PC = 0.42 for a particle size of
200 μm, and PC = 1.29 for a particle size of 350 μm. The calculated probabilities of
capture follow the expected relationship of increasing as particle size increases, or more
generally, increasing as the ratio of particle size to bubble size approaches unity.
However, the probability for the largest particle size is much greater than unity. This
could indicate a 100 percent chance of particle collision, or it indicates that this particle
size is far outside the range of this model’s applicability.

97
Probability of Attachment by Sliding
The probability of attachment by sliding was estimated by using equation 16:
( )
⎪⎪
⎭
⎪⎪
⎬
⎫
⎪⎪
⎩
⎪⎪
⎨
⎧
⎥⎥⎥⎥⎥
⎦
⎤
⎢⎢⎢⎢⎢
⎣
⎡
⎟⎟⎠
⎞⎜⎜⎝
⎛+
+−=
130
Re845exparctan2sin
72.02
P
BB
iBBASL
RRR
vP
τ (16)
This equation requires an estimate for the particle induction time, which is not available.
The closest analogue to ink particles for which data is available is coal. Wang et al.
(2004) present a model for the estimation of the induction time and also present some
experimental measurements of this value for several different substances, including
different grades of coal. The particle induction time is dependant upon the particle size.
Table 6.2 summarizes the parameters used.
Bubble Reynolds Number 223 Bubble Radius 0.5 mm
Bubble Rise Velocity 0.148 m/s Particle Induction Time
36 μm 113 μm 200 μm 350 μm
5 ms 10 ms 20 ms 35 ms
Table 6.2: Properties used in PASL calculations.
The probability of adhesion for the four particle size ranges are PASL = 5.7 × 10⁻¹ for a
particle size of 36 μm, PASL = 6.3 × 10⁻⁴ for a particle size of 113 μm, PASL = 1.2 × 10⁻¹²
for a particle size of 200 μm, and PASL = 3.1 × 10⁻³⁴ for a particle size of 350 μm. This
data gives the expected relation that probability of adhesion by sliding decreases as
particle size increases. However, the probabilities for the largest particle sizes are orders

98
of magnitude lower than those measured by Schulze (1989). The two lowest size ranges
match the results of Schulze within an order of magnitude. The error is probably in the
induction time estimates and in the application of the model; Schulze states that this
model only applies to small particles (<150 μm). Experimental results show that
particles in all of these size ranges adsorb quite readily.
Probability of Formation of Three-Phase Contact Point
The probability of the formation of the three-phase contact point is assumed to be unity
for all particle sizes. This assumption is made by Schulze (1989), Heindel (1997), and
other authors (Dai et al. 2000; Yoon, 1991). Conditions that give a non-zero PASL are
assumed to result in a PTPC equal to one. No issues with this assumption are known.
Probability of Attachment Stability
Heindel’s 1997 development presented in Section 2.3.4 was used to estimate the
probability of particle stability from the forces of attachment and detachment.
)2sin()2sin(6 θπθπσ +−=AttachF (30)
( ))2(sin223
9.14 2
31
32
2 θπρσερρ −⎟⎟
⎠
⎞⎜⎜⎝
⎛−+⎟
⎟
⎠
⎞
⎜⎜
⎝
⎛
++Δ= gR
RR
RRgRF lB
BP
BP
PPPDetach (31)
⎟⎟⎠
⎞⎜⎜⎝
⎛−−=
Detach
AttachStab F
FP 1exp1 (18)
The turbulent energy density was assumed to be 50,000 mm3/s2 (Schulze, 1989). The
three-phase contact angle is assumed to be 110 degrees; this value has been measured for
a flat surface using imaging techniques. The surface tension is assumed to be equal to 25

99
dyne/cm for sodium oleate solution (Shaw, 1992). The probability of adhesion stability
for the four particle size ranges are PStab = 0.78 for a particle size of 36 μm, PStab = 1.00
for a particle size of 113 μm, PStab = 1.00 for a particle size of 200 μm, and PStab = 1.00
for a particle size of 350 μm.
These values are reasonable and match those presented by Schulz for hydrophobic
particles. The stability is expected to decrease as particle size increases, but to remain
significantly close to unity. The values for the collision and adhesion probabilities point
out the need for better models and evaluation methods for the model parameters.
By combining these probabilities, the total probability of flotation is calculated
from equation 1. The probabilities for the three sub-processes, overall probability of
flotation, and representative images of toner particles adsorbed to bubble surfaces are
presented in Table 6.3. The smallest particle size range has a POverall with an order of
magnitude of 10-2, while the largest range has an order of magnitude of 10-34. The overall
flotation probability value is dominated by the probability of adhesion for all but the
smallest particle size range. In our experiments, many particles are observed to adhere to
a bubble for all particle sizes. Observed estimates for the probability of flotation, POverall,
are on the order of magnitude of 10-1.
The results of these models, when applied to the authors system of interest, do not
match qualitative experimental results. The particle sizes of our system may lie too far
outside the realm of the validity of these models. Experimental results suggest that some
of the assumptions inherent to these models do not apply to the author system. The
following section will present results from efforts to divorce the sub-processes from one
another and to directly measure them.

100
< 75 μm 75 – 150 μm 150 – 250 μm 250 – 450 μm
PC
0.015
0.13
0.42
1.00 (1.3)
PASL
5.7 ×10⁻¹
6.3 ×10⁻⁴
1.2 ×10⁻¹²
3.1 ×10⁻³⁴
PStab
0.78
1.0
1.0
1.0
POverall
6.7 ×10⁻²
8.4 ×10⁻⁵
5.0 ×10⁻¹³
3.1 ×10⁻³⁴
Table 6.3: Results of model calculations for toner ink for four particle size ranges and representative images.
101
6.2 Visual Estimation of Adhesion Subprocesses Data from toner injection movies in calcium oleate chemistry was used to directly
estimate the probability of the three particle to bubble adhesion subprocesses. These
visual estimations were then compared to the calculations from Section 6.1 to evaluate
the effectiveness of the models.
Sequences from toner injections in the particle to bubble collision apparatus were
used to estimate the probability of collision. Particle to bubble collision is an entirely
fluid flow related phenomena, so no surfactant was used in these experiments; the lack of
surfactant also effectively removed the probabilities of adhesion and stability from
consideration, allowing observation of the single phenomena of particle to bubble
collision. A manual count of particles that collided with the bubble and those that did not
was used to estimate the probability. The criteria for a colliding particle was determined
to be those particles that approached the bubble and either collided with or followed the
streamlines around the bubble. The probability of collision for toner particles of 150 –
250 mm in size was estimated to be 58%. As the diameter of the capillary tubing is
comparable to the bubble size, this method does not discount wall effects; the large
number of particles in the injection also creates the possibility of particle to particle
interactions which may effect the estimations.
Sequences from toner injections in the stationary bubble facility were used to
estimate the probability of particle adhesion. In most cases, a large number of toner
particles were injected onto the surface. In effect, these experiments force the particle to
bubble collision probability to 100%. A manual “eye-count” of particles that adhered and
those that did not was used to estimate the probability of adhesion. The criteria for an
102
attached particle was determined to be those particles that struck or slid along the bubble
surface and remained adsorbed at the bottom of the bubble, for any length of time.
Particles which adsorbed to other particles on the bubble surface were not considered.
The probability of attachment for toner particles of 150 – 250 μm in size was estimated to
be 35 %. When considering particles which attach to other particles, the probability of
adhesion rose to greater than 50%. Injections varied greatly in number of injected
particles, speed of injected flow, and angle of injection onto the bubble surface.
No particles were ever seen to detach from the surface of stationary or suspended
bubbles. When agitation was applied to adsorbed toner networks, no particles were seen
to detach from the bubble surface or from the network. The estimated value for the
probability of stability for toner particles of 150 – 250 mm in size is 100%.
Table 6.4 presents a comparison of the sub-process probabilities calculated in
Section 6.1 and the values estimated from direct imaging. The visually observed and
calculated probabilities of collision are relatively close in value. The probabilities of
adhesion differ greatly. The calculated and observed probabilities of stability are both
found to be 100%. The overall probabilities differ by twelve orders of magnitude. The
major contributor to the difference between the observed and calculated probabilities is
the probability of adhesion. Possible sources of error in the adhesion model are particle
shape and model parameter estimates.

103
PC
PASL
PStab
POverall
Visualizations
0.58
0.35
1.00
0.20
Modeling
Calculations
0.42
1.2 ×10⁻¹²
1.00
5.0 ×10⁻¹³
Table 6.4: Comparison of results of imaging estimations to model calculations for the probability of the subprocesses of particle to bubble adhesion. Results are for toner ink particles of 150 to 250 μm size in calcium oleate chemistry at a pH of 9.5.

104
CHAPTER 7
CLOSURE
Imaging techniques were used to study particle to bubble adhesion in toner
deinking flotation systems. Direct observation of particle behavior at bubble surfaces has
helped to elucidate the role of process conditions and parameters on deinking operation,
examine some of the fundamental interactions between particles and bubbles, and to
evaluate the current flotation models.
Imaging techniques have proven effective in quantification of the role of particle
size and surfactant in flotation. Flotation efficiency, in terms mass of ink per bubble, was
seen to increase as toner particle size increased. Bubble coverage was not seen to vary
significantly with particle size. Particle to bubble adhesion for toner inks and toner ink
complexes was observed to be very stable. Calcium ions were observed to promote more
particle adsorption, in terms of both bubble coverage and mass of ink per bubble, for both
sodium oleate and sodium lauryl sulfate surfactants. Calcium ions had no discernable
effect on the adsorption of toner inks to bubbles in surfactant-free systems; the first of the
particle agglomeration mechanisms proposed by Pugh and Rutland (1997) did not hold in
this system.
The collision of particles with a bubble surface was also studied. Impact
collisions were directly observed for particles with Stokes number greater than one, while
sliding collisions were observed for particles with a Stokes number less than one. This
105
phenomenon confirms the criteria proposed by Schulze for prediction of the mechanisms
of particle / bubble collisions.
Theoretical flotation models were used to calculate predictions for the probability
of flotation of toner inks. Estimates for the probability of each of the three flotation sub-
processes were found for four size ranges of toner particles. The estimates did not match
qualitative experimental observations. New methods for the direct visual measurement of
the three sub-processes were developed. Visual estimates for the probability of collision
and probability of stability matched the model predictions. However, the results of the
Yoon model for the probability of particle adhesion are many orders of magnitude
smaller than observed. Current flotation models do not account for non-spherical
particles, multiple particles adhering to a bubble, and particle agglomeration at the bubble
surface.
A better understanding of particle to bubble adhesion is important to flotation
separation operations, slurry reactor systems, environmental/biological systems, and
multi-phase flow in general. This work has helped to advance the state of experimental
measurements in particle to bubble interactions in deinking flotation. The work has
confirmed several previous theoretical predictions and has identified areas of weakness in
the theoretical development. A better understanding of how the theoretical work relates
to experimental results would greatly advance the understanding of this important
phenomena.

106
BIBLIOGRAPHY
Azevedo, M.A.D., Drelich, J., Miller, J.D. “The effect of pH on pulping and flotation of mixed office waste paper.” Journal of Pulp & Paper Science. 25(9): 317(1999). Beneventi, D., Carre, B. “The mechanisms of flotation deinking and the role of fillers.” Progress in Paper Recycling: 9 (2000) 77-85. Bliek, A., van der Zon, M., Thoolen, H., Hamersma, P.J., Poels, E.K. “Agglomeration and adhesion of catalyst particles in gas-liquid reactors.” Catalysis Today: 66 (2001) 263-270. Bloom, F., Heindel, T.J. “Mathematical modeling of the flotation deinking process.” Mathematical Computer Modeling: 25 (1997) 13-58. Bloom, F., Heindel, T.J. “A theoretical model for flotation deinking efficiency.” Journal of Colloid and Interface Science: 190 (1997) 182-197. Bonometti, T. “Visualization and study of ink adsorption at bubbles surface” Project Report: Auburn University, 2001. Dai, Z. Dukhin, S., Fornasiero, D., Ralston, J. “The inertial hydrodynamic interaction of particles and rising bubbles with mobile surfaces.” Journal of Colloid and Interface Science: 197 (1998) 275-292. Dai, Z., Fornasiero, D., Falston, J. “ Particle – bubble collision models – a review.” Advances in Colloid and Interface Science: 85 (2000) 231-256. Department of Environmental Services, New Hampshire. (1998) “Environmental Fact Sheet.” (WMD-SW-13) Davies, A.P.H., Rossi, L., and Duke, S.R. “A method for visualization and measurement of ink adsorption rates at bubble surfaces.” Fundamentals and Numerical Modeling of Unit Operations in the Forest Products Industry: AIChE Symposium Series, 2000. Brogdon, B. (ed.), 324(96) 28-35. Davies, A.P.H., and Duke, S.R. “Visualizations of offset and flexographic inks at bubble surfaces.” TAPPI Journal: 1 (2000) 41-47.

107
Drelich, J., Pletka, J., Boyd, P., Raber, E., Herron, D., Luhta, E., Walqui, N., Tervo, N., Boston, S., Wieland, J., Morgan, J., Sabo, N. “Interfacial aspects of de-inking flotation of mixed office paper.” SME Annual Meeting, Denver, CO: Feb. 26-28, 2001. Dukhin, S.S. “Role of inertial forces in flotation of small particles.” Kolloid. Zh.: 44 (1982) 431-441. Emerson, Z.I. “Visualization of contaminants at bubble surfaces.” Masters thesis: Auburn University, 2003. Emerson, Z.I. Bonometti, T., Krishnagopalan, G.A. and Duke, S.R. “Visualization of toner ink adsorption at bubble surfaces” TAPPI JOURNAL. 4(5): (2006). Ferguson, L. “Introduction to printing technology and ink chemistry.” TAPPI Deinking Short-course, 1995. Ferguson, L. “Deinking Chemistry: part 1.” TAPPI Journal: 77 (July, 1992) 75-83. Ferguson, L. “Deinking Chemistry: part 2.” TAPPI Journal: 77 (August, 1992) 49-58. Franklin Associates, Ltd. and the American Forest & Paper Association. “2005 Recovered Paper Annual Statistics.” Presented by Paper Industry Association Council. Available [Online]: www.stats.paperrecycles.org/ [20July2006] Gaudin, A.M. Flotation. McGraw-Hill: New York, 1957 Gochin, R.J. “Flotation.” in Solid-Liquid Seperation. Svarovsky, L. editor. Butterworths: London, (1990) 591-613. Gopalratnam, C. Bennett, G.F., Peters, R.W. “The simultaneous removal of oil and heavy metals from industrial wastewaters by joint precipitation and air flotation.” Environmental Progess: 7 (1988) 84-92. Gu, G., Xu, Z., Nandakumar, K., Masliyah, J. “Effects of physical environment on induction time of air-bitumen attachment.” International Journal of Mineral Processing: 69 (2003) 235-250. Gu, G., Xu, Z., Nandakumar, K., Masliyah, J. “A novel experimental technique to study single bubble-bitumen attachment in flotation.” International Journal of Mineral Processing: 74 (2004) 15-29. Ham, J. ”Enzyme enhanced deinking of toner inks.” Masters thesis: Auburn University, 2004. Heindel, T.J. “Fundamentals of flotation deinking.” TAPPI Journal: 82 (1997) 115-124.

108
Hines, P.R. U.S. Patent #2,005,742 Kim, J.W. Lee, H.L. Youn, H.J., and Kim, J.M. “Evaluation of dynamic attachment phenomena of micro stickies to air bubbles.” Appita, 2004. Larsson, Anders “Surface Chemistry in Flotation Deinking.” Paper Technology and Industry. 28(1): 388(1987). Leja, J. Surface Chemistry of Froth Flotation. Plenum Press: New York, 1982. Liepe, F., Mockel, O.H. Chemical Technology: 30 (1976) 205-211. McCool, Michael. “Chapter 15: Flotation Deinking.” Secondary Fiber Recycling. Spandenburg, R. editor. TAPPI Press: Atlanta, 1993. Nguyen, A V. “The collision between fine particles and single air bubbles in flotation.” Journal of Colloid and Interface Science: 162 (1994) 123-128. Nguyen, A.V. and Evans, G.M. “Attachment interaction between air bubbles and particles in froth flotation.” Experimental Thermal and Fluid Science: 28 (2004) 381-385. Nguyen, A.V. and Evans, G.M. “Movement of fine particles on an air bubble surface studied using high-speed microscopy.” Journal of Colloid and Interface Sciences: 273 (2004) 271-277. Peng, F.F. “Surface energy and induction time of fine coals treated with various levels of dispersed collector and their correlation to flotation responses” Energy & Fuels: 10 (1996) 1202-1207. Plate, H. PhD Thesis, ADW, UVR, Freiberg/Sa. Chemnitzer Str. 40. Poyry, J. “Recycled Fiber – An Underutilized Opportunity, Report No. 3” 1990. Pugh, R.J., Rutland, M. “Calcium Soaps in flotation deinking; fundamental studies using surface force and coagulation techniques” Colloids & Surfaces : Physicochemical and Engineering Aspects: 125: (1997). Reay, D. Ratcliff, G.A. “Removal of fine particles from water by dispersed air flotation – effects of bubble size and particle size on collection efficiency.” Canadian Journal of Chemical Engineering: 51 (1987) 179-185. Roizard, C. Poncin, S., Lapicque, F., Py, X., Midoux, N. ”Behavior of fine particles in the vicinity of a gas bubble in a stagnant and a moving fluid.” Chemical Engineering Science: 54 (1999) 2317-2323.

109
Rubio, J., Souza, M.L., Smith, R.W. “Overview of flotation as a wastewater treatment technique.” Minerals Engineering: 15 (2002) 139-155. Rubio, J. and Costa, C.A. “Deinking flotation: influence of calcium soap and surface-active substances.” Minerals Engineering: 18 (2005). Schulze, H.J. “Flotation as a hetero-coagulation process: possibilities of calculating the probability of flotation.” In Physico-Chemical Processes in Flotation, Chapter 7. Elsevier, Berlin, 1984. Schulze, H.J. in Frothing in Flotation. Laskowski, J. editor. Gordon and Breach Publishers: New York, 1989. 43-76. Shaw, D.J. Introduction to Colloid and Surface Chemistry. Butterworth & Heinemann: Boston, 1992. Smook, G.A. Handbook for Pulp and Paper Technologists, 2nd Edition. Angus Wilde Publications: Vancouver, 1992. Spinka, E. “AF&PA announces 2003 paper recovery rate.” WasteAge: web article (June 28, 2004) Sutherland, K.L. “Physical Chemistry of Flotation XI: Kinetics of the flotation process.” Journal of Physical Chemistry: 52 (1948) 394-425. Theander, K., and Pugh, R.J. “Surface chemical concepts of flotation de-inking.” Colloids and Surfaces A: Physiochemical Engineering Aspects. 240(1): 111(2004). Thompson, E. “Review of flotation research by the Cooperative Recycled Fiber Studies Program, Department of Chemical Engineering, University of Maine.” Paper Recycling Challenge: Volume II Doshi, M.R. and Dyer, J.M. eds. Doshi & Associates: 1997. Thompson, E.V., Paulsen, F.G., Berg, S.R., Vidotti, R.M., Johnson, D.A. “Measurement of long-range hydrophobic attraction forces and their relationship to deinking flotation: Part II.” Proceedings: TAPPI Recycling Symposium. TAPPI Press, 1997. USDA Forest Services: Resource Planning Act (2000) An analysis of the timber situation in the United States: 1952-2050 – A technical document supporting the 2000 USDA Forest Service RPA assessment. (PNW-GTR-560). Haynes, R.W. Tech. Dir. Vinke, H. Hammersma, P.J., Fortuin, J.M.H. “Particle to bubble adhesion to in gas/liquid/solid slurries.” AIChE Journal: 37 (1991) 1801- 1809. Vinke, H. Hammersma, P.J., Fortuin, J.M.H. “Enhancement of gas-absorption rate in agitated slurry reactors by gas-absorbing particles adhering to gas bubbles.” Chemical Engineering Science: 48 (1993) 2197 – 2210.

110
Wang, W., Zhou, Z., Masliyah, J.H., et al. ‘An induction time model for the attachment of an air bubble to a hydrophobic sphere in aqueous solution.” International Journal of Mineral Processing, 2003. Weber, M.E. Paddock, D. “Interceptional and gravitational collision efficiencies for single collectors at Intermediate Reynolds numbers.” Journal of Colloid Science: 94 (1983) 328-335. Wimmers, O.J. and Fortuin, J.M.H. “The use of adhesion of catalyst particles to gas bubbles to achieve enhancement of gas adsorption in slurry reactors – II. Determination of the enhancement in a bubble containing slurry reactor.” Chemical Engineering Science: 43 (1988) 303-312. Woodburn, E.T. “Mathematical modeling of the flotation process.” Minerals Science and Engineering: 2 (1998) 3-17. Yianatos, J.B., Henriquez, F.H., and Oroz, A.G. “Characterization of large flotation cells.” Minerals Engineering: 19 (2005) 531-538. Yoon, R.-H. “Hydrodynamic and surface forces in bubble-particle interaction.” Aufbereitungs Technik : 32 (1991) 474. Yoon, R.-H., Luttrell, G.H., Adel, G.T., et al. ”Recent advances in fine coal flotation.” In Advances in Coal and Mineral Processing Using Flotation, 1999 Chander, S. (ed.) Society of Mining Engineers, Littleton, CO, 211-218. Yoon, R.-H. “The role of hydrodynamic and surface forces in bubble-particle interaction.” Journal of Mineral Processing: 58 (2000) 129-143. Zabel, T. “Flotation in water treatment.” In: Innovations in Flotation Technology. Mavros, P., Matis, K.A. editors. Kluwer Academic Publishers, Dordrecht: 1992. Zheng, Y.Y. and Zhao, C.C. “A study of the kinetics on induced-air flotation for oil-water separation.” Seperation Science and Technology: 28 (1993) 1233-1240. Zouboulis, A.I., Kydros, K.A., Matis, K.A. “Flotation techniques in water treatment.” In: Innovations in Flotation Technology. Mavros, P., Matis, K.A. editors. Kluwer Academic Publishers, Dordrecht: 1992.

111
APPENDIX A
SUMMARY OF PRESENTED MOVIE DATA
Frames from the following movies were presented in this document. These movies are Windows Media AVI files and they are available from the author. Frames from these movies are available in BMP or JPG format.
FIGURE TITLE FILE NAME Figure 4-1 stat_hp_75_sulf_2fast
Figure 4-2 a.) stat_hp_75_sulf_5fast b.) stat_hp_75_150_sulf_fast c.) stat_hp_150_250_sulf_7fast d.) stat_hp_250_475_sulf_3fast
Figure 4-3 a.) hp_75_stat_oleate_ph95_1fast b.) hp_75_150_stat_oleate_ph95_1fast c.) hp_150_250_stat_oleate_ph95_3fast d.) hp_250_475_stat_oleate_ph95_1_fast
Figure 4-4 High-Mag-Toner1 Figure 4-5 High-Mag-Toner3
Figure 4-6 a.) susp_hp_75_sulf_5fast b.) susp_hp_75_150_sulf_pH11_1 c.) susp_hp_150_250_sulf_7fast d.) susp_hp_250_475_sulf_3fast
Figure 4-7 a.) hp_75_susp_oleate_ph95_1fast b.) hp_75_150_susp_oleate_ph95_1fast c.) hp_150_250_susp_oleate_ph95_3fast d.) hp_250_475_susp_oleate_ph95_1_fast
Figure 4-11 Small Particles Adsorption 2 Figure 4-12 Small Particles Adsorption 3 Figure 4-13 Med Particles Adsorption Figure 4-14 Large Particles Adsorption 2 Figure 4-15 Large Particles Adsorption 1 Figure 4-16 Impact Same Bubble Small Particles 2 Figure 4-17 Impact Same Bubble Med Particles 2 Figure 4-18 Impact Same Bubble Big Particles 2 Figure 4-19 Small Part Side 500fps 1 Figure 4-20 Med Part Side 500fps 2 Figure 4-21 Big Part Side 500fps
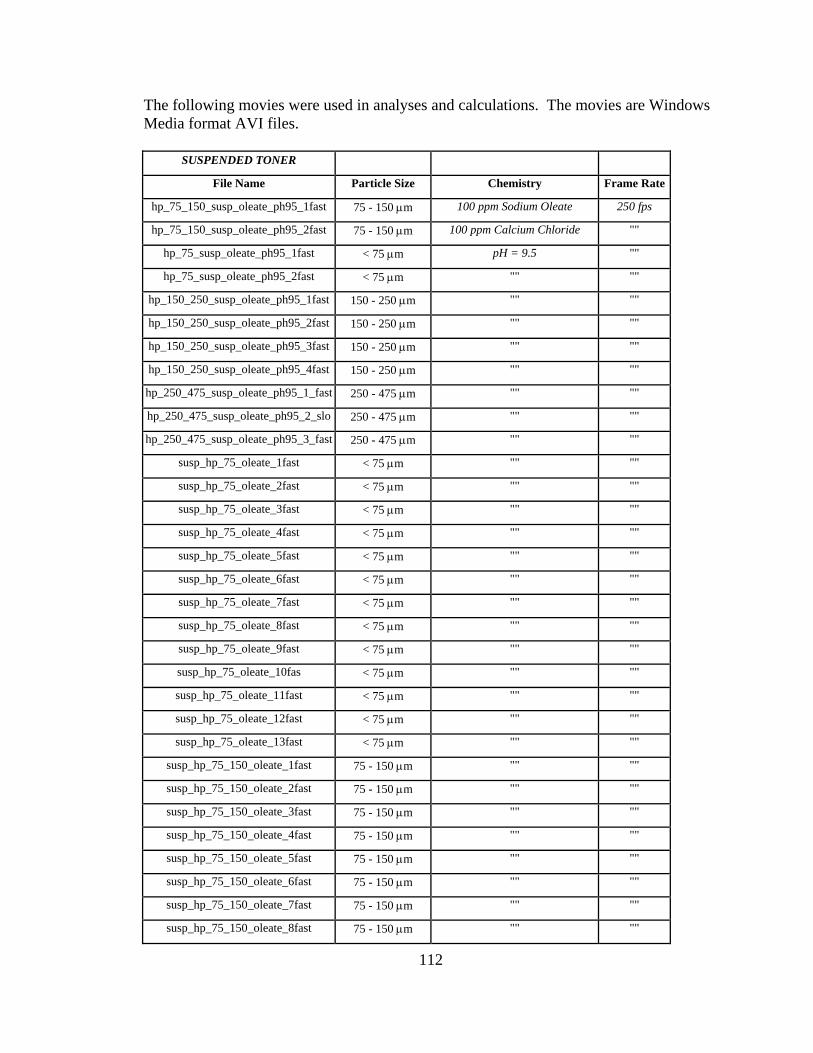
112
The following movies were used in analyses and calculations. The movies are Windows Media format AVI files.
SUSPENDED TONER
File Name Particle Size Chemistry Frame Rate
hp_75_150_susp_oleate_ph95_1fast 75 - 150 μm 100 ppm Sodium Oleate 250 fps
hp_75_150_susp_oleate_ph95_2fast 75 - 150 μm 100 ppm Calcium Chloride ""
hp_75_susp_oleate_ph95_1fast < 75 μm pH = 9.5 ""
hp_75_susp_oleate_ph95_2fast < 75 μm "" ""
hp_150_250_susp_oleate_ph95_1fast 150 - 250 μm "" ""
hp_150_250_susp_oleate_ph95_2fast 150 - 250 μm "" ""
hp_150_250_susp_oleate_ph95_3fast 150 - 250 μm "" ""
hp_150_250_susp_oleate_ph95_4fast 150 - 250 μm "" ""
hp_250_475_susp_oleate_ph95_1_fast 250 - 475 μm "" ""
hp_250_475_susp_oleate_ph95_2_slo 250 - 475 μm "" ""
hp_250_475_susp_oleate_ph95_3_fast 250 - 475 μm "" ""
susp_hp_75_oleate_1fast < 75 μm "" ""
susp_hp_75_oleate_2fast < 75 μm "" ""
susp_hp_75_oleate_3fast < 75 μm "" ""
susp_hp_75_oleate_4fast < 75 μm "" ""
susp_hp_75_oleate_5fast < 75 μm "" ""
susp_hp_75_oleate_6fast < 75 μm "" ""
susp_hp_75_oleate_7fast < 75 μm "" ""
susp_hp_75_oleate_8fast < 75 μm "" ""
susp_hp_75_oleate_9fast < 75 μm "" ""
susp_hp_75_oleate_10fas < 75 μm "" ""
susp_hp_75_oleate_11fast < 75 μm "" ""
susp_hp_75_oleate_12fast < 75 μm "" ""
susp_hp_75_oleate_13fast < 75 μm "" ""
susp_hp_75_150_oleate_1fast 75 - 150 μm "" ""
susp_hp_75_150_oleate_2fast 75 - 150 μm "" ""
susp_hp_75_150_oleate_3fast 75 - 150 μm "" ""
susp_hp_75_150_oleate_4fast 75 - 150 μm "" ""
susp_hp_75_150_oleate_5fast 75 - 150 μm "" ""
susp_hp_75_150_oleate_6fast 75 - 150 μm "" ""
susp_hp_75_150_oleate_7fast 75 - 150 μm "" ""
susp_hp_75_150_oleate_8fast 75 - 150 μm "" ""

113
susp_hp_75_150_oleate_9fast 75 - 150 μm "" ""
susp_hp_75_150_oleate_10fast 75 - 150 μm "" ""
susp_hp_75_150_oleate_11fast 75 - 150 μm "" ""
susp_hp_150_250_oleate_1fast 150 - 250 μm "" ""
susp_hp_150_250_oleate_2fast 150 - 250 μm "" ""
susp_hp_150_250_oleate_3fast 150 - 250 μm "" ""
susp_hp_150_250_oleate_4fast 150 - 250 μm "" ""
susp_hp_150_250_oleate_5fast 150 - 250 μm "" ""
susp_hp_150_250_oleate_6fast 150 - 250 μm "" ""
susp_hp_150_250_oleate_7fast 150 - 250 μm "" ""
susp_hp_150_250_oleate_8fast 150 - 250 μm "" ""
susp_hp_150_250_oleate_9fast 150 - 250 μm "" ""
susp_hp_150_250_oleate_10fast 150 - 250 μm "" ""
susp_hp_150_250_oleate_11fast 150 - 250 μm "" ""
susp_hp_250_475_oleate_1fast 250 - 475 μm "" ""
susp_hp_250_475_oleate_2fast 250 - 475 μm "" ""
susp_hp_250_475_oleate_3fast 250 - 475 μm "" ""
susp_hp_250_475_oleate_4fast 250 - 475 μm "" ""
susp_hp_250_475_oleate_5fast 250 - 475 μm "" ""
susp_hp_250_475_oleate_6fast 250 - 475 μm "" ""
susp_hp_250_475_oleate_7fast 250 - 475 μm "" ""
susp_hp_250_475_oleate_8fast 250 - 475 μm "" ""
susp_hp_250_475_oleate_9fast 250 - 475 μm "" ""
susp_hp_250_475_oleate_10fast 250 - 475 μm "" ""
susp_hp_75_150_sulf_pH11_1 75 - 150 μm 100 ppm Sodium Silicate 250 fps
susp_hp_75_150_sulf_pH11_2 75 - 150 μm 100 ppm Sodium Lauryl Sulfate ""
susp_hp_75_ph11_sulf1_fast < 75 μm pH = 11 ""
susp_hp_75_pH11_sulf_2slow < 75 μm "" ""
susp_hp_75_sulf_pH11_3_fast < 75 μm "" ""
susp_hp_150_250_sulf_pH11_1 150 - 250 μm "" ""
susp_hp_150_250_sulf_pH11_2 150 - 250 μm "" ""
susp_hp_150_250_sulf_pH11_3 150 - 250 μm "" ""
susp_hp_250_475_sulf_pH11_1 250 - 475 μm "" ""
susp_hp_250_475_sulf_ph11_2 250 - 475 μm "" ""
susp_hp_75_sulf_1fast < 75 μm "" ""

114
susp_hp_75_sulf_2fast < 75 μm "" ""
susp_hp_75_sulf_3fast < 75 μm "" ""
susp_hp_75_sulf_4fast < 75 μm "" ""
susp_hp_75_sulf_5fast < 75 μm "" ""
susp_hp_75_sulf_6fast < 75 μm "" ""
susp_hp_75_sulf_7fast < 75 μm "" ""
susp_hp_75_sulf_8fast < 75 μm "" ""
susp_hp_75_150_sulf_1fast 75 - 150 μm "" ""
susp_hp_75_150_sulf_2fast 75 - 150 μm "" ""
susp_hp_75_150_sulf_3fast 75 - 150 μm "" ""
susp_hp_75_150_sulf_4fast 75 - 150 μm "" ""
susp_hp_75_150_sulf_5fast 75 - 150 μm "" ""
susp_hp_75_150_sulf_6fast 75 - 150 μm "" ""
susp_hp_75_150_sulf_7fast 75 - 150 μm "" ""
susp_hp_75_150_sulf_8fast 75 - 150 μm "" ""
susp_hp_75_150_sulf_9fast 75 - 150 μm "" ""
susp_hp_75_150_sulf_10fast 75 - 150 μm "" ""
susp_hp_75_150_sulf_11fast 75 - 150 μm "" ""
susp_hp_75_150_sulf_12fast 75 - 150 μm "" ""
susp_hp_75_150_sulf_13fast 75 - 150 μm "" ""
susp_hp_150_250_sulf_1fast 150 - 250 μm "" ""
susp_hp_150_250_sulf_2fast 150 - 250 μm "" ""
susp_hp_150_250_sulf_3fast 150 - 250 μm "" ""
susp_hp_150_250_sulf_4fast 150 - 250 μm "" ""
susp_hp_150_250_sulf_5fast 150 - 250 μm "" ""
susp_hp_150_250_sulf_6fast 150 - 250 μm "" ""
susp_hp_150_250_sulf_7fast 150 - 250 μm "" ""
susp_hp_150_250_sulf_8fast 150 - 250 μm "" ""
susp_hp_150_250_sulf_9fast 150 - 250 μm "" ""
susp_hp_150_250_sulf_10fast 150 - 250 μm "" ""
susp_hp_250_475_sulf_1fast 250 - 475 μm "" ""
susp_hp_250_475_sulf_2fast 250 - 475 μm "" ""
susp_hp_250_475_sulf_3fast 250 - 475 μm "" ""
susp_hp_250_475_sulf_4fast 250 - 475 μm "" ""
susp_hp_250_475_sulf_5fast 250 - 475 μm "" ""
susp_hp_250_475_sulf_6fast 250 - 475 μm "" ""
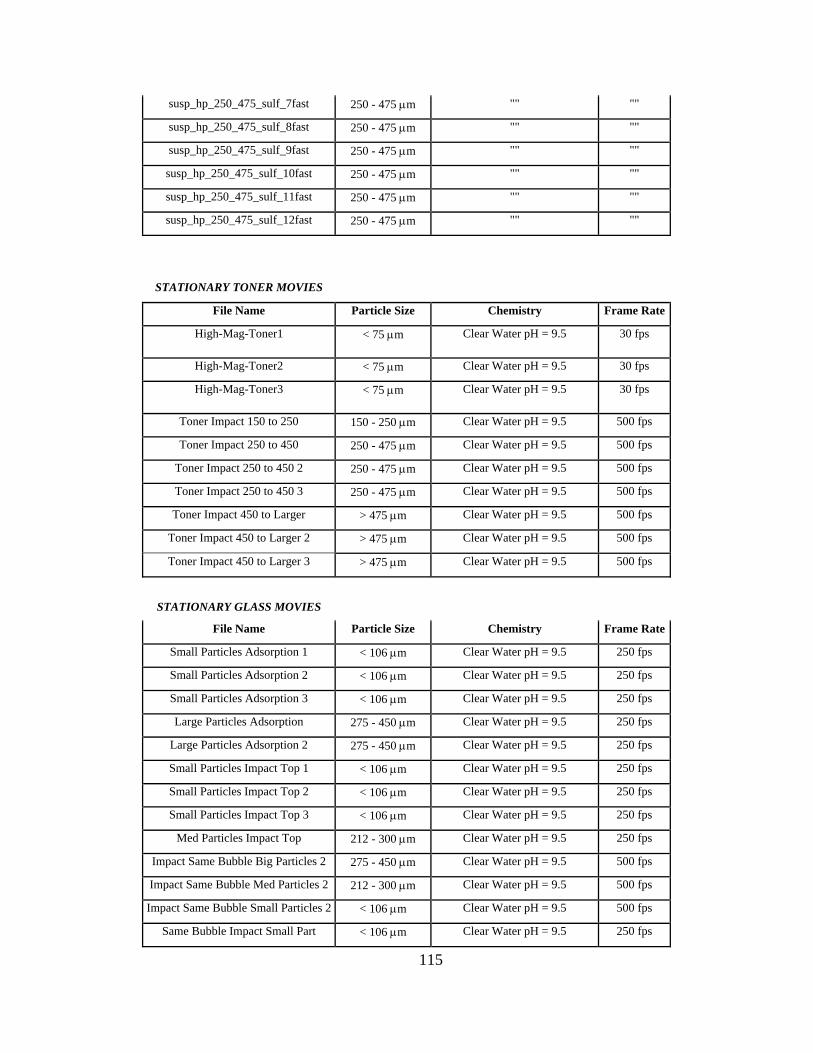
115
susp_hp_250_475_sulf_7fast 250 - 475 μm "" ""
susp_hp_250_475_sulf_8fast 250 - 475 μm "" ""
susp_hp_250_475_sulf_9fast 250 - 475 μm "" ""
susp_hp_250_475_sulf_10fast 250 - 475 μm "" ""
susp_hp_250_475_sulf_11fast 250 - 475 μm "" ""
susp_hp_250_475_sulf_12fast 250 - 475 μm "" ""
STATIONARY TONER MOVIES
File Name Particle Size Chemistry Frame Rate
High-Mag-Toner1 < 75 μm Clear Water pH = 9.5 30 fps
High-Mag-Toner2 < 75 μm Clear Water pH = 9.5 30 fps
High-Mag-Toner3 < 75 μm Clear Water pH = 9.5 30 fps
Toner Impact 150 to 250 150 - 250 μm Clear Water pH = 9.5 500 fps
Toner Impact 250 to 450 250 - 475 μm Clear Water pH = 9.5 500 fps
Toner Impact 250 to 450 2 250 - 475 μm Clear Water pH = 9.5 500 fps
Toner Impact 250 to 450 3 250 - 475 μm Clear Water pH = 9.5 500 fps
Toner Impact 450 to Larger > 475 μm Clear Water pH = 9.5 500 fps
Toner Impact 450 to Larger 2 > 475 μm Clear Water pH = 9.5 500 fps
Toner Impact 450 to Larger 3 > 475 μm Clear Water pH = 9.5 500 fps
STATIONARY GLASS MOVIES
File Name Particle Size Chemistry Frame Rate
Small Particles Adsorption 1 < 106 μm Clear Water pH = 9.5 250 fps
Small Particles Adsorption 2 < 106 μm Clear Water pH = 9.5 250 fps
Small Particles Adsorption 3 < 106 μm Clear Water pH = 9.5 250 fps
Large Particles Adsorption 275 - 450 μm Clear Water pH = 9.5 250 fps
Large Particles Adsorption 2 275 - 450 μm Clear Water pH = 9.5 250 fps
Small Particles Impact Top 1 < 106 μm Clear Water pH = 9.5 250 fps
Small Particles Impact Top 2 < 106 μm Clear Water pH = 9.5 250 fps
Small Particles Impact Top 3 < 106 μm Clear Water pH = 9.5 250 fps
Med Particles Impact Top 212 - 300 μm Clear Water pH = 9.5 250 fps
Impact Same Bubble Big Particles 2 275 - 450 μm Clear Water pH = 9.5 500 fps
Impact Same Bubble Med Particles 2 212 - 300 μm Clear Water pH = 9.5 500 fps
Impact Same Bubble Small Particles 2 < 106 μm Clear Water pH = 9.5 500 fps
Same Bubble Impact Small Part < 106 μm Clear Water pH = 9.5 250 fps

116
Same Bubble Impact Med Part 212 - 300 μm Clear Water pH = 9.5 250 fps
Same Bubble Impact Large Part 275 - 450 μm Clear Water pH = 9.5 250 fps
Med Particles Side 212 - 300 μm Clear Water pH = 9.5 250 fps
Small Single Particle Slides < 106 μm Clear Water pH = 9.5 250 fps
Small Particles Side < 106 μm Clear Water pH = 9.5 250 fps
Small Part Side 500fps 1 < 106 μm Clear Water pH = 9.5 250 fps
Small Part Side 500fps 2 < 106 μm Clear Water pH = 9.5 250 fps
Big Part Side 500fps 275 - 450 μm Clear Water pH = 9.5 250 fps
Med Part Side 500fps 212 - 300 μm Clear Water pH = 9.5 250 fps

117
APPENDIX B
The particle-bubble adhesion model developed by Vinke et al (1991) was used to
examine the role of particle shape in the attachment of particles to bubble surfaces. This
model uses visual measurements for the maximum bubble coverage angle to estimate the
three-phase contact angle between an individual particle and a bubble in a liquid system.
The three-phase contact angle is illustrated in Figure B-1.
Figure B-1: Illustration of the Three- Phase Contact Angle (θ).
The stationary bubble facility was used for this study. A bubble was produced
from an inverted needle in the tank. Particles were carefully injected onto the bubble
until no additional particles would adhere to the surface. The angle of coverage of the
“cap” of adsorbed particles was obtained from visual measurements. This measurement
was used to estimate the effective three-phase contact angle.
Bottom of Bubble Surface
Liquid
Particle
θ
Bottom of Bubble Surface
Liquid
Particle
θ

118
Figure B-2 presents results from adhesion measurements for glass particles.
Figure B-2a shows the attachment of spherical glass particles less than 75 microns in
size, while Figure B-2b shows the attachment of amorphous ground glass particles of less
than 75 microns.
Figure B-2: Measurement images of the maximum coverage angle for glass particles. a.) Spherical glass particles <75 microns. b.) Amorphous glass particles <75 microns.
The maximum coverage angle increases from 40° to 80° when the particles are not
spherical. These measurements correspond to three-phase contact angles of 50° and 71°.
This verifies the theory that amorphous particles will adhere to the surfaces of bubbles
more readily than spherical particles.
a) b)a) b)