particle cloud- mixing in microgravity · particle cloud mixing in microgravity ... the striations...
TRANSCRIPT

-*, . i ,
NASA Technical Me,morandum 101484
.? P' AIAA-88-0453
%%
Particle Cloud- 3 Mixing in Microgravity , A , * ,
4
(AASa-TR- 161464) EABIIfCLk C L C E C L I X I I G I h U8S-2C3; 1 kIC%CGSAFIIY (bA2A) 14 & CSCL 22A
U n c l a s 63/29 019726;
1.. v..
H. Ross and L.F Lewis Research Cen Cleveland, Ohio
and
V. Tangirala and University of Cal La Jolla, Califom
' I Presented at the 2L+. ' 26th Aerospace Sc 'Meeting sponsored by the Ameriw Institute of Aeronautics and Astronautics Reno, Nevada, Janhry 11-14, 1988
+
https://ntrs.nasa.gov/search.jsp?R=19890010950 2018-06-02T14:16:26+00:00Z

Particle Cloud Mixing in Microgravity H. Ross and L. Facca
National Aeronautics and Space Administration Lewis Research Center Cleveland, Ohio 44135
and
V. Tangirala and A.L. Berlad Center for Energy and Combustion Research
University of California. San Dieno La Jolla,
Abstract Quasi-steady flame propagation through clouds of com- bustible particles requires quasi-steady transport prop- erties and quasi-steady particle number density. Micro- gravity conditions may be employed to help achieve the conditions of quiescent, uniform clouds needed for such combustion studies. Joint experimental and theoretical NASA-UCSD studies have been concerned with the use of acoustic, electrostatic, and other methods of disper- sion of fuel particulates. Results of these studies are presented for particle clouds in long cylindrical tubes.
1 Introduction Experimental study of the combustion properties of clouds of combustible particles (in an oxidizing gaseous medium) requires the initial establishment of a suit- ably uniform cloud. It has been argued that suitably quiescient and uniform particle clouds are most easily achieved under microgravity conditions where gravita- tional sedimentation processes can be supressed.'
Vigorous mixing (to achieve cloud uniformity) can be obtained through a variety of techniques, includ- ing mechanical, acoustic and electrostatic. This pa- per reports the experimental use of the latter two methods. Where acoustic mixing is employed, tri- boelectric particle-particle interaction effectsI2 tend to promote agglomerative growth of nonmonomeric clus- ters. Correspondingly, particle depletion of the gas- suspended cloud may be due to particle adhesion to container walls. The supression of both these unwanted, acoustically-induced particle-particle and particle-wall interactions may be achieved by limiting the acoustic mixing to a very short time. To achieve adequately uni- form particle clouds through use of very short periods of acoustic mixing is difficult. Acoustic power must be high, to help induce the substantial secondary air flows needed for mixing. High acoustic power also helps to establish the nonlinear interactions needed for the exci- tation of the various mixing modes: longitudinal, radial and tangential.
This paper reports on studies concerned with the use
- California
of high power, short period acoustic bursts to achieve good mixing as well as supressed agglomerative and particle-wall interactions. Various calibration methods for measuring the concentration of particles are dis- cussed in Appendix 1. Also reported are some prelinu- nary results for the use of electrostatic methods of par- ticle cloud dispersion (Appendix 2) as well as the cal- culated results for the deagglomerative effects of alpha- particle fields (Appendix 3).
2 Experiment and Instruinenta- tion Description
Figures 1 and 2 show the components and sequential operation of the flame tube. The eventual experiment is run in four stage^:^ (1) an acoustic driver is turned on to mix the particles into a uniform cloud; (2) the driver is turned off, and secondary air flows are given time to decay; (3) a nitrocellulose igniter is powered, burning through a mylar diaphragm and igniting the particle cloud; and (4) the flame spreads axially down the tube length, as in any premixed fuel system. This paper describes the techniques employed in the f irst two stages, as investigated in recent experiments performed a t gravity levels on the order of IO-'g in the LeRC 2.2 second drop tower facility.
In this facility. the experimental hardware, as sliorvn in Figure 3, is mounted within the confines of a drop rig (maximum allowable dimensions of approxirnatedly 38 inches L by 14 inches W by 28 inches 13). The drop rig itself is placed inside a drag shield; both the drag shield and drop rig are suspended by a thin wire at the top of a 100 foot open shaft. When the wire is cut pneumatically, both drag shield and drop rig fall for 2.2 seconds, landing in an aerated sand pit. During the fall. the drag shield absorbs most of the air drag, while the drop rig falls freely inside (see Figure 4). In this way, the low gravity level cited above is achieved during the fall.
The experimental hardware consisted of: (1) a 75 inch length by 2 inch diameter tube containing 480 mg lycopodium (an equivalence ratio of about 3); (2) a 1 inch length inline igniter section; (3) a 2 inch heat ex-
1
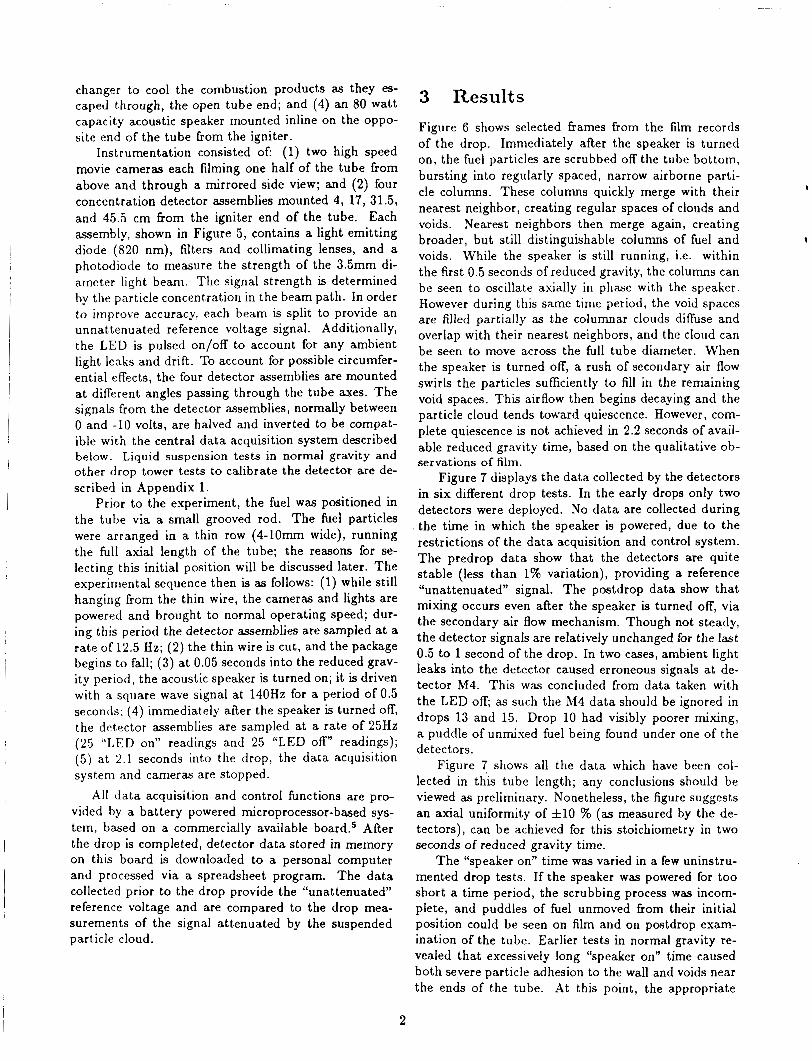
light leaks and drift. To account for possible circumfer- entia1 effects, the four detector assemblies are mounted at different angles passing through the tube axes. The signals from the detector assemblies, normally between 0 and -10 volts, are halved and inverted to be compat- ible with the central data acquisition system described below. Liquid suspension tests in normal gravity and other drop tower tests to calibrate the detector are de- I
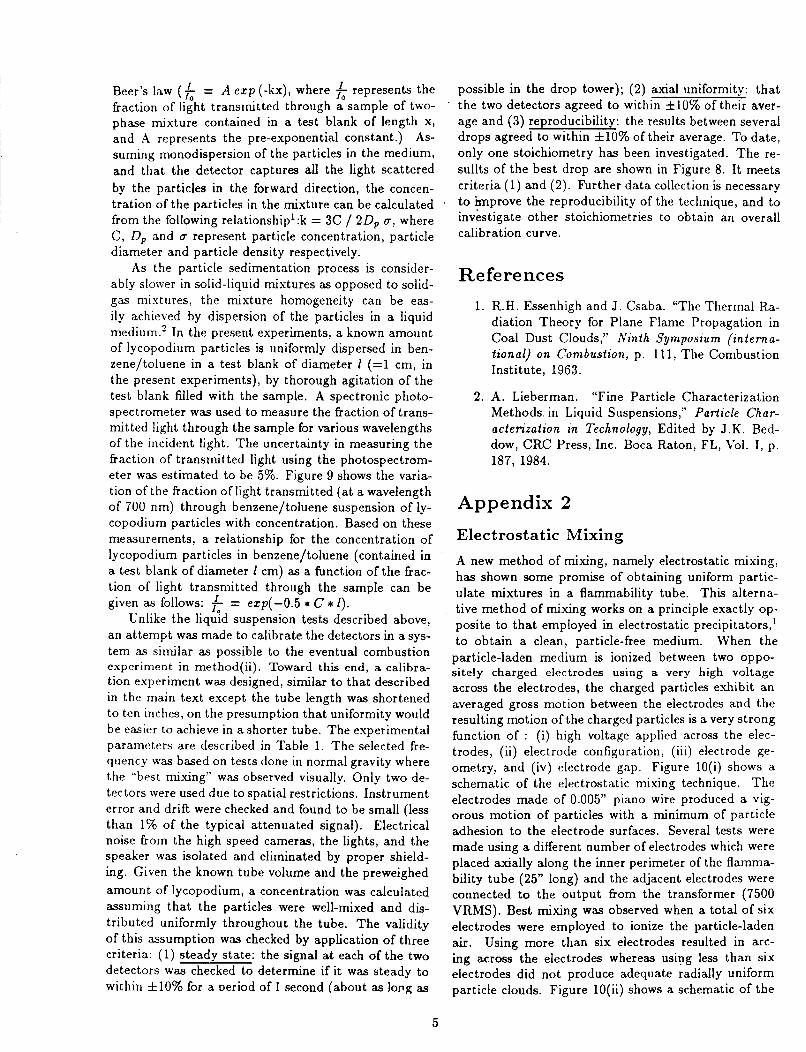
3 Results Figure 6 shows selected frames from the film records of the drop. Immediately after the speaker is turned on, the fuel particles are scrubbed off the tube bottom, bursting into regularly spaced, narrow airborne parti- cle columns. These columns quickly merge with their nearest neighbor, creating regular spaces of clouds and voids. Nearest neighbors then merge again, creating broader, but still distinguishable columns of fuel and voids. While the speaker is still running, ;.e. within the first 0.5 seconds of reduced gravity, the columns can be seen to oscillate asially in phase with the speaker. However during this same time period, the void spaces are filled partially as the columnar clouds diffuse and overlap with their nearest neighbors, and the cloud can be seen to move across the full tube diameter. When the speaker is turned off, a rush of secondary air flow swirls the particles sufficiently to fill in the remaining void spaces. This airflow then begins decaying and the particle cloud tends toward quiescence. However, com- plete quiescence is not achieved in 2.2 seconds of avail- able reduced gravity time, based on the qualitative ob- servations of film.
Figure 7 displays the data collected by the detectors in six different drop tests. In the early drops only two detectors were deployed. No data are collected during the time in which the speaker is powered, due to the restrictions of the data acquisition and control system. The predrop data show that the detectors are quite stable (less than 1% variation), providing a reference “unattenuated” signal. The postdrop data show that mixing occurs even after the speaker is turned off, via the secondary air flow mechanism. Though not steady, the detector signals are relatively unchanged for the last 0.5 to 1 second of the drop. In two cases, ambient light leaks into the detector caused erroneous signals at de- tector M4. This was concluded from data taken with the LED 0% as such the M 4 data should be ignored in drops 13 and 15. Drop 10 had visibly poorer mixing, a puddle of unmixed fuel being found under one of the detectors.
Figure 7 shows all the data which have been col- lected in this tube length; any conclusions should be viewed as preliminary. Nonetheless, the figure suggests an axial uniformity of f10 9% (as measured by the de- tectors), can be achieved for this stoichiometry in two seconds of reduced gravity time.
The “speaker on” time was varied in a few uninstru- mented drop tests. If the speaker was powered for too short a time period, the scrubbing process was incom- plete, and puddles of fuel unmoved from their initial position could be seen on film and on postdrop exam- ination of the tube. Earlier tests in normal gravity re- vealed that excessively long “speaker on” time caused both severe particle adhesion to the wall and voids near the ends of the tube. At this point, the appropriate
I 2

speaker on time has been found to be between 0.5 and 0.8 seconds.
4 Discussion of Results The short time in which the speaker is operating and the initial particle positioning have several advantages. First the problem of particle adhesion and agglomer- ation, as discussed by Berlad 1987, is minimized since the number and frequencies of particle collisions is min- imized. It may be possible in the eventual combustion experiments to avoid the need for special techniques? to reduce adhesion to acceptable levles. Secondly the initial particle position reduces the time and difficulty to create uniform axial distribution of particles radially and circumferentially while minimizing axial migration. Thirdly the total experiment time is made small which may eventually allow the complete elrperiment to be conducted in LeRC aircraft or other ground-based re- duced gravity facilities. The observed mechanism of mixing may (at first) appear surprising. Although the speaker was operated nominally at 140 Hz, i.e. near the first half wavelength of the tube, the discrete and regularly spaced columns suggest higher fiequency ex- citation of the particles. At first it was thought that the speaker was providing higher harmonic signah due to square wave input. However, the above mixing process was observed independently in the detector calibration tests described in Appendix 1 which employed a pure sine wave input, as well as a different tube length, input frequency, speaker type and power, and custom driver circuitry. Although the principal acoustic driver fie- quency corresponds to the first longitudinal mode of the tube, its high power and the “sloppy” diaphragm a t one tube end makes the acoustic resonator a highly nonlinear system. Wandering of energy among longi- tudinal, radial and tangential modes is a well known phenomenon characterizing nonlinear systems. That is, seemingly orthogonal normal modes do interact. The higher harmonics of the longitudinal mode appear to be stimulated in a manner that corresponds closely to the striations observed in the classical Kundt’s Tube Experiment.‘ The correspondence of Kundt’s Tube stri- ations (of cork dust) and those observed herein for ly- copodium is striking. To quote from reference 161 [pages 44-45], “...Perhaps the most striking of all effects of alternating aerial currents is the rib-like structure as- sumed by cork filings in Kundt’s experiment. Close observation, while the vibrations are in progress, shews that the filings are disposed in thin laminae transverse to the tube and extending upwards to a certain distance from the bottom. The effect is a maximum a t the loops, and disappears in the neighborhood of the nodes. When the vibrations stop, the laminae necessarily fall ...” In microgravity, the “thin laminae” can rise to the top of the horizontal tube. When vibrations stop, our ob- served “laminae” do not necessarily fall. Higher har-
monics of the longitudinal mode do not, by themselves, account for the effective, rapid wall scrubbing of the ly- copodium particles, distributed initially in a thin strip at the bottom of the horizontal cylindrical tube. The nonlinearity of the system permits energy coupling (de-
struction of the orthogonality) of the vibrational modes, permitting energy to be pumped into both radial and tangential modes. It is well known7 that the tangential modes correspond to higher fiequency spinning waves near walls and that radial waves may involve ‘‘slosh- ing”. The “puddles” observed in a number of cases (e.g.run #15) correspond to the scouring of the tube wall in the form of double crescents, as if created by spinning flows in the neighborhood of walls. Three di- mensional flows of this kind appear to provide the sec- ondary flow conditions needed for good particle mixing, aRer cessation of the acoustic source.
The cloud concentration is measured at only four discrete locations. As in any experiment, it is impossi- ble to measure concentration at every point in the sys- tem and this introduces some uncertainty in the uni- formity determination. Care has been taken to pos- tion the detector assemblies to view through different axes of the tube diameter; additionally the uneven axial spacing of the detectors was intended to prevent false agreement between detectors in the cellular mixing pro- cess. However in about one third of the drop tests, a few, small (less than lcm) puddles of unmixed fuel were observed on film and in post-drop tube esamina- tion while the detector data suggested a uniform cloud. The size of these clouds was on the order of the initial column spacing seen early in the mixing time. These puddles were confined to less than 5% of the tube vol- ume, did not appear in every test and were not suf- ficient to prevent flame propagation (observed in tests not reported in this paper; as such these puddles should not affect the eventual combustion experiment). How- ever the appearance of these puddles was not predicted by the examination of the detector data. Many more detector assemblies would be necessary to observe this phenomenon directly. Instead a combination of detec- tor data and visual observation of film data can pro- vide sufficient information to determine gross defects in the cloud uniformity. Eventually, the flame shape and speed which is sensitive to local concentration will provide more information about cloud uniformity.
To improve interpretation of the available detector data, a Kconsetvation of mass” criterion might be ap- plied. As one detector signals a diminished particle concentration, some other detector should signal an in- crease. An examination of the data reveals that is not always observed. This is due to the cellular or nodal na- ture of the mixing process. During the time the speaker is on, there is only small diffusive axial movement of particles, the nature of the mixing is such that the ef- fect of a lack of mixing near one end of the tube is not transmitted to the other end. Better communication is
3

I achieved after the speaker is turned off. The secondary air flows merge the various cloud columns together. The short reduced gravity test time is not sufficient to deter- mine if the secondary air flow is also cellular in nature. If it is cellular, then imperfect communication between all parts of the tube may result and the conservation of mass criterion may be difficult if not impossible to interpret. I f it is not cellular, then with more reduced gravity time a more uniform cloud may result. In longer duration tests if puddles of unmixed fuel are observed, then the detector data should reveal a lower concen- tration than in tests with more robust mixing. Plans have therefore been made to repeat this experiment on the LeRC Lear jet which provides between 10 and 20 seconds of reduced gravity time.
~
5 Problems and Future Plans Though of minor consequence, the unmixed fuel pud- dles should be eliminated. Seemingly identical tests produced slightly different results. The problem may be due to poorly charged batteries, diaphragm posi- tioning, improper fuel loading, ambient temperature changes, and nonreproducible speaker response. In the future, this problem will either be resolved, or “lived with”; unsuccessful tests are readily determined, and will be repeated until successful. It appears certain that more reduced gravity time will be required to conduct the complete experiment. The longer reduced gravity duration obtained on LeRC aircraft will overcome this problem; however gravity levels will be degraded about three orders of magnitude. This is not believed to be a serious problem for the eventual combustion experi- ment. Some particle wall adhesion tests need be done in both normal gravity and drop tower to quantify the extent of particle adhesion.
6 Concluding Remarks The use of acoustic, electrostatic, or other methods of particle dispersion (to achieve fuel particle cloud uni- f0rmit.y) invloves the interaction of numerous physical processes, not all helpful. Frictional interaction of di- electric materials involves triboelectric effects, with cor- responding particle-wall adhesion and particle-particle agglomeration as possible consequences. Accordingly, periods of mixing which are long enough to create such undesirable charge separation effects are to be avoided. In these experiments, it was observed that powerful acoustic bursts (of the order of 1/2 second) at the ap- proximate frequency of a cylindrical tube’s longitudinal first harmonic creates conditions for good particle cloud mixing. The total “burst” duration is short, avoiding substantial triboelectric effects. High acoustic power, coupled with the nonlinear (sloppy) membrane at the tube’s terminus stimulates the nonlinear effects needed for good mixing.
I 4
7 Acknowledgements This work is supported by NASA Lewis Research Cen- ter under the PCCE (Particle Cloud Combustion Ex- periments) program. The authors would like to thank hlr. J . Tresler of NASA-LeRC, Cleveland and hIr. hI. Plut of UCSD, San Diego for their technical help for the assembly of various esperiments.
8 References 1. A.L. Berlad. “Combustion Studies in hlicrograv-
ity,” Progress in A st ronaut ics and Aerona u tics, 108, 201, 1986.
2. A.L. Berlad, N.D. Joshi, H. Ross and R. Klimek. “Particle Cloud Kinetics in hlicrogravity,” A I A A P a p e r 87-0577, (1987).
3. A.L. Berlad. “Particle Cloud Combustion in Re- duced Gravity,” Paper presented at the March 9, 1987 NASA LeRC Conference on Reduced Grav- ity Flight Experiments.
4. J. Salzman. “Microgravity &search Facilities at the NASA Lewis Research Center,” Interna- t ional Symposium for Promoting Applications and Capabilities of the Space Environment, Tokyo, Japan, 1987.
5 . Onset Computer Corportation. The Telltale Model IV , P.O. box 1030; 199 Main Street; N. Falmouth, MA 02556.
6. Lord Rayleigh. “The Theory of Sound,” Vol. 11, Revised 1894. Pub.: Dover (N.Y.,N.Y.), 1945.
7. L. Crocco. “Theoretical Studies of Liquid Propel- lent Rocket Instability,” Tenth Symposium (Inter- national) on Combust ion, The Combustion Insti- tute, p.1101, 1965.
Appendix 1
Calibration of Optical Probes In order to determine the relationship between the SUS- pended fuel concentration and the strength of the light beam signal, a calibration must be performed with a known concentration of particles in the beam path. In the present study, two independent methods are em- ployed to obtain the calibration curves for the con- centration of the particles dispersed in air as a func- tion of the fraction of light attenuated by the parti- cle cloud, namely: (i) liquid suspension measurements and (ii) drop-tower measurements. In the first method, an estimate for the absorption coefficient (k) of the particles can be obtained from the measurements and
I Beer’s law (k = A e z p (-kx), where z; represents the fraction of light transmitted through a sample of two- phase mixture contained in a test blank of length X, and A represents the pre-exponential constant.) As- suming monodispersion of the particles in the medium, and that the detector captures all the light scattered by the particles in the forward direction, the concen- tration of the particles in the mixture can be calculated from the following re1ationship’:k = 3C / 2 0 , 6, where C, 0, and 6 represent particle concentration, particle diameter and particle density respectively.
As the particle sedimentation process is consider- ably slower in solid-liquid mixtures as opposed to solid- gas mixtures, the mixture homogeneity can be eas- ily achieved by dispersion of the particles in a liquid medium.’ In the present experiments, a known amount of lycopodium particles is uniformly dispersed in ben- zene/toluene in a test blank of diameter 1 (=1 cm, in the present experiments), by thorough agitation of the test blank filled with the sample. A spectronic photo- spectrometer was used to measure the fiaction of trans- mitted light through the sample for various wavelengths of the incident light. The uncertainty in measuring the fraction of transmitted light using the photospectrom- eter was estimated to be 5%. Figure 9 shows the varia- tion of the fraction of light transmitted (at a wavelength of 700 nm) through benzene/toluene suspension of ly- copodium particles with concentration. Based on these measurements, a relationship for the concentration of lycopodium particles in benzene/toluene (contained in a test blank of diameter 1 cm) as a function of the fiac- tion of light transmitted through the sample can be given as follows: & = ezp(-0.5 * C * I ) .
Unlike the liquid suspension tests described above, an attempt was made to calibrate the detectors in a sys- tem as similar as possible to the eventual combustion experiment in method(ii). Toward this end, a calibra- tion experiment was designed, similar to that described in the main text except the tube length was shortened to ten inches, on the presumption that uniformity would be easier to achieve in a shorter tube. The experimental parameters are described in Table 1. The selected fre- quency was based on tests done in normal gravity where the “best mixing” was observed visually. Only two de- tectors were used due to spatial restrictions. Instrument error and drift were checked and found to be small (less than 1% of the typical attenuated signal). Electrical noise from the high speed cameras, the lights, and the speaker was isolated and eliminated by proper shield- ing. Given the known tube volume and the preweighed amount of lycopodium, a concentration was calculated assuming that the particles were well-mixed and dk- tributed uniformly throughout the tube. The validity of this assumption was checked by application of three criteria: (1) steady state: the signal at each of the two detectors was checked to determine if it was steady to within *lo% for a Deriod of 1 second (about as long as
5
possible in the drop tower); (2) axial uniformity: that the two detectors agreed to within f l O % of their avet- age and (3) reproducibility: the results between several drops agreed to within &lo% of their average. To date, only one stoichiometry has been investigated. The re- sullts of the best drop are shown in Figure 8. It meets criteria (1) and (2). Further data collection is necessary to improve the reproducibility of the technique, and to investigate other stoichiometries to obtain an overall calibration curve.
References 1. R.H. Essenhigh and J . Csaba. “The Thermal Ra-
diation Theory for Plane Flame Propagation in Coal Dust Clouds,” Ninth Symposium (inierna- tional) on Combustion, p. 111, The Combustion Institute, 1963.
2. A. Lieberman. “Fine Particle Characterization Methods. in Liquid Suspensions,” Particle Char- acterization in Technology, Edited by J.K. Bed- dow, CRC Press, Inc. Boca Raton, FL, Vol. I , p. 187, 1984.
Appendix 2
Electrostatic Mixing A new method of mixing, namely electrostatic mixing, has shown some promise of obtaining uniform partic- ulate mixtures in a flammability tube. This alterna- tive method of mixing works on a principle exactly op- posite to that employed in electrostatic precipitators,’ to obtain a clean, particle-free medium. When the
particle-laden medium is ionized between two oppo- sitely charged electrodes using a very high voltage across the electrodes, the charged particles exhibit an averaged gross motion between the electrodes and the resulting motion of the charged particles is a very strong function of : (i) high voltage applied across the elec- trodes, (ii) electrode configuration, (i i i) electrode ge- ometry, and (iv) electrode gap. Figure 1O(i) shows a schematic of the electrostatic mixing technique. The electrodes made of 0.005” piano wire produced a vig- orous motion of particles with a minimum of particle adhesion to the electrode surfaces. Several tests were made using a different number of electrodes which were placed axially along the inner perimeter of the flamma- bility tube (25” long) and the adjacent electrodes were connected to the output from the transformer (7500 VRMS). Best mixing was observed when a total of six electrodes were employed to ionize the particle-laden air. Using more than six electrodes resulted in arc- ing across the electrodes whereas using less than six electrodes did not produce adequate radially uniform particle clouds. Figure lO( i i ) shows a schematic of the

particle cloud and the particle path when subjected to electrostatic forces. In general, a n optimal geometry and a n optimal configuration of the elctrodes are essen- tial ingredients of electrostatic mixing technique. The main drawbacks of this method ofmixing were observed to be: ( i ) occasional arcing, providing undesirable lo- cal ignition source leading to combustion of the mix- ture, and ( i i ) interference effects (such as high frequency noise) produced in auxiliary electronic measuring de- vices, caused by the high voltage application across the electrodes, and (iii) heavy wall adhesion of the particles.
I Refer e nc es 1. E.C. Barnes and G. tV. Penny. “An Electrostatic
Dust Weight Sampler,” J. Znd. Hyg. Tozico., vol 20, p. 259, 1938.
Appendix 3
Particle Cluster Kinetics hlixing of dielectric particulates generally involves charge separation processes, with corresponding particle-particle agglomeration and particle-wall at- tachment phenomena. Particle-particle clusters can be deagglomerated experimentally through the use of weak a-particle sources (e.g. Polonium 210). Kinet- ics of acoustically induced particle mixing processes were experimentally reported earlier.’ Assuming that the par ti cle-cluster agglomer ation/deagglomeration de- pends on the interaction of monomers with all other cluster sizes, a kinetic scheme (similar to that in con- ventional nucleation theory) was proposed.’ In this ap- pendix, an attempt is made to assess the usefulness of such a model in simulating the formation of a uniform particle cloud. The details of the model are not pre- sented here and the reader is referred to Berlad et al, 1987.
Calculations were performed to determine the evo- lution of the cluster size distribution, assuming cer- tain functional relationships for ( i ) cluster agglornera- tion rate constant (k,) and ( i i ) cluster deagglomeration rate constant (kd) as a function of cluster size (i.e. k, = f,(E,,n,) and kd = ( (Pd ,n , ) , where Et, Pd, and n, rep- resent triboelectric collision energy parameter, particle deagglomeration power parameter, and the size of clus- ter i respecively). Initially (at time t=O), the particle- air mixture is assumed to consist of 100 particles of cluster size ten (and the particle mass of a monomer is assumed to be unity). For one specific set of param- eters, Pd and E,, a h e a r relationship is assumed for the agglomeration and deagglomeration rate constants. Assunling there is no further agglomeration past the cluster size ten, an initial value problem is formulated for the rate of change of each cluster size i (1 5 i 5 10) resulting in a set of ten nonlinear ordinary differ- ential equations (subjected to the constraint that the total mass of all clusters is conserved for all time t,
I 6
as outlined by Berlad et al, 1987 ). Solution of these equations is obtained using Gear methods. Figure I 1 shows the evolution of the particle-cluster mass of var- ious clusters as a function of time. At time t=O, the system consists of particles of cluster size ten only and after a period of time ( t = 0.32 sec), the particle cloud consists of monomers only. The growth and decay of all the intermediate cluster sizes are relatively short for the specific set of rate constants chosen, resulting in fast deagglomeration from cluster size ten. Thus it can be summarized that particle-particle interactions in a particle cloud can be closely simulated for a n y system with a proper choice ofrate constants for agglomeratioi: and deagglomeration of particle clusters.
References 1. A.L. Berlad. N.D. Joshi, H. Ross and R. Klimelc.
“Particle Cloud Kinetics in Microgravity,” AZAA Paper 87-0577, (1987).
Table 1: Calibration Study - Experimental Parameters
10 inch clear, straight lexan tube (2 inch diameter) 2 mylar diaphragms, glued to flanges ignition section (no igniter wire) midrange tweeter speaker (233.5 Hz) 2 optical probes, one near speaker 2.02 seconds of g data recorded lycopodium ( 28 p dia ) as fuel particles an equivalence ratio of three or 186 mg ?f fuel all fuel loaded into tube using polished brass rod camera (400 frames per second), high speed motion base reading of sensor (clear tube) held constant

r NITROCELLULOSE / WOOL/N I CHROME r MIXING SENSOR
i // WIRE IGNITER MOUNTING BRACKET
/ I /
/ I /-O-RING
2 I N . I . D . x I
LFILTER/HEAT 0.125 I N . WALL EXCHANGER
/ ' PRESSURE TRANSDUCER
FIGURE 1. - A SCHEMATIC OF FLAME TUBE ASSEMBLY,
TEMPORARY
VERIFY IGNIT ION AND F I L M FLAME DIAPHRAM AND RECORD
I N I T I A T L MIX ING AND OPTICAL HOMOGENEITY
SENSORS WAIT BURNTHROUGH DATA
FIGURE 2. - SEQUENTIAL STAGES OF OPERATION OF THE FLAME TUBE I N A TYPICAL DROP.
FIGURE 3. - PARTICLE CLOUD COMBUSTION EXPERIMENTAL R IG.
7

V I S I B L E LIGHT r BLOCK I NG FILTER I I NEUTRAL
DENSITY
DROP R I G AND EXPERIMENT PACKAGE 2.2-SECOND DROP TOWER
/-MUSIC-WIRE SUPPORl
/ ,-WIRE RELEASE MECHANISM
,- DRAG SHIELD
( a ) BEFORE TEST ( b ) DURING TEST t c ) AFTER TEST DROP. DROP. DROP.
FIGURE 4. - POSITION OF EXPERIMENT PACKAGE AND DRAG SHIELD BEFORE, DURING, AND AFTER TEST DROP.
REF ERE N C E DETECTOR 7
\ \ . .
NEUTRAL DENSITY
3.5 MM DIAM
3 . 5 MM DIAM-’ LBEAM SPLITTER
FIGURE 5 . - A SCHEMATIC OF THE OPTICAL DETECTORS MOUNTED ON FLAME TUBE ( 2 5 IN.).
( a ) (SIDE VIEW) 10-IN. TUBE. TIME SHOWN IS IN 0.01 SEC INCREMENTS. JET SPACING IS ABOUT 0.09 TO 0.12 IN. WITH A THICKNESS OF 0.09 TO 0.11 IN. AT t = 0.15 SEC INTO THE DROP, AT t = 0.20 SEC. THE SPACING IS 0.18 IN. AND THE THICKNESS IS 0.25 IN. THE SPEAKER IS TURNED OFF AT
0.3 SEC.
FIGURE 6. - SEQUENCE OF MIXING EVENTS,
8 ORIGINAL PAGE IS OF POOR QUALITY

ORIGINAL PAGE IS OF POOR QUALITY
( b ) (TOP VIEW) 25-IN. TUBE. APPROXIMATELY 50% OF THE TUBE LENGTH IS SHOWN. TIMER IS OBSCURED BY LIGHT GLARE. I N THE BOTTOM MIDDLE PICTIIRE. A PUDDLE OF UNMIXED FUEL CAN BE SEEN JUST TO THE RIGHT OF THE TIMER.
FIGURE 6. - CONCLUDED.
9

w
z
L W I- t- U
0 L 100
50
a
%--
I ( a ) DROP 7.
( c ) DROP 10.
0 .6 1.8 -. TIME. SEC
( e ) DROP 13.
2 ( b ) DROP 9.
( d ) DROP 1 1
.6 1.8
( f ) DROP 15.
FIGURE 7. - OUTPUT FROM VARIOUS OPTICAL DETECTORS FOR VARIOUS DROPS.
10
loo r DROP 29
c 4 8 501
II 0
I n ( l o / f ) = 0.021 + 0.48 OC
1 2 CONCENTRATION. MG/CC
( a ) SUSPENDED IN BENZENE.
3
SENSOR ONE SENSOR TWO
0 1 2
FIGURE 8. - OUTPUT FROM TWO DETECTORS USING THE CALIBRA-
TIME, SEC
T ION R I G (10-IN. FLAME TUBE).
0 1 2 3 4 CONCENTRATION, PIG/CC
tb ) SUSPENMD I N TOLUENE.
FIGURE 9. - VARIATION OF THE OPTICAL SIGNAL WITH THE CONCENTRATION OF LYCOPODIUM PARTICLES AT A WAVE- LENGTH OF 700 NM.
11

r 25-IN. LEXAN TUBE (2-1N. D I M )
I. 7500 VRMS
115 FAC
ELECTRODES (6) /
MADE OF PIANO WIRE- ' ', PARTICLE PATH PARTICLE CLOUD
( a ) ( b )
FIGURE 10. - A SCHEMATIC OF ELECTROSTATIC MIXING APPARATUS AND PARTICLE WITION BETWEEN THE ELECTRODES.
CLUSTER S I Z E
0 1 0 2 a 3
0 5
6.5216
n 4 - v) v)
P = W E 1.3198
2
s
1
W
2.1719
0 TIME, SEC
FIGURE 11. - TIME EVOLUTION OF PARTICLE-CLUSTER MASS AS PREDICTED BY THE MODEL, DURING FAST DEAGGLOMERATION FRM CLUSTER S I Z E TEN.
12

NASA Nationd Aeronautics and Report Documentation Page Space Administration
2. Government Accession No. NASA TM-101484 1. Report No.
i 17. Key Words (Suggested by Author(s))
Microgravity Particle cloud Combustion Flammability tubes
AIAA-88-0453 4. Title and Subtitle
Particle Cloud Mixing in Microgravity
18. Distribution Statement
Unclassified -Unlimited Subject Category 29
7. Author@)
19. Security Classif. (of this report) 20. Security Classif. (of this page)
Unclassified Unclassified
H. Ross, L. Facca, V. Tangirala, and A.L. Berlad
21. No of pages 22. Price'
14 A03
9. Performing Organization Name and Address
National Aeronautics and Space Administration Lewis Research Center Cleveland, Ohio 44135-3191
12. Sponsoring Agency Name and Address
National Aeronautics and Space Administration Washington, D.C. 20546-0001
15. Supplementary Notes
~
3. Recipient's Catalog No.
5. ReDort Date
6. Performing Organization Code
8. Performing Organization Report No.
E-46 18
10. Work Unit No
694-00-01
11. Contract or Grant No.
13. Type of Report and Period Covered
Technical Memorandum
14. Sponsoring Agency Code
Presented at the 26th Aerospace Sciences Meeting sponsored by the American Institute of Aeronautics and Astronautics, Reno, Nevada, January 11-14, 1988. H. Ross and L. Facca, NASA Lewis Research Center; V. Tangirala and A.L. Berlad, Center for Energy and Combustion Research, University of California, San Diego, La Jolla, California.
16. Abstract
Quasi-steady flame propagation through clouds of combustible particles requires quasi-steady transport properties and quasi-steady particle number density. Microgravity conditions may be employed to help achieve the condi- tions of quiescent, uniform clouds needed for such combustion studies. Joint experimental and theoretical NASA- UCSD studies have been concerned with the use of acoustic, electrostatic, and other methods of dispersion of fuel particulates. Results of these studies are presented for particle clouds in long cylindrical tubes.
I
'For sale by the National Technical Information Service, Springfield, Virginia 22161 NASA FORM 1626 OCT 86