particle entrainment simulator at the u.s. army engineer ... · pdf fileused at the u.s. army...
TRANSCRIPT
PURPOSE: This technical note describes the particle entrainment simulator (PES), which is used at the U.S. Army Engineer Research and Development Center (ERDC) for experimental determination of erodibility of fine-grained cohesive sediments. The device, its method of operation, experimental data reduction, and application of PES results to studies related to estuarine and coastal sediment transport problems are briefly described. BACKGROUND: Prediction of fine-grained sediment erosion must be based on hydrodynamic forces at the site and erodibility characteristics of the in situ material. Determining the erodibility of fine-grained cohesive sediment is much more difficult than for the coarse-grained sediments. Equations available for predicting transport of noncohesive sediments use grain-size and physics-based descriptors. The present state of the art for cohesive sediment transport prediction involves several empirical coefficients in mathematical description of sediment dynamics processes. Teeter (1990), Mehta (1992), and Parchure et al. (2003) described the physico-chemical factors and parameters involved in cohesive sediment dynamics. The values of empirical parameters must be determined from experimental results or estimated based on available literature on sediments similar to those prevailing at the site under consideration. Estimates of erodibility parameters can be made using basic characterization information in some cases. Erosion at a given site also depends on the depositional properties of sediment, bioturbation, and history of flow-induced shear stresses. Therefore, the local hydrodynamic and biochemical conditions as well as sediment properties at each site need to be well understood. Conducting experimental erosion tests is an integrated method of characterizing cohesive sediments in terms of their erodibility assessment. However, erosion-testing procedures are not standardized, and a variety of laboratory and field approaches and devices are available. Lee and Mehta (1994) described several laboratory and field devices used for measuring cohesive sediment erosion. Subsequently, more devices have been added such as the SEDflume (McNeil et al. 1996) for unidirectional, high shear stress flow and the Sediment Erosion Actuated by Wave Oscillations and Linear Flow (SEAWOLF) Flume (Jepsen et al. 2003). Most of the devices are specialized equipment and are expensive and time-consuming to use. Currently used simple erosion testing devices involve a few assumptions about hydrodynamic and/or sediment conditions. The PES is one such device. It has been developed, tested, and used by several investigative groups in the United States to determine the erodibility of undisturbed, fine-grained surface sediment samples. The PES provides a practical and inexpensive method for cohesive sediment characterization. It is also a tool that has potential for wider use in the laboratory and in the field.
ERDC TN-SWWRP-05-2September 2005
Particle Entrainment Simulator at the U.S. Army Engineer Research and Development Center
By Trimbak M. Parchure and Joseph Z. Gailani
Report Documentation Page Form ApprovedOMB No. 0704-0188
Public reporting burden for the collection of information is estimated to average 1 hour per response, including the time for reviewing instructions, searching existing data sources, gathering andmaintaining the data needed, and completing and reviewing the collection of information. Send comments regarding this burden estimate or any other aspect of this collection of information,including suggestions for reducing this burden, to Washington Headquarters Services, Directorate for Information Operations and Reports, 1215 Jefferson Davis Highway, Suite 1204, ArlingtonVA 22202-4302. Respondents should be aware that notwithstanding any other provision of law, no person shall be subject to a penalty for failing to comply with a collection of information if itdoes not display a currently valid OMB control number.
1. REPORT DATE SEP 2005
2. REPORT TYPE N/A
3. DATES COVERED -
4. TITLE AND SUBTITLE Particle Entrainment Simulator at the U.S. Army Engineer Research andDevelopment Center
5a. CONTRACT NUMBER
5b. GRANT NUMBER
5c. PROGRAM ELEMENT NUMBER
6. AUTHOR(S) 5d. PROJECT NUMBER
5e. TASK NUMBER
5f. WORK UNIT NUMBER
7. PERFORMING ORGANIZATION NAME(S) AND ADDRESS(ES) U.S. Army Corps of Engineers Washington, DC 20314-1000
8. PERFORMING ORGANIZATIONREPORT NUMBER
9. SPONSORING/MONITORING AGENCY NAME(S) AND ADDRESS(ES) 10. SPONSOR/MONITOR’S ACRONYM(S)
11. SPONSOR/MONITOR’S REPORT NUMBER(S)
12. DISTRIBUTION/AVAILABILITY STATEMENT Approved for public release, distribution unlimited
13. SUPPLEMENTARY NOTES
14. ABSTRACT
15. SUBJECT TERMS
16. SECURITY CLASSIFICATION OF: 17. LIMITATION OF ABSTRACT
UU
18. NUMBEROF PAGES
11
19a. NAME OFRESPONSIBLE PERSON
a. REPORT unclassified
b. ABSTRACT unclassified
c. THIS PAGE unclassified
Standard Form 298 (Rev. 8-98) Prescribed by ANSI Std Z39-18
ERDC TN-SWWRP-05-2 September 2005
2
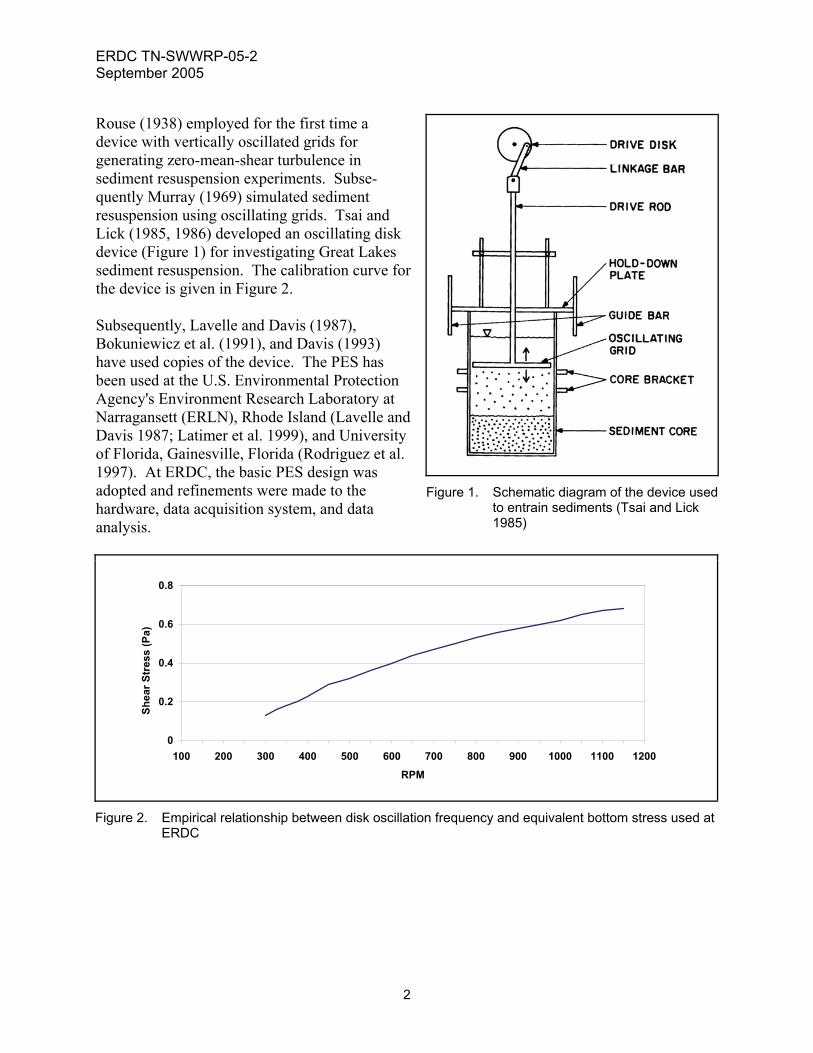
Rouse (1938) employed for the first time a device with vertically oscillated grids for generating zero-mean-shear turbulence in sediment resuspension experiments. Subse-quently Murray (1969) simulated sediment resuspension using oscillating grids. Tsai and Lick (1985, 1986) developed an oscillating disk device (Figure 1) for investigating Great Lakes sediment resuspension. The calibration curve for the device is given in Figure 2. Subsequently, Lavelle and Davis (1987), Bokuniewicz et al. (1991), and Davis (1993) have used copies of the device. The PES has been used at the U.S. Environmental Protection Agency's Environment Research Laboratory at Narragansett (ERLN), Rhode Island (Lavelle and Davis 1987; Latimer et al. 1999), and University of Florida, Gainesville, Florida (Rodriguez et al. 1997). At ERDC, the basic PES design was adopted and refinements were made to the hardware, data acquisition system, and data analysis.
0
0.2
0.4
0.6
0.8
100 200 300 400 500 600 700 800 900 1000 1100 1200
RPM
Shea
r Str
ess
(Pa)
Figure 2. Empirical relationship between disk oscillation frequency and equivalent bottom stress used at ERDC
Figure 1. Schematic diagram of the device used to entrain sediments (Tsai and Lick 1985)

ERDC TN-SWWRP-05-2 September 2005
3
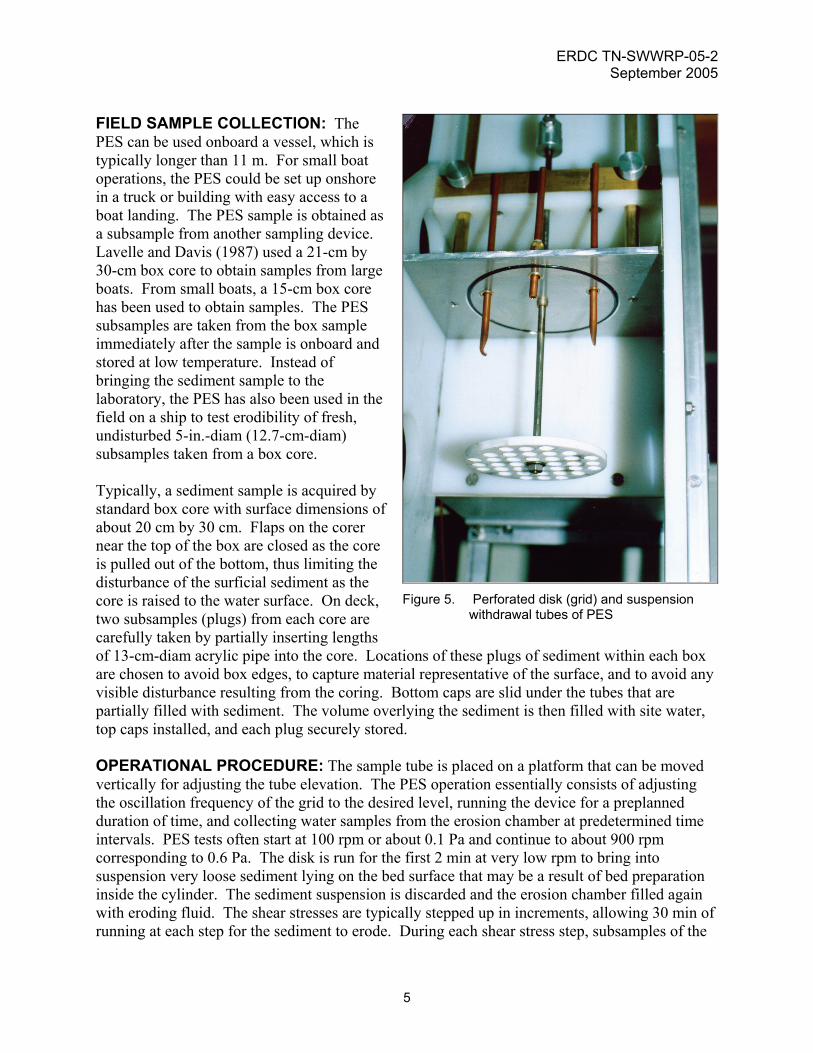
Oscillating-grid turbulence devices have been used in problems of entrainment of fluids across density interfaces (Rouse and Dodu 1955; Cromwell 1960; Turner and Kraus 1967). The turbulence structure within oscillating grid chambers has been extensively studied through measurements and theoretical development (Bouvard and Dumas 1967; Thompson and Turner 1975; Hopfinger and Toly 1976; McDougall 1979; Xuequan and Hopfinger 1986; Long 1978; Orlins 1996). Dependence of turbulence on the oscillation frequency, distance from the grid, stroke length, and mesh size as well as mesh-form have all been investigated. While it is clear that the turbulence field generated by such a device is different than that generated by a shear flow, corresponding conditions can be found for which entrainment rates that depend on the instantaneous turbulence stresses in the boundary layer in both types of flow can be made identical. DESCRIPTION: The PES fabricated at ERDC is a portable device with an erosion chamber geometry identical to that used by several other investigators. It requires only about a 1-m by 1-m table space and 600 W of 120-V alternating current power. The main unit weighs 25 kg. It is designed to serve as a laboratory/field tool for erodibility assessment of undisturbed cohesive sedi-ment core sections. A schematic drawing is shown in Figure 3. Photographs of the PES and the grid are shown in Figures 4 and 5. The erosion chamber is a vertical Plexiglas cylinder, 30 cm in height with 11.70 cm inside diameter. It is held firmly between a bottom platform and an adjustable horizontal plate at the top. A 0.6-cm-thick perforated horizontal Plexiglas disk is concentrically placed inside the cylinder to move within a 13-cm-high fluid column overlying the sediment. The 11-cm-diam disk with 1.2-cm-diam holes is connected to a variable speed motor at the top by means of a vertical rod. The distance between the centers of two adjacent holes is 1.5 cm. The porosity of the grid is 42.8 percent. The disk is located at a minimum distance of 5 cm above the sediment bed and has an excursion of 2.54 cm. The water level is kept at 13 cm and the mean bed elevation is 6.3 cm. The vertically oscillating grid generates turbulence above the sediment to simulate the erosive bed shear stress. Samples of Figure 3. Schematic layout of PES at ERDC
ERDC TN-SWWRP-05-2 September 2005
4
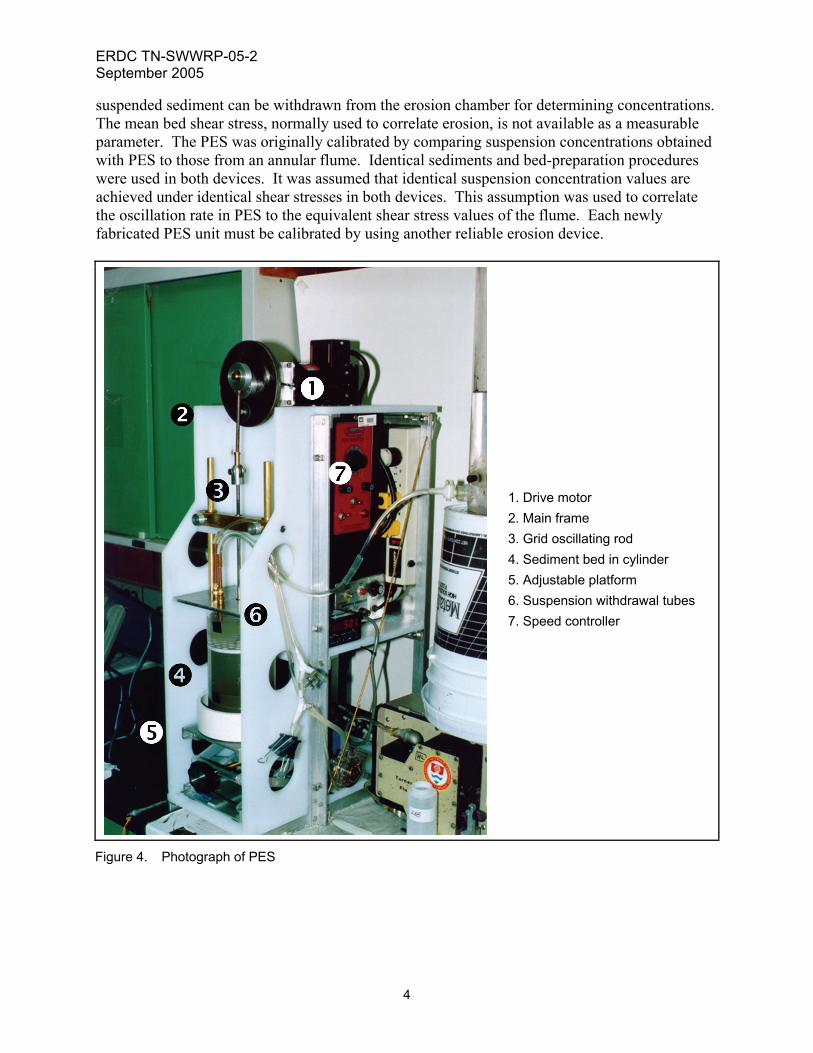
suspended sediment can be withdrawn from the erosion chamber for determining concentrations. The mean bed shear stress, normally used to correlate erosion, is not available as a measurable parameter. The PES was originally calibrated by comparing suspension concentrations obtained with PES to those from an annular flume. Identical sediments and bed-preparation procedures were used in both devices. It was assumed that identical suspension concentration values are achieved under identical shear stresses in both devices. This assumption was used to correlate the oscillation rate in PES to the equivalent shear stress values of the flume. Each newly fabricated PES unit must be calibrated by using another reliable erosion device.
1. Drive motor 2. Main frame 3. Grid oscillating rod 4. Sediment bed in cylinder 5. Adjustable platform 6. Suspension withdrawal tubes 7. Speed controller
Figure 4. Photograph of PES
ERDC TN-SWWRP-05-2 September 2005
5
FIELD SAMPLE COLLECTION: The PES can be used onboard a vessel, which is typically longer than 11 m. For small boat operations, the PES could be set up onshore in a truck or building with easy access to a boat landing. The PES sample is obtained as a subsample from another sampling device. Lavelle and Davis (1987) used a 21-cm by 30-cm box core to obtain samples from large boats. From small boats, a 15-cm box core has been used to obtain samples. The PES subsamples are taken from the box sample immediately after the sample is onboard and stored at low temperature. Instead of bringing the sediment sample to the laboratory, the PES has also been used in the field on a ship to test erodibility of fresh, undisturbed 5-in.-diam (12.7-cm-diam) subsamples taken from a box core. Typically, a sediment sample is acquired by standard box core with surface dimensions of about 20 cm by 30 cm. Flaps on the corer near the top of the box are closed as the core is pulled out of the bottom, thus limiting the disturbance of the surficial sediment as the core is raised to the water surface. On deck, two subsamples (plugs) from each core are carefully taken by partially inserting lengths of 13-cm-diam acrylic pipe into the core. Locations of these plugs of sediment within each box are chosen to avoid box edges, to capture material representative of the surface, and to avoid any visible disturbance resulting from the coring. Bottom caps are slid under the tubes that are partially filled with sediment. The volume overlying the sediment is then filled with site water, top caps installed, and each plug securely stored. OPERATIONAL PROCEDURE: The sample tube is placed on a platform that can be moved vertically for adjusting the tube elevation. The PES operation essentially consists of adjusting the oscillation frequency of the grid to the desired level, running the device for a preplanned duration of time, and collecting water samples from the erosion chamber at predetermined time intervals. PES tests often start at 100 rpm or about 0.1 Pa and continue to about 900 rpm corresponding to 0.6 Pa. The disk is run for the first 2 min at very low rpm to bring into suspension very loose sediment lying on the bed surface that may be a result of bed preparation inside the cylinder. The sediment suspension is discarded and the erosion chamber filled again with eroding fluid. The shear stresses are typically stepped up in increments, allowing 30 min of running at each step for the sediment to erode. During each shear stress step, subsamples of the
Figure 5. Perforated disk (grid) and suspension withdrawal tubes of PES
ERDC TN-SWWRP-05-2 September 2005
6
supernatant are drawn over time through a side port in the acrylic tube walls. At the end of each time step, the chamber fluid volume is replaced with particle-free water to keep the water level constant in the erosion chamber. Some researchers have used optical devices for determining suspension concentration. Davis (1993) measured turbidity of subsamples with a Bausch and Lomb spectrophotometer model Spectronic 20 using a wavelength of 660 nm and then converting to suspended solids concentration through a sediment-specific empirical relationship. At ERDC the suspension concentration is determined by filtering the samples through 0.45-μ polycarbonate Nuclepore filters. Because the volume of the PES erosion chamber is low, the suspension concentrations are adjusted for the sediment withdrawn during sampling. This adjustment is made by numerically adding the amount of sediment removed during sampling to the results of suspension concentration of the subsequent samples. Ideally, undisturbed in situ bed samples should be used for determining erosion rates. However, laboratory devices generally use molded or redispersed-and-deposited test sediment beds for conducting erosion tests. When slurries are settled to form a deposited test bed in the chamber, the elevation of the sediment-water interface is measured immediately after pouring the slurry and again before each erosion test. Varying consolidation times are used before beginning the erosion tests. Varying the consolidation times results in varying bulk densities and shear strengths of the bed. It is essential to determine the bulk density of the sediment bed as a function of sediment depth for determining erosion rate. It is best to perform erosion experiments at shear stresses that correspond to the anticipated field conditions. ERDC developed a modified operational procedure that provides information needed for use in the numerical erosion models used for sediment studies of various projects. The procedure adopted at ERDC for operation of the PES is given below with enough detail to enable use of PES by new users. DATA REDUCTION: The basic information from PES tests is suspended sediment concentration as a function of time over specific grid oscillation rates, which represent corresponding bed shear stresses. Final slurry volume concentration and bulk wet density (BWD) are calculated from the data on the initial and settled sediment thicknesses, and the initial slurry volume concentration. From the measured bulk bed density and the results of suspension concentration, the mass of sediments eroded from bed surfaces is calculated. Erosion rates are calculated as a function of time and bed shear stress values. Each shear stress step is analyzed by regression analysis to determine erosion rate. Acceleration at the beginning of each shear stress step produces a time-varying component of shear stress. To avoid this, regression is performed on adjusted concentrations at 10 to 30 min of each step. Regression results are considered acceptable if p-values are less than 0.20. This procedure eliminated results with near-zero slopes and marginal regression fits. The final data analysis step involves use of a specific erosion equation. This equation may or may not include the value of critical shear stress for erosion. In any case, estimated erosion rates and corresponding shear stresses along with bed density or other parameters are used to fit empirical coefficients by regression analysis.
ERDC TN-SWWRP-05-2 September 2005
7
APPLICATIONS: The PES has been used at ERDC to assess the erodibility of three general types of sediments:
• Bed sediments from water bodies such as lakes, rivers, and reservoirs. • Navigation channel bottom sediments. • Sediment slurries used to simulate the dredging and disposal processes.
The first type of sediment is usually involved in investigations of general sediment transport, while the latter two types are involved in investigations of sediment transport associated with Corps of Engineers dredging and disposal operations. Natural bottoms generally have moderate to high BWD and can be fine-grained or contain substantial fractions of sand-sized particles. These sediments are handled and tested in such a way as to minimize disturbance. Channel bottom sediments from most estuarine channels are predominantly fine-grained with substantial clay fractions, and have low BWD's. Erosion tests are performed on undisturbed sediments, or, if appropriate, on remolded sediment composites or other types of sediment samples. It is always desirable to test sediments under conditions closely resembling those in the field, including undisturbed sediment deposits. Sediments undergo appreciable disturbance during dredging and disposal, and a remolded channel sediment sample, after appropriate aging, may be representative of the fully recovered erodibility of these sediments. If sediments are composited and remolded, an appropriate time must be allowed for recovery of shear strength, representative of field conditions in which sediments are dredged and placed. In some cases this may not be possible. For navigation channel sediments, which are disturbed by the effects of vessel passage, judgment must be exercised in simulating the laboratory sediment beds for conducting erosion experiments. The dredging and disposal processes tend not only to disturb sediments, but also to mix them with ambient water. Mechanical dredging methods disturb the bed sediments, while hydraulic and hopper dredge operations result in mixing and dilution of sediments with ambient water. Further disturbance of sediment bed and dilution of suspended sediment with ambient water may occur, depending upon the site conditions and the disposal methods. Short-term effects of dredging and/or disposal on the shear strength and erodibility of sediments were simulated in an ERDC laboratory by preparing a slurry of sediment and water in ratios of 1:2 to 1:4. The slurry was allowed to settle and consolidate before conducting erosion tests. Settling times were varied from a few hours to a few days. Samples were tested as early as 1 hr after preparing slurry, but rapid settling continued during the experiment, which caused difficulties in maintaining proper geometry between the PES disk and the sample bed. Self-weight consolidation with time leading to increased shear strength is an important property of cohesive sediments. Therefore, laboratory test beds are frequently prepared with several different settling times starting from 1 day. For experiments on sediments from approach channels to Baltimore Harbor (Johnson et al. 1999), slurries were allowed to settle for 1 to 8 days before testing. For slurried channel sediments from the Port of New York/New Jersey (Chou et al. 1998) and from the Gulf Intracoastal Waterway at Laguna Madre, TX (Teeter et al. 2002), consolidation continued up to 21 days. It is desirable to perform replicate erosion experiments to assess and compensate for variability in erosion results due to sediment variability and/or experimental procedures. Variability of 20 to 30 percent is typical for natural sediments,
ERDC TN-SWWRP-05-2 September 2005
8
although replicate tests on uniform model sediments have had a variability of less than 10 percent. Parchure (2003) complied results of erosion experiments conducted by using PES on sediments collected from several project sites in the United States. Examples of PES applications at ERDC to assess bed sediment erodibility include the Sudbury Project (Nail and Abraham 1998), Ashtabula Project (Teeter et al. 1999), and Upper Mississippi River (Copeland et al. 2001). Other agencies have used the device for similar applications, as reported by Davis (1993), Davis and Abdelrhman (1992), Davis and Means (1989), Lavelle and Davis (1987), MacIntire et al. (1990), Sfrisco et al. (1991), Ziegler et al. (1987), and Mehta et al. (1997). The most commonly used erosion rate equations used in numerical models are (Mehta and Parchure 2000):
b c
cE M
⎡ ⎤τ − τ= ⎢ ⎥τ⎣ ⎦
(1)
B
b c
cE A
⎡ ⎤τ − τ= ⎢ ⎥τ⎣ ⎦
(2)
where
E = erosion rate (g/cm2/sec) M = erosion rate constant (g/cm2/sec) bτ = bed shear stress (Pa) cτ = critical shear stress for erosion (Pa) A = empirical coefficient (g/cm2/sec) B = Empirical coefficient
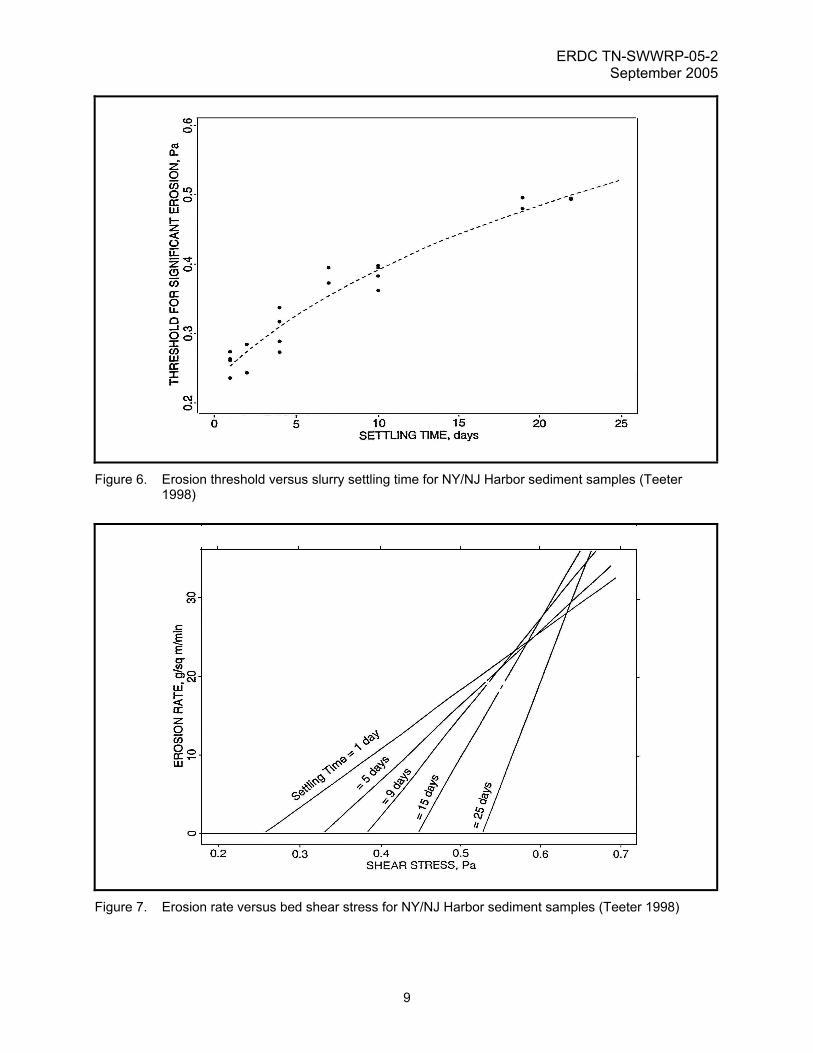
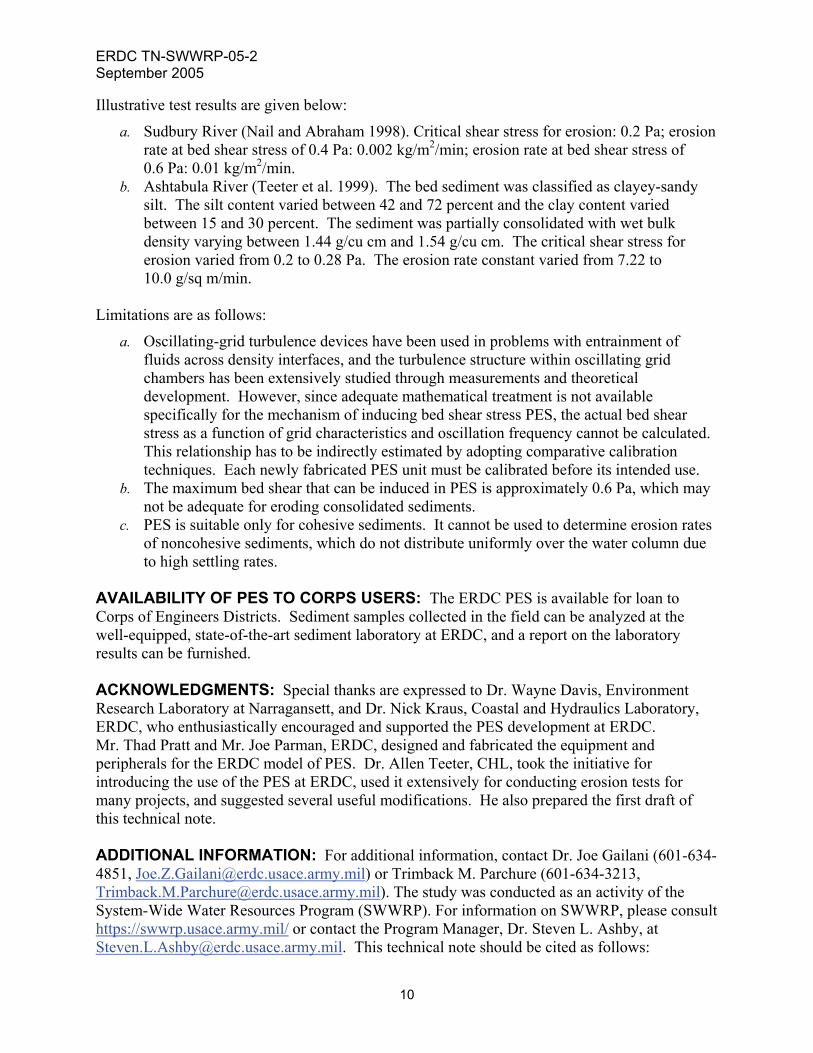
Flow-induced or wave-induced bed shear stress can be calculated for the given site conditions; however, at present, the magnitude of critical (threshold) shear stress for erosion and the values of empirical coefficients included in these equations can be determined only through laboratory tests conducted on field sediment samples. The effect of consolidation also needs to be determined in a laboratory. For determining the critical bed shear stress inside the PES cylinder, the oscillation frequency of the perforated disk is increased from zero in small increments. The sediment-fluid interface is observed throughout the frequency increase. The frequency at which erosion is observed to commence at the interface is converted to shear stress value from the PES calibration curve. This shear stress is the critical shear stress value for erosion for the type of bed simulated inside the PES cylinder. An illustration of results obtained with use of PES is given in Figures 6 and 7. Figure 6 shows erosion threshold versus settling time for field sediment samples collected from NY/NJ Harbor. Figure 7 shows erosion rate as a function of bed shear stress. The magnitudes of M in Equation 1 or the values of empirical coefficients can be determined from the two plots.
ERDC TN-SWWRP-05-2 September 2005
9
Figure 6. Erosion threshold versus slurry settling time for NY/NJ Harbor sediment samples (Teeter
1998)
Figure 7. Erosion rate versus bed shear stress for NY/NJ Harbor sediment samples (Teeter 1998)
ERDC TN-SWWRP-05-2 September 2005
10
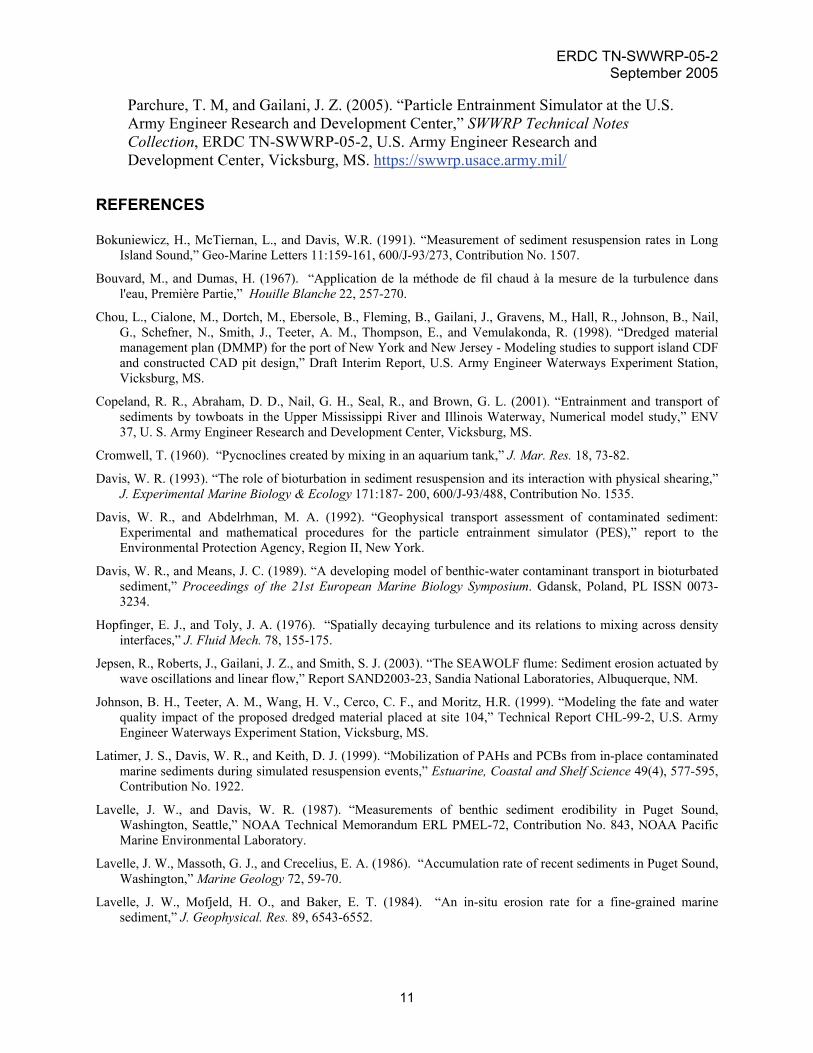
Illustrative test results are given below:
a. Sudbury River (Nail and Abraham 1998). Critical shear stress for erosion: 0.2 Pa; erosion rate at bed shear stress of 0.4 Pa: 0.002 kg/m2/min; erosion rate at bed shear stress of 0.6 Pa: 0.01 kg/m2/min.
b. Ashtabula River (Teeter et al. 1999). The bed sediment was classified as clayey-sandy silt. The silt content varied between 42 and 72 percent and the clay content varied between 15 and 30 percent. The sediment was partially consolidated with wet bulk density varying between 1.44 g/cu cm and 1.54 g/cu cm. The critical shear stress for erosion varied from 0.2 to 0.28 Pa. The erosion rate constant varied from 7.22 to 10.0 g/sq m/min.
Limitations are as follows:
a. Oscillating-grid turbulence devices have been used in problems with entrainment of fluids across density interfaces, and the turbulence structure within oscillating grid chambers has been extensively studied through measurements and theoretical development. However, since adequate mathematical treatment is not available specifically for the mechanism of inducing bed shear stress PES, the actual bed shear stress as a function of grid characteristics and oscillation frequency cannot be calculated. This relationship has to be indirectly estimated by adopting comparative calibration techniques. Each newly fabricated PES unit must be calibrated before its intended use.
b. The maximum bed shear that can be induced in PES is approximately 0.6 Pa, which may not be adequate for eroding consolidated sediments.
c. PES is suitable only for cohesive sediments. It cannot be used to determine erosion rates of noncohesive sediments, which do not distribute uniformly over the water column due to high settling rates.
AVAILABILITY OF PES TO CORPS USERS: The ERDC PES is available for loan to Corps of Engineers Districts. Sediment samples collected in the field can be analyzed at the well-equipped, state-of-the-art sediment laboratory at ERDC, and a report on the laboratory results can be furnished. ACKNOWLEDGMENTS: Special thanks are expressed to Dr. Wayne Davis, Environment Research Laboratory at Narragansett, and Dr. Nick Kraus, Coastal and Hydraulics Laboratory, ERDC, who enthusiastically encouraged and supported the PES development at ERDC. Mr. Thad Pratt and Mr. Joe Parman, ERDC, designed and fabricated the equipment and peripherals for the ERDC model of PES. Dr. Allen Teeter, CHL, took the initiative for introducing the use of the PES at ERDC, used it extensively for conducting erosion tests for many projects, and suggested several useful modifications. He also prepared the first draft of this technical note. ADDITIONAL INFORMATION: For additional information, contact Dr. Joe Gailani (601-634-4851, [email protected]) or Trimback M. Parchure (601-634-3213, [email protected]). The study was conducted as an activity of the System-Wide Water Resources Program (SWWRP). For information on SWWRP, please consult https://swwrp.usace.army.mil/ or contact the Program Manager, Dr. Steven L. Ashby, at [email protected]. This technical note should be cited as follows:
ERDC TN-SWWRP-05-2 September 2005
11
Parchure, T. M, and Gailani, J. Z. (2005). “Particle Entrainment Simulator at the U.S. Army Engineer Research and Development Center,” SWWRP Technical Notes Collection, ERDC TN-SWWRP-05-2, U.S. Army Engineer Research and Development Center, Vicksburg, MS. https://swwrp.usace.army.mil/
REFERENCES Bokuniewicz, H., McTiernan, L., and Davis, W.R. (1991). “Measurement of sediment resuspension rates in Long
Island Sound,” Geo-Marine Letters 11:159-161, 600/J-93/273, Contribution No. 1507.
Bouvard, M., and Dumas, H. (1967). “Application de la méthode de fil chaud à la mesure de la turbulence dans l'eau, Première Partie,” Houille Blanche 22, 257-270.
Chou, L., Cialone, M., Dortch, M., Ebersole, B., Fleming, B., Gailani, J., Gravens, M., Hall, R., Johnson, B., Nail, G., Schefner, N., Smith, J., Teeter, A. M., Thompson, E., and Vemulakonda, R. (1998). “Dredged material management plan (DMMP) for the port of New York and New Jersey - Modeling studies to support island CDF and constructed CAD pit design,” Draft Interim Report, U.S. Army Engineer Waterways Experiment Station, Vicksburg, MS.
Copeland, R. R., Abraham, D. D., Nail, G. H., Seal, R., and Brown, G. L. (2001). “Entrainment and transport of sediments by towboats in the Upper Mississippi River and Illinois Waterway, Numerical model study,” ENV 37, U. S. Army Engineer Research and Development Center, Vicksburg, MS.
Cromwell, T. (1960). “Pycnoclines created by mixing in an aquarium tank,” J. Mar. Res. 18, 73-82.
Davis, W. R. (1993). “The role of bioturbation in sediment resuspension and its interaction with physical shearing,” J. Experimental Marine Biology & Ecology 171:187- 200, 600/J-93/488, Contribution No. 1535.
Davis, W. R., and Abdelrhman, M. A. (1992). “Geophysical transport assessment of contaminated sediment: Experimental and mathematical procedures for the particle entrainment simulator (PES),” report to the Environmental Protection Agency, Region II, New York.
Davis, W. R., and Means, J. C. (1989). “A developing model of benthic-water contaminant transport in bioturbated sediment,” Proceedings of the 21st European Marine Biology Symposium. Gdansk, Poland, PL ISSN 0073-3234.
Hopfinger, E. J., and Toly, J. A. (1976). “Spatially decaying turbulence and its relations to mixing across density interfaces,” J. Fluid Mech. 78, 155-175.
Jepsen, R., Roberts, J., Gailani, J. Z., and Smith, S. J. (2003). “The SEAWOLF flume: Sediment erosion actuated by wave oscillations and linear flow,” Report SAND2003-23, Sandia National Laboratories, Albuquerque, NM.
Johnson, B. H., Teeter, A. M., Wang, H. V., Cerco, C. F., and Moritz, H.R. (1999). “Modeling the fate and water quality impact of the proposed dredged material placed at site 104,” Technical Report CHL-99-2, U.S. Army Engineer Waterways Experiment Station, Vicksburg, MS.
Latimer, J. S., Davis, W. R., and Keith, D. J. (1999). “Mobilization of PAHs and PCBs from in-place contaminated marine sediments during simulated resuspension events,” Estuarine, Coastal and Shelf Science 49(4), 577-595, Contribution No. 1922.
Lavelle, J. W., and Davis, W. R. (1987). “Measurements of benthic sediment erodibility in Puget Sound, Washington, Seattle,” NOAA Technical Memorandum ERL PMEL-72, Contribution No. 843, NOAA Pacific Marine Environmental Laboratory.
Lavelle, J. W., Massoth, G. J., and Crecelius, E. A. (1986). “Accumulation rate of recent sediments in Puget Sound, Washington,” Marine Geology 72, 59-70.
Lavelle, J. W., Mofjeld, H. O., and Baker, E. T. (1984). “An in-situ erosion rate for a fine-grained marine sediment,” J. Geophysical. Res. 89, 6543-6552.
ERDC TN-SWWRP-05-2 September 2005
12
Lee, S.-C., and Mehta, A. J. (1994). “Cohesive sediment erosion,” Contract Report DRP-94-6, U.S. Army Engineer Waterways Experiment Station, Vicksburg, MS.
Long, R. R. (1978). “Theory of turbulence in a homogeneous fluid induced by an oscillating grid,” Phys. Fluids 21, 1887-1888.
MacIntyre, S., Lick, W., and Tsai, C. H. (1990). “Variability of entrainment of cohesive sediment in freshwater,” Biogeochemistry 9, 187-209.
McDougall, T. J. (1979). “Measurements of turbulence in a zero-mean-shear mixed layer,” J. Fluid Mech. 94, 409-431.
McNeil, J., Taylor, C., and Lick, W. (1996). “Measurements of erosion of undisturbed bottom sediments with depth,” Journal of Hydraulic Engineering 122(6), 316-324.
Mehta, A. J. (1992). “Summary of the ad hoc technical panel at the Nearshore and Estuarine Cohesive Sediment Transport Workshop,” Cohesive Sediments Research Newsletter, Vol 2, No. 1.
. (2002). “Studies on erosion and settling of organic-rich sediment from Newnans Lake and other water bodies in Florida,” Report UFL/COEL-2002/014, Coastal and Oceanographic Engineering Department, University of Florida, Gainesville, FL.
Mehta, A. J., and Parchure, T. M. (2000). “Surface erosion of fine-grained sediment revisited.” Muddy coast dynamics and resource management. B. W. Fleming, M. T. Delafontain, and G. Liebezeit, ed., Elsevier Science B. V., 55-73.
Mehta, A. J., Kirby, R., Stuck, J. D., Jiang, J., and Parchure, T. M. (1997) “Erodibility of organic-rich sediments: A Florida perspective,” Report UFL/COEL/MP-97/01, Coastal and Oceanographic Engineering Department, University of Florida, Gainesville, FL.
Murray, S. P. (1969). “Simulation of horizontal turbulent diffusion of particles under waves.” Proceedings 11th Conference on Coastal Engineering. ASCE, New York, 446-466.
Nail, G. H., and Abraham, D.D. (1998). “Potential transport of mercury contaminated sediments in reservoirs of the Sudbury River,” U.S. Army Engineer Waterways Experiment Station, Vicksburg, MS.
Orlins, J. J. (1996). “Construction and calibration of a sediment resuspension and chemical flux chamber driven by an oscillating grid,” Plan B Project Report submitted to the faculty of the Graduate School of the University of Minnesota in partial fulfillment of the requirements for the degree of Master of Science, Minneapolis, MN.
Parchure, T. M. (2003). “Summary of laboratory experiments on sediment deposition and erosion,” Technical Report (in preparation), U.S. Army Engineer Research and Development Center, Vicksburg, MS.
Parchure, T. M., Sobecki, T. M., and Pratt, T. C. (2003). “Fine sediment parameter measurement for sedimentation studies,” submitted at the Sediment Monitoring Instrument and Analysis Research Workshop sponsored by the Federal Interagency Subcommittee on Sedimentation, held at Flagstaff, Arizona, September 9-11, 2003. Organized by the U.S. Geological Survey Flagstaff Science Center.
Rodriguez, H. N., Jiang, J., and Mehta, A. J. (1997). “Determination of selected sedimentary properties and erodibility of bottom sediments from the lower Kissimmee River and Taylor Creek-Nubbin Slough basins, Florida,” Report UFL/COEL-97/09, Coastal and Oceanographic Engineering Department, University of Florida, Gainesville, FL.
Rouse, H. (1938). “Experiments of the mechanics of sediment suspension.” Proceedings, Fifth Congress for Applied Mechanics. 55, J. Wiley, New York, 550-554.
Rouse, H., and Dodu, J. (1955). “Diffusion turbulente à travers une discontinuite de densité,” Houille Blanche 10, 522-529.
Sfrisco, A., Donáoslo, R., Calvo, C., and Orio, A. A. (1991). “Field resuspension of sediments in the Venice Lagoon,” Environmental Technology Letters 12, 371-379.
Teeter, A. M. (1990). “Fine sediment erodibility characterization,” Dredging Research Technical Notes DRP-1-03, U.S. Army Engineer Waterways Experiment Station, Vicksburg, MS.
ERDC TN-SWWRP-05-2 September 2005
13
Teeter, A. M. (1998). “Experimental erosion results for NY/NJ Harbor DMMP,” Memorandum CEWES-CE-TS dated 14 January 1998 sent to Bruce Ebersole of U.S. Army Engineer Waterways Experiment Station, Vicksburg, MS.
Teeter, A. M., Brister, D., Parman, J. W., and Coleman, C. J. (1999). “Ashtabula River, Ohio, sedimentation study: Report 3, Erosion experiments on bed sediments,” Technical Report CHL-99-9, U.S. Army Engineer Research and Development Center, Vicksburg, MS.
Teeter, A. M., Brown, G., Alexander, M., Callegan, C. J., and Sarruff, M.S. (2002). “Wind-wave resuspension and circulation of sediment and dredged material in Laguna Madre, Texas,” Technical Report in preparation, U.S. Army Engineer Research and Development Center, Vicksburg, MS.
Thompson, S. M., and Turner, J. S. (1975). “Mixing across an interface due to turbulence generated by an oscillating grid,” J. Fluid Mech. 67, 349-368.
Tsai, C. H., and Lick, W. (1985). “A portable device for measuring sediment suspension,” Dept. of Mechanical and Environmental Engineering, University of California, Santa Barbara, CA.
. (1986). “A portable device for measuring sediment suspension,” J. Great Lakes Res. 12(4), 314-321.
Turner, J. S., and Kraus, E. B. (1967). “A one-dimensional model of the seasonal thermocline. I. A laboratory model and its interpretation,” Tellus 19, 88-97.
Xuequan, E., and Hopfinger, E. J. (1986). “On mixing across an interface in stably stratified fluid,” J. Fluid Mech. 66, 227-244.
Ziegler, C. K., Tsai, C. H., and Lick, W. (1987). “The resuspension, deposition, and transport of sediments in the Venice Lagoon,” UCSB Report ME-87-3, University of California, Santa Barbara, CA.
NOTE: The contents of this technical note are not to be used for advertising, publication, or promotional purposes. Citation of trade names does not constitute an official endorsement or approval of the use of such products.