particle size distribution of quartz and other respirable dust
TRANSCRIPT

•
PLEASE DO NOT REMOVE FROM LIBRARY
RI9053 Bureau of Mines Report of Investigations/1986
Particle Size Distribution of Quartz and Other Respirable Dust Particles
Particle Size Distribution of Quartz and Other Respirable Dust Particles Mines, and Processing Plants
By Charles W. Huggins and Gail T. Meyers
UNITED STATES DEPARTMENT OF THE INTERIOR

Report of Investigations 9053
Particle Size Distribution of Quartz and Other Respirable Dust Particles Collected at Metal Mines, Nonmetal Mines, and Processing Plants
By Charles W. Huggins and Gail T. Meyers
UNITED STATES DEPARTMENT OF THE INTERIOR Donald Paul Hodel, Secretary
BUREAU OF MINES Robert C. Horton, Director

Library of Congress Cataloging in Publication Data:
Huggins, Charles W. Particle size distribution of quartz and other respirable dust particles
collected at metal mines, nonmetal mines, and processing plants.
(Report of investigations / United States Department of the Interior, Bureau of Mines; 9053)
Bibliography: p. 8.
Supt. of Docs. no.: I 28.23:9053.
1. Mine dusts. 2. Quartz- United States. 3. Mines and mineral resources- United States. 4. Smelting. 1. Meyers, Gail T. II. Title. III. Series: Report of investigations (United States. Bureau of Mines) ; 9053.
TN23.U43 [TN312] 622 s [622'.42] 86-600248

CONTENTS
Abstract •••..•••....•••...•••••••••.....•••...•••••..•••••••..•••...•••..••••.. Introduction •••••••••••••••••••••• • ••••••••••••••••••••••••••••• 6 ..... 1# •••••••
Acknowledgmen t s ................................................................ . Sample preparation •• It •••••••••••••••••••••••••••••••••••••••••••••••.•••••••••••
Image analysis •..•••••••...•••.•.••••.•••••••.•.••••.••••••••.•...•..•..•••..•• Results •..•..•.••••..••.•..••.•••.••••.•.••.....•••••.••.•......•••••••••••.•.. Conclusion .•..•••.•.••..••••....••••.•••••••••.••••••••.•.•••••••....•••••.• -••. References •••••.•.••.•••.....••••••.•.•.•••.•..••••..•..••••••••••.••••••.•••••
1.
2.
TABLES
Quartz particle size distributions and mean quartz size for respirable dust samples collected from metal and nonmetal mines and processing plants •••••
Mean length and width and total number of nonquartz particles •••••••••••
1 2 3 3 3 4 7 8
5 7

UNIT OF MEASURE ABBREVIATIONS USED IN THIS REPORT
cm centimeter ).IA microampere
h hour ).1m micrometer
kHz kilohertz ).1m 2 square micrometer
kV kilovolt B second
mg/m3 milligram per cubic meter wt % weight percent
min minute

PARTICLE SIZE DISTRIBUTION OF QUARTZ AND OTHER RESPIRABLE DUST PARTICLES COLLECTED AT METAL MINES, NONMETAL MINES, AND PROCESSING PLANTS
By Charles W. Hugginsl and Gail T. Meyers2
ABSTRACT
The primary objective of this Bureau of Mines research was to measure the size distribution of respirable quartz collected at metal mines, nonmetal mines, and processing plants to select the best reference standard for use in quantifying quartz in mine and plant dust samples. The secondary objective was to size all the nonquartz particles collected at the same sites. Particle size measurements were made on 29 samples using a scanning electron microscope in the backscatter mode of operation, interfaced with an image analysis system. The Mine Safety and Health Administration, Denver, CO, provided the 29 samples, which were collected at mines and processing plants in 19 states. The accumulated particle size measurements indicate that NBS 1878, minus 5-f.lm Hin-U-Sil, and minus 5-f.lm Supersil would be preferred over Silver Bond B as reference standards for most quantitative determinations by X-ray diffraction and infrared spectrometry. The respirable dust samples collected at sand plants, however, would be better served by a new reference standard having a quartz particle size distribution of approximately 2.2 um, as none of the four existing reference standards matched closely with them. Commercially available NBS 1878 and minus 5-um Hin-U-Sil CQuid be used as reference standards for 28 of the 29 samples studied in this investigat ion.
Research chemist. 2physical science technician. Avondale Research Center, Bureau of Mines, Avondale, MD.

2
INTRODUCTION
Long-term exposure to excessive respirable dust levels in mines causes silicosis. According to Daniel (1)3 the cost of compensation to miners 1s- about $1.7 billion annually. The Federal Coal Mine Health and Safety Act of 1969 and the Federal Mine Safety and Health Amendments Act of 1977 established a maximum allowable respirable dust level of 2.0 mg/m3 total dust for each 8-h shift. When the respirable dust contains more than 5% quartz, the respirable dust standard is adjusted to a lower amount «2mg/m3 ) dependent on the concentration of quartz present. One mission of the Bureau of Mines is to conduct research on control and measurement of mine dust. Medical responsibility is a function of the National Institute for Occupational Safety and Health, and since 1978 the Mine Safety and Health Administration (MSHA) has been responsible for enforcing safety regulations in the mines.
Dust conditions in mines and processing plants have improved owing to new methods of dust control but still need to be monitored. Approximately 7,000 respirable dust samples are collected by inspectors annually at metal mines, nonmetal mines, and processing plants. The quartz content in these samples is determined by either infrared spectrometry or X-ray diffraction. Both methods require quartz reference standards for quantitative measurements of the quartz. The response of both methods is a function of the particle size (l-3, l, ~). Joint studies by the Bureau and MSHA have shown that inaccuracy in quantitative values may be as much as 30% when the particle size distribution of the quartz standard varies significantly from that of the mine or processing plant dusts (4). It is essential that the particle- size distribution of both the respirable quartz standard and the mine and processing
3Underlined numbers in parentheses refer to items in the list of references at the end of the report.
plant dusts to select the ence standard determination.
be established in order appropriate quartz referto provide an accurate
The object of this research was to determine the particle size distributions of respirable dust samples collected at metal mines, nonmetal mines, and processing plants, and to compare them with the size distribution data published on the four reference standards that have been previously used for quantitative determinations (4). From these data, a better match of -standard to mine or processing plant dust should be achieved. Twentynine respirable dust samples collected at metal mines, nonmetal mines, and processing plants in 19 States were provided by MSHA, Denver, CO, for this investigation. The quartz reference standards used for this research were minus 5-Vm Supersil, minus 5-Vm Min-U-Sil, Silver Bond B, and NBS 1878.
Supersil is supplied by the Pennsylvania Glass and Sand Co., Berkeley Springs, WV, as minus 325-mesh material. It was wet-sieved at MSHA, Pittsburgh, PA, to obtain a minus 5-Vm material. Minus 5-Vm Min-U-Sil, also from Pennsylvania Glass and Sand Co., was used as received. Because minus 5-Vm Min-U-Sil is commercially available, and similar to the quartz found in most respirable dust samples, many laboratories use it as their reference standard. The Silver Bond B, obtained from Tammsco Inc., Tamms, IL, was prepared by sedimentation at MSI~, Denver, CO, to contain only particles smaller than 10 jim.
NBS 1878 has been available since late 1983. To prepare this standard, NBS has taken minus 5-Vm Min-U-Sil and slightly improved the purity of the quartz. During purification, some of the very fine quartz particles may have been lost. The crystalline purity reported by NBS is 95.5±1 wt % crystalline alpha quartz. The mass mean spherical diameter is 1.62 l1m•

3
ACKNOWLEDGMENTS
The authors are indebted to Suzanne N. Johnson, chemist, Avondale Research Center, for experimental work done in support of this publication, and to Glen W.
Sutton and Kathleen A. Denver Technical Support Denver, CO, for supplying dust samples.
Hazen of the Center, MSHA, the respirable
SAMPLE PREPARATION
The respirable dust samples were received from MSHA on 0.45-~m silver membrane filters after MSHA had quantitatively determined their quartz content by X-ray diffraction. These samples, taken directly from mine sites and processing plants for regulatory purposes, had previously been treated with tetrahydrofuran to dissolve the collection filters and redeposited by MSHA onto silver membrane filters according to the procedure described by Thatcher (7) for quantitative quartz determinations by X-ray diffraction. Quartz and other respirable
dust particles were then removed from the silver membrane filters by ultrasonication at 80 kHz for 10 min in isopropyl alcohol, and the suspended particles were deposited onto 0.2-~m Nuclepore 4 filters. Preparation for image analysis continued under the procedure described by Snyder (~). Two rectangular pieces, approximately 1 by 1.5 cm, were cut from each Nuclepore filter and mounted with carbon paint on scanning electron microscope (SEM) stubs. Two samples were carbon-coated in a vacuum evaporator prior to measurement.
IMAGE ANALYSIS
Size distributions were determined using an Amray model 1400 SEM equipped with a LeMont Scientific model DB-I0 image analysis system and a Kevex model 8000 energy-dispersive X-ray analysis system (EDS). The SEM was operated at 20 kV and 50 ~A. A magnification calibration was performed each time before the particles were sized at a magnifiction of 2,000 using a Ladd Research Institute 15,240-line-per-inch carbon grating and the magnification calibration program provided by LeMont Scientific. The calibration was done in both horizontal and vertical directions. The SEM was operated in the backs'catter electron mode to provide the best contrast between particles and filter substrate and consequently enhanced gray level differences in the video signal of the image analyzer. The contrast "threshold" level in the image analyzer was set just above background to ensure measurement of all particles. The off-point density was set at 256 to ensure location of all particles 0.20 ~m or larger on the 10-cm cathode ray
tube screen. The on-point density, used for particle measurement, was set at 1,024, thus achieving a particle measurement precision of plus or minus one "on point" spacing of 0.044 ~m. All particles in the 45-~m2 field of view were measured. Once a particle is detected in the binary image of the image analyzer, it is sized by deflection of the electron beam in a series of horizontal, vertical, and diagonal movements. The microscope stage was moved from left to right and then right to left each time over a different field of view until at least 400 quartz particles were sized on the rectangular filter piece mounted on the SEM stub.
Following each particle sizing, an X-ray spectrum was acquired at the geometric center of the particle until a preset integral of 750 net X-ray counts was reached or maximum X-ray acquisition
4Reference to specific products does not imply endorsement by the Bureau of Mines.

4
time of 5 s was met. Window~ fur the detection of elements commonly present in the mine and processing plants were set in the EDS multichannel analyzer. Al, Ag, Ca, Cl, Fe, K, Mg, Na, S, Si, and Ti were monitored. A minimum of 30 X-ray counts was required for an element to be considered present. A chemistry definition file categorized the particles into three classes, and the information was
stored on a diskette. 1f80% or more of the total X-ray count was due to silicon, the particle was classified as quartz. If 30% or more of the X-ray count was due to silver and 5% or more to chlorine, the particle was classified as silver chloride. All other particles were classified as miscellaneous. Approximately 400 quartz particles were measured in each sample.
RESULTS
A large number of silver chloride particles were present in many of the samples. Communictions with MSHA personnel in Denver indicate they have been aware of the existence of the particles; but since they do not interfere with quartz determinations by X-ray diffraction, they have been largely ignored. They apparently occur in the manufacturer of silver membrane filters. In redeposition of the respirable dust particles onto Nuclepore filters, most of the silver chloride particles were removed from the silver membrane filters. Redeposition ranged from 4 AgCl particles in sample 1 to 767 in sample 13. The average size of all the silver chloride particles was 0.66 ~m.
Table 1 shows the results of particle measurements on dust samples collected by MSHA at mine and plant sites. The particle size distribution in the table is a function of the particle frequency percentage based upon the particle lengths in each sample. The particle lengths were taken as the maximum particle diameter in micrometers. Particles smaller than 0.3 ~m were not measured because most of them were lost in the MSHA sample preparation onto silver membrance filters, which have a pore size of 0.45 ~m.
Six samples shown in table 1 (4, 9, 12, 15, 17, and 22) were collected at sand plants. Of the six samples, all except sample 4 have particle mean length distributions greater than 2.0 ~m, and sample 17 has a particle mean length distribution greater than 3.0 ~m. Eight samples (5, 10, 11, 14, 16, 18, 21, and 29) were collected at crushed stone plants. The particle mean length distribution measurements ranged from 1.16 ~m
for sample 21 to 1.80)Jm for sample 5. Four samples (2, 23, 24, and 25) were collected at gold mines or gold processing plants; particle mean length distribution ranges from 1.35 )Jm for sample 23 to 1.61)Jm for sample 24. Two samples were collected at sand and gravel plants. Sample 3 had a particle mean length of 1.59 ~m, and sample 26 had a particle mean length of 1.74 llm. Two samples collected at sandstone plants (6 and 7) had particle mean length distributions of 1.45 and 1.41 ~m respectively. The seven remaining samples in table 1 (1, 8, 13, 19, 20, 27, and 28) were collected at a silica quarry, a granite pit, a limestone plant, a clay plant, a copper and silver processing plant, a taconite plant, and a uranium mine respectively_ The particle mean length distributions ranged from 1.17 ~m for sample 1 to 2.02 ~m for sample 13. Sample 13 was from a limestone plant, and the 2.02-~m value was rather surprising as the only other samples in table 1 that exceeded 1.80 ~m were from sand plants.
Comparison of the particle size distribution measurement of the samples in table 1 to the respirable dust standards (minus 5-~m Min-U-Sil, minus 5-~m Supersil, NBS 1878, and Silver Bond B), reported by Huggins (4) as having particle mean length distributions of 1.26 llm, 1.10 llm, 1.65 ~m, and 4.54 vm, respectively, shows that only sample 17 would approach the size distribution of Silver Bond B. Based on these quartz particle size distribution comparisons, the minus 5-vm Min-U-Sil, minus 5-~m Supersil, and NBS 1878 would more closely match 28 of the 29 samples shown in table 1. It is

TABLE 1. - Quartz particle size distributions and mean quartz size for respirable dust samples collected from metal and nonmetal mines and processing plants
Sample No .. ct
2 4 51 8 10 16 ! 173 Quartz length, ~m= 0.0- 0.3 ••••.•••• lID lID ND. ND ND 0.3- 0.6 ••••••••• 4.69 2.66
1. 721
1•94 2.18 0.6- 0.9 ••••••••• 23.97 19.26 16.18 13.55 16.95 20.15 0.9- 1.2 ......... 25.67 14.57 19.57 18.97114.04 21.12 1.2- 1.5 ......... 13.32 12.84 15.46 12.81113.80 12.86
1.5- 1.8 ......... 8.96 8.64 10.14 10.10 9.67 11.37 8.03 9.78 9.40 9.54 7.89 12.38 1.8- 2.1. ........ 6.05 7.16 6.28 10.8418.47 8.49 6.50 9.73 8.30 6.71 6.85 6.46 7.04 2.1- 2.4 ......... 4.12 7.16 5.80 6.16 6.30 5.90 9.05 7.30 4.98 6.71 8.56\ 7.42 6.07 2.4- 2.7 ......... 2.91 5.43 4.35 3.94 4.60 4.48 4.18 9.25 4.24 5.15 8.80 4.55 5.34 2.7- 3.0 ••••••••• 1.45 4.44 4.11 5.4215.57 3.30 4.18 4.62 2.95 4.92 5.38 4.78 2.43
3.0- 3.3 •...••••• 1.69 3.46 3.38 2.22
1
4.84 2.15 2.36 3.25 6.81 1.48 4.03 4.89 3.11 2.23 2.37 .97 -' ~ .... , I 2.93 3.11 4 .. S7 3.3- 3.6 ••••••••• 2.18 2.47i 2.71 3.39 1.67 2.12 2.55 2.68 2.21 .89 2.69 2.87 1.24 3.35 2.18 2.89 1.71 2.87 1.46 3.6- 3.9 ••••••.•• 1.451 1.23 1.45 3.45 1.21 1.43 1.18 1.86 4.62 1.11 2.68 2.44 1.67 1.24 2.17 1.70 3.61 2.20 1.91 2.19 3.9- 4.2 ••••••••• .481 2.72 1.69 .49 i 1.45 .95 1.18 0 1.22 .74 1.79 1.71 1.91 .50 2.17 1.46 3.13 .49 1.20 .73 4.2- 4.5 ......... .73 .74 1.21 1.48 1.19 .71 1.39 3.65 .37 1.57 .98 .96 1.24 1.38 .73 2.41 .98 .96 .73 ,
4.5- 4.8 ••••••••• .24 1.48 .48 1.72 .48 1.91 .71 .46 1.22 .37 2.01 .73 1.20 .25 1.78 .24 .73 .72 .49 4.8- 5.1 ••••••••• .48 .99 .48 .74 .97 0 .71 .93 .97 .74 .45 .98 .24 .25 2.56 .73 .24 .24 a 5.1- 5.4 ••••••••• .24 0 1.45 .74 .97 .48 .94 .23 .97 .37 .67 1.20 .99 .79 .49 .24 .24 0 5.4- 5.7 ••••••••• .24 .74 .72 .99 .73 .72 .24 0 1.22 0 1.12 .49 .72 .50 .99 .49 0 .24 0 5.7- 6.0 ......... 0 0 .97 .49 .48 .72 .24 .23 0 .74 .67 .24 .96 .25 1.18 .49 .24 .24 0 6.0- 6.3 ......... 0 .74 . 0 .49 .24 .72 a .23 0 .55 0 .49 .96 .25 1.18 .24 .23 .49 .48 .24 6.3- 6.6 ......... 0 0 .48 .25 .24 0 .24 0 .24 .18 0 .98 .24 .50 .39 0 0 0 0 0 6.6- 6.9 ••••••••• 0 .25 0 0 0 0 0 0 .97 .18 1.12 .24 .721 0 .39 .24 0 .49 0 .49 6.9- 7.2 •••••••• : 0 .25 .72 0 .24 .24 0 0 0 0 .22 0 .72 a .39 0 .46 .24 0 0 7.2- 7.5 ......... 0 .49 0 0 .24 0 .24 .23 .24 0 0 .98 .48 0 .39 0 .23 0 0 0 a 7.5- 7.8 ••••••••• 0 0 0 0 0 .48 .24 .23 .24 .18 0 .49 .72 0 .39 0 .49 0 .49 0 0 0 0 7.8- 8.1 ......... 0 ! 0 0 0 .48 0 0 0 .24 .18 0 0 .48 .25 .79 0 .24 0 0 0 0 0 0 8.1- 8.4 ••••.•••• 0 0 0 0 0 0 0 0 a 0 0 .24 .48 0 .39 0 0 0 0 0 0 0 0 8.4- 8.7 ••••••••• 0 0 .24 .25 0 .24 0 0 0 0 .22 .24 .48 0 .59 0 .24 0 0 0 0 0 0 8.7- 9.0 ••••••••• 0 0 0 .25 0 0 0 0 0 0 .22 .49 .24 0 .20 0 0 0 .25 0 0 0 0 9.0- 9.3 ......... 0 0 0 0 0 .24 0 0 .24 0 0 0 0 0 .20 0 0 0 0 0 a 0 0 9.3- 9.6 •••..•.•• 0 0 0 0 a 0 0 0 0 .18 0 0 0 0 .20 0 0 0 .25 0 0 0 0 9.6- 9.9 ••••••••• 0 0 0 0 0 0 0 0 0 0 0 .49 .24 0 0 .24 0 0 0 0 0 0 0 0 9.9-10.2 •••••••.• 0 0 0 0 0 0 0 0 0 0 0 0 0 0 0 0 0 0 0 0 0 0 0 0 0 0 Q 0 0 0 0 0 0 0 .48 0 .20 0 .24 0 0 0 0 0 0 0 [1
IJl
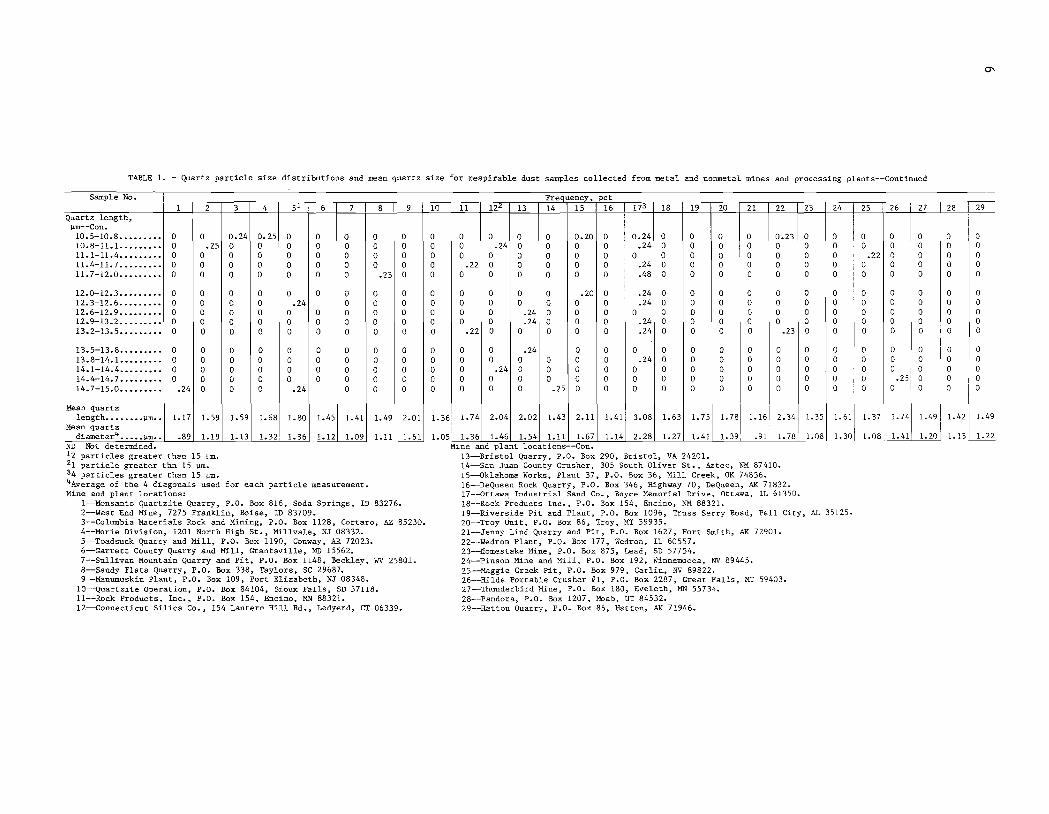
TABLE 1.. - Quartz particle size distributions and mean quartz size for respirable dust samples collected from metal and nonmetal mines and processing plants--Continued
Sample No.
1 2 3 4 51 6 7 8 9 Quartz length,
um--Con. 10.5-10.8 ••••••••• 0 0 0.24 0.25 0 0 0 0 0 10.8-11.1. •••••••• a .25 0 0 0 0 0 0 0 11.1-11.4 ••••••••• 0 0 0 0 0 0 0 0 0 11.4-11.7 ••••••••• 0 0 0 0 0 0 0 0 0 11.7-12.0 ••••••••• 0 0 0 0 0 0 0 .23 0
12.0-12.3 ••••••••• 0 0 0 0 0 0 0 0 0 12.3-12.6 ••••••••• 0 0 0 0 .24 0 0 0 12.6-12.9 ••••••••• 0 0 0 0 0 0 0 0 0 12.9-13.2 ••••••••• 0 0 0 0 0 0 0 0 0 l3.2-13.5 ••••••••• 0 0 0 0 0 0 0 0 0
13.5-13.8 ••••••••• 0 0 0 0 0 0 0 0 0 13.8-14.1. •••••••• 0 0 0 0 0 0 0 0 0 14.1-14.4 ••••••••• 0 0 0 0 0 0 0 0 0 14.4-14.7 ••••••••• 0 0 0 0 0 0 0 0 0 14.7-15.0 ••••••••• .24 0 0 0 .24 0 0 0
Mean quartz length •••••••• ].Im •• 1.17 1.59 1.59 1.68 1.80 1.45 1.41 1.49 2.01
Mean quartz diameter4 ......... lJ.m ... .89 1.19 1.13 1.32 1.36 1.12 1.09 1.11~
ND Not determined .. 12 particles greater than 15 um. 21 particle greater thn 15 Urn. 34 particles greater than 15 um. 4Average of the 4 diagonals used for each particle measurement .. Mine and plant locations:
I--Monsanto Quartzite Quarry, P.O. Box 816, Soda Springs, ID 83276. 2--West End Mine, 7275 Franklin, Boise, ID 83709. 3--Columbia Materials Rock and Mining, P.O. Box 1128, Cortaro, A2 85230. 4--Morie Division, 1201 North High St., Millvale, NJ 08332. 5-Toadsuck Quarry and Mill, P.O. Box 1190, Conway, AR 72023. 6-Garrett County Quarry and Mill, Grantsville, MD 15562. 7--Sullivan Mountain Quarry and Pit, P.O. Box 1148, Beckley, WV 2580l. 8-Sandy Flats Quarry, P.O. Box 338, Taylors, SC 29687. 9-Manumuskin Plant, P.O. Box 109, Port Elizabeth, NJ 08348.
10--Quartzite Operation, P.O. Box 84104, Sioux Falls, SD 57118. 11--Rock Products, Inc., P.O. Box 154, Encino, MN 88321. 12-Connecticut Silica Co., 154 Lantern Hill Rd., Ledyerd, CT 06339.
10
0 0 0 0 0
0 0 0 0 0
0 0 0 0 0
1.36
1.05
Frequency, pet 11 122 l3 14 15 16 173 18 19 20 21 22
0 0 0 0 0.20 0 0.24 0 0 0 0 0.23 0 .24 0 0 0 0 .24 0 0 0 0 0 0 0 0 0 0 0 0 0 0 0 0 0
.22 0 0 0 0 0 .24 0 0 0 0 0 0 0 0 0 0 0 .48 0 0 0 0 0
0 0 0 0 .20 0 .24 0 0 0 0 0 0 0 0 0 0 0 .24 0 0 0 0 0 0 0 .24 0 0 0 0 0 0 0 0 0 0 0 .24 0 0 0 .24 0 0 0 0 0
.22 0 0 0 0 0 .24 0 0 0 0 .23
0 0 .24 0 0 0 0 0 0 0 0 0 0 0 0 0 0 .24 0 0 0 0 0 0 .24 0 0 0 0 0 0 0 0 0 0 0 0 0 0 0 0 0 0 0 0 0 0 0 0 0 .25 0 0 0 0 0 0 0 0
1.74 2.04 2.02 1.43 2.11 1.41 3.08 1.63 1.75 1.78 1.16 2.34
1.36 1.46 1.54 l.ll 1.67 1.14 2.28 1.27 1.41 1.39 .91 1.78 Mine and plant locations--Con.
13--Bristol Quarry, P.O. Box 290, Bristol, VA 24201. 14--San Juan County Crusher, 305 South Oliver St., Aztec, NM 87410. 15--0klahoma Works, Plant 37, P.O. Box 36, Mill Creek, OK 74856. 16-DeQueen Rock Quarry, P.O. Box 346, Highway 70, DeQueen, AK 71832. 17--0ttaw~ Industrial Sand Co., Boyce Memorial Drive, Ottawa, IL 61350. 18--Rock Products Inc., P.O. Box 154, Encino, NM 88321.
23 24
0 0 0 0 0 0 0 0 0 0
0 0 0 0 0 0 0 0 0 0
0 0 0 0 0 0 0 0 0 0
1.35 1. 61
1.08 1.30
19-Riverside Pit and Plant, P.O. Box 1096, Truss Serry Road, Pell City, AL 35125. 20--Troy Unit, P.O. Box 86, Troy, MT 59935. 21--Jenny Lind Quarry and Pit, P.O. Box 1627, Fort Smith, AK 72901. 22--Wedron Plant, P.O. Box 177, Wedron, IL 60557. 23--Homestake Mine, P.O. Box 875, Lead, SD 57754. 24--Pinson Mine and Mill, P.O. Box 192, Winnemucca, NV 89445. 25--Maggie Creek Pit, P.O. Box 979, Carlin, NV 89822. 26--Hilde Portable Crusher III, P.O. Box 2287, Great Falls, MT 59403. 27--Thunderbird Mine, P.O. Box 180, Eveleth, MN 55734. 28-Pandora, P.O. Box 1207, Moab, UT 84532. 29--Hatton Quarry, P.O. Box 86, Hatton, AK 71946.
25 26 27
0 0 0 0 0 0
.22 0 0 0 0 0 0 0 0
0 0 0 0 0 0 0 0 0 0 0 0 0 0 0
0 0 0 0 0 0
I g 0 0
.251
0 o 0
1.37 1.74 1.49
1.08 1.41 1.20
0'
28 29
0 0 0 0 0 0 0 0 0 0
0 0 0 0 0 0 0 0 0 0
0 0 0 0 0 0 0 0 0 0
1.42 1.49
1.15 1.22

7
TABLE 2. - Mean length and width and total number of nonquartz particles
Mean Mean Number of Sample length, width, particles
]lm ]lm 1 ••••• ., ...... 0.89 0.58 -----1 f6-'-2 ••••••••••• 1. 14 .68 730 3 ............ 1.01 .66 1,174 4 ••••••••••• 1.33 .83 580 S .............. 1.37 .87 294 6 ••••••••••• 1.16 .67 302 7 ••••••••••• 1.19 .78 232 8 ............ 1.23 .72 774 9 ••••••••••• 1.62 .95 475
10 ••••••••••• .88 .56 97 11 ••••••••• " • 1.44 .86 772 12 •••.••••.•• 1.66 .97 723 13 ••••••••••• 1.21 .79 1,452 14 ••••••••••• 1.29 .79 561 15 •.•..•••••• .86 .51 361
apparent that the Silver Bond B reference standard would not be the best choice for quantitative quartz determinations in metal mines, nonmetal mines, and processing plants.
Table 2 shows the mean length, mean width, and total number of particles other than quartz and silver chloride measured in the respirable dust samples. The nonquartz particles measured in the
Me Me -NumberaT Sample length, width, particles
Jlm !-lm 16 ............. - -r:iff--- --O-~-rl-- - _. - --4"iif---17 ............ 1. 28 .75 348 18. iii .......... 1. 37 .81 862 19 ........... ., .. 1.42 .88 526 20 ............ 1.36 .89 813 21 ••••••••••• 1. 11 .71 125 22 ............ 1. 80 1.09 1,047 23 .............. 1.22 .78 2,062 24 ••••••••• Do • 1.18 .73 1,258 25 ........ 41 "" •• 1.05 .59 62 26 ............ 1.63 1.05 947 2 7 ••••••••••• 1. 26 .80' 1, 114 28 ••••••• ,. .... 1.53 .99 797 29 ............ 1.12 .71 156
-------'------
silica sand samples tended to be somewhat smaller than the quartz particles in the same samples. Nonquartz particles ranged from 62 out of 512 in sample 25 from the Maggie Creek gold pit near Carlin, NV, to 2,062 out of 2,466 in sample 23 collected at the Homestake gold m:l.ne in Lead, SU. The number of nonquartz particles had no relationship to the mine or plant sites.
CONCLUSION
The ~uartz particle size distribution measurements on samples collected at metal mines, nonmetal mines, and processing plants indicates that the minus 5-~m Min-U-Sil, minus 5-~m Supersil, and NBS 1878 reference standards would be preferred over Silver Bond B for quantitative quartz determinations by X-ray diffraction or infrared spectrometry. The quartz particle size distribution of the Silver Bond B reference standard is too large. Commercially available NBS 1878 and minus 5-]lm Min-U-Sil would be preferred over minus 5-~m Supersil for quantitative quartz determinations in 28 of the 29 samples in this investigation because they require no sizing prepartion before usage. The respirable dust samples collected at sand plants tend to have quartz particle size distributions
larger than those collected at most of the other sites, and this indicates the need to prepare a new reference standard having a quartz particle mean length distribution sHghtly larger than 2.0 ]lm. The new reference standard could be made by wet sieving of the Silver Bond B reference standard to a mean length distribution of approximately 2.2 ]lm; this reference standard would be used exclusively for quartz measurements in samples collected at sand plants. The mean length distri bution of the nonquartz particles tends to be slightly smaller than that of the quartz part,icles in the same samples. This is especially true in the sand plant samples. The number of nonquartz cles had no relationship to the mine or plant sites.

8
REFERENCES
1. Daniel, J. H. Respirable Dust Control Research--The Bureau of Mines Program. Coal Mine Dust Conference Abstracts (Morgantown, WV, Oct. 8-10, 1984). WV Univ., 1984, pp.1-2.
2. Huggins, C. W. Roundrobin Investigation of Respirable Quartz Dust. Paper in Proceedings on the Symposium on Control of Respirable Coal Mine Dust (Beckley, WV, Oct. 4-6, 1983). MSHA, 1983, pp. 287-296.
3. Huggins, C. W., K. B. Shedd, J. G. Snyder, H. Lang, and T. F. Tomb. Interagency Comparison of Respirable Quartz Analysis. BuMines OFR 111-85, 1985, 67 pp.
4. Huggins, C. W., S. N. Johnson, J. M. Segreti, and J. G. Snyder. Determination of Alpha Quartz Particle Distribution in Respirable Coal Mine Dust
1< U,S. GOVERNMENT PRINTING OFFICE; 1986-605-017140,087
Samples and Reference Standaras. BuMines RI 8975, 1985, 7 pp.
5. Klug, H. P., and L. E. Alexander. X-ray Diffraction Procedure for Polycrystalline and Amorphous Wiley, 1954, 716 pp.
Materials.
6. Snyder, J. G., and C. W. Huggins. Analysis of Respirable Quartz Particles Collected on Coal Mine Air-Monitoring Filters. Paper in Microbeam Analysis Society Proceedings. San Francisco Press, 1983, pp. 22-26.
7. Thatcher, J. W. The Determination of Free Silica in Airborne Dust Collected on Membrane Filters. MESA 1021, 1975, 16 pp.
8. Tuddenham, M. Infrared Techniques and Measurements Chem., v. 32, 1960,
v., and R. P. Lyon. in the Identification of Minerals. Anal. pp. 1630-1634.
I NT .-BU.oF MINES .PGH .,PA • 28359