particle size particle shape fpia-3000s...flow particle image analysisof size and shape as your...
TRANSCRIPT

Flow particle image analysis of size and shape
Particle size
detailed specification sheets from www.malvern.co.uk
3000
Particle shape

Flow particle image analysis of size and shape
As your understanding of your product and the associated manufacturing process continuouslyprogresses you may increasingly recognize the need for a higher-sensitivity analysis tool. Imageanalysis is an enabling technology which is both sensitive to subtle variations in particle shapeand the presence of small numbers of very small particles. Samples which could not previouslybe differentiated can now be "fingerprinted" with the high-sensitivity Sysmex FPIA-3000.
2 Sysmex FPIA-3000
Advanced technology made simple
www.malvern.co.uk
The Sysmex FPIA-3000 Flow Particle Image Analyzer offers high resolution,
automated analysis of particle size and shape in a reliable, repeatable and routine
manner. Comprehensive particle characterization data is generated in a short time,
typically less than 3 minutes and with minimal sample preparation. Extensive
information about each individual particle is acquired from the sample and displays
of size and shape distributions are supported by images of the particles to provide
further visual verification of the measurement data.
3 Sysmex FPIA-3000 www.malvern.co.uk
What the FPIA-3000 delivers
Ease of use. Prepare your sample and press GO! It really is as simple as that.With no complex configuration or setup procedures the FPIA-3000 has beendesigned for a QC environment where simplicity and speed are paramount.
Particles are fully characterized using a number of morphologicalparameters such as circle equivalent diameter, circularity and convexity. For each of these parameters a statistical distribution is calculated andcombined in a scattergram. The scattergram is a unique fingerprint of thesample – high quality information that can be used to make more informeddecisions earlier and distinguish between materials that can appearidentical to a microscope or traditional particle sizer.
A statistically significant number of particles (up to 300,000) areautomatically analysed in a short space of time.
All particle images are saved for future reference. Each of these imagesretains its link to the distribution enabling visualization of the actual particlesat different areas of the distribution for the purposes of anomaly oragglomeration detection for example.
Two versions of the FPIA-3000 are available – the standard aqueousversion, designed for water and common alcohols and the solvent-compatible version which is designed to work with a range of moreaggressive solvents.
Largest area orientation. Random orientation significantly reduces thevalidity of data. Consistency of orientation is important for statisticallysignificant size and shape measurement. The patented Sheath FlowMechanism ensures that all particles are in focus and consistentlyorientated with their largest area facing the camera.
Provides technical compliance with the requirements of 21 CFR part 11.
Malvern Instruments is committed to providing global service and supportstructures, a high degree of applications knowledge and customer service.
You asked for We give you
A simple, robust solution
Sensitivity to shape
Statistical significance
Images I can see
Compatibility with all the dispersants I use
Controlled orientation
Regulatory compliance
A product and company with a secure future
Advanced technology made simple

4 Sysmex FPIA-3000 www.malvern.co.uk
A sample is taken from a dilute suspension of particles. This suspension is then passed through ameasurement cell where images of the particles are captured using stroboscopic illumination anda CCD camera.
The system incorporates a patented high-speed image processor. Through a series ofsophisticated digital imaging stages each particle is extracted and quantified.
Successful image analysis every timeFlat particle flow ensures that all particles in a sample lie in
the same focusing plane and are orientated with their largest
area facing the camera. Consequently, image capture is
always successful and every particle is clearly defined.
Up to 300,000 particles can be analyzed and their images
saved, producing qualitative data with a high degree of
quantitative significance.
Images captured at a rateof 60 frames per second
Flat particle flow
StrobeCCD Camera
Each particle image is extracted and analyzed for size and shape.
Particle images can then be sortedon any size or shape parameter
SheathLiquid
Flat particle flow
Sample
SheathLiquid
Flat particle flow The Sheath-Flow cell is the heart of the FPIA-3000. Its design and technology are pivotal to the
unique imaging capabilities of the instrument. Its purpose is to optimize the sample flow to produce
an ideal particle presentation for imaging.
The sample is introduced in the Sheath-Flow cell through a
jet nozzle. This sample flow is ‘sandwiched’ by the sheath
liquid. This transforms the particle suspension into a flat
flow by hydrodynamic effects.
Advanced technology made simple
1Sample dispersion and image capture
How does it all work?

5 Sysmex FPIA-3000 www.malvern.co.uk
Thresholding The raw data is first cleaned to remove erroneous
noise and a background correction is applied to
remove any nonuniformity of the illumination
conditions. A threshold value, which is a % greyscale
value is then applied. This value is user definable
depending upon the sample but is usually set at
around 90% of the background modal value. Every
pixel darker than this threshold value is then defined
as particle and everything lighter than this is defined
as background.
Edge definitionThe particle perimeter is then traced using a technique
known as chain code which assigns a value to each pixel
reflecting its relationship with its immediate neighbours.
For example – a pixel in a straight line with two of its
neighbours (pixel ‘e’ in the diagram) will have a different
value than a pixel on a corner (pixel ‘d’). All these chain
code values are then summed together for the entire
particle giving a more accurate perimeter value than if it
was calculated by just counting the pixels and giving
them all an equal weighting.
Advanced technology made simple
2Image extraction
Thresholding Edge definition
Identifying particle pixels from background pixels usingdifferences in greyscale levels
Tracing the perimeters ofindividual particles andcalculating their areas
start pixel

Following image extraction anumber of morphological
parameters are calculated. These shapeparameters enable a much more sensitivecharacterization process as they capture verysubtle variations in particle form that could remainundetected when using manual microscopy ortraditional particle sizing techniques.
center of mass
minor axis
width
lengt
h
max
dist
ance
majo
r ax
is
majo
r ax
is
6 Sysmex FPIA-3000 www.malvern.co.uk
Advanced technology made simple
3Morpholgical parameter calculation
Parameter Definition
The diameter of a circle with the same area as the particle - 3 values are dispayed -(N) weighted by number (all particles weighted equally in the distribution), (A)weighted by area (particles weighted proportional to their area - a particle of twicethe area will contribute twice as much to the %density on the distribution), and (V)weighted by volume (particles weighted proportional to their volume)
Actual perimeter of particle
Actual area of particle
All possible lines from one point of the perimeter to another point on the perimeterare projected on the major axis (axis of minimum rotational energy). The maximumlength of these projections is the length of the object.
All possible lines from one point of the perimeter to another point on the perimeterare projected on the minor axis. The maximum length of these projections is thewidth of the object.
Largest distance between any 2 pixels in particle
Projection at 90 degrees to max distance
Depending upon how the particle is orientated the horizontal and vertical externalcaliper dimensions
Depending upon how the particle is orientated the horizontal and vertical dimensionsthrough the centre of mass
Depending upon how the particle is orientated the maximum internal horizontal andvertical dimensions measured parallel to the horizontal and vertical
Diameter of a circle with equivalent perimeter to particle
CE diameter (N, A andVolume based)
Perimeter
Area
Length
Width
Max. distance
Min. distance
Ferret (horizontal andvertical) diameter
Martin (horizontal andvertical) diameter
Krumbein (horizontal andvertical) diameter
Equivalent perimeterdiameter

7 Sysmex FPIA-3000 www.malvern.co.uk
Advanced technology made simple
ConvexityConvexity is the object areadivided by the area enclosedby an imaginary “rubber band”wrapped around the object.The convexity has values in therange 0 -1. A convex shapehas convexity 1.0, while aconcave shape has a lowervalue, close to 0.
Convexity = AA + B
Parameter Definition
Convex hullperimeter
Convex hull area
Intensity mean
Intensity standarddeviation
Aspect ratio(Feret)
Aspect ratio(width/length)
Aspect ratio(min/max distance)
Convexity (perimeter)
Convexity (area)
Circularity
Perimeter of convex hull (shape defined byanalogous elastic band stretched around particle)
Area of convex hull
Average of all the greyscale values of every pixelin the particle
Standard deviation of all the greyscale values ofevery pixel in the particle
Maximum Feret diameter divided by minimum Feret diameter
Width divided by length
Minimum distance divided by maximum distance
Convex hull perimeter divided by actual particleperimeter
Actual particle area divided by convex hull area
Circumference of circle of equivalent area dividedby the actual perimeter of the particle. The morespherical the particle the closer the circularity is to 1, the more elongated or rough-edged theparticle is, the lower the circularity.
Shape parameters such as Circularity, Convexity
and Aspect Ratio provide the user with a series of
highly sensitive tools in order to identify and
quantify subtle variations in particle shape and
provide a “fingerprint” of each sample. Each
parameter is usually normalized between 0 and 1
in order to provide quick and easy comparability.
Traditional qualitative human descriptions such as
“jagged”, “smooth” or “needlelike” can be
accurately quantified and hence correlated against
important process or end-product variables such
as flowability, active area and grinding efficiency.
Circularity
Morphological parameter calculation continued

8 Sysmex FPIA-3000 www.malvern.co.uk
Advanced technology made simple
Software to make it happen
A high level of functionality with a priority placed upon ease-of-use is built into the FPIA-3000software. Malvern Instruments and Sysmex together have vast experience and expertise inprogramming and testing such analysis software which means you get the best out of theinstrument and the data it generates.
Particle view: Images of all particles are saved. These imagescan be viewed and manipulated through the particle viewer.The images can be magnified and sorted on any size or shapeparameter allowing the operator to quickly and easily identifyanomalies – perhaps agglomerates or the presence ofunexpected foreign particles for example.
Record view: A configurable record view allows you to viewa summary of the measurement results and define theinformation which is displayed for each record. Selecting arecord or multiple records allows you to view the details(scattergram graphs, particle images, raw statistical data etc)associated with each record.
Results view: The results of a single analysis are representedin a 3 graph format – a particle size distribution (green), aparticle shape distribution (red) and a scattergram plot of sizeagainst shape (blue). The statistical parameters associatedwith each distribution (mean, mode, lower, median and upperpercentile values etc) are also displayed.

9 Sysmex FPIA-3000 www.malvern.co.uk
Advanced technology made simple
Along with detailed data on individual records the software has the ability to further manipulatethe data and compare multiple records to identify subtle differences and trends of key parameters
Trend view: Plot multiple measurements and compare thetrend of parameters. The displayed parameters are user-definable and cross-measurement statistics are calculatedsuch as mean of means, standard deviation of means etc.This ability to plot trends enables data presentation in a formwhich allows immediate action to be taken by the operator asit avoids the need to export data for any further manipulation.
Overplot view: Overplot multiple records for a more detailedcomparison. Data is displayed on three graphs – a sizefrequency distribution, a shape frequency distribution and asize cumulative distribution. The cumulative distribution plot isparticularly useful for assessing reproducibility during themethod development phase of an analysis for example.
Multiple scattergram view: View up to 8 scattergrams sideby side for a quick visual comparison of results. This allowsthe operator to spot gross differences or trends quicklywithout having to deeply probe the statistics behind eachrecord. Any anomalies or significant differences can beinvestigated further by drilling down deeper into the raw data.
Software continued

Data interpretation
Quick and easy interpretation of analysis data is vital in today's busyand efficiency-conscious R&D and QC labs. In order to facilitate quickdecision making the FPIA-3000 software maintains links between thequalitative data, presented in graph format, and the qualitative images.This allows the user to quickly and easily switch between both typesof data and retain the relevance at all times. Limits can also be appliedto each distribution in order to exclude certain values and thestatistics are automatically recalculated without the excluded particles.
The two examples below illustrate how both the statistical distribution and the particle imagesare used together to fully characterize and understand a sample.
Example 1: Fiber samples
Example 2: Agglomerated abrasive samples
Interpretation of the statistics alone suggests that thesample includes some agglomerates and a quick lookat the images below confirms this
Interpretation of the statistics alone suggests that thesample is fiber or needlelike and a quick look at theimages below confirms this
Trend showingdecreasingcircularity withincreasing size
Trend showingdecreasingcircularity withincreasing size
Mean circularityof 0.6
Mean circularityof 0.9
10 Sysmex FPIA-3000 www.malvern.co.uk
Advanced technology made simple
11 Sysmex FPIA-3000 www.malvern.co.uk
Key applications
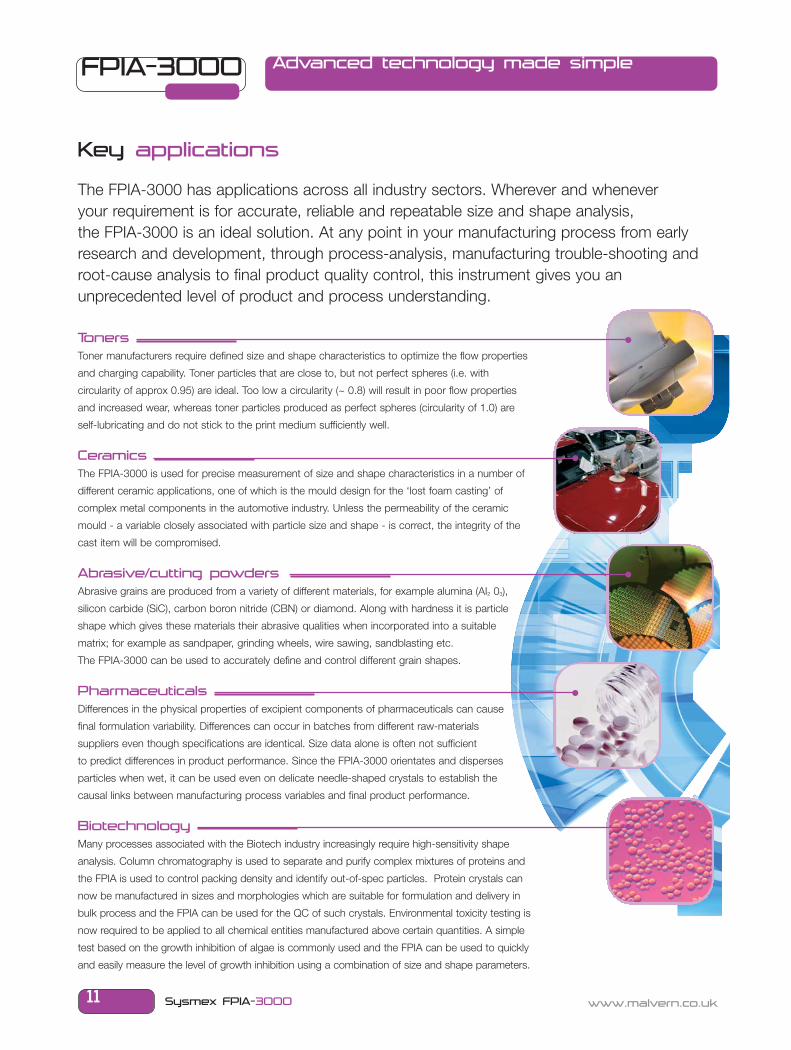
The FPIA-3000 has applications across all industry sectors. Wherever and whenever your requirement is for accurate, reliable and repeatable size and shape analysis, the FPIA-3000 is an ideal solution. At any point in your manufacturing process from earlyresearch and development, through process-analysis, manufacturing trouble-shooting androot-cause analysis to final product quality control, this instrument gives you anunprecedented level of product and process understanding.
TonersToner manufacturers require defined size and shape characteristics to optimize the flow properties
and charging capability. Toner particles that are close to, but not perfect spheres (i.e. with
circularity of approx 0.95) are ideal. Too low a circularity (~ 0.8) will result in poor flow properties
and increased wear, whereas toner particles produced as perfect spheres (circularity of 1.0) are
self-lubricating and do not stick to the print medium sufficiently well.
CeramicsThe FPIA-3000 is used for precise measurement of size and shape characteristics in a number of
different ceramic applications, one of which is the mould design for the ‘lost foam casting’ of
complex metal components in the automotive industry. Unless the permeability of the ceramic
mould - a variable closely associated with particle size and shape - is correct, the integrity of the
cast item will be compromised.
Abrasive/cutting powdersAbrasive grains are produced from a variety of different materials, for example alumina (AI2 03),
silicon carbide (SiC), carbon boron nitride (CBN) or diamond. Along with hardness it is particle
shape which gives these materials their abrasive qualities when incorporated into a suitable
matrix; for example as sandpaper, grinding wheels, wire sawing, sandblasting etc.
The FPIA-3000 can be used to accurately define and control different grain shapes.
PharmaceuticalsDifferences in the physical properties of excipient components of pharmaceuticals can cause
final formulation variability. Differences can occur in batches from different raw-materials
suppliers even though specifications are identical. Size data alone is often not sufficient
to predict differences in product performance. Since the FPIA-3000 orientates and disperses
particles when wet, it can be used even on delicate needle-shaped crystals to establish the
causal links between manufacturing process variables and final product performance.
BiotechnologyMany processes associated with the Biotech industry increasingly require high-sensitivity shape
analysis. Column chromatography is used to separate and purify complex mixtures of proteins and
the FPIA is used to control packing density and identify out-of-spec particles. Protein crystals can
now be manufactured in sizes and morphologies which are suitable for formulation and delivery in
bulk process and the FPIA can be used for the QC of such crystals. Environmental toxicity testing is
now required to be applied to all chemical entities manufactured above certain quantities. A simple
test based on the growth inhibition of algae is commonly used and the FPIA can be used to quickly
and easily measure the level of growth inhibition using a combination of size and shape parameters.
Advanced technology made simple

detailed specifications at www.malvern.co.uk
© 2005 MRK652-01
Advanced technology made simple
dist
ribut
or d
etai
ls
Malvern Instruments is part of Spectris plc, the Precision Instrumentation and Controls Company.
Sysmex FPIA-3000 technical specificationsDynamic size and shape measurement of wet samplesTechnical specificationsMeasurement technique Automated image analysis—flow cytometryLight source White light stroboscope (60Hz)Detector CCD (charge-coupled device)Measuring mode High power field (2x secondary lens) Low power field (0.5x secondary lens)Particle size range (standard unit) 1.5µm – 40µm (total mag = 20x) 6µm – 160µm (total mag = 5x)Primary lens = 10xParticle size range (high-mag unit) 0.8µm – 20µm (total mag = 40x) 3µm – 80µm (total mag = 10x)Primary lens = 20xParticle size range (low-mag unit) 3µm – 80µm (total mag = 10x) 12µm – 300µm (total mag = 2.5x)Primary lens = 5xStandard sample volume 5ml 5mlMinimum sample volume 1ml 1mlMeasurement time 2.5 minutes 2.5 minutesSheath liquid compatibility Standard version Solvent version
Aqueous ‘Particle Sheath Reagent’ Compatible with most commonly usedMethanol, ethanol, isopropyl alcohol solvent dispersants such as: Toluene,and ethylene glycol solution (25%) Acetone, Heptane and Hexane
Reagent consumption Approximately 130ml per sampleRequirementsMinimum PC specification Windows XP, 3.0GHz Intel Pentium IV processor with 1MB cache, 1GB RAM,(Supplied with system) 160GB hard drive, DVD +/- RW, 17" flat panel monitorOperating environment Temperature 15 – 30˚C, Humidity 35 – 80%Power requirements 100V to 240V with Standard IEC inlet socketDimensionsMain unit 900(w) x 455(h) x 475(d) weight 59.5kgPneumatic unit 280(w) x 400(h) x 355(d) weight 20.7kg
Malvern Instruments LimitedEnigma Business Park • Grovewood Road • Malvern • Worcestershire • UK • WR14 1XZTel: +44 (0)1684 892456 • Fax: +44 (0)1684 892789
Malvern Instruments WorldwideSales and service centers in over 50 countries for details visit www.malvern.co.uk/contact