particle fluxes in the deep eastern mediterranean basins ... · particle fluxes in the deep...
TRANSCRIPT

Biogeosciences, 6, 333–348, 2009www.biogeosciences.net/6/333/2009/© Author(s) 2009. This work is distributed underthe Creative Commons Attribution 3.0 License.
Biogeosciences
Particle fluxes in the deep Eastern Mediterranean basins: the role ofocean vertical velocities
L. Patara1, N. Pinardi2, C. Corselli3, E. Malinverno3, M. Tonani4, R. Santoleri5, and S. Masina1,4
1Centro Euro-Mediterraneo per i Cambiamenti Climatici (CMCC), Viale Aldo Moro 44, 40127 Bologna, Italy2Laboratorio SINCEM, Universita di Bologna, Via S. Alberto 163, 48100 Ravenna, Italy3Dipartimento di Scienze Geologiche e Geotecnologie, Universita Milano-Bicocca, Piazza della Scienza 4, 20126 Milan, Italy4Istituto Nazionale di Geofisica e Vulcanologia (INGV), Viale Aldo Moro 44, 40127 Bologna, Italy5Istituto di Scienze dell’Atmosfera e del Clima – C.N.R., Via del Fosso del Cavaliere 100, 00133 Rome, Italy
Received: 25 April 2008 – Published in Biogeosciences Discuss.: 12 August 2008Revised: 26 January 2009 – Accepted: 10 February 2009 – Published: 6 March 2009
Abstract. This paper analyzes the relationship betweendeep sedimentary fluxes and ocean current vertical veloc-ities in an offshore area of the Ionian Sea, the deepestbasin of the Eastern Mediterranean Sea. Sediment trap dataare collected at 500 m and 2800 m depth in two successivemoorings covering the period September 1999–May 2001.A tight coupling is observed between the upper and deeptraps and the estimated particle sinking rates are more than200 m day−1. The current vertical velocity field is computedfrom a 1/16◦×1/16◦ Ocean General Circulation Model sim-ulation and from the wind stress curl. Current vertical ve-locities are larger and more variable than Ekman vertical ve-locities, yet the general patterns are alike. Current verticalvelocities are generally smaller than 1 m day−1: we thereforeexclude a direct effect of downward velocities in determin-ing high sedimentation rates. However we find that upwardvelocities in the subsurface layers of the water column arepositively correlated with deep particle fluxes. We thus hy-pothesize that upwelling would produce an increase in up-per ocean nutrient levels – thus stimulating primary produc-tion and grazing – a few weeks before an enhanced verticalflux is found in the sediment traps. High particle sedimen-tation rates may be attained by means of rapidly sinking fe-cal pellets produced by gelatinous macro-zooplankton. Othersedimentation mechanisms, such as dust deposition, are alsoconsidered in explaining large pulses of deep particle fluxes.The fast sinking rates estimated in this study might be an evi-
Correspondence to:L. Patara([email protected])
dence of the efficiency of the biological pump in sequesteringorganic carbon from the surface layers of the deep EasternMediterranean basins.
1 Introduction
The Eastern Mediterranean Sea is characterized by an anti-estuarine basin scale circulation through the Sicily Channel,with the entrance of surface nutrient-depleted waters and theexiting of nutrient-enriched intermediate waters (Malanotte-Rizzoli et al., 1997; Pinardi and Masetti, 2000). Super-imposed to this large scale circulation pattern, a seasonalwind-forced sub-basin scale circulation is evident (Pinardiand Navarra, 1993; Molcard et al., 2002), with the dom-inant north-westerly wind component giving a characteris-tic separation between the southern regions, dominated byanticyclonic motion, and the northern regions, dominatedby cyclonic motion (Pinardi et al., 2005). The EasternMediterranean general circulation is moreover importantlyaffected by interannual variability mainly in response to sur-face fluxes (Korres et al., 2000; Demirov and Pinardi, 2002).
The open areas of the Ionian Sea, which is the deepestbasin of the Eastern Mediterranean Sea, are highly olig-otrophic, as surface chlorophyll concentrations are generallylower than 0.5 mg m−3 and a deep chlorophyll maximum isfound at around 80–100 m depth (Boldrin et al., 2002; Mal-inverno et al., 2003; Ignatiades, 2005). The nutricline in theEastern Mediterranean Sea is normally well below the eu-photic layer. Klein et al. (1999) measure in the year 1987a 300–400 m deep nutricline in the southeastern Ionian Sea,
Published by Copernicus Publications on behalf of the European Geosciences Union.
334 L. Patara et al.: Particle fluxes and ocean vertical velocities
while Ediger and Yilmaz (1996) measure in the LevantineBasin a 600 m deep nutricline in correspondence of anticy-clonic structures. In the Ionian Sea, oligotrophic featuresincrease according to a north-south and west-east gradient(Bricaud et al., 2002; Casotti et al., 2003), in response todifferent water mass characteristics and possibly circulationpatterns. In this oligotrophic region coccolithophores are animportant constituent of the phytoplankton assemblage largerthan 3µm (Boldrin et al., 2002; Malinverno et al., 2003) andtheir calcitic remains give a major contribution to the calciumcarbonate export to the deep layers (Ziveri et al., 2000).
Organic matter export in the ocean interior – occurringmainly through zooplankton fecal pellets and marine snowparticles (Knappertsbusch and Brummer, 1995; Stemmann etal., 2002; Turner, 2002) – is one of the processes maintain-ing the CO2 partial pressure gradient between surface anddeep layers (Sarmiento and Gruber, 2006) and it is there-fore involved in the ocean’s capacity to absorb atmosphericCO2. Hence it is important to quantify particle sedimenta-tion in the water column and to assess the mechanisms af-fecting its variability. Particle fluxes may be estimated bymeans of sediment traps which collect the material sinkingthrough the water column in temporally rotating containers(Honjo, 1996; Buesseler et al., 2007), thus giving a measureof the mass of particles (mg) sinking across the sediment trapsurface (m2) during a specific time interval (days). Resultsfrom sediment traps moored at various depths and geograph-ical settings (Honjo et al., 2008) yield significant variabilityin particle flux magnitudes and sinking velocities as a conse-quence of physical and biological processes (Berelson, 2002;Francois et al., 2002; De La Rocha and Passow, 2007; Lutzet al., 2007; Trull et al., 2008).
In oligotrophic open ocean regions particle fluxes aregenerally very low, and yet they have been observed tostrongly react to localized and episodic phenomena such asthe passage of mesoscale eddies (Sweeney et al., 2003), el-evated zooplankton biomass (Conte et al., 2003; Goldthwaitand Steinberg, 2008), and the occurrence of lithogenic dustevents (Zuniga et al., 2008); in addition deep particle fluxesare found to be in some cases decoupled with respect to sur-face ocean primary production (Buesseler, 1998; Conte et al.,2001; Lutz et al., 2002). However the relevant physical andbiological mechanisms controlling particle sedimentation inoligotrophic regions are still to be fully understood.
In this study we investigate the effect of current vertical ve-locities on particle fluxes measured in the deep Ionian basin.Ocean vertical velocities might influence particle fluxes intwo opposite ways: on one hand they could directly increasesedimentation rates through downwelling velocities; on theother hand they could produce, via upwelling velocities, anindirect effect through an enhancement of nutrient levels andprimary productivity in the upper ocean.
Particles are sampled during the period 1999–2001 at theUrania and Bannock stations – located in the open southeast-ern Ionian Sea – by means of sediment traps moored at 500 m
and 2800 m depth. We analyze total particle flux, i.e. the fluxof all sinking particles, and total coccolith flux, i.e. the fluxof the calcitic plates constituting the coccolithophore exter-nal shell.
Ekman vertical velocities calculated from the wind stresscurl were used in previous studies as a proxy of the cur-rent vertical velocities and a relation with biological patternswas found (Agostini and Bakun, 2002). However biogeo-chemical processes and vertical particle fluxes are affected bymesoscale features (McGillicuddy et al., 1999; Sweeney etal., 2003), which are pervasive in the eastern MediterraneanSea (Robinson et al., 1987) but might not be correctly repre-sented by the large scale Ekman vertical velocities.
Current vertical velocities are difficult to directly measurebecause of their extremely low values, which are commonlyless than 1 m day−1. We therefore analyze vertical veloci-ties simulated with a 1/16◦×1/16◦ Ocean General Circula-tion Model (OGCM) for the years 1999–2001. The OGCMvertical velocities are compared with the wind induced Ek-man vertical velocities in order to verify the consistency be-tween the two fields. The OGCM vertical velocities are thencorrelated with particle fluxes from sediment traps.
The paper is organized as follows: Sect. 2 gives some de-tails regarding the particle flux observations and the compu-tation of Ekman and current vertical velocity fields. Section 3investigates the main results of this work, concentrating onthe effect of ocean vertical velocities on particle fluxes mea-sured at the studied sites. In Sect. 4 we discuss the majorfindings and in Sect. 5 we give a few concluding remarks.
2 Methods
2.1 Particle flux data from sediment traps
Particle flux data analyzed in this work were collected bymeans of conical Technicap PPS5/2 sediment traps deployedat 500 m and 2800 m depth in two offshore sites located inthe southeastern Ionian Sea, the Urania and Bannock stations(Fig. 1). Sediment traps are equipped with 24 polypropylenebottles, have a 1 m2 collection area, measure 2.3 m heightand have an aspect ratio equal to 6.25. The sediment traptime series cover the period 15 September 1999–9 May 2001in two successive moorings, the first one from 15 September1999 to 13 May 2000 (hereafter referred to as Mooring 1),the second one from 30 May 2000 to 9 May 2001 (hereafterreferred to as Mooring 2). The sampling frequency variesbetween 10 days for Mooring 1 and 15 days for Mooring 2.
Soon after recovery, swimmers were removed from thesamples by hand picking under a stereoscope with finetweezers and samples were splitted on board in 8 aliquots us-ing a pneumatic splitter. One aliquot was further splitted intoadditional sample fractions by means of a rotary splitter. Ofthese fractions one was filtered on a pre-weighted celluloseacetate filter, dried and then weighted. The measure of total
Biogeosciences, 6, 333–348, 2009 www.biogeosciences.net/6/333/2009/
L. Patara et al.: Particle fluxes and ocean vertical velocities 335
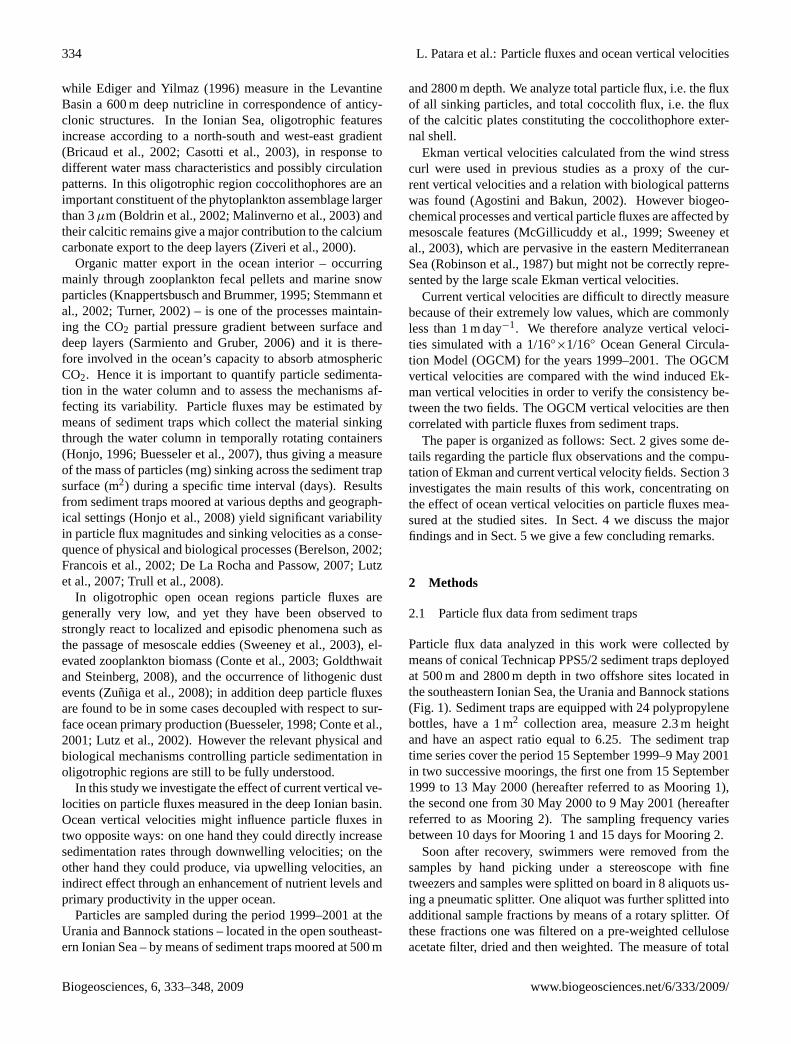
Fig. 1. Ionian Sea bathymetry and sediment trap mooring sites.U=Urania station (latitude 35◦2′ N, longitude 21◦2′ E), B=Bannockstation (latitude 34◦2′ N, longitude 20◦ E).
particle flux in units of mg m−2 day−1 was then calculatedby knowing the sample fraction weight, the sediment trapaperture area, and the sampling frequency. Another fraction,intended for coccolith analysis, was processed following themethod of Bairbakhish et al. (1999) in order to remove or-ganic matter and disaggregate particles. Samples were thenfiltered onto a millipore cellulose acetate filter (0.45µm poresize, 47 mm diameter), oven dried at 40◦C and stored in plas-tic petri dishes. A portion of each filter was mounted ona glass slide and analyzed along radial transects from thecentre to the edge using a polarized light Olympus micro-scope (LM) at 1250 magnification. Coccolith count of majorspecies was performed on areas of 0.2 to 5 mm2, dependingon coccolith concentration on the filter, whereas minor andrare species were counted on areas of 1 to 10 mm2. Coccol-ith flux was calculated according to the following equation:
F =N Af S
af Ast T, (1)
where F=coccolith flux (nC m−2 day−1), N=number ofcounted specimens (nC),Af =filter area (mm2), S=split fac-tor, af =investigated filter area (mm2), Ast=sediment trapaperture area (m2) andT =sample collecting interval (days).Because of the utilized sampling procedure, coccolith datarepresent the contribution from both loose coccoliths andcoccospheres disaggregated during sample preparation. Flux
Table 1. Available sediment trap data from the Urania and Ban-nock sites, where TPF=Total Particle Flux (mg m−2 day−1) andTCF=Total Coccolith Flux (nC m−2 day−1). Mooring 1=from 15September 1999 to 13 May 2000 and Mooring 2= from 30 May2000 to 9 May 2001.
Sampling URANIA site BANNOCK siteperiod 500 m depth 2800 m depth 2800 m depth
Mooring 1 TPF, TCF TPF, TCF TPFMooring 2 TPF, TCF TPF
data at the Urania station are available at both 500 m and2800 m depth for Mooring 1, and at 500 m depth for Mooring2. At the Bannock station only total particle flux at 2800 mdepth is available (see Table 1).
A few technical problems were encountered during thesampling procedures. At the Urania site, a few samples fromthe Mooring 1 time series collected at 2800 m depth dis-solved in the laboratory after being weighted and before thecoccolith count: the total particle flux time series is there-fore complete, whereas a few samples are missing from thecoccolith flux time series. During the sediment trap recoveryof Mooring 1, the last collecting bottle remained open dur-ing the ascent through the water column: the last samples ofthe two time series – at 500 m depth and at 2800 m depth –may therefore give an overestimated value of the true particleflux. At the Bannock site, the sediment trap rotation mecha-nism stopped after the 16th temporal interval of Mooring 1,i.e. after 24 February 2000. Particles sinking during the re-maining part of the time series (25 February 2000–13 May2000) were then collected in one single vial during a periodof 79 days.
2.2 Vertical velocities calculation
The model used in this study is derived from the OPAcode (Madec et al., 1998), it has a horizontal resolution of1/16◦
×1/16◦ (corresponding to a grid spacing of approxi-mately 6 km) and a vertical z-level step-wise discretizationwith 72 unevenly spaced levels. Vertical resolution is en-hanced in the upper layers and gradually decreases withdepth (Tonani et al., 2008).
The current vertical velocity field is computed as a diag-nostic variable according to the continuity equation for anincompressible fluid:
w(z) = w(−H) −
z∫−H
(∂u
∂x+
∂v
∂y
)dz′ (2)
whereu andv are the horizontal velocity components,w isthe vertical velocity component and−H is the bottom depth.
www.biogeosciences.net/6/333/2009/ Biogeosciences, 6, 333–348, 2009
336 L. Patara et al.: Particle fluxes and ocean vertical velocities
The kinematic bottom boundary condition for vertical veloc-ity can be expressed as:
w(−H) = −Uh · ∇hH, (3)
whereUh= (u, v) and∇h=(∂/∂x, ∂
/∂y
). Because of the
bottom topography discretization used,∇h H is equal tozero, thus vertical velocity at the ocean bottom will alsobe zero. A discussion over the vertical velocity represen-tation at the ocean bottom in z-level models may be found inPacanowski and Gnanadesikan (1998).
We compare current vertical velocity computed withEq. (2) with Ekman vertical velocity, calculated as a func-tion of the curl of the wind stressτ=
(τx, τy
)according to:
wE (x, y, δE) =1
ρo f
(k · ∇h × τ +
β τx
f
), (4)
wherewE is the Ekman vertical velocity,τ is computed fromECMWF winds using a bulk formula as reported in Tonaniet al. (2008),ρ0 is the average seawater density taken as1029 kg m−3, andf is the Coriolis parameter. Theβ pa-rameter, i.e. the meridional gradient off , is computed asβ = 2� cosθ
/r, wherer and� are the Earth radius and
angular velocity, andθ is the latitude.Ekman vertical velocities are defined at the Ekman layer
depthδE , which is the e-folding depth of the wind-inducedcurrents. For the Mediterranean SeaδE is generally between20 m and 40 m. Such an estimate is calculated using the
scaling formulaδE=π
√2Av
/|f | (Pond and Pickard, 1983),
whereAv is the vertical eddy coefficient for momentum, cal-culated in the model as a function of the Richardson number(Tonani et al., 2008) and normally variable between 10−2 and10−3 m2 s−1.
We use daily wind stress fields for the years 1999–2001to compute Ekman vertical velocities and daily current ve-locity fields of the model output to compute current verticalvelocities. The comparison between the two fields is doneon a monthly basis at 30 m depth. The comparison betweenthe vertical velocity fields and the particle flux time series isdone by averaging the former fields on the same time inter-vals of the sediment traps, i.e. 10 days for Mooring 1 and 15days for Mooring 2.
Current vertical velocity values are vertically averaged be-tween 100 m and 600 m depth, which allows for the surfacehigh frequency signals to be neglected and is deep enoughfor the nutricline depth to be included at all seasons (Edigerand Yilmaz, 1996; Klein et al., 1999). The vertical velocityfield is then horizontally averaged on six areas of increasingdimensions around the station coordinates, with the aim ofassessing how the spatial heterogeneity of vertical velocitiesaffects correlations with particle flux data.
Spearman rank correlation coefficients between currentvertical velocities and particle fluxes are calculated. We usethis non-parametric method because particle flux time series
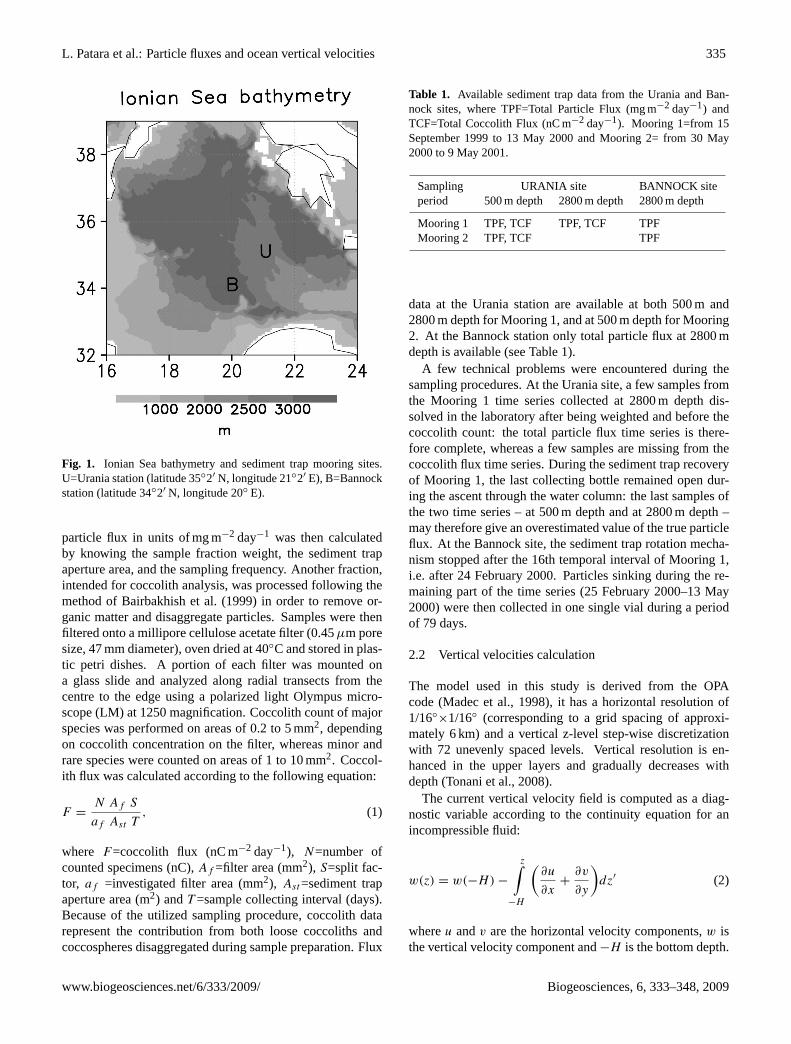
Fig. 2. Simulated current horizontal velocities (cm s−1) in the Io-nian Sea at 30 m depth averaged over the year 1999. The arrow onthe bottom-right of the panel indicates the 30 cm s−1 velocity.
do not fit a normal distribution. However we would like tomention that the use of Pearson correlation coefficients yieldsvery similar results. Correlations are calculated both withouta time lag (“0 lag” case) and with particle fluxes shifted ofone (“1 lag” case) and two (“2 lags” case) sediment trap rota-tion intervals with respect to current vertical velocities. The“1 lag” case corresponds to a shift of 10 days for Mooring1 and of 15 days for Mooring 2, whereas the “2 lags” casecorresponds to a shift of 20 days for Mooring 1 and of 30days for Mooring 2. The computation of lagged correlationsis aimed at assessing the delayed effects of ocean vertical ve-locities on particle fluxes.
3 Results
3.1 Surface circulation in the Ionian Sea
In Fig. 2 we show an annual average for the year 1999 ofthe horizontal circulation at 30 m depth simulated with theOGCM described in Sect. 2.2. Modified Atlantic Water en-tering the Sicily Strait flows mainly eastwards towards theLevantine Sea and separates the Ionian Basin in two regionscharacterized by an anticyclonic circulation to the south and
Biogeosciences, 6, 333–348, 2009 www.biogeosciences.net/6/333/2009/
L. Patara et al.: Particle fluxes and ocean vertical velocities 337
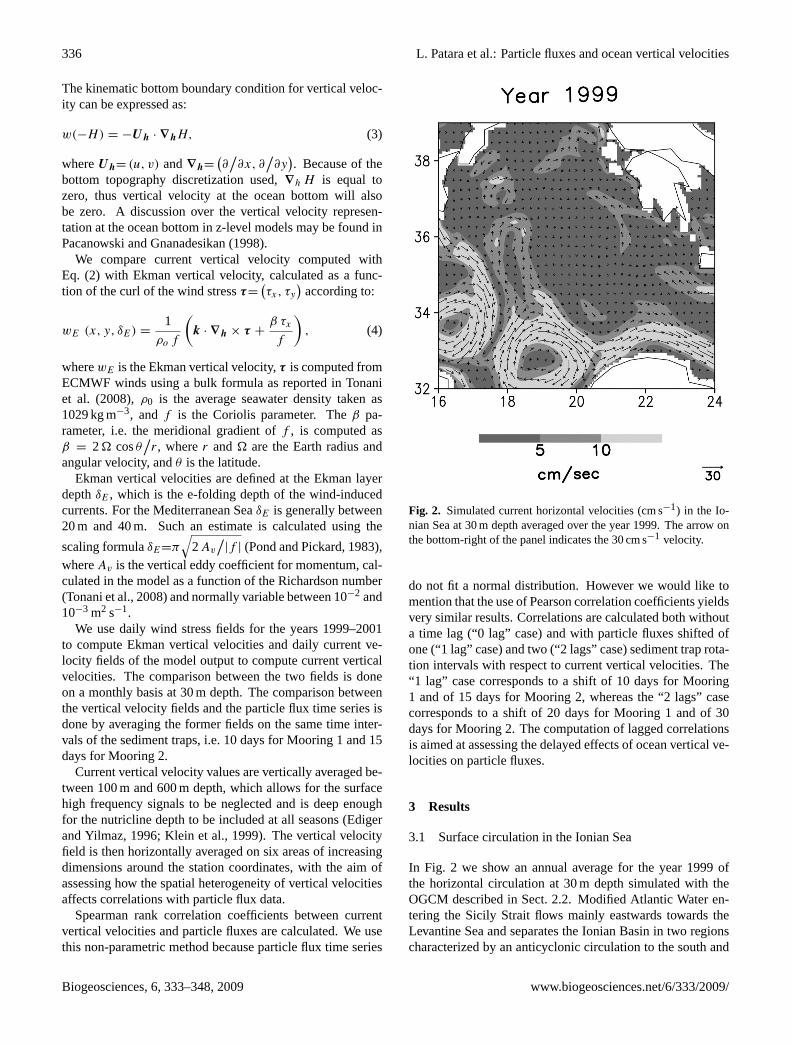
Fig. 3. Ekman vertical velocities (m day−1) in the Ionian Sea in(a) November 1999,(b) June 2000,(c) November 2000, and(d)February 2001. In letters we indicate the positions of the Urania(U) and Bannock (B) stations.
a weak and prevailingly cyclonic circulation to the north. Alarge meander of the Modified Atlantic Water current, calledthe Atlantic Ionian Stream (Robinson et al., 1999), is presentin the Ionian Sea around 34◦ N with an anticyclonic curvatureand a detached anticyclonic eddy to the north (up to 37◦ N).
The Ionian Sea was affected in the late 80s by an in-tensification and northward extension of the anticycloniccirculation (Malanotte-Rizzoli et al., 1999; Demirov andPinardi, 2002). This circulation change, which is an aspect ofthe widespread phenomenon known as the Eastern Mediter-ranean Transient, appears to have recovered since the late90s (Manca et al., 2003). The weak but cyclonic circulationnorth of 35◦ N and the large but limited in extent anticyclonicmeander and northward eddy are signatures of such change,which our model succeeds to capture.
3.2 Vertical velocities in the Ionian Sea
The Ekman Vertical Velocity field (hereafter referred to asEVV) calculated according to Eq. (4), is depicted in Fig.3 for the months of November 1999, June and November2000, and February 2001, which are months overlappingwith sediment trap data. EVVs have values between−0.1and 0.1 m day−1 on large portions of the Ionian basin and ex-hibit a typical large scale structure consistent with the large
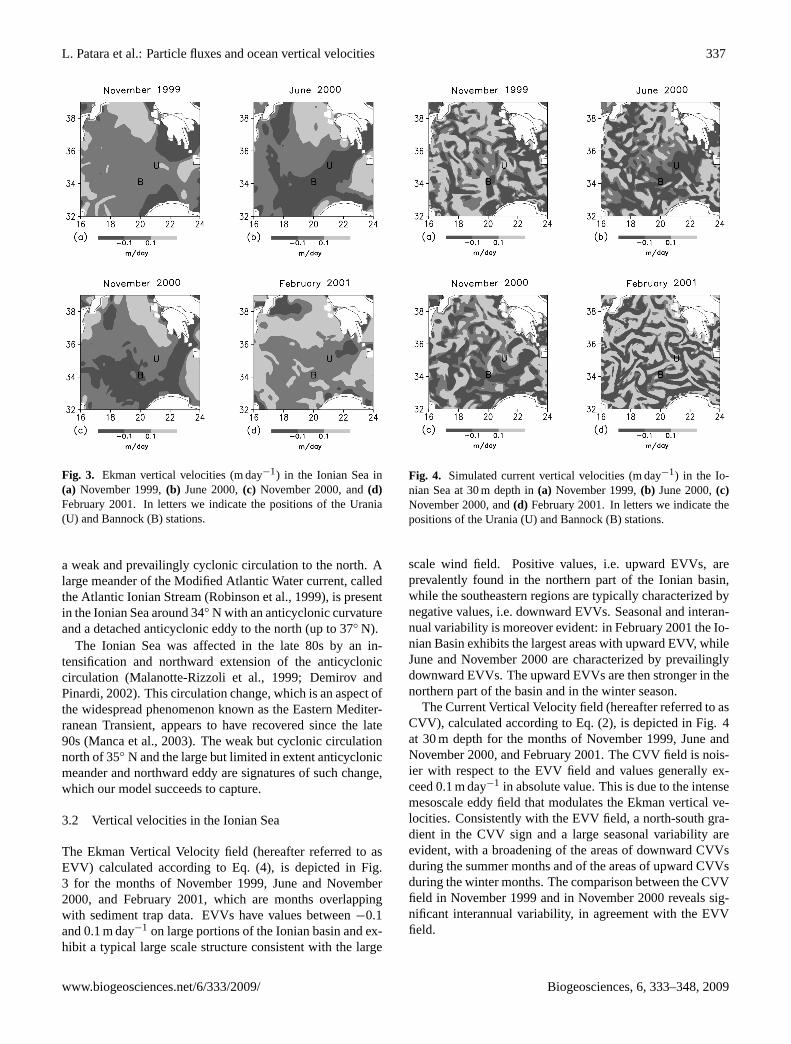
Fig. 4. Simulated current vertical velocities (m day−1) in the Io-nian Sea at 30 m depth in(a) November 1999,(b) June 2000,(c)November 2000, and(d) February 2001. In letters we indicate thepositions of the Urania (U) and Bannock (B) stations.
scale wind field. Positive values, i.e. upward EVVs, areprevalently found in the northern part of the Ionian basin,while the southeastern regions are typically characterized bynegative values, i.e. downward EVVs. Seasonal and interan-nual variability is moreover evident: in February 2001 the Io-nian Basin exhibits the largest areas with upward EVV, whileJune and November 2000 are characterized by prevailinglydownward EVVs. The upward EVVs are then stronger in thenorthern part of the basin and in the winter season.
The Current Vertical Velocity field (hereafter referred to asCVV), calculated according to Eq. (2), is depicted in Fig. 4at 30 m depth for the months of November 1999, June andNovember 2000, and February 2001. The CVV field is nois-ier with respect to the EVV field and values generally ex-ceed 0.1 m day−1 in absolute value. This is due to the intensemesoscale eddy field that modulates the Ekman vertical ve-locities. Consistently with the EVV field, a north-south gra-dient in the CVV sign and a large seasonal variability areevident, with a broadening of the areas of downward CVVsduring the summer months and of the areas of upward CVVsduring the winter months. The comparison between the CVVfield in November 1999 and in November 2000 reveals sig-nificant interannual variability, in agreement with the EVVfield.
www.biogeosciences.net/6/333/2009/ Biogeosciences, 6, 333–348, 2009
338 L. Patara et al.: Particle fluxes and ocean vertical velocities
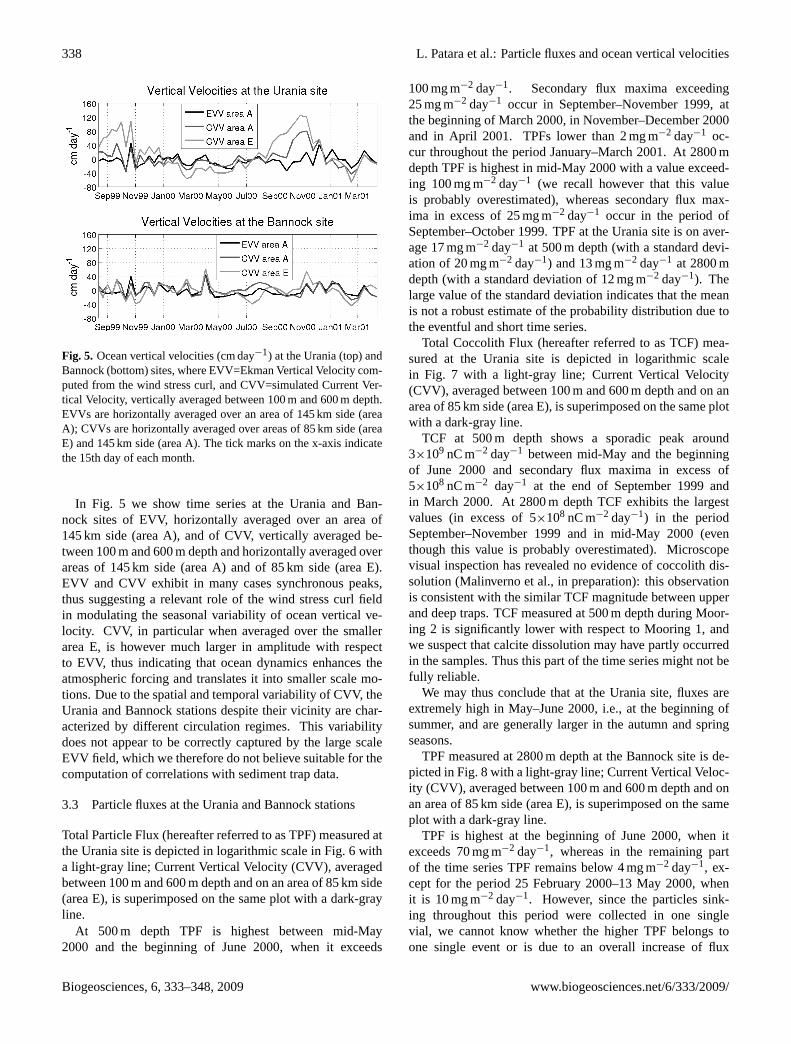
Fig. 5. Ocean vertical velocities (cm day−1) at the Urania (top) andBannock (bottom) sites, where EVV=Ekman Vertical Velocity com-puted from the wind stress curl, and CVV=simulated Current Ver-tical Velocity, vertically averaged between 100 m and 600 m depth.EVVs are horizontally averaged over an area of 145 km side (areaA); CVVs are horizontally averaged over areas of 85 km side (areaE) and 145 km side (area A). The tick marks on the x-axis indicatethe 15th day of each month.
In Fig. 5 we show time series at the Urania and Ban-nock sites of EVV, horizontally averaged over an area of145 km side (area A), and of CVV, vertically averaged be-tween 100 m and 600 m depth and horizontally averaged overareas of 145 km side (area A) and of 85 km side (area E).EVV and CVV exhibit in many cases synchronous peaks,thus suggesting a relevant role of the wind stress curl fieldin modulating the seasonal variability of ocean vertical ve-locity. CVV, in particular when averaged over the smallerarea E, is however much larger in amplitude with respectto EVV, thus indicating that ocean dynamics enhances theatmospheric forcing and translates it into smaller scale mo-tions. Due to the spatial and temporal variability of CVV, theUrania and Bannock stations despite their vicinity are char-acterized by different circulation regimes. This variabilitydoes not appear to be correctly captured by the large scaleEVV field, which we therefore do not believe suitable for thecomputation of correlations with sediment trap data.
3.3 Particle fluxes at the Urania and Bannock stations
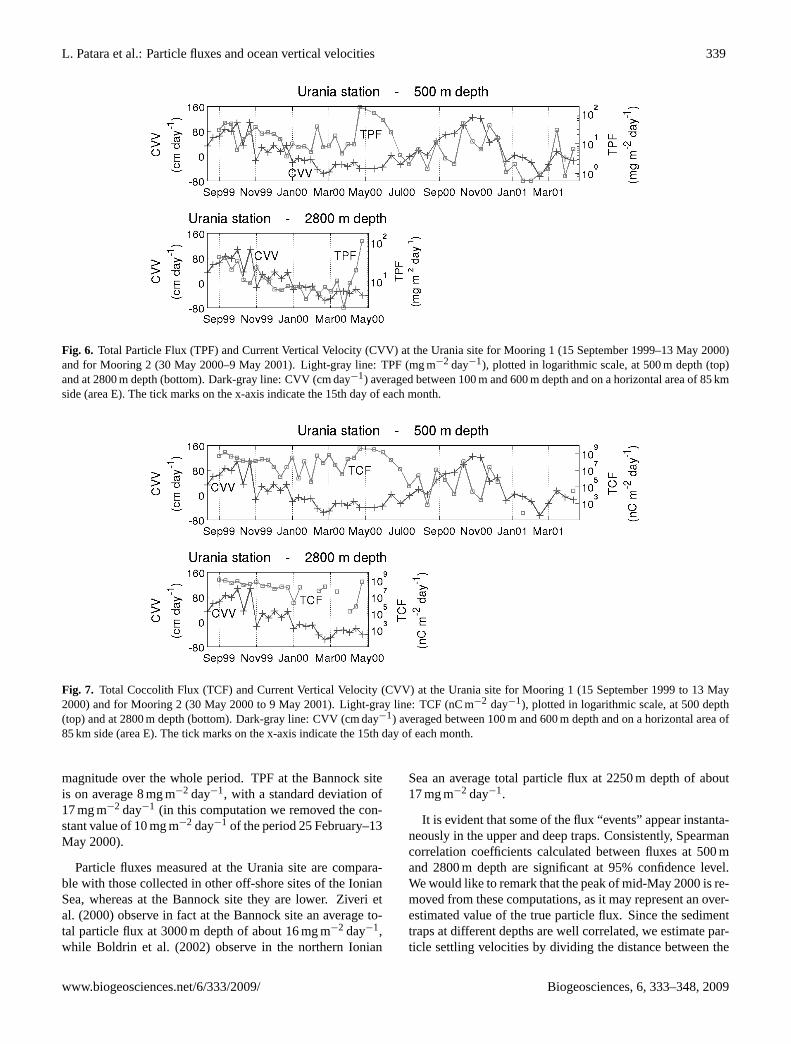
Total Particle Flux (hereafter referred to as TPF) measured atthe Urania site is depicted in logarithmic scale in Fig. 6 witha light-gray line; Current Vertical Velocity (CVV), averagedbetween 100 m and 600 m depth and on an area of 85 km side(area E), is superimposed on the same plot with a dark-grayline.
At 500 m depth TPF is highest between mid-May2000 and the beginning of June 2000, when it exceeds
100 mg m−2 day−1. Secondary flux maxima exceeding25 mg m−2 day−1 occur in September–November 1999, atthe beginning of March 2000, in November–December 2000and in April 2001. TPFs lower than 2 mg m−2 day−1 oc-cur throughout the period January–March 2001. At 2800 mdepth TPF is highest in mid-May 2000 with a value exceed-ing 100 mg m−2 day−1 (we recall however that this valueis probably overestimated), whereas secondary flux max-ima in excess of 25 mg m−2 day−1 occur in the period ofSeptember–October 1999. TPF at the Urania site is on aver-age 17 mg m−2 day−1 at 500 m depth (with a standard devi-ation of 20 mg m−2 day−1) and 13 mg m−2 day−1 at 2800 mdepth (with a standard deviation of 12 mg m−2 day−1). Thelarge value of the standard deviation indicates that the meanis not a robust estimate of the probability distribution due tothe eventful and short time series.
Total Coccolith Flux (hereafter referred to as TCF) mea-sured at the Urania site is depicted in logarithmic scalein Fig. 7 with a light-gray line; Current Vertical Velocity(CVV), averaged between 100 m and 600 m depth and on anarea of 85 km side (area E), is superimposed on the same plotwith a dark-gray line.
TCF at 500 m depth shows a sporadic peak around3×109 nC m−2 day−1 between mid-May and the beginningof June 2000 and secondary flux maxima in excess of5×108 nC m−2 day−1 at the end of September 1999 andin March 2000. At 2800 m depth TCF exhibits the largestvalues (in excess of 5×10⁸ nC m−2 day−1) in the periodSeptember–November 1999 and in mid-May 2000 (eventhough this value is probably overestimated). Microscopevisual inspection has revealed no evidence of coccolith dis-solution (Malinverno et al., in preparation): this observationis consistent with the similar TCF magnitude between upperand deep traps. TCF measured at 500 m depth during Moor-ing 2 is significantly lower with respect to Mooring 1, andwe suspect that calcite dissolution may have partly occurredin the samples. Thus this part of the time series might not befully reliable.
We may thus conclude that at the Urania site, fluxes areextremely high in May–June 2000, i.e., at the beginning ofsummer, and are generally larger in the autumn and springseasons.
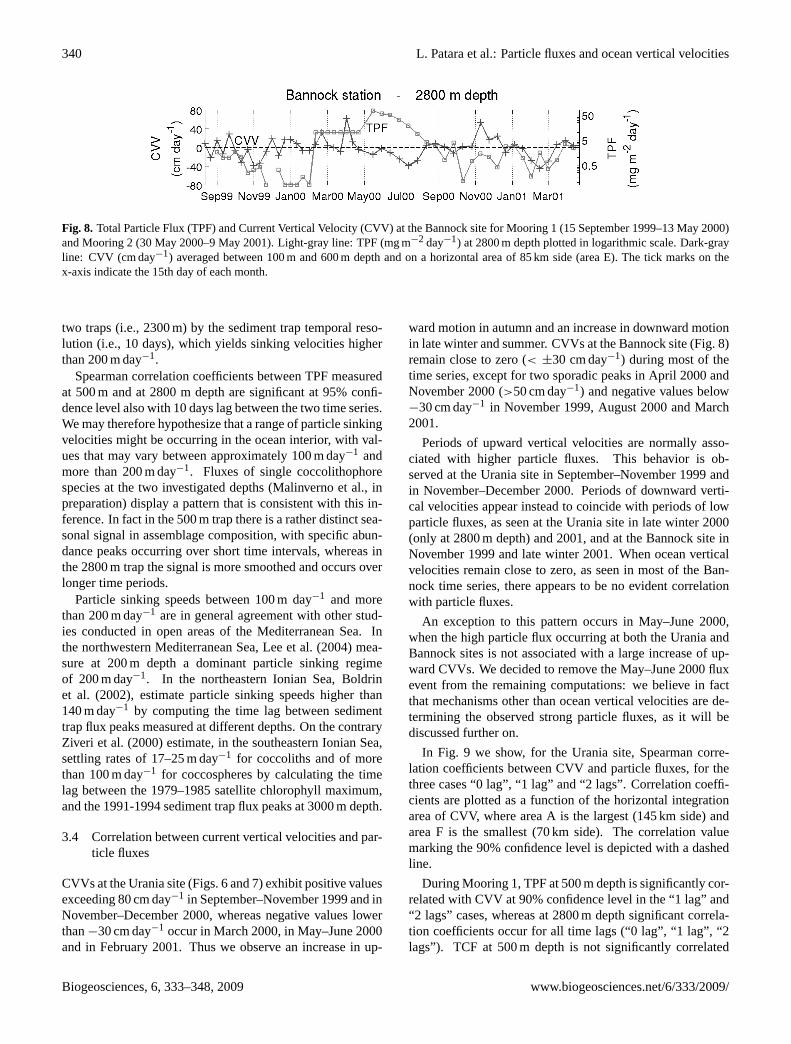
TPF measured at 2800 m depth at the Bannock site is de-picted in Fig. 8 with a light-gray line; Current Vertical Veloc-ity (CVV), averaged between 100 m and 600 m depth and onan area of 85 km side (area E), is superimposed on the sameplot with a dark-gray line.
TPF is highest at the beginning of June 2000, when itexceeds 70 mg m−2 day−1, whereas in the remaining partof the time series TPF remains below 4 mg m−2 day−1, ex-cept for the period 25 February 2000–13 May 2000, whenit is 10 mg m−2 day−1. However, since the particles sink-ing throughout this period were collected in one singlevial, we cannot know whether the higher TPF belongs toone single event or is due to an overall increase of flux
Biogeosciences, 6, 333–348, 2009 www.biogeosciences.net/6/333/2009/
L. Patara et al.: Particle fluxes and ocean vertical velocities 339
Fig. 6. Total Particle Flux (TPF) and Current Vertical Velocity (CVV) at the Urania site for Mooring 1 (15 September 1999–13 May 2000)and for Mooring 2 (30 May 2000–9 May 2001). Light-gray line: TPF (mg m−2 day−1), plotted in logarithmic scale, at 500 m depth (top)and at 2800 m depth (bottom). Dark-gray line: CVV (cm day−1) averaged between 100 m and 600 m depth and on a horizontal area of 85 kmside (area E). The tick marks on the x-axis indicate the 15th day of each month.
Fig. 7. Total Coccolith Flux (TCF) and Current Vertical Velocity (CVV) at the Urania site for Mooring 1 (15 September 1999 to 13 May2000) and for Mooring 2 (30 May 2000 to 9 May 2001). Light-gray line: TCF (nC m−2 day−1), plotted in logarithmic scale, at 500 depth(top) and at 2800 m depth (bottom). Dark-gray line: CVV (cm day−1) averaged between 100 m and 600 m depth and on a horizontal area of85 km side (area E). The tick marks on the x-axis indicate the 15th day of each month.
magnitude over the whole period. TPF at the Bannock siteis on average 8 mg m−2 day−1, with a standard deviation of17 mg m−2 day−1 (in this computation we removed the con-stant value of 10 mg m−2 day−1 of the period 25 February–13May 2000).
Particle fluxes measured at the Urania site are compara-ble with those collected in other off-shore sites of the IonianSea, whereas at the Bannock site they are lower. Ziveri etal. (2000) observe in fact at the Bannock site an average to-tal particle flux at 3000 m depth of about 16 mg m−2 day−1,while Boldrin et al. (2002) observe in the northern Ionian
Sea an average total particle flux at 2250 m depth of about17 mg m−2 day−1.
It is evident that some of the flux “events” appear instanta-neously in the upper and deep traps. Consistently, Spearmancorrelation coefficients calculated between fluxes at 500 mand 2800 m depth are significant at 95% confidence level.We would like to remark that the peak of mid-May 2000 is re-moved from these computations, as it may represent an over-estimated value of the true particle flux. Since the sedimenttraps at different depths are well correlated, we estimate par-ticle settling velocities by dividing the distance between the
www.biogeosciences.net/6/333/2009/ Biogeosciences, 6, 333–348, 2009
340 L. Patara et al.: Particle fluxes and ocean vertical velocities
Fig. 8. Total Particle Flux (TPF) and Current Vertical Velocity (CVV) at the Bannock site for Mooring 1 (15 September 1999–13 May 2000)and Mooring 2 (30 May 2000–9 May 2001). Light-gray line: TPF (mg m−2 day−1) at 2800 m depth plotted in logarithmic scale. Dark-grayline: CVV (cm day−1) averaged between 100 m and 600 m depth and on a horizontal area of 85 km side (area E). The tick marks on thex-axis indicate the 15th day of each month.
two traps (i.e., 2300 m) by the sediment trap temporal reso-lution (i.e., 10 days), which yields sinking velocities higherthan 200 m day−1.
Spearman correlation coefficients between TPF measuredat 500 m and at 2800 m depth are significant at 95% confi-dence level also with 10 days lag between the two time series.We may therefore hypothesize that a range of particle sinkingvelocities might be occurring in the ocean interior, with val-ues that may vary between approximately 100 m day−1 andmore than 200 m day−1. Fluxes of single coccolithophorespecies at the two investigated depths (Malinverno et al., inpreparation) display a pattern that is consistent with this in-ference. In fact in the 500 m trap there is a rather distinct sea-sonal signal in assemblage composition, with specific abun-dance peaks occurring over short time intervals, whereas inthe 2800 m trap the signal is more smoothed and occurs overlonger time periods.
Particle sinking speeds between 100 m day−1 and morethan 200 m day−1 are in general agreement with other stud-ies conducted in open areas of the Mediterranean Sea. Inthe northwestern Mediterranean Sea, Lee et al. (2004) mea-sure at 200 m depth a dominant particle sinking regimeof 200 m day−1. In the northeastern Ionian Sea, Boldrinet al. (2002), estimate particle sinking speeds higher than140 m day−1 by computing the time lag between sedimenttrap flux peaks measured at different depths. On the contraryZiveri et al. (2000) estimate, in the southeastern Ionian Sea,settling rates of 17–25 m day−1 for coccoliths and of morethan 100 m day−1 for coccospheres by calculating the timelag between the 1979–1985 satellite chlorophyll maximum,and the 1991-1994 sediment trap flux peaks at 3000 m depth.
3.4 Correlation between current vertical velocities and par-ticle fluxes
CVVs at the Urania site (Figs. 6 and 7) exhibit positive valuesexceeding 80 cm day−1 in September–November 1999 and inNovember–December 2000, whereas negative values lowerthan−30 cm day−1 occur in March 2000, in May–June 2000and in February 2001. Thus we observe an increase in up-
ward motion in autumn and an increase in downward motionin late winter and summer. CVVs at the Bannock site (Fig. 8)remain close to zero (< ±30 cm day−1) during most of thetime series, except for two sporadic peaks in April 2000 andNovember 2000 (>50 cm day−1) and negative values below−30 cm day−1 in November 1999, August 2000 and March2001.
Periods of upward vertical velocities are normally asso-ciated with higher particle fluxes. This behavior is ob-served at the Urania site in September–November 1999 andin November–December 2000. Periods of downward verti-cal velocities appear instead to coincide with periods of lowparticle fluxes, as seen at the Urania site in late winter 2000(only at 2800 m depth) and 2001, and at the Bannock site inNovember 1999 and late winter 2001. When ocean verticalvelocities remain close to zero, as seen in most of the Ban-nock time series, there appears to be no evident correlationwith particle fluxes.
An exception to this pattern occurs in May–June 2000,when the high particle flux occurring at both the Urania andBannock sites is not associated with a large increase of up-ward CVVs. We decided to remove the May–June 2000 fluxevent from the remaining computations: we believe in factthat mechanisms other than ocean vertical velocities are de-termining the observed strong particle fluxes, as it will bediscussed further on.
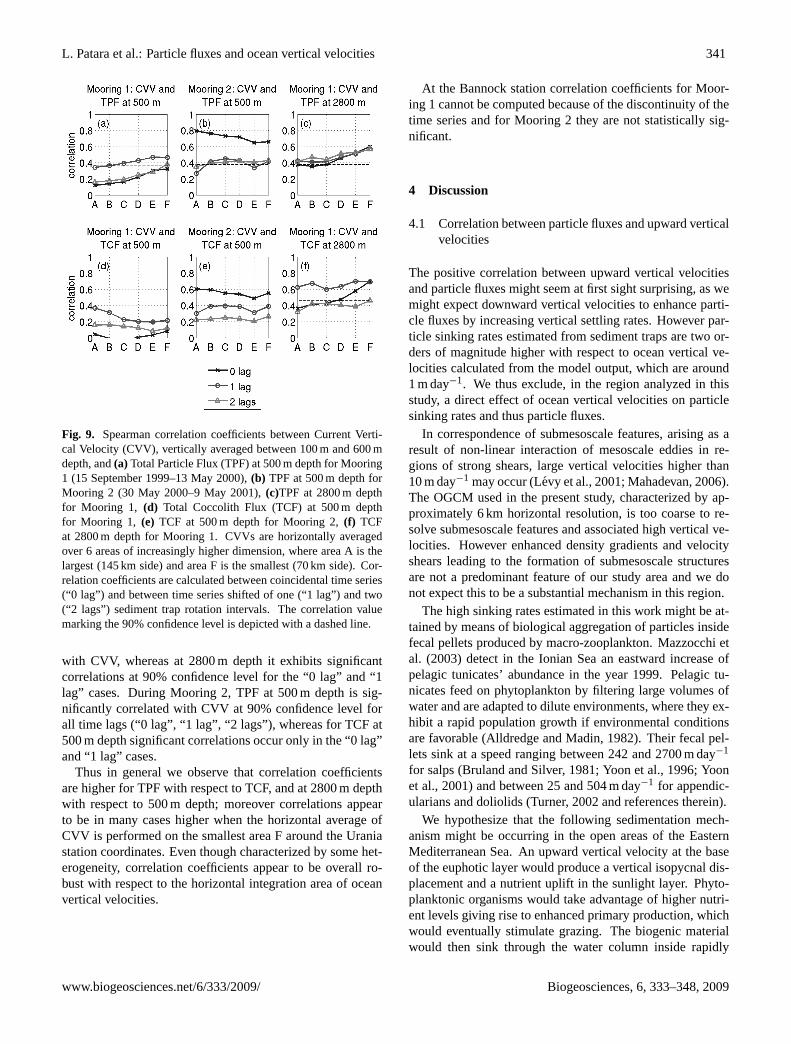
In Fig. 9 we show, for the Urania site, Spearman corre-lation coefficients between CVV and particle fluxes, for thethree cases “0 lag”, “1 lag” and “2 lags”. Correlation coeffi-cients are plotted as a function of the horizontal integrationarea of CVV, where area A is the largest (145 km side) andarea F is the smallest (70 km side). The correlation valuemarking the 90% confidence level is depicted with a dashedline.
During Mooring 1, TPF at 500 m depth is significantly cor-related with CVV at 90% confidence level in the “1 lag” and“2 lags” cases, whereas at 2800 m depth significant correla-tion coefficients occur for all time lags (“0 lag”, “1 lag”, “2lags”). TCF at 500 m depth is not significantly correlated
Biogeosciences, 6, 333–348, 2009 www.biogeosciences.net/6/333/2009/
L. Patara et al.: Particle fluxes and ocean vertical velocities 341
Fig. 9. Spearman correlation coefficients between Current Verti-cal Velocity (CVV), vertically averaged between 100 m and 600 mdepth, and(a) Total Particle Flux (TPF) at 500 m depth for Mooring1 (15 September 1999–13 May 2000),(b) TPF at 500 m depth forMooring 2 (30 May 2000–9 May 2001),(c)TPF at 2800 m depthfor Mooring 1, (d) Total Coccolith Flux (TCF) at 500 m depthfor Mooring 1, (e) TCF at 500 m depth for Mooring 2,(f) TCFat 2800 m depth for Mooring 1. CVVs are horizontally averagedover 6 areas of increasingly higher dimension, where area A is thelargest (145 km side) and area F is the smallest (70 km side). Cor-relation coefficients are calculated between coincidental time series(“0 lag”) and between time series shifted of one (“1 lag”) and two(“2 lags”) sediment trap rotation intervals. The correlation valuemarking the 90% confidence level is depicted with a dashed line.
with CVV, whereas at 2800 m depth it exhibits significantcorrelations at 90% confidence level for the “0 lag” and “1lag” cases. During Mooring 2, TPF at 500 m depth is sig-nificantly correlated with CVV at 90% confidence level forall time lags (“0 lag”, “1 lag”, “2 lags”), whereas for TCF at500 m depth significant correlations occur only in the “0 lag”and “1 lag” cases.
Thus in general we observe that correlation coefficientsare higher for TPF with respect to TCF, and at 2800 m depthwith respect to 500 m depth; moreover correlations appearto be in many cases higher when the horizontal average ofCVV is performed on the smallest area F around the Uraniastation coordinates. Even though characterized by some het-erogeneity, correlation coefficients appear to be overall ro-bust with respect to the horizontal integration area of oceanvertical velocities.
At the Bannock station correlation coefficients for Moor-ing 1 cannot be computed because of the discontinuity of thetime series and for Mooring 2 they are not statistically sig-nificant.
4 Discussion
4.1 Correlation between particle fluxes and upward verticalvelocities
The positive correlation between upward vertical velocitiesand particle fluxes might seem at first sight surprising, as wemight expect downward vertical velocities to enhance parti-cle fluxes by increasing vertical settling rates. However par-ticle sinking rates estimated from sediment traps are two or-ders of magnitude higher with respect to ocean vertical ve-locities calculated from the model output, which are around1 m day−1. We thus exclude, in the region analyzed in thisstudy, a direct effect of ocean vertical velocities on particlesinking rates and thus particle fluxes.
In correspondence of submesoscale features, arising as aresult of non-linear interaction of mesoscale eddies in re-gions of strong shears, large vertical velocities higher than10 m day−1 may occur (Levy et al., 2001; Mahadevan, 2006).The OGCM used in the present study, characterized by ap-proximately 6 km horizontal resolution, is too coarse to re-solve submesoscale features and associated high vertical ve-locities. However enhanced density gradients and velocityshears leading to the formation of submesoscale structuresare not a predominant feature of our study area and we donot expect this to be a substantial mechanism in this region.
The high sinking rates estimated in this work might be at-tained by means of biological aggregation of particles insidefecal pellets produced by macro-zooplankton. Mazzocchi etal. (2003) detect in the Ionian Sea an eastward increase ofpelagic tunicates’ abundance in the year 1999. Pelagic tu-nicates feed on phytoplankton by filtering large volumes ofwater and are adapted to dilute environments, where they ex-hibit a rapid population growth if environmental conditionsare favorable (Alldredge and Madin, 1982). Their fecal pel-lets sink at a speed ranging between 242 and 2700 m day−1
for salps (Bruland and Silver, 1981; Yoon et al., 1996; Yoonet al., 2001) and between 25 and 504 m day−1 for appendic-ularians and doliolids (Turner, 2002 and references therein).
We hypothesize that the following sedimentation mech-anism might be occurring in the open areas of the EasternMediterranean Sea. An upward vertical velocity at the baseof the euphotic layer would produce a vertical isopycnal dis-placement and a nutrient uplift in the sunlight layer. Phyto-planktonic organisms would take advantage of higher nutri-ent levels giving rise to enhanced primary production, whichwould eventually stimulate grazing. The biogenic materialwould then sink through the water column inside rapidly
www.biogeosciences.net/6/333/2009/ Biogeosciences, 6, 333–348, 2009
342 L. Patara et al.: Particle fluxes and ocean vertical velocities
sinking fecal pellets or other large particles and would becollected by sediment traps.
According to our results, the described mechanism of en-hanced particle fluxes triggered by upward CVVs appears tooccur within a temporal range of a few weeks. The fact thatcorrelations between CVV and TPF at 500 m depth are high-est with “1 lag” for Mooring 1 and with “0 lag” for Mooring2 is not necessarily an inconsistent result, as the temporalresolution is of 10 days for Mooring 1 and of 15 days forMooring 2. Significant correlations between CVV and bothcoincidental and lagged particle flux time series might be in-dicating that various time scales are involved in the sedimen-tation of particle pulses from the ocean surface. We mayspeculate that this is due to the existence of a spectrum ofparticle sinking rates in the ocean interior. However, due tothe shortness of the time series, the robustness of temporallylagged correlation results might be questioned and cautionmust be used in drawing conclusions.
The observation that correlations generally increase whenCVV is horizontally averaged on the smallest area F aroundthe station coordinates gives strength to our hypothesis, asit would highlight the local effect of CVVs on the observedparticle fluxes. Higher correlations occurring for the 2800 mdepth trap – with respect to the 500 m depth trap - might in-dicate that sediment trap measurements at 500 m depth aremore affected by upper ocean dynamics (e.g. vertical migrat-ing organisms, higher abundance of zooplanktonic “swim-mers”).
Both TCF and TPF are significantly correlated with CVVsand we hypothesize that this might be due to a high percent-age of biogenic matter to the total particle flux. Zuniga etal. (2008) observe, in the open Algero-Balearic basin, thatbiogenic flux contributes to about 50% of total particle flux,with calcium carbonate being a major constituent (∼25% oftotal particle flux, with a maximum of 60% during winter).Our results show however that TPF, rather than TCF, is giv-ing the highest correlations with CVV and we propose tworeasons for this behavior. First of all TPF contains, in ad-dition to coccoliths, other sinking matter of biogenic origin(Zuniga et al., 2008): TPF may therefore be, in areas of lowlithogenic inputs, a better proxy of upper ocean productivitythan TCF itself. Secondly, the measure of TPF may be in-trinsically more precise than the measure of TCF: the latteris only an estimate of the true coccolith flux and moreover,because of the various steps of the sampling and measuringprocedures, there is a non-null risk for coccolith plates to un-dergo partial dissolution.
At the Bannock site, where CVVs are close to zero dur-ing most of the studied period, CVVs do not appear to affectparticle flux variability in any evident way, and the proposedmechanism of enhanced particle fluxes triggered by upwardCVVs is not valid. In the next sections we will analyze addi-tional data sets that may help to improve our understandingof the sedimentary processes at the Urania and Bannock sitesduring the studied period.
4.2 Relationship with SeaWiFS chlorophyll-a data
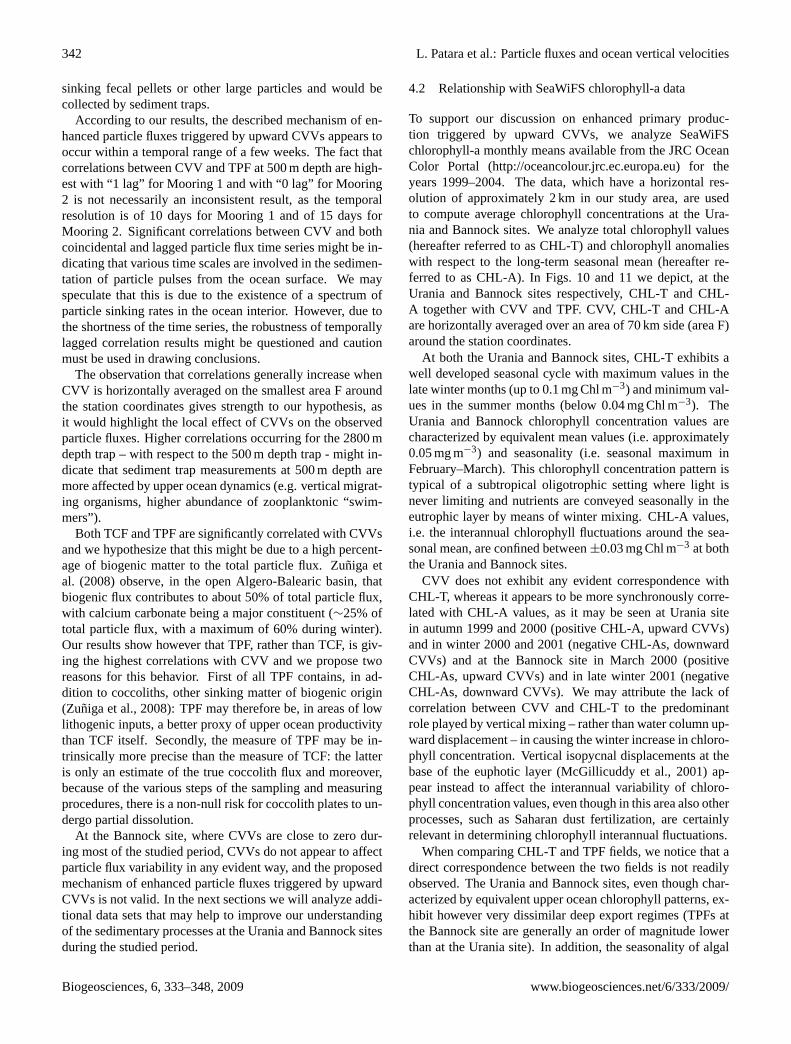
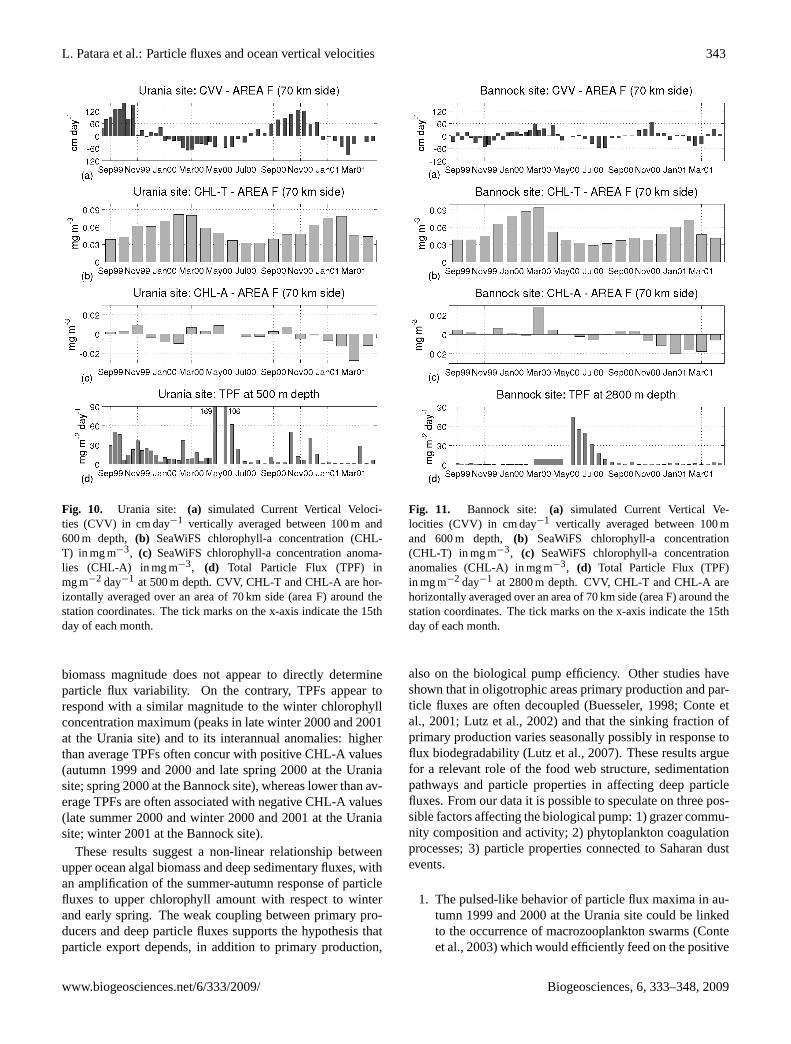
To support our discussion on enhanced primary produc-tion triggered by upward CVVs, we analyze SeaWiFSchlorophyll-a monthly means available from the JRC OceanColor Portal (http://oceancolour.jrc.ec.europa.eu) for theyears 1999–2004. The data, which have a horizontal res-olution of approximately 2 km in our study area, are usedto compute average chlorophyll concentrations at the Ura-nia and Bannock sites. We analyze total chlorophyll values(hereafter referred to as CHL-T) and chlorophyll anomalieswith respect to the long-term seasonal mean (hereafter re-ferred to as CHL-A). In Figs. 10 and 11 we depict, at theUrania and Bannock sites respectively, CHL-T and CHL-A together with CVV and TPF. CVV, CHL-T and CHL-Aare horizontally averaged over an area of 70 km side (area F)around the station coordinates.
At both the Urania and Bannock sites, CHL-T exhibits awell developed seasonal cycle with maximum values in thelate winter months (up to 0.1 mg Chl m−3) and minimum val-ues in the summer months (below 0.04 mg Chl m−3). TheUrania and Bannock chlorophyll concentration values arecharacterized by equivalent mean values (i.e. approximately0.05 mg m−3) and seasonality (i.e. seasonal maximum inFebruary–March). This chlorophyll concentration pattern istypical of a subtropical oligotrophic setting where light isnever limiting and nutrients are conveyed seasonally in theeutrophic layer by means of winter mixing. CHL-A values,i.e. the interannual chlorophyll fluctuations around the sea-sonal mean, are confined between±0.03 mg Chl m−3 at boththe Urania and Bannock sites.
CVV does not exhibit any evident correspondence withCHL-T, whereas it appears to be more synchronously corre-lated with CHL-A values, as it may be seen at Urania sitein autumn 1999 and 2000 (positive CHL-A, upward CVVs)and in winter 2000 and 2001 (negative CHL-As, downwardCVVs) and at the Bannock site in March 2000 (positiveCHL-As, upward CVVs) and in late winter 2001 (negativeCHL-As, downward CVVs). We may attribute the lack ofcorrelation between CVV and CHL-T to the predominantrole played by vertical mixing – rather than water column up-ward displacement – in causing the winter increase in chloro-phyll concentration. Vertical isopycnal displacements at thebase of the euphotic layer (McGillicuddy et al., 2001) ap-pear instead to affect the interannual variability of chloro-phyll concentration values, even though in this area also otherprocesses, such as Saharan dust fertilization, are certainlyrelevant in determining chlorophyll interannual fluctuations.
When comparing CHL-T and TPF fields, we notice that adirect correspondence between the two fields is not readilyobserved. The Urania and Bannock sites, even though char-acterized by equivalent upper ocean chlorophyll patterns, ex-hibit however very dissimilar deep export regimes (TPFs atthe Bannock site are generally an order of magnitude lowerthan at the Urania site). In addition, the seasonality of algal
Biogeosciences, 6, 333–348, 2009 www.biogeosciences.net/6/333/2009/
L. Patara et al.: Particle fluxes and ocean vertical velocities 343
Fig. 10. Urania site: (a) simulated Current Vertical Veloci-ties (CVV) in cm day−1 vertically averaged between 100 m and600 m depth, (b) SeaWiFS chlorophyll-a concentration (CHL-T) in mg m−3, (c) SeaWiFS chlorophyll-a concentration anoma-lies (CHL-A) in mg m−3, (d) Total Particle Flux (TPF) inmg m−2 day−1 at 500 m depth. CVV, CHL-T and CHL-A are hor-izontally averaged over an area of 70 km side (area F) around thestation coordinates. The tick marks on the x-axis indicate the 15thday of each month.
biomass magnitude does not appear to directly determineparticle flux variability. On the contrary, TPFs appear torespond with a similar magnitude to the winter chlorophyllconcentration maximum (peaks in late winter 2000 and 2001at the Urania site) and to its interannual anomalies: higherthan average TPFs often concur with positive CHL-A values(autumn 1999 and 2000 and late spring 2000 at the Uraniasite; spring 2000 at the Bannock site), whereas lower than av-erage TPFs are often associated with negative CHL-A values(late summer 2000 and winter 2000 and 2001 at the Uraniasite; winter 2001 at the Bannock site).
These results suggest a non-linear relationship betweenupper ocean algal biomass and deep sedimentary fluxes, withan amplification of the summer-autumn response of particlefluxes to upper chlorophyll amount with respect to winterand early spring. The weak coupling between primary pro-ducers and deep particle fluxes supports the hypothesis thatparticle export depends, in addition to primary production,
Fig. 11. Bannock site: (a) simulated Current Vertical Ve-locities (CVV) in cm day−1 vertically averaged between 100 mand 600 m depth, (b) SeaWiFS chlorophyll-a concentration(CHL-T) in mg m−3, (c) SeaWiFS chlorophyll-a concentrationanomalies (CHL-A) in mg m−3, (d) Total Particle Flux (TPF)in mg m−2 day−1 at 2800 m depth. CVV, CHL-T and CHL-A arehorizontally averaged over an area of 70 km side (area F) around thestation coordinates. The tick marks on the x-axis indicate the 15thday of each month.
also on the biological pump efficiency. Other studies haveshown that in oligotrophic areas primary production and par-ticle fluxes are often decoupled (Buesseler, 1998; Conte etal., 2001; Lutz et al., 2002) and that the sinking fraction ofprimary production varies seasonally possibly in response toflux biodegradability (Lutz et al., 2007). These results arguefor a relevant role of the food web structure, sedimentationpathways and particle properties in affecting deep particlefluxes. From our data it is possible to speculate on three pos-sible factors affecting the biological pump: 1) grazer commu-nity composition and activity; 2) phytoplankton coagulationprocesses; 3) particle properties connected to Saharan dustevents.
1. The pulsed-like behavior of particle flux maxima in au-tumn 1999 and 2000 at the Urania site could be linkedto the occurrence of macrozooplankton swarms (Conteet al., 2003) which would efficiently feed on the positive
www.biogeosciences.net/6/333/2009/ Biogeosciences, 6, 333–348, 2009
344 L. Patara et al.: Particle fluxes and ocean vertical velocities
a) b)
d)
c)
e) f)
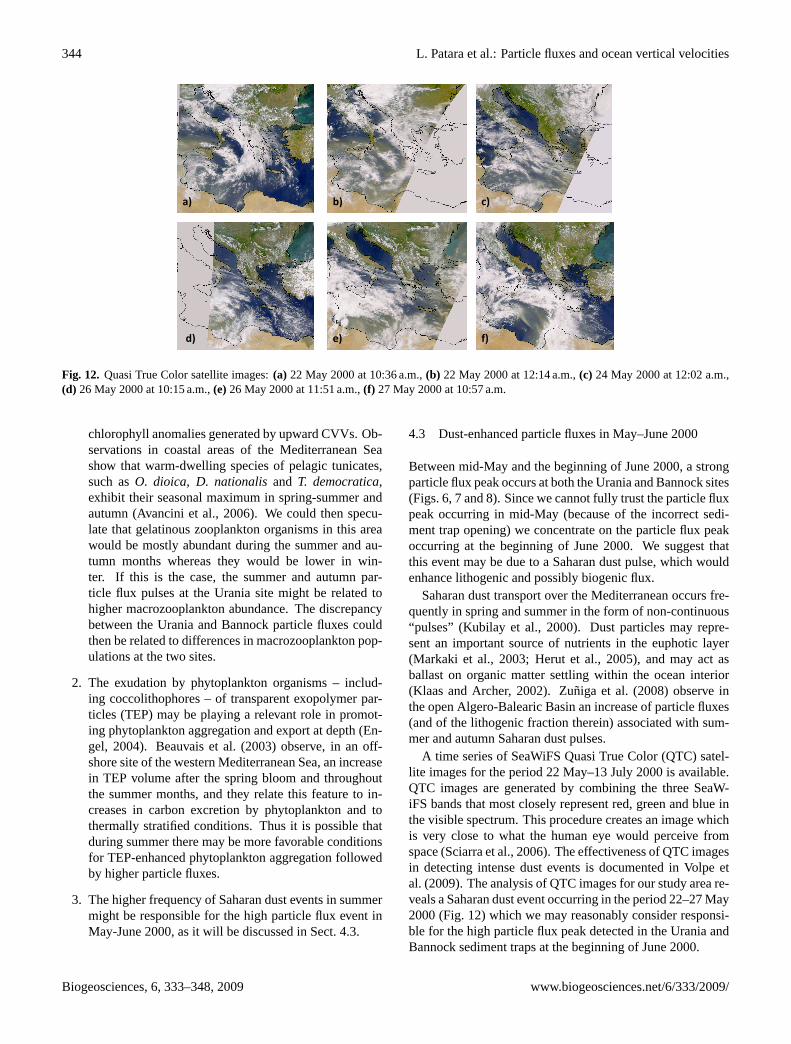
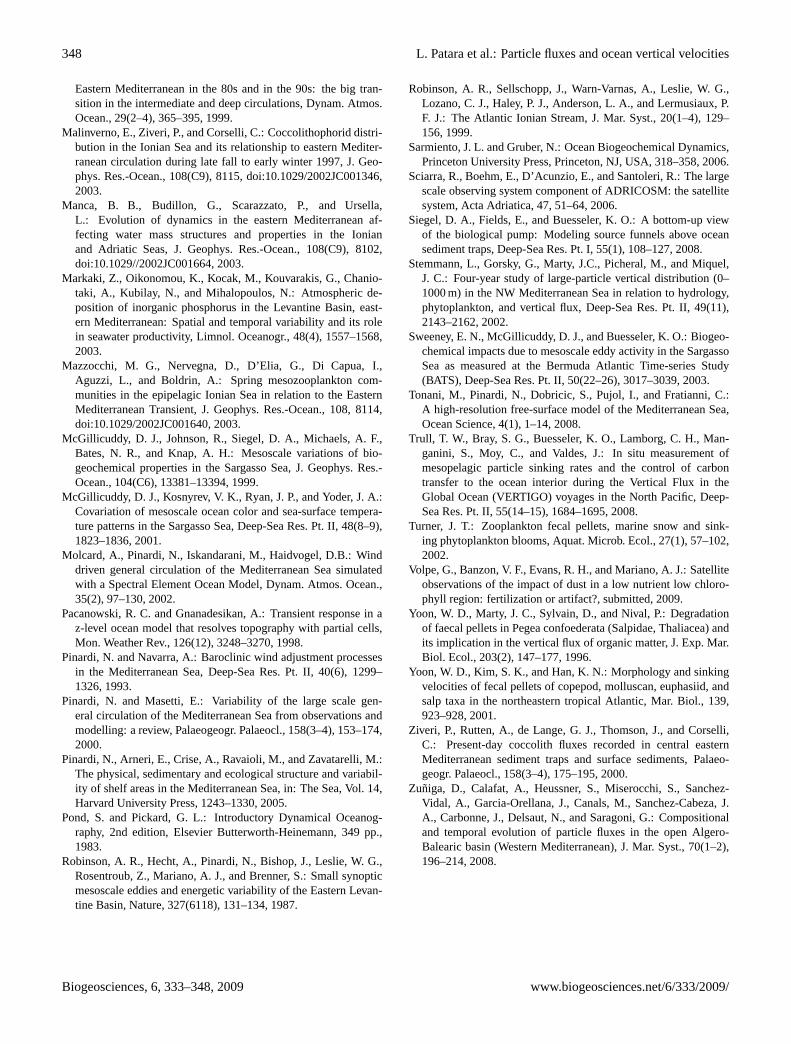
Fig. 12. Quasi True Color satellite images:(a) 22 May 2000 at 10:36 a.m.,(b) 22 May 2000 at 12:14 a.m.,(c) 24 May 2000 at 12:02 a.m.,(d) 26 May 2000 at 10:15 a.m.,(e)26 May 2000 at 11:51 a.m.,(f) 27 May 2000 at 10:57 a.m.
chlorophyll anomalies generated by upward CVVs. Ob-servations in coastal areas of the Mediterranean Seashow that warm-dwelling species of pelagic tunicates,such asO. dioica, D. nationalis and T. democratica,exhibit their seasonal maximum in spring-summer andautumn (Avancini et al., 2006). We could then specu-late that gelatinous zooplankton organisms in this areawould be mostly abundant during the summer and au-tumn months whereas they would be lower in win-ter. If this is the case, the summer and autumn par-ticle flux pulses at the Urania site might be related tohigher macrozooplankton abundance. The discrepancybetween the Urania and Bannock particle fluxes couldthen be related to differences in macrozooplankton pop-ulations at the two sites.
2. The exudation by phytoplankton organisms – includ-ing coccolithophores – of transparent exopolymer par-ticles (TEP) may be playing a relevant role in promot-ing phytoplankton aggregation and export at depth (En-gel, 2004). Beauvais et al. (2003) observe, in an off-shore site of the western Mediterranean Sea, an increasein TEP volume after the spring bloom and throughoutthe summer months, and they relate this feature to in-creases in carbon excretion by phytoplankton and tothermally stratified conditions. Thus it is possible thatduring summer there may be more favorable conditionsfor TEP-enhanced phytoplankton aggregation followedby higher particle fluxes.
3. The higher frequency of Saharan dust events in summermight be responsible for the high particle flux event inMay-June 2000, as it will be discussed in Sect. 4.3.
4.3 Dust-enhanced particle fluxes in May–June 2000
Between mid-May and the beginning of June 2000, a strongparticle flux peak occurs at both the Urania and Bannock sites(Figs. 6, 7 and 8). Since we cannot fully trust the particle fluxpeak occurring in mid-May (because of the incorrect sedi-ment trap opening) we concentrate on the particle flux peakoccurring at the beginning of June 2000. We suggest thatthis event may be due to a Saharan dust pulse, which wouldenhance lithogenic and possibly biogenic flux.
Saharan dust transport over the Mediterranean occurs fre-quently in spring and summer in the form of non-continuous“pulses” (Kubilay et al., 2000). Dust particles may repre-sent an important source of nutrients in the euphotic layer(Markaki et al., 2003; Herut et al., 2005), and may act asballast on organic matter settling within the ocean interior(Klaas and Archer, 2002). Zuniga et al. (2008) observe inthe open Algero-Balearic Basin an increase of particle fluxes(and of the lithogenic fraction therein) associated with sum-mer and autumn Saharan dust pulses.
A time series of SeaWiFS Quasi True Color (QTC) satel-lite images for the period 22 May–13 July 2000 is available.QTC images are generated by combining the three SeaW-iFS bands that most closely represent red, green and blue inthe visible spectrum. This procedure creates an image whichis very close to what the human eye would perceive fromspace (Sciarra et al., 2006). The effectiveness of QTC imagesin detecting intense dust events is documented in Volpe etal. (2009). The analysis of QTC images for our study area re-veals a Saharan dust event occurring in the period 22–27 May2000 (Fig. 12) which we may reasonably consider responsi-ble for the high particle flux peak detected in the Urania andBannock sediment traps at the beginning of June 2000.
Biogeosciences, 6, 333–348, 2009 www.biogeosciences.net/6/333/2009/
L. Patara et al.: Particle fluxes and ocean vertical velocities 345
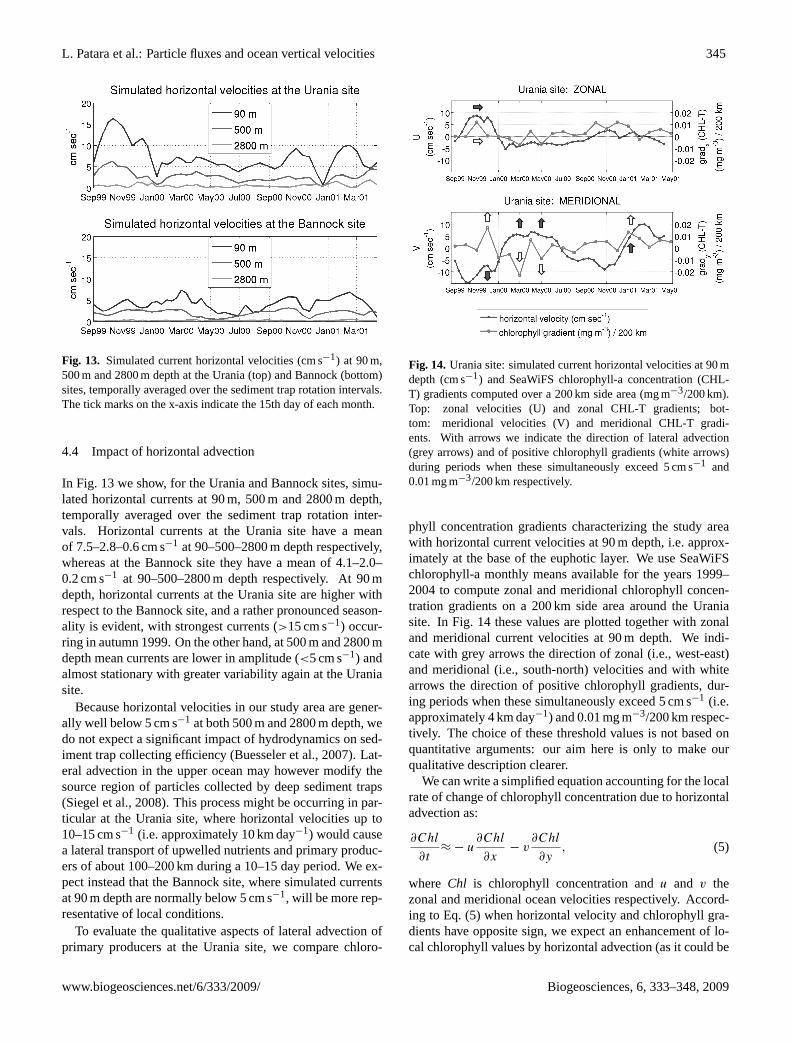
Fig. 13. Simulated current horizontal velocities (cm s−1) at 90 m,500 m and 2800 m depth at the Urania (top) and Bannock (bottom)sites, temporally averaged over the sediment trap rotation intervals.The tick marks on the x-axis indicate the 15th day of each month.
4.4 Impact of horizontal advection
In Fig. 13 we show, for the Urania and Bannock sites, simu-lated horizontal currents at 90 m, 500 m and 2800 m depth,temporally averaged over the sediment trap rotation inter-vals. Horizontal currents at the Urania site have a meanof 7.5–2.8–0.6 cm s−1 at 90–500–2800 m depth respectively,whereas at the Bannock site they have a mean of 4.1–2.0–0.2 cm s−1 at 90–500–2800 m depth respectively. At 90 mdepth, horizontal currents at the Urania site are higher withrespect to the Bannock site, and a rather pronounced season-ality is evident, with strongest currents (>15 cm s−1) occur-ring in autumn 1999. On the other hand, at 500 m and 2800 mdepth mean currents are lower in amplitude (<5 cm s−1) andalmost stationary with greater variability again at the Uraniasite.
Because horizontal velocities in our study area are gener-ally well below 5 cm s−1 at both 500 m and 2800 m depth, wedo not expect a significant impact of hydrodynamics on sed-iment trap collecting efficiency (Buesseler et al., 2007). Lat-eral advection in the upper ocean may however modify thesource region of particles collected by deep sediment traps(Siegel et al., 2008). This process might be occurring in par-ticular at the Urania site, where horizontal velocities up to10–15 cm s−1 (i.e. approximately 10 km day−1) would causea lateral transport of upwelled nutrients and primary produc-ers of about 100–200 km during a 10–15 day period. We ex-pect instead that the Bannock site, where simulated currentsat 90 m depth are normally below 5 cm s−1, will be more rep-resentative of local conditions.
To evaluate the qualitative aspects of lateral advection ofprimary producers at the Urania site, we compare chloro-
Fig. 14. Urania site: simulated current horizontal velocities at 90 mdepth (cm s−1) and SeaWiFS chlorophyll-a concentration (CHL-T) gradients computed over a 200 km side area (mg m−3/200 km).Top: zonal velocities (U) and zonal CHL-T gradients; bot-tom: meridional velocities (V) and meridional CHL-T gradi-ents. With arrows we indicate the direction of lateral advection(grey arrows) and of positive chlorophyll gradients (white arrows)during periods when these simultaneously exceed 5 cm s−1 and0.01 mg m−3/200 km respectively.
phyll concentration gradients characterizing the study areawith horizontal current velocities at 90 m depth, i.e. approx-imately at the base of the euphotic layer. We use SeaWiFSchlorophyll-a monthly means available for the years 1999–2004 to compute zonal and meridional chlorophyll concen-tration gradients on a 200 km side area around the Uraniasite. In Fig. 14 these values are plotted together with zonaland meridional current velocities at 90 m depth. We indi-cate with grey arrows the direction of zonal (i.e., west-east)and meridional (i.e., south-north) velocities and with whitearrows the direction of positive chlorophyll gradients, dur-ing periods when these simultaneously exceed 5 cm s−1 (i.e.approximately 4 km day−1) and 0.01 mg m−3/200 km respec-tively. The choice of these threshold values is not based onquantitative arguments: our aim here is only to make ourqualitative description clearer.
We can write a simplified equation accounting for the localrate of change of chlorophyll concentration due to horizontaladvection as:
∂Chl
∂t≈ − u
∂Chl
∂x− v
∂Chl
∂y, (5)
where Chl is chlorophyll concentration andu and v thezonal and meridional ocean velocities respectively. Accord-ing to Eq. (5) when horizontal velocity and chlorophyll gra-dients have opposite sign, we expect an enhancement of lo-cal chlorophyll values by horizontal advection (as it could be
www.biogeosciences.net/6/333/2009/ Biogeosciences, 6, 333–348, 2009
346 L. Patara et al.: Particle fluxes and ocean vertical velocities
occurring in December 1999, March and May 2000); whenhorizontal velocity and chlorophyll gradients have the samedirection, we expect lateral advection to cause instead a re-duction of local chlorophyll values (as it could be occurringin November 1999 and in January–February 2001). We maythen speculate that part of the particle flux increase occur-ring in December 1999 and in March–May 2000 at the Ura-nia site may be due to lateral advection from more productiveregions near the site. On the other hand in January-February2001 particle fluxes may be particularly low because of lat-eral chlorophyll divergence away from the station.
However we also recall that correlation coefficients be-tween CVV and particle fluxes are overall robust with respectto the spatial integration area of CVV (Fig. 9): it could thenbe argued that, for our studied period and area, horizontal ad-vection is not changing the spatial distribution of particles tosuch an extent to provoke a substantial effect on CVV-TPFcorrelations.
5 Conclusions
The mechanisms of sedimentary particle fluxes in the deepUrania and Bannock sites are studied by means of sedimenttrap records and model simulated vertical velocities.
The current vertical velocities in the Ionian Sea have alarge mesoscale signal that is superimposed to a seasonallyvarying Ekman vertical velocity field at low amplitude. It isfound that current vertical velocities at the Urania site arepositive (upward motion) in autumn, when pulses of totalparticle fluxes are found in the water column at 500 m and2800 m depth.
From sediment trap data the sinking velocities of TPF andTCF are estimated to be 100–200 m day−1 while current ver-tical velocities are estimated to be around 1 m day−1. Thisobservation brought us to envisage a tight coupling betweensurface and deep layers through particle aggregation mecha-nisms. We suggested that fast sinking rates of organic ma-terial in the deep ocean are connected to both lithogenicand biological aggregation mechanisms that transfer parti-cles rapidly in the deep water column.
In synthesis two emerging fast sinking mechanisms havebeen captured:
1. Pulses of primary production, triggered by upwardcurrent vertical velocities, followed by grazing andmacrozooplankton-related biogenic flux that rapidlyconveys the material in the deep ocean.
2. Large Saharan dust events that fertilize the upper oceanand possibly contribute to aggregation of organic mate-rial, thus producing high sedimentation fluxes.
If these mechanisms are at work in other open ocean ar-eas, it is possible to argue that the carbon export to the deepocean is larger in the cyclonic gyres of the ocean general cir-culation and during the months of maximum upward verticalvelocities. The fast sinking rates estimated in this study couldbe moreover an evidence of the efficiency of the biologicalpump in sequestering organic carbon from the surface layersof the open areas of the Mediterranean Sea. Further work ishowever needed to unravel the relevant physical and biolog-ical features of the marine environment capable of affectingdeep particle fluxes.
Acknowledgements.This work has been supported by the ItalianProject VECTOR (VulnErability of the Italian coastal area andmarine Ecosystems to Climatic changes and Their rOle in theMediterranean caRbon cycles) funded by the Italian Ministry ofResearch and University (http://vector-conisma.geo.unimib.it/).Sediment trap samples were available for the study of biogenicparticles within an Italian-Dutch cooperation agreement. Mooringequipment was made available by NWO/ALW, through the DutchMarine Research Facilities at NIOZ; ship-time was funded alterna-tively by NWO and the Italian CoNISMa (National InteruniversityConsortium for Marine Sciences). The study of biogenic particleswas performed within the European Project BIODEEP (BIOtech-nologies from the DEEP, EVK3-2000-00042). The SeaWiFSderived products have been processed by CNR-ISAC, and obtainedfrom the E.C. Joint Research Centre, Institute for Environment andSustainability, through its MERSEA portal (FP6–EC project–SIP3-CT-2003-502885). The Ocean Biology Processing Group of NASAis also acknowledged for the distribution of the SeaWiFS raw data.
Edited by: A. Borges
References
Agostini, V. N. and Bakun, A.: “Ocean triads” in the Mediter-ranean Sea: physical mechanisms potentially structuring repro-ductive habitat suitability (with example application to Europeananchovy,Engraulis encrasicolus), Fish Oceanogr., 11(3), 129–142, 2002.
Alldredge, A. L. and Madin, L. P.: Pelagic tunicates – unique her-bivores in marine plankton, Bioscience, 32(8), 655–663, 1982.
Avancini M., Cicero, A. M., Di Girolamo, I., Innamorati, M., Ma-galetti, E., and Sertorio Zunini, T. (eds.): Guida al riconosci-mento del plancton dei mari italiani, Vol. II – Zooplancton ner-itico. Ministero dell’Ambiente e della Tutela del Territorio e delMare ICRAM, Roma, Italy, 192–206, 2006.
Bairbakhish, A. N., Bollmann, J., Sprengel, C., Thierstein, H. R.:Disintegration of aggregates and coccospheres in sediment trapsamples, Mar Micropaleontol, 37(2), 219–223, 1999.
Beauvais, S., Pedrotti, M. L., Villa, E., Lemee, R.: Transparent ex-opolymer particle (TEP) dynamics in relation to trophic and hy-drological conditions in the NW Mediterranean Sea, Mar. Ecol.-Prog. Ser., 262, 97–109, 2003.
Berelson, W.: Particle settling rates increase with depth in theocean, Deep-Sea Res Pt II, 49(1–3), 237–251, 2002.
Boldrin, A., Miserocchi, S., Rabitti, S., Turchetto, M. M. Balboni,V., and Socal, G.: Particulate matter in the southern Adriatic and
Biogeosciences, 6, 333–348, 2009 www.biogeosciences.net/6/333/2009/
L. Patara et al.: Particle fluxes and ocean vertical velocities 347
Ionian Sea: characterization and downward fluxes, J. Mar. Syst.,33, 389–410, 2002.
Bricaud, A., Bosc, E., and Antoine, D.: Algal biomass and sea sur-face temperature in the Mediterranean Basin – Intercomparisonof data from various satellite sensors, and implications for pri-mary production estimates, Remote Sens Environ, 81(2–3), 163–178, 2002.
Bruland, K. W. and Silver, M. W.: Sinking rates of fecal pelletsfrom gelatinous zooplankton (salps, pteropods, doliolids), Mar.Biol., 63(3), 295–300, 1981.
Buesseler, K. O.: The decoupling of production and particulate ex-port in the surface ocean, Global Biogeochem. Cy., 12(2), 297–310, 1998.
Buesseler, K. O., Antia, A. N., Chen, M., Fowler, S. W., Gardner, W.D., Gustafsson, O., Harada, K., Michaels, A. F., van der Loeff’o,M. R., Sarin, M., Steinberg, D. K., and Trull, T.: An assessmentof the use of sediment traps for estimating upper ocean particlefluxes, J. Mar. Res., 65(3), 345–416, 2007.
Casotti, R., Landolfi, A., Brunet, C., D’Ortenzio, F., Man-goni, O., Ribera d’Alcala, M., and Denis, M.: Compositionand dynamics of the phytoplankton of the Ionian Sea (east-ern Mediterranean), J. Geophys. Res.-Ocean., 108(C9), 8116,doi:10.1029/2002JC001541, 2003.
Conte, M. H., Ralph, N., and Ross, E. H.: Seasonal and interan-nual variability in deep ocean particle fluxes at the Oceanic FluxProgram (OFP)/Bermuda Atlantic Time Series (BATS) site in thewestern Sargasso Sea near Bermuda, Deep-Sea Res. Pt. II, 48(8–9), 1471–1505, 2001.
Conte, M. H., Dickey, T. D., Weber, J. C., Johnson, R. J., and Knap,A. H.: Transient physical forcing of pulsed export of bioreactivematerial to the deep Sargasso Sea, Deep-Sea Res. Pt. I, 50(10–11), 1157–1187, 2003.
De La Rocha, C. L. and Passow, U.: Factors influencing the sinkingof POC and the efficiency of the biological carbon pump, Deep-Sea Res. Pt. II, 54(5–7), 639–658, 2007.
Demirov, E. and Pinardi, N.: Simulation of the Mediterranean Seacirculation from 1979 to 1993: Part I. The interannual variability,J. Mar. Syst., 33, 23–50, 2002.
Ediger, D. and Yilmaz, A.: Characteristics of deep chlorophyll max-imum in the Northeastern Mediterranean with respect to environ-mental conditions, J. Mar. Syst., 9(3–4), 291–303, 1996.
Engel, A.: Distribution of transparent exopolymer particles (TEP)in the northeast Atlantic Ocean and their potential significancefor aggregation processes, Deep-Sea Res. Pt. I, 51(1), 83–92,2004.
Francois, R., Honjo, S., Krishfield, R., and Manganini, S.: Fac-tors controlling the flux of organic carbon to the bathypelagiczone of the ocean, Global Biogeochem. Cy., 16(4), 1087,doi:10.1029/2001GB001722, 2002.
Goldthwait, S. A. and Steinberg, D. K.: Elevated biomass of meso-zooplankton and enhanced fecal pellet flux in cyclonic and mode-water eddies in the Sargasso Sea, Deep-Sea Res. Pt. II, 55(10–13), 1360–1377, 2008.
Herut, B., Zohary, T., Krom, M. D., Mantoura, R. F. C., Pitta, P.,Psarra, S., Rassoulzadegan, F., Tanaka, T., and Thingstad, T. F.:Response of East Mediterranean surface water to Saharan dust:On-board microcosm experiment and field observations, Deep-Sea Res. Pt. II, 52(22–23), 3024–3040, 2005.
Honjo, S.: Fluxes of particles to the interior of the open oceans, in:
Particle Flux in the Ocean, edited by: Ittekkot, V., Schafer, P.,Honjo, S., and Depetris, P. J., SCOPE Published by John Wiley& Sons Ltd, 1996.
Honjo, S., Manganini, S. J., Krishfield, R. A., and Francois, R.:Particulate organic carbon fluxes to the ocean interior and fac-tors controlling the biological pump: A synthesis of global sed-iment trap programs since 1983, Prog. Oceanogr., 76(3), 217–285, 2008.
Ignatiades, L.: Scaling the trophic status of the Aegean Sea, easternMediterranean, J. Sea Res., 54 (1), 51–57, 2005.
Klaas, C. and Archer, D. E.: Association of sinking organic matterwith various types of mineral ballast in the deep sea: Implica-tions for the rain ratio, Global Biogeochem. Cy., 16(4), 1116,doi:10.1029/2001GB001765, 2002
Klein, B., Roether, W., Manca, B. B., Bregant, D., Beitzel, V., Ko-vacevic, V., and Luchetta, A.: The large deep water transient inthe Eastern Mediterranean, Deep-Sea Res. Pt. I, 46(3), 371–414,1999.
Knappertsbusch, M. and Brummer, G.-J. A.: A sediment trap in-vestigation of sinking coccolithophorids in the North-Atlantic,Deep-Sea Res. Pt. I, 42(7), 1083–1109, 1995.
Korres, G., Pinardi, N., and Lascaratos, A.: The ocean re-sponse to low-frequency interannual atmospheric variability inthe Mediterranean Sea. Part I: sensitivity experiments and energyanalysis, J. Climate, 13(4), 705–731, 2000.
Kubilay, N., Nickovic, S., Moulin, C., and Dulac, F.: An illustrationof the transport and deposition of mineral dust onto the easternMediterranean, Atmos. Environ., 34(8), 1293–1303, 2000.
Lee, C., Armstrong, R. A., Beck, A., Cochran, J. K., Wakeham, S.G., Peterson, M. L., and Miquel, J.-C.: MEDFLUX: Associa-tion of organic matter with ballast minerals in sinking particles.American Geophysical Union Fall Meeting, San Francisco (CA,USA), 13–17 December 2004, OS52A-02, 2004.
Levy, M., Klein, P., and Treguier, A. M.: Impact of sub-mesoscalephysics on production and subduction of phytoplankton in anoligotrophic regime, J. Mar. Res., 59(4), 535–565, 2001.
Lutz, M., Dunbar, R., and Caldeira, K.: Regional variabil-ity in the vertical flux of particulate organic carbon inthe ocean interior, Global Biogeochem. Cy., 16(3), 1037,doi:10.1029/2000GB001383, 2002.
Lutz, M. J., Caldeira, K., Dunbar, R. B., and Behrenfeld, M. J.:Seasonal rhythms of net primary production and particulate or-ganic carbon flux to depth describe the efficiency of biologicalpump in the global ocean, J. Geophys. Res.-Ocean., 112(C10),C10011, doi:10.1029/2006JC003706, 2007.
Madec, G., Delecluse, P., Imbard, M., and Levy, C.: OPA version8.1 Ocean General Circulation Model reference manual, Techni-cal Report, Note 11, LODYC/IPSL, Paris, France, 91 pp., 1998.
Mahadevan, A.: Modeling vertical motion at ocean fronts: Arenonhydrostatic effects relevant at submesoscales?, Ocean Model,14(3–4), 222–240, 2006.
Malanotte-Rizzoli, P., Manca, B. B., D’Alcala, M. R., Theocharis,A., Bergamasco, A., Bregant, D., Budillon, G., Civitarese, G.,Georgopoulos, D., Michelato, A., Sansone, E., Scarazzato, P.,and Souvermezoglou, E.: A synthesis of the Ionian Sea hydrog-raphy, circulation and water mass pathways during POEM PhaseI, Prog. Oceanogr., 39(3), 153–204, 1997.
Malanotte-Rizzoli, P., Manca, B. B., Ribera d’Alcala, M.,Theocharis, A., Brenner, S., Budillon, G., and Oszoy, E.: The
www.biogeosciences.net/6/333/2009/ Biogeosciences, 6, 333–348, 2009
348 L. Patara et al.: Particle fluxes and ocean vertical velocities
Eastern Mediterranean in the 80s and in the 90s: the big tran-sition in the intermediate and deep circulations, Dynam. Atmos.Ocean., 29(2–4), 365–395, 1999.
Malinverno, E., Ziveri, P., and Corselli, C.: Coccolithophorid distri-bution in the Ionian Sea and its relationship to eastern Mediter-ranean circulation during late fall to early winter 1997, J. Geo-phys. Res.-Ocean., 108(C9), 8115, doi:10.1029/2002JC001346,2003.
Manca, B. B., Budillon, G., Scarazzato, P., and Ursella,L.: Evolution of dynamics in the eastern Mediterranean af-fecting water mass structures and properties in the Ionianand Adriatic Seas, J. Geophys. Res.-Ocean., 108(C9), 8102,doi:10.1029//2002JC001664, 2003.
Markaki, Z., Oikonomou, K., Kocak, M., Kouvarakis, G., Chanio-taki, A., Kubilay, N., and Mihalopoulos, N.: Atmospheric de-position of inorganic phosphorus in the Levantine Basin, east-ern Mediterranean: Spatial and temporal variability and its rolein seawater productivity, Limnol. Oceanogr., 48(4), 1557–1568,2003.
Mazzocchi, M. G., Nervegna, D., D’Elia, G., Di Capua, I.,Aguzzi, L., and Boldrin, A.: Spring mesozooplankton com-munities in the epipelagic Ionian Sea in relation to the EasternMediterranean Transient, J. Geophys. Res.-Ocean., 108, 8114,doi:10.1029/2002JC001640, 2003.
McGillicuddy, D. J., Johnson, R., Siegel, D. A., Michaels, A. F.,Bates, N. R., and Knap, A. H.: Mesoscale variations of bio-geochemical properties in the Sargasso Sea, J. Geophys. Res.-Ocean., 104(C6), 13381–13394, 1999.
McGillicuddy, D. J., Kosnyrev, V. K., Ryan, J. P., and Yoder, J. A.:Covariation of mesoscale ocean color and sea-surface tempera-ture patterns in the Sargasso Sea, Deep-Sea Res. Pt. II, 48(8–9),1823–1836, 2001.
Molcard, A., Pinardi, N., Iskandarani, M., Haidvogel, D.B.: Winddriven general circulation of the Mediterranean Sea simulatedwith a Spectral Element Ocean Model, Dynam. Atmos. Ocean.,35(2), 97–130, 2002.
Pacanowski, R. C. and Gnanadesikan, A.: Transient response in az-level ocean model that resolves topography with partial cells,Mon. Weather Rev., 126(12), 3248–3270, 1998.
Pinardi, N. and Navarra, A.: Baroclinic wind adjustment processesin the Mediterranean Sea, Deep-Sea Res. Pt. II, 40(6), 1299–1326, 1993.
Pinardi, N. and Masetti, E.: Variability of the large scale gen-eral circulation of the Mediterranean Sea from observations andmodelling: a review, Palaeogeogr. Palaeocl., 158(3–4), 153–174,2000.
Pinardi, N., Arneri, E., Crise, A., Ravaioli, M., and Zavatarelli, M.:The physical, sedimentary and ecological structure and variabil-ity of shelf areas in the Mediterranean Sea, in: The Sea, Vol. 14,Harvard University Press, 1243–1330, 2005.
Pond, S. and Pickard, G. L.: Introductory Dynamical Oceanog-raphy, 2nd edition, Elsevier Butterworth-Heinemann, 349 pp.,1983.
Robinson, A. R., Hecht, A., Pinardi, N., Bishop, J., Leslie, W. G.,Rosentroub, Z., Mariano, A. J., and Brenner, S.: Small synopticmesoscale eddies and energetic variability of the Eastern Levan-tine Basin, Nature, 327(6118), 131–134, 1987.
Robinson, A. R., Sellschopp, J., Warn-Varnas, A., Leslie, W. G.,Lozano, C. J., Haley, P. J., Anderson, L. A., and Lermusiaux, P.F. J.: The Atlantic Ionian Stream, J. Mar. Syst., 20(1–4), 129–156, 1999.
Sarmiento, J. L. and Gruber, N.: Ocean Biogeochemical Dynamics,Princeton University Press, Princeton, NJ, USA, 318–358, 2006.
Sciarra, R., Boehm, E., D’Acunzio, E., and Santoleri, R.: The largescale observing system component of ADRICOSM: the satellitesystem, Acta Adriatica, 47, 51–64, 2006.
Siegel, D. A., Fields, E., and Buesseler, K. O.: A bottom-up viewof the biological pump: Modeling source funnels above oceansediment traps, Deep-Sea Res. Pt. I, 55(1), 108–127, 2008.
Stemmann, L., Gorsky, G., Marty, J.C., Picheral, M., and Miquel,J. C.: Four-year study of large-particle vertical distribution (0–1000 m) in the NW Mediterranean Sea in relation to hydrology,phytoplankton, and vertical flux, Deep-Sea Res. Pt. II, 49(11),2143–2162, 2002.
Sweeney, E. N., McGillicuddy, D. J., and Buesseler, K. O.: Biogeo-chemical impacts due to mesoscale eddy activity in the SargassoSea as measured at the Bermuda Atlantic Time-series Study(BATS), Deep-Sea Res. Pt. II, 50(22–26), 3017–3039, 2003.
Tonani, M., Pinardi, N., Dobricic, S., Pujol, I., and Fratianni, C.:A high-resolution free-surface model of the Mediterranean Sea,Ocean Science, 4(1), 1–14, 2008.
Trull, T. W., Bray, S. G., Buesseler, K. O., Lamborg, C. H., Man-ganini, S., Moy, C., and Valdes, J.: In situ measurement ofmesopelagic particle sinking rates and the control of carbontransfer to the ocean interior during the Vertical Flux in theGlobal Ocean (VERTIGO) voyages in the North Pacific, Deep-Sea Res. Pt. II, 55(14–15), 1684–1695, 2008.
Turner, J. T.: Zooplankton fecal pellets, marine snow and sink-ing phytoplankton blooms, Aquat. Microb. Ecol., 27(1), 57–102,2002.
Volpe, G., Banzon, V. F., Evans, R. H., and Mariano, A. J.: Satelliteobservations of the impact of dust in a low nutrient low chloro-phyll region: fertilization or artifact?, submitted, 2009.
Yoon, W. D., Marty, J. C., Sylvain, D., and Nival, P.: Degradationof faecal pellets in Pegea confoederata (Salpidae, Thaliacea) andits implication in the vertical flux of organic matter, J. Exp. Mar.Biol. Ecol., 203(2), 147–177, 1996.
Yoon, W. D., Kim, S. K., and Han, K. N.: Morphology and sinkingvelocities of fecal pellets of copepod, molluscan, euphasiid, andsalp taxa in the northeastern tropical Atlantic, Mar. Biol., 139,923–928, 2001.
Ziveri, P., Rutten, A., de Lange, G. J., Thomson, J., and Corselli,C.: Present-day coccolith fluxes recorded in central easternMediterranean sediment traps and surface sediments, Palaeo-geogr. Palaeocl., 158(3–4), 175–195, 2000.
Zuniga, D., Calafat, A., Heussner, S., Miserocchi, S., Sanchez-Vidal, A., Garcia-Orellana, J., Canals, M., Sanchez-Cabeza, J.A., Carbonne, J., Delsaut, N., and Saragoni, G.: Compositionaland temporal evolution of particle fluxes in the open Algero-Balearic basin (Western Mediterranean), J. Mar. Syst., 70(1–2),196–214, 2008.
Biogeosciences, 6, 333–348, 2009 www.biogeosciences.net/6/333/2009/