particularities of risk management for funds of hedge funds
TRANSCRIPT

A member of the Man GroupJune 2008
Particularities of Risk Management for Funds of Hedge Funds
Pierre-Yves Moix, Chief Risk Officer of Man Investments

2
Disclaimer and important information
This presentation is communicated by Man Investments Ltd. which is authorised and regulated by the Financial Services Authority. This material is for information purposes only. It is proprietary information of Man Investments Ltd. and its affiliates and may not be reproduced or otherwise disseminated in whole or in part without prior written consent from Man Investments Ltd. Information contained herein is provided from the Man database except where otherwise stated.
www.maninvestments.com
3
Context
Strategy risk management
Proactive risk management
Continuous risk management
Operational risk management
Liquidity risk management
Conclusion
4
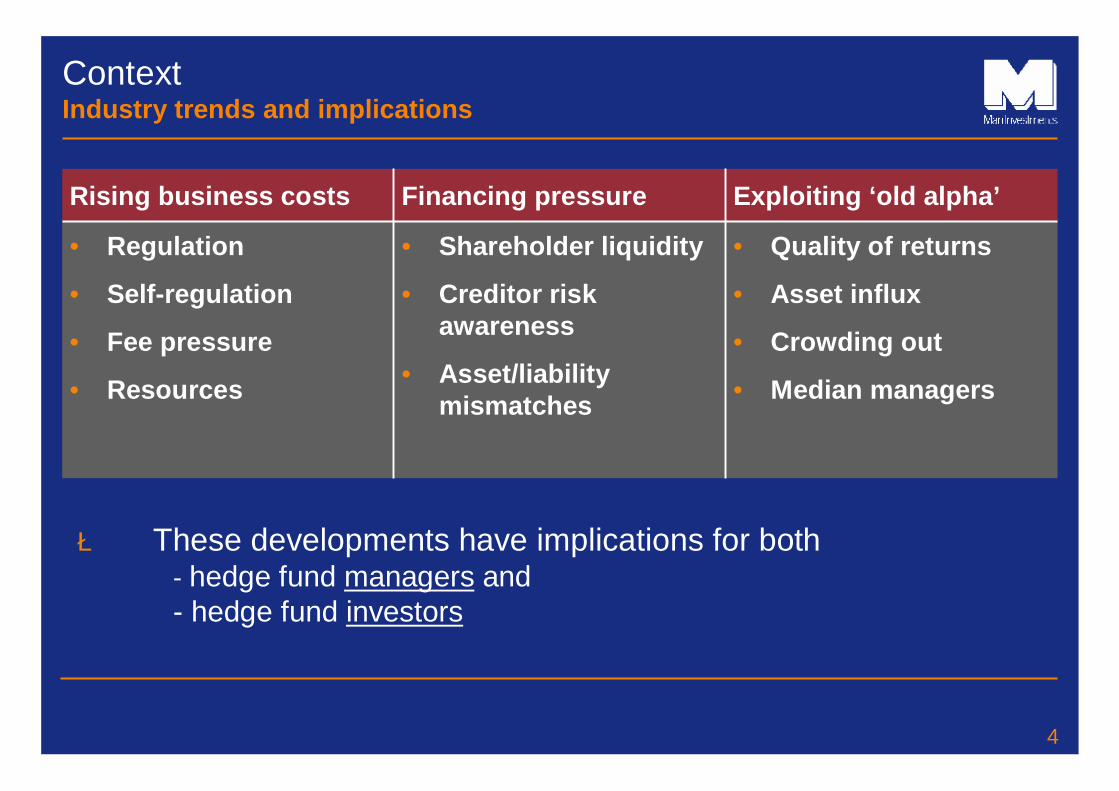
ContextIndustry trends and implications
• Quality of returns
• Asset influx
• Crowding out
• Median managers
• Shareholder liquidity
• Creditor risk awareness
• Asset/liability mismatches
• Regulation
• Self-regulation
• Fee pressure
• Resources
Exploiting ‘old alpha’ Financing pressureRising business costs
è These developments have implications for both - hedge fund managers and - hedge fund investors

5
ContextIt’s not all about market/strategy risk I/II
Liquidity risk
Operational risk (complexity)
Financing risk(leverage)
The other dimensions of risks
Schematic illustration
6
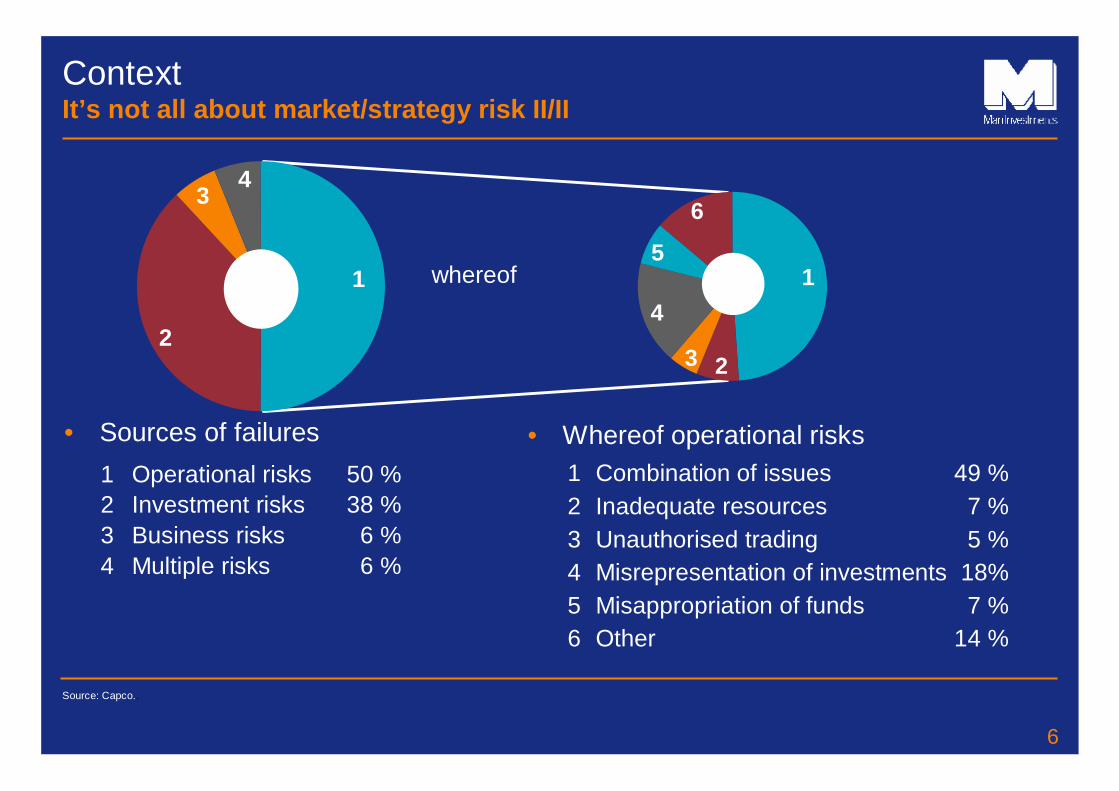
ContextIt’s not all about market/strategy risk II/II
Source: Capco..
6 %Multiple risks46 %Business risks3
38 %Investment risks250 %Operational risks1
• Sources of failures1 Combination of issues 49 %2 Inadequate resources 7 %3 Unauthorised trading 5 %4 Misrepresentation of investments 18%5 Misappropriation of funds 7 %6 Other 14 %
• Whereof operational risks
13
4
53
4
5
whereof1
3
2
4
1
3 2
4
5
6

7
Context
Strategy risk management
Proactive risk management
Continuous risk management
Operational risk management
Liquidity risk management
Conclusion

8
Strategy risk managementOverview
SlideID-16431
Asset allocation• Managing tails and correlations
• Inclusion of financial crisis scenarios
Portfolio management• Diversification advantage
• Managing liquidity gaps
Hedge fund selection• Structural choices and related degree of
transparency require different risk management tools, i.e. fund versus managed account investments
Fund / MAC
Risk management
Styles’ risk/return characteristics
Allocation optimiser
Approved funds
Asset allocation
Portfolio construction
9
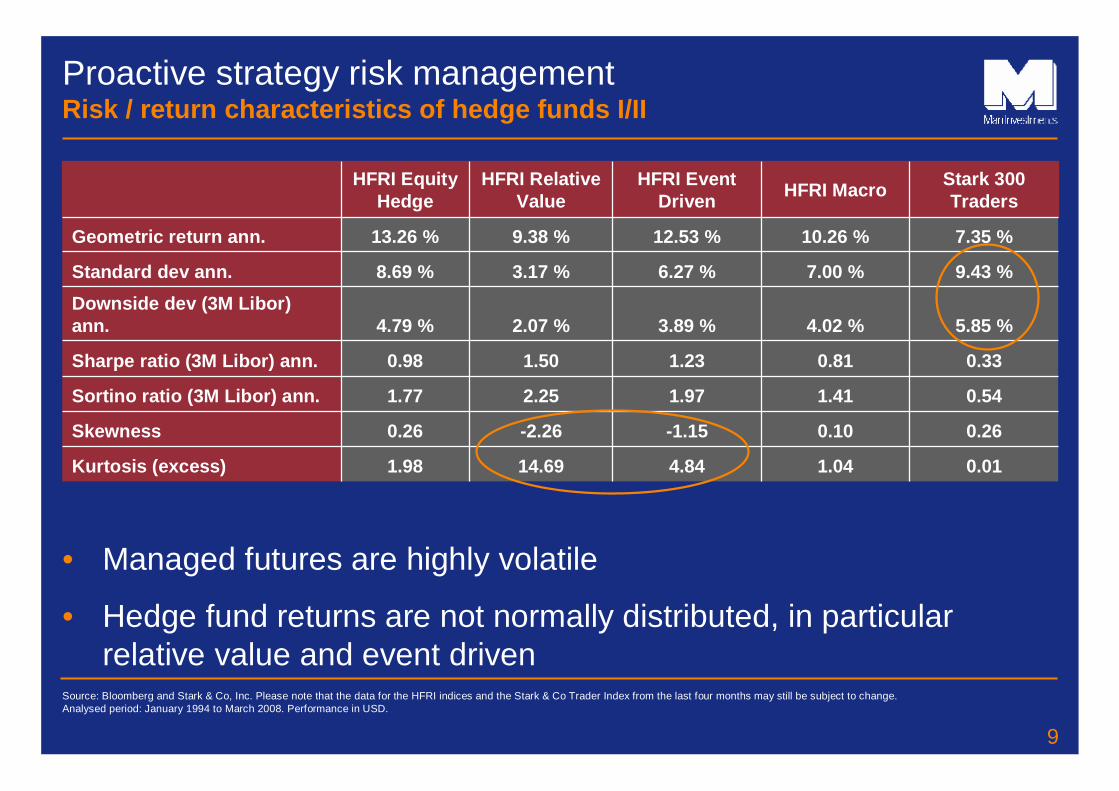
Proactive strategy risk managementRisk / return characteristics of hedge funds I/II
• Managed futures are highly volatile
• Hedge fund returns are not normally distributed, in particular relative value and event driven
Source: Bloomberg and Stark & Co, Inc. Please note that the data for the HFRI indices and the Stark & Co Trader Index from the last four months may still be subject to change. Analysed period: January 1994 to March 2008. Performance in USD.
0.011.044.8414.691.98Kurtosis (excess)
0.260.10-1.15-2.260.26Skewness
0.541.411.972.251.77Sortino ratio (3M Libor) ann.
0.330.811.231.500.98Sharpe ratio (3M Libor) ann.
5.85 %4.02 %3.89 %2.07 %4.79 %Downside dev (3M Libor) ann.
9.43 %7.00 %6.27 %3.17 %8.69 %Standard dev ann.
7.35 %10.26 %12.53 %9.38 %13.26 %Geometric return ann.
Stark 300 TradersHFRI MacroHFRI Event
DrivenHFRI Relative
ValueHFRI Equity
Hedge

10
Proactive strategy risk managementRisk / return characteristics of hedge funds II/II
èOmega includes all higher momentsSource: Bloomberg.Analysed period: January 1994 to March 2008.Please note that the HFRI index data over the past 4 months may be subject to change.
Threshold -8 % -6 % -4 % -2 % 0 % 2 % 4 % 6 % 8 %Lo
g (o
meg
a)
-15
-10
-5
0
5
10
15
20HFRI Fund of Funds Composite IndexNormal equivalent

11
Proactive strategy risk managementCorrelations I/III
èManaged futures are uncorrelated
èComparatively high correlation of event driven with equity hedged and to a lesser extent with relative value strategies
1.00.50.0-0.10.0Stark 300 Traders
0.51.00.60.40.6HFRI Macro
0.00.61.00.70.8HFRI Event Driven
-0.10.40.71.00.6HFRI Relative Value
0.00.60.80.61.0HFRI Equity Hedge
Stark 300 TradersHFRI MacroHFRI Event
Driven
HFRI Relative
Value
HFRI Equity Hedge
Source: Bloomberg and Stark & Co, Inc. Please note that the data for the HFRI indices and the Stark & Co Trader Index from the last four months may still be subject to change. Analysed period: January 1994 to March 2008. Performance in USD.

12
Proactive strategy risk managementCorrelations II/III
• Hedge funds should provide diversification for traditional investments
• Currently, high correlations across styles and with regard to traditional investments
– Is this unusual?
– Is there an explanation?
24M rolling measured correlations
1996 1997
1998 1999
2000 2001
2002 2003
2004 2005
2006 2007
2008 Ann
ualis
ed re
turn
-40 %
-30 %
-20 %
-10 %
0 %
10 %
20 %
30 %
40 %
Cor
rela
tion
-1.0
-0.8
-0.6
-0.4
-0.2
0.0
0.2
0.4
0.6
0.8
1.0
World equitiesHFRI RVAHFRI EHHFRI EDHFRI MacroStark MF
Source: Bloomberg and Stark & Co, Inc. Please note that the data for the HFRI indices and the Stark & Co Trader Index from the last four months may still be subject to change. Analysed period: January 1996 to March 2008. Performance in USD.

13
Proactive strategy risk managementCorrelations III/III
• Managed futures have non-linear links to traditional investments
• Alternative risk factors are needed to explain hedge fund returns
Source: Bloomberg and Stark & Co, Inc. Period of analysis: January 1994 – March 2008. Please note that the HFRI index and Stark & Co Trader Index data over the past 4 months may be subject to change. World stocks are proxied by MSCI World Total Return Index, world bonds by Citigroup WGBI all maturities
Stark MF
Worst months Quintile 2 Quintile 3 Quintile 4 Best months
Cor
rela
tion
-0.6-0.5-0.4-0.3-0.2-0.10.00.10.20.30.40.50.6
Correlations with world stocksCorrelations with world bonds
Stark MF
MSCI World monthly return
-10 %
-5 %
0 %
5 %
10 %
15 %
-10 % -5 % 0 % 5 % 10 % 15 %
Star
k M
F m
onth
lyre
turn
Stark MF Poly. (Stark MF) Linear (Stark MF)
Stark MF
-10 %
-5 %
0 %
5 %
10 %
15 %
-10 % -5 % 0 % 5 % 10 % 15 %
Citigroup WGBI monthy return
Star
k M
F m
onth
lyre
turn
Stark MF Poly. (Stark MF) Linear (Stark MF)

14
Context
Strategy risk management
Proactive risk management
Continuous risk management
Operational risk management
Liquidity risk management
Conclusion
15
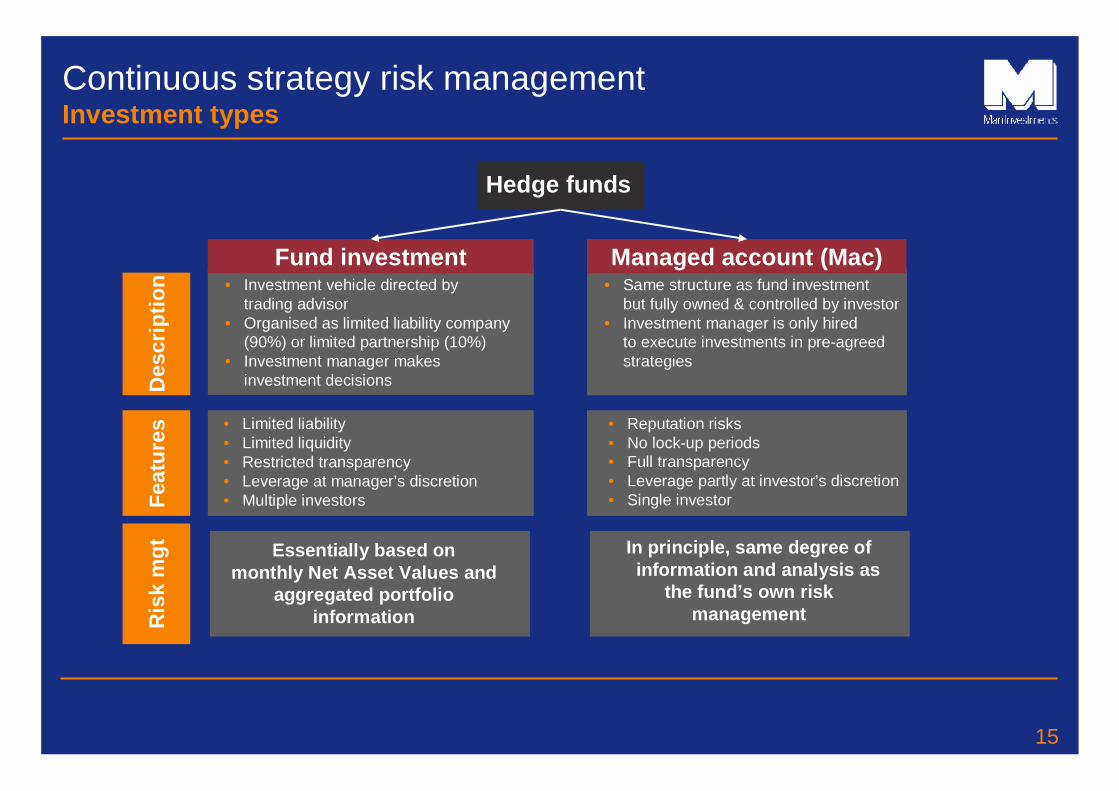
Continuous strategy risk managementInvestment types
Hedge funds
Fund investment• Investment vehicle directed by
trading advisor• Organised as limited liability company
(90%) or limited partnership (10%) • Investment manager makes
investment decisions
• Limited liability• Limited liquidity• Restricted transparency• Leverage at manager’s discretion• Multiple investors
Managed account (Mac)
• Reputation risks • No lock-up periods• Full transparency• Leverage partly at investor’s discretion• Single investor
• Same structure as fund investmentbut fully owned & controlled by investor
• Investment manager is only hired to execute investments in pre-agreed strategies
Des
crip
tion
Feat
ures
Ris
k m
gt Essentially based on monthly Net Asset Values and
aggregated portfolio information
In principle, same degree of information and analysis as
the fund’s own risk management

16
Continuous strategy risk managementThe three levels of transparency
• Managers who pursue more liquid strategies, with a shorter track record and a higher strategy capacity tend to provide position information
• Managers who pursue less liquid strategies, with longer track records and a smaller strategy capacity tend to provide NAV & exposure information
Positions
NAV
Exposure &performance attribution
17
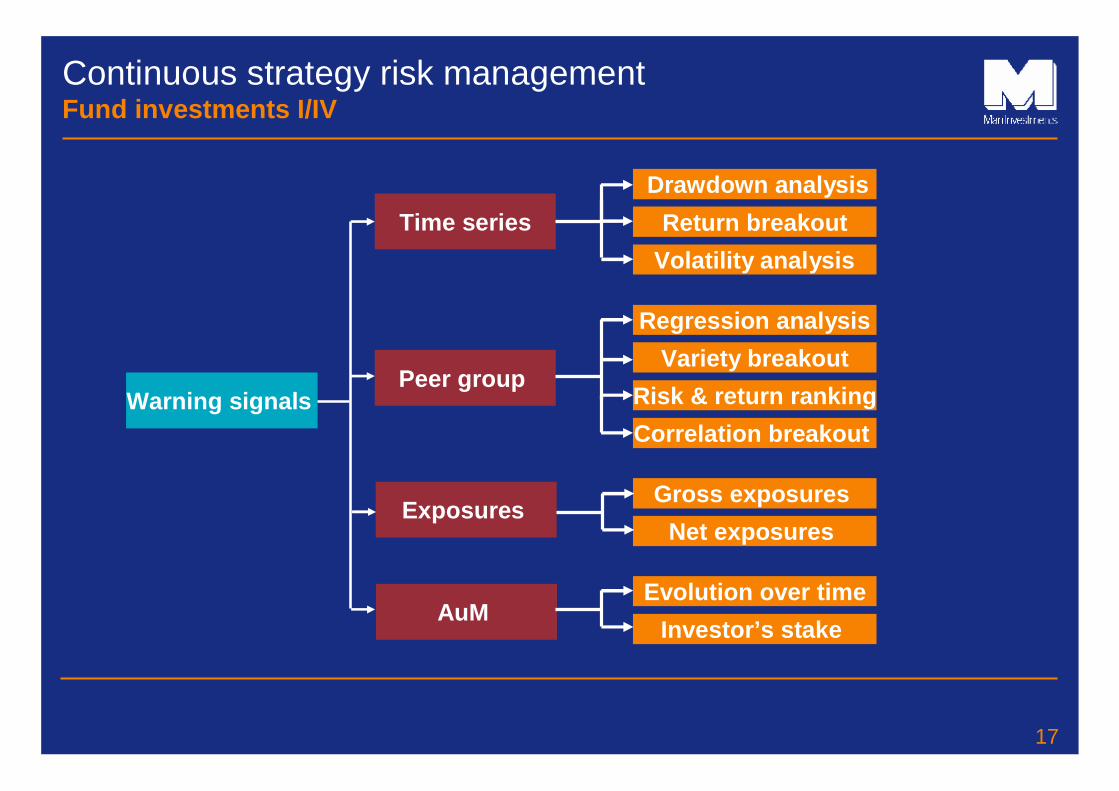
Continuous strategy risk managementFund investments I/IV
Warning signals
Time series
Peer group
Drawdown analysisReturn breakout
Regression analysis
Correlation breakout Risk & return ranking
Variety breakout
Gross exposures
Volatility analysis
Exposures Net exposures
Evolution over timeInvestor’s stake
AuM

18
Continuous strategy risk managementFund investments II/IV
Source: RMF Investment Management and Bloomberg. There is no guarantee of trading performance and past performance is not necessarily a guide to future results.
Under water chart
Year 1 Year 2 Year 3 Year 4 Year 5 Year 6 Year 7
500
600
700
800
900
1000
HFRI Relative Value Arbitrage IndexMSCI World
Relative value fundYear 1 Year 2 Year 3 Year 4 Year 5 Year 6 Year 7 Year 8

19
Continuous strategy risk managementFund investments III/IV
Source: RMF Investment Management and Bloomberg. There is no guarantee of trading performance and past performance is not necessarily a guide to future results.
Time series of monthly returns
Year 1 Year 2 Year 3 Year 4 Year 5 Year 6 Year 7
-4 %
-2 %
0 %
2 %
4 %
6 %
8 %
Relative value fundRisk bound 2 stdev (ltd)Risk bound 2 stdev (12 month)
warning signals
warning signals

20
Continuous strategy risk managementFund investments IV/IV
Source: RMF Investment Management. There is no guarantee of trading performance and past performance is not necessarily a guide to future results..
Ranking of peer group 12 months downside deviation
Peer group rankingNumber of funds
Year 1 Year 2 Year 3 Year 4 Year 5 Year 6 Year 7
0 %
20 %
40 %
60 %
80 %
100 % Num
berof fundsin peergroup0
10
20
30
40
50
60

21
Continuous strategy risk managementManaged Accounts I/III
Limits, Restrictions
VaR
Equity leverage
Risk
P&L
Outliers
Drawdowns
Other
Margin to equity ratio
Approved instruments,markets, sectors
Risk factor sensitivities,stress tests
Backtesting exceptions
If contractually agreed
Soft exceptionHard exception

22
Continuous strategy risk managementManaged Accounts II/III

23
Continuous strategy risk managementManaged Accounts III/III
MAC XXXMAC YYYMAC ZZZ
….

24
Context
Strategy risk management
Proactive risk management
Continuous risk management
Operational risk management
Liquidity risk management
Conclusion

25
Operational risk management Operational due diligence (OpDD) approaches compared
• Basic OpDD approaches– Governance focus
– Quantitative data
– Less qualitative assessment required
• Fundamental OpDD approaches
– Value chain/management control focus
– Quantitative & qualitative data
– Requires assessment/ interpretation
Investor
Investment firm
Basicapproaches
Investment process
Investor
Investment firm
Fundamentalapproaches
26
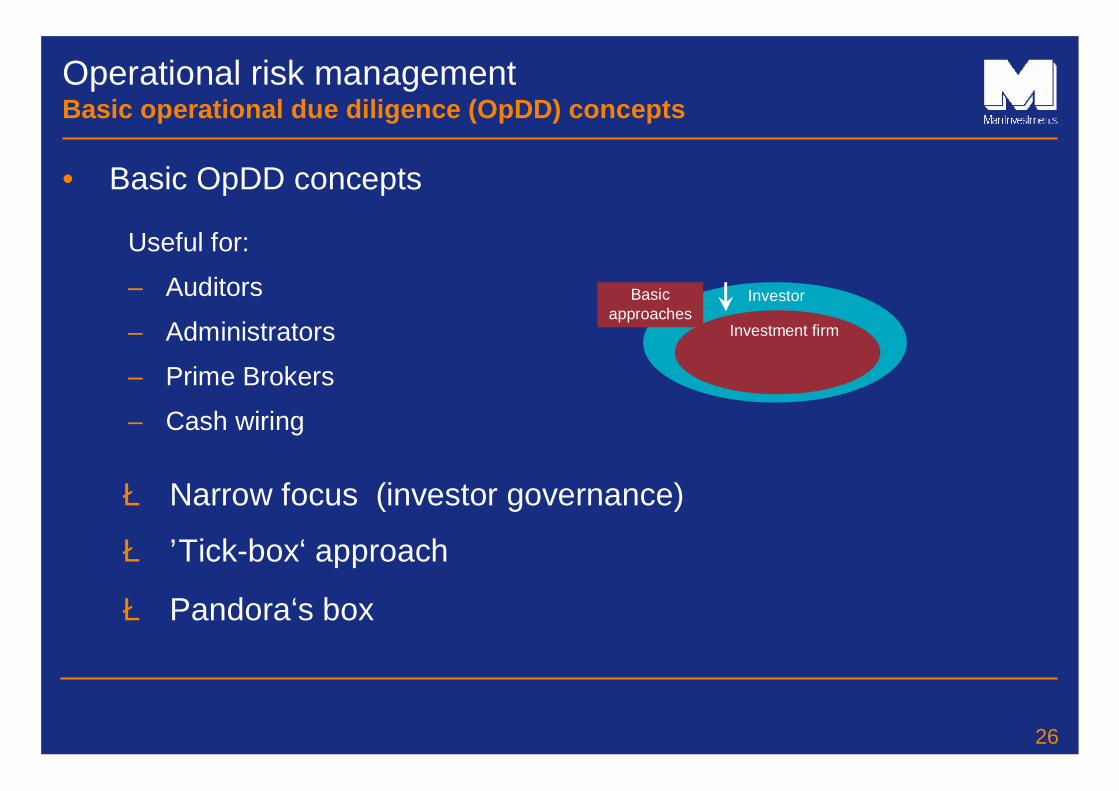
Operational risk managementBasic operational due diligence (OpDD) concepts
• Basic OpDD concepts
Useful for:
– Auditors
– Administrators
– Prime Brokers
– Cash wiring
è Narrow focus (investor governance)
è ’Tick-box‘ approach
è Pandora‘s box
Investor
Investment firm
Basicapproaches

27
Operational risk management Fundamental operational due diligence (OpDD) concepts
• Fundamental OpDD concepts
è Broader focus (value chain)
è Skill-based approach
è Framework-based
Investment process
Investor
Investment firm
Fundamentalapproaches
Typical focus areas:
– Governance
– Roles & responsibilities
– Controlling and accounting
– Outsourcing

28
• Combining the operational risk dimensions with the scope of the due diligence
Operational risk managementFundamental operational due diligence concepts
è Methodology of ‘Slicing-and-dicing’
+ =• Establishes
common understanding
• Dimensions of operational risks
Operational risk definition
Operational risk model
• Defines the scope of the operational due diligence
Operational risk assessment matrix

29
• Operational risk definition – four dimensions• Processes Activities to achieve desired outcomes
• People Human resources to service processes and systems
• Systems Technologies to support processes and people
• External events Incidences disrupting internal activities
Assessing operational riskOperational risk definition by the Basle Committee
èProcesses, people and systems are internal risk dimensions and can be compared across organisations
èExternal events are not fully controllable and are context-specific

30
Assessing operational risk Operational risk model
Functional responsibilitiesTrading
Legal and complianceRisk management
Operations and controllingTrade processing and settlement monitoring
Accounting and MIS reportingPortfolio valuation and performance measurement
Business managementGovernance, policies and procedures
Infrastructure, IT and business continuityOrganisational structure and human resources
• Sources of operational risks for hedge funds
Internal sourcesExternal sources
Fund administrator
Valuation agent
(Prime) Broker(s)
Otherse.g. lawyers, consultants
Outsourcing 1
2
3
4
31
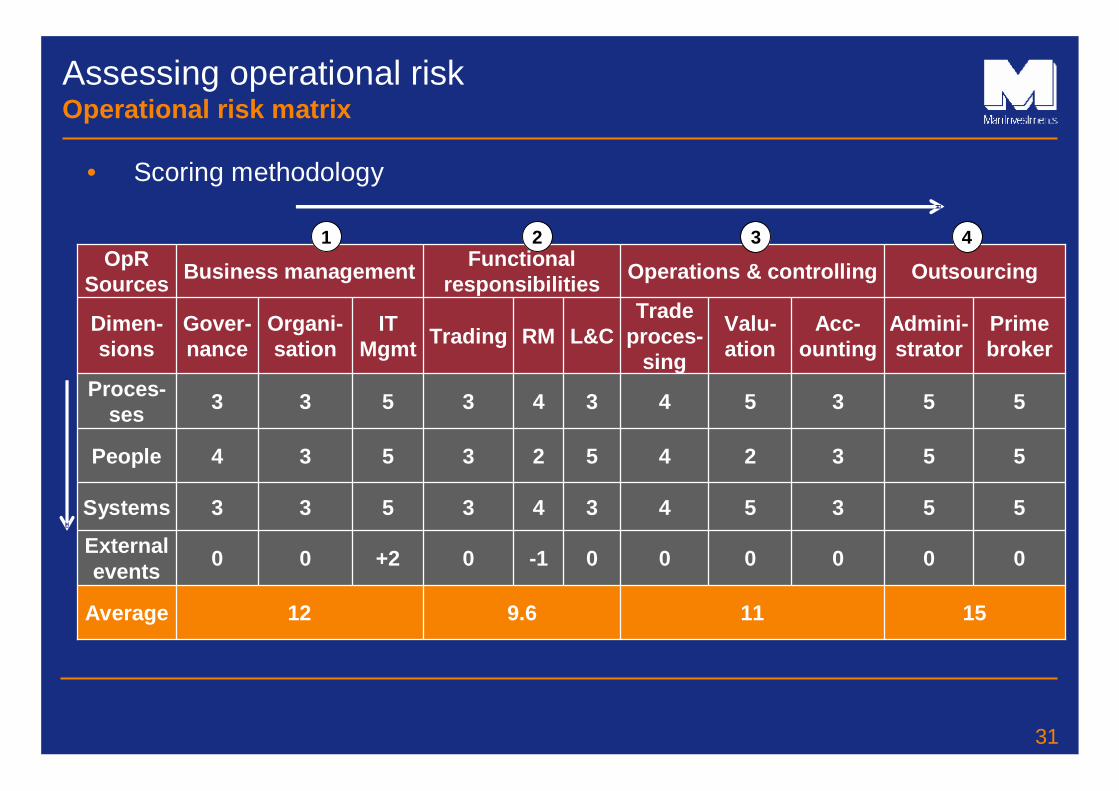
Assessing operational riskOperational risk matrix
• Scoring methodology
15119.612Average
000000-10+200External events
55354343533Systems
55324523534People
55354343533Proces-ses
Prime broker
Admini-strator
Acc-ounting
Valu-ation
Trade proces-
singL&CRMTrading IT
MgmtOrgani-sation
Gover-nance
Dimen-sions
OutsourcingOperations & controllingFunctional responsibilitiesBusiness managementOpR
Sources
1 2 3 4
32
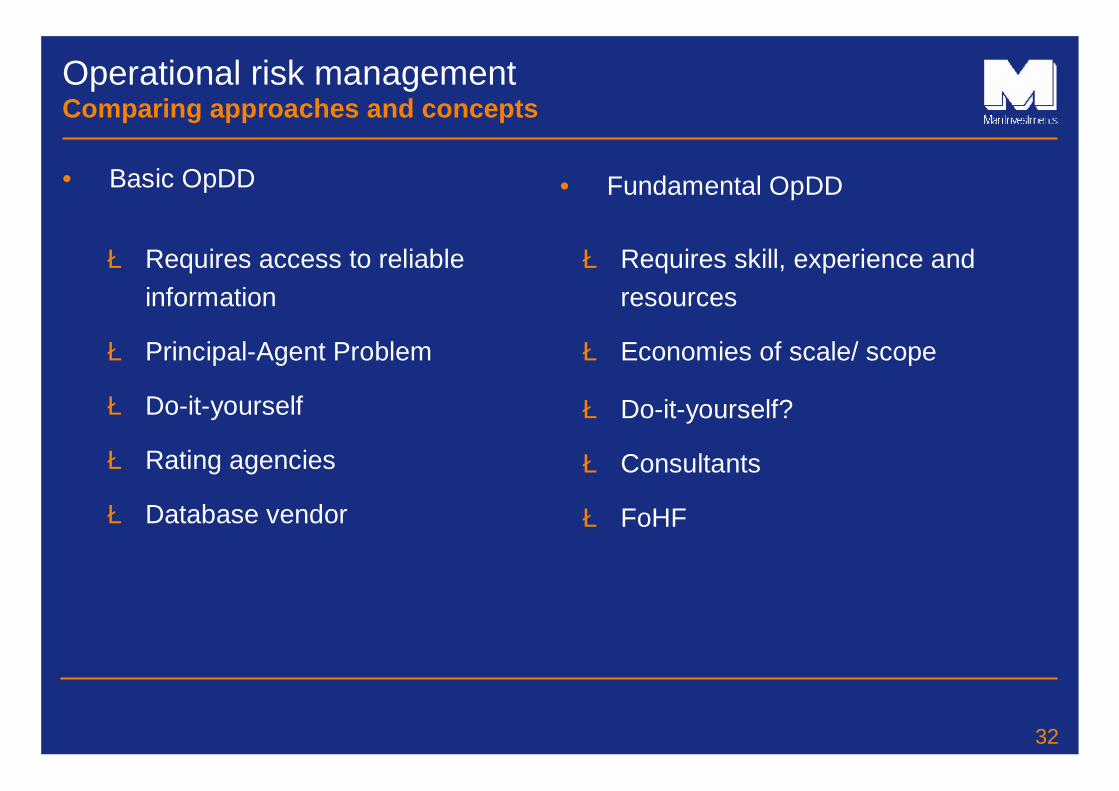
Operational risk management Comparing approaches and concepts
• Basic OpDD • Fundamental OpDD
è Requires access to reliable information
è Principal-Agent Problem
è Requires skill, experience and resources
è Economies of scale/ scope
è Do-it-yourself
è Rating agencies
è Database vendor
è Do-it-yourself?
è Consultants
è FoHF
33
Context
Strategy risk management
Proactive risk management
Continuous risk management
Operational risk management
Liquidity risk management
Conclusion
34
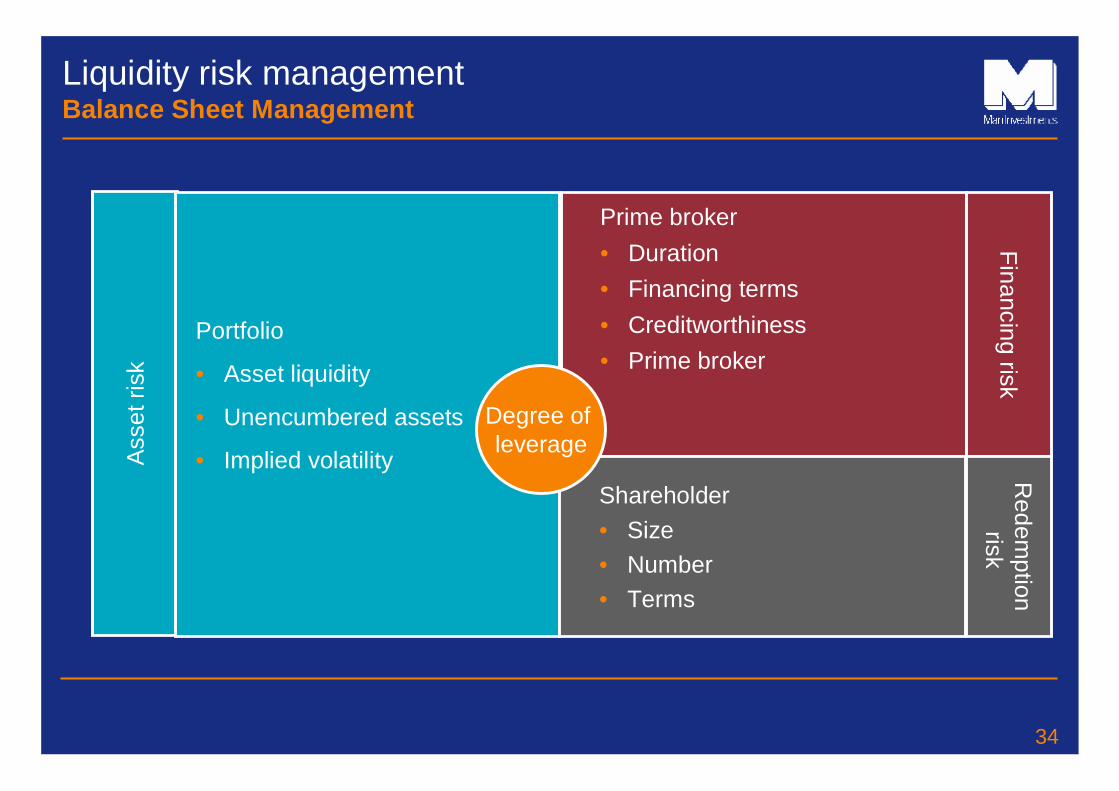
Ass
et ri
sk
Portfolio
• Asset liquidity
• Unencumbered assets
• Implied volatility
Prime broker• Duration• Financing terms• Creditworthiness• Prime broker
Financing risk
Shareholder• Size• Number• Terms
Redem
ptionrisk
Degree of leverage
Liquidity risk managementBalance Sheet Management

35
Liquidity risk managementRedemption timeline of a hedge fund
End of lockupperiod
Hard lockup period
Notice period
No redemption is allowed
Redemption period
Time
Bal
ance
pay
out
settl
emen
t dat
e
Sub
scrip
tion
date
Cal
cula
tion
date
Sta
rt of
bal
ance
pay
out p
erio
d
Initi
al p
ayou
t se
ttlem
ent d
ate
Red
empt
ion
date
Initial payout period
Balance payout period
Not
ice
date
Cash flows from hedge fund redemption
èExpected cash flows from a hedge fund redemption taking into account lock up, notice period, redemption frequency, and payoutterms

36
Liquidity risk managementRedemption strategies for a portfolio of hedge funds
t t + 1 t + 2 ….
Hedge fund redemptions Cumulative gapClient redemptions
• Hedge funds redeemed proportionally
è Structural liquidity mismatch in fund of hedge funds creates a cash flow gap
• Most liquid hedge funds redeemed first
t t + 1 t + 2 ….è Cash flow gap is minimised

37
Liquidity risk management Scenario analysis
XYZ Breakdown 14.4% 36.1% 35.3% 8.9% 5.4%
Notice period: 90 day(s) Redemption frequency: Quarterly First payment date: Cumulative 14.4% 50.5% 85.8% 94.6% 100.0%
Legal monthly liquidity: 28.1% Fraction of portfolio with LockUp: 37%
Assets 2,128,445,329 2,128,445,329 Liabilities Liquid ity gaps analysisPortfolio 2,040,781,862 2,073,436,926 Net Assets
>>> Cash 87,663,466 55,008,403 Loans
Direct available credit line(*) 195,000,000Other sources of credit line noneAdditional USD credit line (manual) -Aggregation methodology Bottom UpRedemption strategy Proportional
Use of cash 15.00% 13,149,520
Redemptions of assets 15.00% 306,117,279
Sum of draws of credit facility 39,000,000
Sum of repayments of credit facility -39,000,000
Repayment of current loans 15.00% -8,251,260
Client redemptions 15.00% -311,015 ,539
Deficiency of cash, Gap, during redemption process no gap no gap no gap no gap no gap 2.0% 0.1% no gap no gap no gap no gapExcess of cash during redemption process - - - - - 6.3 0.3 - - - -
Quarterly(*)Direct credit line is granted to the product itself, - - - - - 100.0% - - - - - -full amount availability is subject to conditions - - - - - 311 - - - - - -
Nb HF before Nb HF after Cumulated liquid ity profile (** )
redemption redemption CAA (no TAA)
[77] - Asset allocation - [77] Alloc. afterCash redemption[17] - Equity hedged - [17] 20.80% 14.35% 20.80% w
[21] - Relative value - [21] 28.68% 20.02% 28.68% w
[17] - Event driven - [17] 21.11% 18.76% 21.11% w
[11] - Global macro - [11] 17.60% 15.34% 17.60% w
[11] - Managed futures - [11] 11.81% 7.40% 11.81% w
[0] - Other - [0] 24.13%Use of credit facility
incl. CL 10.3% 22.3% 46.4% 60.4% 64.5% 98.0% 99.9% 100.0% 100.0% 100.0% 100.0% 100.0%
(**)Total amount recovered divided by total amount due to investors and credit providers excl. CL 10.3% 22.3% 46.4% 60.4% 64.5% 85.8% 87.7% 87.9% 87.9% 87.9% 88.2% 94.7%
-
Product XYZ
Liquidity Analysis
20.00%
no gap
as of 31 Jan 2008
Veryliquid <3M
Liquid
<6M
Illiquid
<12M
Veryilliquid
>1Y
Highlyliquid <1M
Cumulative Gap: (%)(MUSD)
Redemption to clients: (%)(MUSD)
Current allocation
Switch to target alloc.
Jul 2008
Cha
nge
-400
-300
-200
-100
0
100
200
300
Feb-08 Mar-08 Apr-08 May-08 Jun-08 Jul-08 Aug-08 Sep-08 Oct-08 Nov-08 Dec-08 Jan-09
0%
20%
40%
60%
80%
100%
120%
38
Context
Strategy risk management
Proactive risk management
Continuous risk management
Operational risk management
Liquidity risk management
Conclusion
39
Conclusion
è Risk is multidimensional
è It’s not all about strategy risk
è The operational and financing/liability side is also important
è Those risks are closely interrelated and have to be addressed inan integrated manner
è Risk management needs a combined qualitative and quantitative approach
è Not a single ratio but a combination of measures gives insight into an investment