particulate source apportionment technology modeling results
TRANSCRIPT

Appendix E-7a
Particulate Source Apportionment Technology
Modeling Results

This page intentionally left blank.

Particulate Source Apportionment Technology Modeling Results
Task 7
Prepared for:
Southeastern States Air Resource Managers, Inc. 205 Corporate Center Dr., Suite D
Stockbridge, GA 30281-7383
Under Contract No. V-2018-03-01
Prepared by: Alpine Geophysics, LLC
387 Pollard Mine Road Burnsville, NC 28714
and
Eastern Research Group, Inc.
1600 Perimeter Park Dr., Suite 200 Morrisville, NC 27560
Final – August 31, 2020
Alpine Project Number: TS-527 ERG Project Number: 4133.00.006

Particulate Source Apportionment Technology Modeling Results
August 31, 2020 i
This page is intentionally blank.

Particulate Source Apportionment Technology Modeling Results
August 31, 2020 ii
Contents Page
1.0 Introduction ..........................................................................................................................1
2.0 PSAT Overview ...................................................................................................................2
3.0 PSAT Tags ...........................................................................................................................3
4.0 PSAT Post-Processing .......................................................................................................13
5.0 Process for Creating PSAT Contributions for Class I Areas .............................................13
6.0 Sector Tag Results .............................................................................................................15 6.1 Area By Sector .......................................................................................................15 6.2 Sector to Area ........................................................................................................16 6.3 Facility to Area ......................................................................................................17 6.4 Stacked Bar S and N by Area ................................................................................17 6.5 Region Sector to Area ............................................................................................19 6.6 Boundary to Area ...................................................................................................19
7.0 PSAT DAY-to-Day Analysis .............................................................................................20 Attachment A – PSAT Tagging Results Attachment B – Day-By-Day Results
TABLES Table 3-1. Round 1 SESARM Defined Regional-Category Combination Tags .............................4
Table 3-2. Round 1 SESARM-Defined Individual Facility Tags ....................................................6
Table 3-3. Round 2 SESARM Defined Regional-Category Combination Tags .............................9
Table 3-4. Round 2 SESARM-Defined Individual Facility Tags ..................................................11
Table 4-1. Matching of CAMx Raw Output Species to SMAT Input Variables ...........................13
Table 5-1. Matching of “Bulk Raw Species”, PSAT Output Species, and SMAT Input Variables ............................................................................................................................14
FIGURES Figure 6-1. Area by Sector PivotChart and Table Example ..........................................................15
Figure 6-2. Sector to Area PivotChart and Table Example ...........................................................16
Figure 6-3. Facility to Area PivotChart and Table Example .........................................................17
Figure 6-4. Stacked Bar S and N by Area PivotChart and Table Example ...................................18
Figure 6-5. Region Sector to Area PivotChart Example ................................................................19

Particulate Source Apportionment Technology Modeling Results
August 31, 2020 iii
Figure 6-6. Boundary to Area PivotChart Example.......................................................................20
Figure 7-1. 2028 Modeled Light Extinction Impairment at Wolf Island on 20% Clearest Days ..21
Figure 7-2. 2028 Modeled Light Extinction Impairment at Wolf Island on 20% Most Impaired Days ....................................................................................................................22

Particulate Source Apportionment Technology Modeling Results
August 31, 2020 iv
Abbreviations/Acronym List
Alpine Alpine Geophysics, LLC AOI Area of Influence bext Beta (or light) extinction CAMx Comprehensive Air Quality Model with Extensions CCRS Coarse PM species (CAMx PM species) CenRAP Central Regional Air Planning CPRM Coarse PM EGU Electric Generating Unit EPA United States Environmental Protection Agency ERG Eastern Research Group, Inc. ERTAC Eastern Regional Technical Advisory Committee EWRT Extinction Weighted Residence Time FCRS Crustal fraction of PM FPRM Fine Other Primary (diameter ≤2.5 µm) HYSPLIT Hybrid Single-Particle Lagrangian Integrated Trajectory HgP Particulate mercury IMPROVE Interagency LADCO Lake Michigan Air Directors Consortium MANE-VU Mid-Atlantic and Northeast Visibility Union MARAMA Mid-Atlantic Regional Air Management Association, Inc. Mm-1 Inverse Megameters Na+ Sodium ion NOx Oxides of nitrogen PCL Chorine PEC Primary elemental carbon PM Particulate Matter PM2.5 Fine particle; primary particulate matter less than or equal to 2.5 microns in aerodynamic diameter PNH4 Ammonium PNO3 Particulate nitrate POA Primary organic carbon PSAT Particulate Source Apportionment Technology PSO4 Sulfate RHR Regional Haze Rule RPO Regional Planning Organization SESARM Southeastern States Air Resource Managers, Inc. SIP State Implementation Plan SMAT Software for Model Attainment Test SMOKE Sparse Matrix Operator Kernel Emissions SO2 Sulfur dioxide SOA Secondary Organic Aerosol tpy Tons per year VISTAS Visibility Improvement – State and Tribal Association of the Southeast WRAP Western Regional Air Partnership

Particulate Source Apportionment Technology Modeling Results
August 31, 2020 v
This page is intentionally blank.

Particulate Source Apportionment Technology Modeling Results
August 31, 2020 1
1.0 INTRODUCTION Southeastern States Air Resource Managers, Inc. (SESARM) has been designated by the
United States Environmental Protection Agency (EPA) as the entity responsible for coordinating
regional haze evaluations for the ten Southeastern states of Alabama, Florida, Georgia,
Kentucky, Mississippi, North Carolina, South Carolina, Tennessee, Virginia, and West Virginia.
The Eastern Band of Cherokee Indians and the Knox County, Tennessee local air pollution
control agency are also participating agencies. These parties are collaborating through the
Regional Planning Organization known as Visibility Improvement - State and Tribal Association
of the Southeast (VISTAS) in the technical analyses and planning activities associated with
visibility and related regional air quality issues. VISTAS analyses will support the VISTAS
states in their responsibility to develop, adopt, and implement their State Implementation Plans
(SIPs) for regional haze.
The state and local air pollution control agencies in the Southeast are mandated to protect
human health and the environment from the impacts of air pollutants. They are responsible for
air quality planning and management efforts including the evaluation, development, adoption,
and implementation of strategies controlling and managing all criteria air pollutants including
fine particles and ozone as well as regional haze. This project will focus on regional haze and
regional haze precursor emissions. Control of regional haze precursor emissions will have the
additional benefit of reducing criteria pollutants as well.
The 1999 Regional Haze Rule (RHR) identified 18 Class I Federal areas (national parks
greater than 6,000 acres and wilderness areas greater than 5,000 acres) in the VISTAS region.
The 1999 RHR required states to define long-term strategies to improve visibility in Federal
Class I national parks and wilderness areas. States were required to establish baseline visibility
conditions for the period 2000-2004, natural visibility conditions in the absence of anthropogenic
influences, and an expected rate of progress to reduce emissions and incrementally improve
visibility to natural conditions by 2064. The original RHR required states to improve visibility on
the 20% most impaired days and protect visibility on the 20% least impaired days.1 The RHR
1 RHR summary data is available at: http://vista.cira.colostate.edu/Improve/rhr-summary-data/

Particulate Source Apportionment Technology Modeling Results
August 31, 2020 2
requires states to evaluate progress toward visibility improvement goals every five years and
submit revised SIPs every ten years.
This report documents the steps taken by Alpine Geophysics, LLC (Alpine) in
developing Particulate Source Apportionment Technology (PSAT) modeling results, which was
completed under Task 7 of VISTAS Contract No. V-2018-03-01, entitled “Southeast VISTAS II
Regional Haze Analysis Project”. Under this contract, SESARM exercised the option of
increasing PSAT tags from the base of 150 tags to up to 250 tags. A “tag” can be identified as a
specific source, or group of sources. Sources of interest are for those emitting sulfur dioxide
(SO2) and/or oxides of nitrogen (NOx).
2.0 PSAT OVERVIEW In order to gain a better understanding of the source contributions to modeled visibility,
Alpine used the CAMx PSAT modeling.2 PSAT uses multiple tracer families to track the fate of
both primary and secondary PM. PSAT is designed to apportion the following classes of CAMx
PM species:
• Sulfate (PSO4) • Particulate nitrate (PNO3) • Ammonium (PNH4) • Secondary organic aerosol (SOA) • Primary PM (PEC, POA, FCRS, FPRM, CCRS, and CPRM) • Particulate mercury (HgP)
PSAT allows emissions to be tracked (tagged) by various combinations of sectors and
geographic areas (e.g., by state). For this application, 2028elv3 emissions were tagged per
configuration provided by SESARM.3
Although an update of the 2028 emissions was completed in March 2020, the PSAT
modeling was not rerun.
2 More information on CAMx modeling can be found at: http://www.camx.com/home.aspx 3 The 2028elv3 emissions were completed in August 2018, and is summarized in the Task 2 Report entitled “Southeastern
VISTAS II Regional Haze Analysis Project – Task 2A: Emission Inventory Updates Report for Area Of Influence and Point Source Apportionment Tagging. August 2020.”

Particulate Source Apportionment Technology Modeling Results
August 31, 2020 3
3.0 PSAT TAGS SESARM worked with its stakeholders and surrounding regional planning organizations
(RPOs) within the VISTAS modeling domain to compile a list of tags for PSAT analysis. The
starting point for identifying tags were the results of Task 5, Area of Influence (AOI) Analysis.4
Under Task 5, Class I-specific workbooks within the VISTAS modeling domain were created
from combining Hybrid Single-Particle Lagrangian Integrated Trajectory (HYSPLIT) back
trajectories, NOx and SO2 emissions inventories (facility-level and county-level),5 and extinction
weighted residence time (EWRT) values of nitrate and sulfate to calculate relative contributions
of facility-level sources and source category sectors (e.g., point, onroad, nonroad, nonpoint, and
fires).
Each tag identified was chosen to inform SESARM and its stakeholders on sources or
groups of sources that are likely affecting visibility in the SESARM states, warranting further
understanding of their contributions.
Additionally, the following RPOs were asked to provide comment on potential tags for its
member states within the VISTAS modeling domain:
• The Central States Regional Air Partnership (CENRAP); • The Mid-Atlantic and Northeast Visibility Union (MANE-VU); • The Lake Michigan Air Directors Consortium (LADCO); and • The Western Regional Air Partnership (WRAP).
As a result of this consultation, two rounds of PSAT tagging for SO2 and NOx emissions
were conducted. Round 1 is presented in Table 3-1 for groups of sources (70 tags) and Table 3-2
for individual facilities (55 tags).6 Each of these emissions sources or source sectors were
processed through Sparse Matrix Operating Kernal Emissions (SMOKE) software and tracked in
4 The steps for developing the AOI analysis are documented in the report entitled “Area of Influence Analysis, Southeastern
VISTAS II Regional Haze Analysis Project – Documentation Report for Task 5.” December 2019. 5 Due to additional state review and updates from sources within the VISTAS modeling domain, the AOI analyses included
updated emissions and/or facility/unit-closures beyond what is described in Task 2. These updates are captured in the Task 5 report.
6 Officially SESARM requested 54 PSAT facility tags for Round 1. However, PSAT facility tagged results were conducted for McGhee Tyson Airport (AOI Facility ID = 47009-9159211, PSAT Tag ID = 034) based on the initial list of PSAT tags for Round 1. This source was officially removed from the PSAT tagging list on a June 1, 2019 e-mail from Mr. John Hornback, SESARM to Mr. Regi Oommen, ERG.

Particulate Source Apportionment Technology Modeling Results
August 31, 2020 4
PSAT as individual source tags. For this application, only sulfate and nitrate were tracked using
PSAT.
Table 3-1. Round 1 SESARM Defined Regional-Category Combination Tags
Tag Name Tagging Description Alabama – All NOX Total NOx emissions from Alabama Alabama – All SO2 Total SO2 emissions from Alabama Florida – All NOX Total NOx emissions from Florida Florida – All SO2 Total SO2 emissions from Florida Georgia – All NOX Total NOx emissions from Georgia Georgia – All SO2 Total SO2 emissions from Georgia Kentucky – All NOX Total NOx emissions from Kentucky Kentucky – All SO2 Total SO2 emissions from Kentucky Mississippi – All NOX Total NOx emissions from Mississippi Mississippi – All SO2 Total SO2 emissions from Mississippi North Carolina – All NOX Total NOx emissions from North Carolina North Carolina – All SO2 Total SO2 emissions from North Carolina South Carolina – All NOX Total NOx emissions from South Carolina South Carolina – All SO2 Total SO2 emissions from South Carolina Tennessee – All NOX Total NOx emissions from Tennessee Tennessee – All SO2 Total SO2 emissions from Tennessee Virginia – All NOX Total NOx emissions from Virginia Virginia – All SO2 Total SO2 emissions from Virginia West Virginia – All NOX Total NOx emissions from West Virginia West Virginia – All SO2 Total SO2 emissions from West Virginia CENRAP – All NOX Total NOx emissions from the CENRAP region CENRAP – All SO2 Total SO2 emissions from the CENRAP region MANE-VU – All NOX Total NOx emissions from the MANE-VU region MANE-VU – All SO2 Total SO2 emissions from the MANE-VU region LADCO – All NOX Total NOx emissions from the LADCO region LADCO – All SO2 Total SO2 emissions from the LADCO region Alabama – Point EGU NOX Total Point NOx EGU emissions from Alabama Alabama – Point EGU SO2 Total Point SO2 EGU emissions from Alabama Florida – Point EGU NOX Total Point NOx EGU emissions from Florida Florida – Point EGU SO2 Total Point SO2 EGU emissions from Florida Georgia – Point EGU NOX Total Point NOx EGU emissions from Georgia Georgia – Point EGU SO2 Total Point SO2 EGU emissions from Georgia Kentucky – Point EGU NOX Total Point NOx EGU emissions from Kentucky Kentucky – Point EGU SO2 Total Point SO2 EGU emissions from Kentucky Mississippi – Point EGU NOX Total Point NOx EGU emissions from Mississippi

Particulate Source Apportionment Technology Modeling Results
August 31, 2020 5
Table 3-1. Round 1 SESARM Defined Regional-Category Combination Tags
Tag Name Tagging Description Mississippi – Point EGU SO2 Total Point SO2 EGU emissions from Mississippi North Carolina – Point EGU NOX Total Point NOx EGU emissions from North Carolina North Carolina – Point EGU SO2 Total Point SO2 EGU emissions from North Carolina South Carolina – Point EGU NOX Total Point NOx EGU emissions from South Carolina South Carolina – Point EGU SO2 Total Point SO2 EGU emissions from South Carolina Tennessee – Point EGU NOX Total Point NOx EGU emissions from Tennessee Tennessee – Point EGU SO2 Total Point SO2 EGU emissions from Tennessee Virginia – Point EGU NOX Total Point NOx EGU emissions from Virginia Virginia – Point EGU SO2 Total Point SO2 EGU emissions from Virginia West Virginia – Point EGU NOX Total Point NOx EGU emissions from West Virginia West Virginia – Point EGU SO2 Total Point SO2 EGU emissions from West Virginia CENRAP – Point EGU NOX Total Point NOx EGU emissions from the CENRAP region CENRAP – Point EGU SO2 Total Point SO2 EGU emissions from the CENRAP region MANE-VU – Point EGU NOX Total Point NOx EGU emissions from the MANE-VU region MANE-VU – Point EGU SO2 Total Point SO2 EGU emissions from the MANE-VU region LADCO – Point EGU NOX Total Point NOx EGU emissions from the LADCO region LADCO – Point EGU SO2 Total Point SO2 EGU emissions from the LADCO region

Particulate Source Apportionment Technology Modeling Results
August 31, 2020 6
Table 3-2. Round 1 SESARM-Defined Individual Facility Tags
Requesting State
Area of Influence
Facility ID Facility Name
PSAT Tag IDa
Facility State
SO2 Emissions
(tpy)
NOx Emissions
(tpy) AL/FL 01053-7440211 Escambia Operating Company LLC 001 AL 18,974 349
AL 01053-985111 Escambia Operating Company LLC 002 AL 8,590 150 AL 01073-1018711 Drummond Company, Inc. 003 AL 2,562 1,229 AL 01097-1056111 Ala Power – Barry 004 AL 6,026 2,182 AL 01097-1061611 Union Oil of California – Chunchula Gas Plant 005 AL 2,573 349 AL 01097-949811 Akzo Nobel Chemicals Inc. 006 AL 3,336 21 AL 01103-1000011 Nucor Steel Decatur LLC 007 AL 170 331 AL 01109-985711 Sanders Lead Co 008 AL 7,951 122 FL 12005-535411 Rocktenn CP LLC 009 FL 2,591 1,405 FL 12017-640611 Duke Energy Florida, Inc. (Def) 010 FL 5,306 2,490 FL 12031-640211 JEA 011 FL 2,094 652
FL/GA 12033-752711 Gulf Power – Crist 012 FL 2,616 2,998 FL 12047-769711 White Springs Agricultural Chemicals, Inc. 013 FL 3,198 112
FL/GA 12057-538611 Tampa Electric Company (Tec) 014 FL 6,085 2,665 FL 12057-716411 Mosaic Fertilizer, LLC 015 FL 3,034 160 FL 12089-753711 Rock Tenn CP, LLC 016 FL 2,607 2,317 FL 12089-845811 Rayonier Performance Fibers LLC 017 FL 2,327 562 FL 12105-717711 Mosaic Fertilizer LLC 018 FL 7,901 310 FL 12105-919811 Mosaic Fertilizer, LLC 019 FL 4,426 141 FL 12123-752411 Buckeye Florida, Limited Partnership 020 FL 1,520 1,831
GA/TN 13015-2813011 Ga Power Company – Plant Bowen 021 GA 10,453 6,643 GA 13051-3679811 International Paper – Savannah 022 GA 3,945 1,561 GA 13127-3721011 Brunswick Cellulose Inc. 023 GA 294 1,555 KY 21091-7352411 Century Aluminum of KY LLC 024 KY 5,044 198
AL 21145-6037011 Tennessee Valley Authority (TVA) – Shawnee Fossil Plant 025 KY 19,505 7,007

Particulate Source Apportionment Technology Modeling Results
August 31, 2020 7
Table 3-2. Round 1 SESARM-Defined Individual Facility Tags
Requesting State
Area of Influence
Facility ID Facility Name
PSAT Tag IDa
Facility State
SO2 Emissions
(tpy)
NOx Emissions
(tpy)
KY 21177-5196711 Tennessee Valley Authority – Paradise Fossil Plant 026 KY 2,990 2,927
AL/KY 21183-5561611 Big Rivers Electric Corp – Wilson Station 027 KY 6,934 1,152 NC 37013-8479311 PCS Phosphate Company, Inc. – Aurora 028 NC 4,846 496 NC 37087-7920511 Blue Ridge Paper Products – Canton Mill 029 NC 1,127 2,992 SC 45015-4834911 Alumax of South Carolina 030 SC 3,752 108 SC 45019-4973611 Kapstone Charleston Kraft LLC 031 SC 1,864 2,356 SC 45043-5698611 International Paper Georgetown Mill 032 SC 2,768 2,031 TN 47001-6196011 TVA Bull Run Fossil Plant 033 TN 623 964 TN 47009-9159211b McGhee Tyson Airport 034 TN 79 595 TN 47093-4979911 Cemex – Knoxville Plant 035 TN 121 712 TN 47105-4129211 Tate & Lyle, Loudon 036 TN 473 883 TN 47145-4979111 TVA Kingston Fossil Plant 037 TN 1,886 1,687
AL/TN 47161-4979311 TVA Cumberland Fossil Plant 038 TN 8,427 4,917 TN 47163-3982311 Eastman Chemical Company 039 TN 6,420 6,900 VA 51023-5039811 Roanoke Cement Company 040 VA 2,290 1,973 VA 51027-4034811 Jewell Coke Company LLP 041 VA 5,091 520 VA 51580-5798711 Meadwestvaco Packaging Resource Group 042 VA 2,115 1,986
WV 54023-6257011 Dominion Resources, Inc. – Mount Storm Power Station 043 WV 2,124 1,984
WV 54033-6271711 Allegheny Energy Supply Co, LLC-Harrison 044 WV 10,083 11,831 WV 54041-6900311 Equitrans – Copley Run Cs 70 045 WV <1 511 WV 54049-4864511 American Bituminous Power-Grant Town Plt. 046 WV 2,210 1,245 WV 54051-6902311 Mitchell Plant 047 WV 5,372 2,720 WV 54061-16320111 Longview Power 048 WV 2,314 1,557 WV 54061-6773611 Monongahela Power Co.- Fort Martin Power 049 WV 4,882 13,743 WV 54061-6773811 Morgantown Energy Associates 050 WV 829 656

Particulate Source Apportionment Technology Modeling Results
August 31, 2020 8
Table 3-2. Round 1 SESARM-Defined Individual Facility Tags
Requesting State
Area of Influence
Facility ID Facility Name
PSAT Tag IDa
Facility State
SO2 Emissions
(tpy)
NOx Emissions
(tpy) WV 54073-4782811 Monongahela Power Co – Pleasants Power Station 051 WV 16,817 5,497
WV 54079-6789111 Appalachian Power Company – John E Amos Plant 052 WV 10,984 4,878
WV 54083-6790511 Glady 6c4350 053 WV <1 343 WV 54083-6790711 Files Creek 6c4340 054 WV <1 643 WV 54093-6327811 Kingsford Manufacturing Company 055 WV 17 141
a The PSAT ID tags match the “Facility to Area” spreadsheet tab in Attachment A. b Please note that PSAT tagged results were conducted for McGhee Tysons Airport based on the initial list of PSAT tags for Round 1. This source was
officially removed from the PSAT tagging list on a June 1, 2019 e-mail from Mr. John Hornback, SESARM to Mr. Regi Oommen, ERG.

Particulate Source Apportionment Technology Modeling Results
August 31, 2020 9
For Round 2 of tagging, Table 3-3 presents tags for Regional Category combinations (34
tags) and Table 3-4 presents additional facilities (79 tags) for both SO2 and NOx emissions.
Table 3-3. Round 2 SESARM Defined Regional-Category Combination Tags
Tag Name Tagging Description
East Boundary Conditions – All NOX NOx boundary conditions on the eastern boundary of the VISTAS modeling domain.
East Boundary Conditions – All SO2 SO2 boundary conditions on the eastern boundary of the VISTAS modeling domain.
East Boundary Conditions – All NOX NOx boundary conditions on the eastern boundary of the VISTAS modeling domain.
East Boundary Conditions – All SO2 SO2 boundary conditions on the eastern boundary of the VISTAS modeling domain.
East Boundary Conditions – All NOX NOx boundary conditions on the eastern boundary of the VISTAS modeling domain.
East Boundary Conditions – All SO2 SO2 boundary conditions on the eastern boundary of the VISTAS modeling domain.
East Boundary Conditions – All NOX NOx boundary conditions on the eastern boundary of the VISTAS modeling domain.
East Boundary Conditions – All SO2 SO2 boundary conditions on the eastern boundary of the VISTAS modeling domain.
Alabama – Point Non-EGU NOX Total Point NOx Non-EGU emissions from Alabama Alabama – Point Non-EGU SO2 Total Point SO2 Non-EGU emissions from Alabama Florida – Point Non-EGU NOX Total Point NOx Non-EGU emissions from Florida Florida – Point Non-EGU SO2 Total Point SO2 Non-EGU emissions from Florida Georgia – Point Non-EGU NOX Total Point NOx Non-EGU emissions from Georgia Georgia – Point Non-EGU SO2 Total Point SO2 Non-EGU emissions from Georgia Kentucky – Point Non-EGU NOX Total Point NOx Non-EGU emissions from Kentucky Kentucky – Point Non-EGU SO2 Total Point SO2 Non-EGU emissions from Kentucky Mississippi – Point Non-EGU NOX Total Point NOx Non-EGU emissions from Mississippi Mississippi – Point Non-EGU SO2 Total Point SO2 Non-EGU emissions from Mississippi
North Carolina – Point Non-EGU NOX Total Point NOx Non-EGU emissions from North Carolina
North Carolina – Point Non-EGU SO2 Total Point SO2 Non-EGU emissions from North Carolina
South Carolina – Point Non-EGU NOX Total Point NOx Non-EGU emissions from South Carolina
South Carolina – Point Non-EGU SO2 Total Point SO2 Non-EGU emissions from South Carolina
Tennessee – Point Non-EGU NOX Total Point NOx Non-EGU emissions from Tennessee Tennessee – Point Non-EGU SO2 Total Point SO2 Non-EGU emissions from Tennessee Virginia – Point Non-EGU NOX Total Point NOx Non-EGU emissions from Virginia

Particulate Source Apportionment Technology Modeling Results
August 31, 2020 10
Table 3-3. Round 2 SESARM Defined Regional-Category Combination Tags
Tag Name Tagging Description Virginia – Point Non-EGU SO2 Total Point SO2 Non-EGU emissions from Virginia
West Virginia – Point Non-EGU NOX Total Point NOx Non-EGU emissions from West Virginia
West Virginia – Point Non-EGU SO2 Total Point SO2 Non-EGU emissions from West Virginia
CENRAP – Point Non-EGU NOX Total Point NOx Non-EGU emissions from the CENRAP region
CENRAP – Point Non-EGU SO2 Total Point SO2 Non-EGU emissions from the CENRAP region
MANE-VU – Point Non-EGU NOX Total Point NOx Non-EGU emissions from the MANE-VU region
MANE-VU – Point Non-EGU SO2 Total Point SO2 Non-EGU emissions from the MANE-VU region
LADCO – Point Non-EGU NOX Total Point NOx Non-EGU emissions from the LADCO region
LADCO – Point Non-EGU SO2 Total Point SO2 Non-EGU emissions from the LADCO region

Particulate Source Apportionment Technology Modeling Results
August 31, 2020 11
Table 3-4. Round 2 SESARM-Defined Individual Facility Tags
Requesting State
Area of Influence
Facility ID Facility Name
PSAT Tag IDa
Facility State
SO2 Emissions
(tpy)
NOx Emissions
(tpy) AL 01129-1028711 American Midstream Chatom, LLC 073 AL 3,106 426 AL 05063-1083411 Entergy Arkansas Inc-Independence Plant 056 AR 32,050 1,4133 FL 12086-3532711 Homestead City Utilities 077 FL 0 97 FL 12086-899911 Tarmac America LLC 079 FL 9 880 FL 12086-900011 Florida Power & Light (PTF) 076 FL 13 171 FL 12086-900111 Cemex Construction Materials Fl. LLC. 075 FL 30 910 FL 12123-752411 Buckeye Florida, Limited Partnership 074 FL 1,520 1,831 FL 12129-2731711 Tallahassee City Purdom Generating Sta. 078 FL 3 121
GA 13103-536311 Georgia-Pacific Consumer Products LP (Savannah River Mill) 081 GA 1,860 352
GA 13115-539311 Temple Inland 082 GA 1,791 1,773 GA 13127-3721011 Brunswick Cellulose Inc. 080 GA 294 1,555 AL 17127-7808911 Joppa Steam 062 IL 20,509 4,706
AL/KY 18051-7363111 Gibson 064 IN 23,117 12,280 AL/KY 18125-7362411 Indianapolis Power & Light Petersburg 066 IN 18,142 10,665
KY 18129-8166111 Sigeco AB Brown South Indiana Gas & Ele 067 IN 7,645 1,579 KY,
AL/KY/TN 18147-8017211 Indiana Michigan Power DBA AEP Rockport 065 IN 30,536 8,807
KY 18173-8183111 Alcoa Warrick Power Plt Agc Div of AL 063 IN 5,071 11,159 VA/WV 24001-7763811 Luke Paper Company 058 MD 9,876 3,607
MS 28059-6251011 Mississippi Power Company, Plant Victor J Daniel 084 MS 224 3,736
MS 28059-8384311 Chevron Products Company, Pascagoula Refinery 083 MS 742 1,534
AL 29143-5363811 New Madrid Power Plant-Marston 057 MO 16,784 4,394 NC 37013-8479311 PCS Phosphate Company, Inc. - Aurora 088 NC 4,846 496 NC 37023-8513011 SGL Carbon LLC 089 NC 262 22

Particulate Source Apportionment Technology Modeling Results
August 31, 2020 12
Table 3-4. Round 2 SESARM-Defined Individual Facility Tags
Requesting State
Area of Influence
Facility ID Facility Name
PSAT Tag IDa
Facility State
SO2 Emissions
(tpy)
NOx Emissions
(tpy)
NC 37035-8370411 Duke Energy Carolinas, LLC - Marshall Steam Station 087 NC 4,139 7,511
NC 37087-7920511 Blue Ridge Paper Products - Canton Mill 085 NC 1,127 2,992 NC 37117-8049311 Domtar Paper Company, LLC 086 NC 687 1,796
VA, TN 39025-8294311 Duke Energy Ohio, Wm. H. Zimmer Station (1413090154) 070 OH 22,134 7,150
VA 39031-8010811 Conesville Power Plant (0616000000) 069 OH 6,356 9,958
WV 39053-7983011 Ohio Valley Electric Corp., Kyger Creek Station (0627000003) 072 OH 3,400 9,144
WV, TN/VA/WV 39053-8148511 General James M. Gavin Power Plant
(0627010056) 071 OH 41,596 8,123
WV 39081-8115711 Cardinal Power Plant (Cardinal Operating Company) (0641050002) 068 OH 7,461 2,467
VA 42005-3866111 Genon NE Mgmt Co/Keystone Sta 059 PA 56,939 6,578 VA 42063-3005111 NRG Wholesale Gen/Seward Gen Sta 061 PA 8,880 2,255 WV,
VA/WV 42063-3005211 Homer City Gen LP/ Center Twp 060 PA 11,866 5,216
SC 45015-4120411 Santee Cooper Cross Generating Station 090 SC 4,281 3,723 SC 45015-8306711 SCE&G Williams 092 SC 392 993 SC 45043-6652811 Santee Cooper Winyah Generating Station 091 SC 2,247 1,773 VA 51023-5039811 Roanoke Cement Company 095 VA 2,290 1,973 VA 51027-4034811 Jewell Coke Company LLP 093 VA 5,091 520 VA 51580-5798711 Meadwestvaco Packaging Resource Group 094 VA 2,115 1,986
a The PSAT ID tags match the “Facility to Area” spreadsheet tab in Attachment A.

Particulate Source Apportionment Technology Modeling Results
August 31, 2020 13
4.0 PSAT POST-PROCESSING The CAMx 2011 and 2028 model output were post-processed using a “species definition
file” that cross references raw CAMx output species names with PM species needed for SMAT.
The results of the post-processing are 24-hour average PM species with the “combine file”
output names. These are matched to the SMAT species as shown in Table 4-1.
Table 4-1. Matching of CAMx Raw Output Species to SMAT Input Variables SMAT Species Raw CAMx 6.40 Species
Sulfate (SO4)1 PSO4 Nitrate (NO3)1 PNO3 Ammonium (NH4)1 PNH4 Organic Matter (OM) POA+SOA1+SOA2 +SOA3+SOA4+SOPA+SOPB Elemental carbon (EC) PEC Crustal (CRUSTAL) FPRM+FCRS Coarse PM (CM) CPRM+CCRS PM2.5 (PM25)2 PSO4+PNO3+PNH4+POA+PEC+FCRS+FPRM+SOA1+SOA2+S
OA3+SOA4+SOPA+SOPB+NA+PCL 1 Modeled ammonium concentrations are not used in the post-processing of the 2028 visibility values because the IMPROVE
network does not measure ammonium and there is not an ammonium term in the IMPROVE visibility equation. 2 Note that total PM2.5 concentration data is needed as a SMAT input variable, but it is not used in the visibility calculations for
regional haze. Visibility calculations only use the species specific model outputs.
5.0 PROCESS FOR CREATING PSAT CONTRIBUTIONS FOR CLASS I AREAS The CAMx hourly concentration data was post-processed to create SMAT input files.
This involved processing both the 2028 “full model” and the specific source apportionment
outputs. The “full model” results are the total PM species concentrations (e.g. sulfate, nitrate)
and are identical to the total species concentrations from the non-source apportionment model
run for 2028elv3 (e.g., future year base case). The source apportionment outputs contain the
sulfate and/or nitrate contributions for each tagged source.
The PSAT source apportionment tracking uses slightly different variable names for the
source apportionment variables. Table 5-1 below shows the SMAT species definition matching
to be used for the 2028 full model and 2028 source apportionment results in the VISTAS II
analysis.

Particulate Source Apportionment Technology Modeling Results
August 31, 2020 14
Table 5-1. Matching of “Bulk Raw Species”, PSAT Output Species, and SMAT Input Variables
SMAT Species 2028 Full Model Species 2028 PSAT Tag Raw Species Sulfate PSO4 PS4 Nitrate PNO3 PN3 Ammonium PHN4 PN4
This analysis uses a comparable method that was documented by EPA in the regional
haze modeling for 2028. Slight differences do occur as in this study we are looking at the
SMAT-CE generated visibility/extinction deltas whereas EPA’s approach was designed for a
different purpose than just to estimate emissions sector contributions to 2028 particulate matter
concentrations and visibility. As a reminder, SESARM is only looking for individual facility or
sector contributions to visibility impairment based on defined sulfate and nitrate tags and not
looking to establish a full list of species-based contribution metrics.
The following approach was used in preparing the SMAT input files, running the SMAT
software, and analysing the results:
1. Regional haze SMAT was run for the 2028 future case using “standard” 2011 and 2028
SMAT input files. In this SMAT run, the advanced option “Create forecast IMPROVE
visibility file” was invoked to create an output file with future year (2028) daily species
extinction values at each IMPROVE monitor for each of the 20% best and most impaired
days (based on 2011 ambient data). These are the extinction values that are added and
averaged to get the 2028 base case projected deciview values for each site. SMAT
generates a new output file called “scenario_name Forecast IMPROVE Daily Data.csv”
that was re-used to calculate the sector tag fractions.
2. Alpine then created future year, tag-specific SMAT input files by subtracting the 2028
hourly tags from the hourly full model concentration files. This simple arithmetic was
implemented using standard IOAPI utility programs and generated files similar to EPA’s
source category-based tagged SMAT input files. Once the hourly files were created, the
same processing stream as was used in Step 1 was used to create the tagged SMAT input
files from the hourly model concentration files.

Particulate Source Apportionment Technology Modeling Results
August 31, 2020 15
3. SMAT was then run again for each sector tag, using the “advanced options” accessing the
“Forecast IMPROVE Daily Data” file (created as an output file from step 1 above) as the
“advanced option” input file, the 2028 base case SMAT input file is used as the “Baseline
file”, and each 2028 sector tag SMAT input file is used as the “Forecast file”.
4. The total extinction (on the 20% most impaired days) for each tag was calculated from
the SMAT bulk output file and each of the tag output files. The visibility impacts of each
tag was computed by subtracting the SMAT output absent the tag (created in Step 3)
from the full model SMAT output file (created in Step 1).
6.0 SECTOR TAG RESULTS The sector and facility tag modeling results were consolidated into Attachment A, the
Excel workbook “ATTACHMENT_A_PSAT_TAG_RESULTS.xlsm”, with the following
reports and charts prepared.
6.1 Area By Sector This tab provides 2028 contribution from source regions-category combinations to light
extinction on the 20% best and 20% most anthropogenically impaired days to a single Class I
area. Figure 6-1 presents an example of this output.
Figure 6-1. Area by Sector PivotChart and Table Example
Site ID SWAN Swanquarter, NC 29.965 <- 2028 Base Case Light Extinction (Best 20%) (Mm-1)Species (All) Sulfate + Nitrate 51.328 <- 2028 Base Case Light Extinction (Most Impaired 20%) (Mm-1)Sector NEG Non-EGU Point Sources
Data
RegionExtinction (20%
Best)Extinction (20%
Impaired) Contribution to Light Extinction (Mm-1) from Sulfate + NitrateAlabama 0.022 0.115 2028 Contribution of Non-EGU Point Sources to Swanquarter, NC from Sulfate + Nitrate (Mm-1)Florida 0.053 0.114 20% Most Impaired Days = 51.328Georgia 0.039 0.140 20% Clearest Days = 29.965Kentucky 0.007 0.120Mississippi 0.004 0.014North Carolina 0.400 0.899South Carolina 0.077 0.279Tennessee 0.005 0.117Virginia 0.043 0.541West Virginia 0.005 0.054CENRAP 0.052 0.186LADCO 0.154 1.314MANE-VU 0.132 1.006All Other Regions 0.008 0.025Total 1.001 4.924
VISTAS Total 0.655 2.393
Region 20% Best 20% Most ImpairedAlabama 0.07% 0.22%Florida 0.18% 0.22%Georgia 0.13% 0.27%Kentucky 0.02% 0.23%Mississippi 0.01% 0.03%North Carolina 1.33% 1.75%South Carolina 0.26% 0.54%Tennessee 0.02% 0.23%Virginia 0.14% 1.05%West Virginia 0.02% 0.11%CENRAP 0.17% 0.36%LADCO 0.51% 2.56%MANE-VU 0.44% 1.96%All Other Regions 0.03% 0.05%Total 3.34% 9.59%
VISTAS Total 2.19% 4.66%
Percent of Total 2028 Light Extinction
0.115 0.1140.140 0.120
0.014
0.899
0.279
0.117
0.541
0.054
0.186
1.314
1.006
0.025
0.00
0.20
0.40
0.60
0.80
1.00
1.20
1.40
Alabama Florida Georgia Kentucky Mississippi North Carolina South Carolina Tennessee Virginia West Virginia CENRAP LADCO MANE-VU All Other Regions
Cont
ribu
tion
to L
ight
Ext
inct
ion
(Mm
-1) f
rom
Sul
fate
+ N
itra
te
2028 Contribution of Non-EGU Point Sources to Swanquarter, NC from Sulfate + Nitrate (Mm-1)
Extinction (20% Best) Extinction (20% Impaired)
Total 2028 Extinction (Mm-1)
20% Most Impaired Days = 51.328
20% Clearest Days = 29.965

Particulate Source Apportionment Technology Modeling Results
August 31, 2020 16
• Cell B1 provides options for Class I areas to which combinations contribute. • Cell B2 provides option for [S]ulfate, [N]itrate, or (All) both. • Cell B3 provides option for category. [ALL] being all anthro and natural emissions
from region; [NEG] representing all non-EGU point source contribution, and [EGU] representing all EGU point source contribution.
6.2 Sector to Area This tab provides 2028 contribution from source regions-category combinations to light
extinction on the 20% best and 20% most anthropogenically impaired days to all Class I areas.
Figure 6-2 presents an example of this output.
Figure 6-2. Sector to Area PivotChart and Table Example
• Cell B1 provides options for tagged regions (States, RPOs). • Cell B2 provides option for category. [ALL] being all anthro and natural emissions
from region; [NEG] representing all non-EGU point source contribution, and [EGU] representing all EGU point source contribution.
• Cell B3 provides option for [S]ulfate, [N]itrate, or (All) both.
Region Georgia GeorgiaSector ALL All Anthro + Natural SourcesSpecies (All) Sulfate + Nitrate
Class I Area Extinction (20% Best) Extinction (20% Impaired)ACAD 0.001 0.032 Contribution of EGU Point Sources to Linville Gorge Wilderness, NC from NitrateBADL 0.000 0.000 2028 Contribution of All Anthro + Natural Sources in Georgia from Sulfate + Nitrate (Mm-1)BAND 0.000 0.000 Contribution to Light Extinction from Sulfate + Nitrate (Mm-1)BIBE 0.000 0.003BOAP 0.000 0.002BOWA 0.000 0.009BRET2 0.101 0.224BRIG 0.015 0.034CACR 0.035 0.069CAVE 0.000 0.008CHAS 0.185 1.335COHU 0.448 1.070DOSO 0.055 0.078EANE 0.000 0.000EVER 0.019 0.043FLTO 0.000 0.000GRGU 0.005 0.016GRSA 0.000 0.001GRSM 0.196 0.439GUMO 0.000 0.008HEGL 0.016 0.064ISLE 0.000 0.003JARI 0.074 0.128JOYC 0.251 0.536LIGO 0.069 0.403LYBR2 0.002 0.077MABE 0.000 0.000MACA 0.146 0.067MELA 0.000 0.000MING 0.020 0.160MOOS 0.000 0.013MOZI 0.000 0.000OKEF 0.873 2.210OTCR 0.056 0.082PECO 0.000 0.000PRRA 0.005 0.016RAWA 0.000 0.000ROCA 0.000 0.013ROMA 0.156 2.233ROMO 0.000 0.000SACR 0.000 0.004SAMA 0.491 1.356SAPE 0.000 0.000SENE 0.000 0.043SHEN 0.043 0.083SHRO 0.120 0.509SIPS 0.147 0.210SWAN 0.065 0.417THRO 0.000 0.000ULBE 0.000 0.000UPBU 0.028 0.288WEEL 0.000 0.000WHIT 0.000 0.009WHPE 0.000 0.000WICA 0.000 0.000WIMO 0.000 0.027WOLF 0.984 2.612
0.0320.0000.0000.0030.0020.009
0.224
0.0340.069
0.008
1.335
1.070
0.078
0.0000.043
0.0000.0160.001
0.439
0.0080.064
0.003
0.128
0.536
0.403
0.077
0.0000.067
0.000
0.160
0.0130.000
2.210
0.082
0.0000.0160.0000.013
2.233
0.0000.004
1.356
0.0000.043
0.083
0.509
0.210
0.417
0.0000.000
0.288
0.0000.0090.0000.0000.027
2.612
0.00
0.50
1.00
1.50
2.00
2.50
3.00
ACAD
BADL
BAN
D
BIBE
BOAP
BOW
A
BRET
2
BRIG
CACR
CAVE
CHAS
COHU
DOSO
EAN
E
EVER
FLTO
GRGU
GRSA
GRSM
GUM
O
HEGL ISLE
JARI
JOYC
LIGO
LYBR
2
MAB
E
MAC
A
MEL
A
MIN
G
MO
OS
MO
ZI
OKE
F
OTC
R
PECO
PRRA
RAW
A
ROCA
ROM
A
ROM
O
SACR
SAM
A
SAPE
SENE
SHEN
SHRO SIPS
SWAN
THRO
ULB
E
UPB
U
WEE
L
WHI
T
WHP
E
WIC
A
WIM
O
WO
LF
Cont
ribut
ion
to Li
ght E
xtin
ctio
n fr
om S
ulfa
te +
Nitr
ate
(Mm
-1)
2028 Contribution of All Anthro + Natural Sources in Georgia from Sulfate + Nitrate (Mm-1)
Extinction (20% Best) Extinction (20% Impaired)
Particulate Source Apportionment Technology Modeling Results
August 31, 2020 17
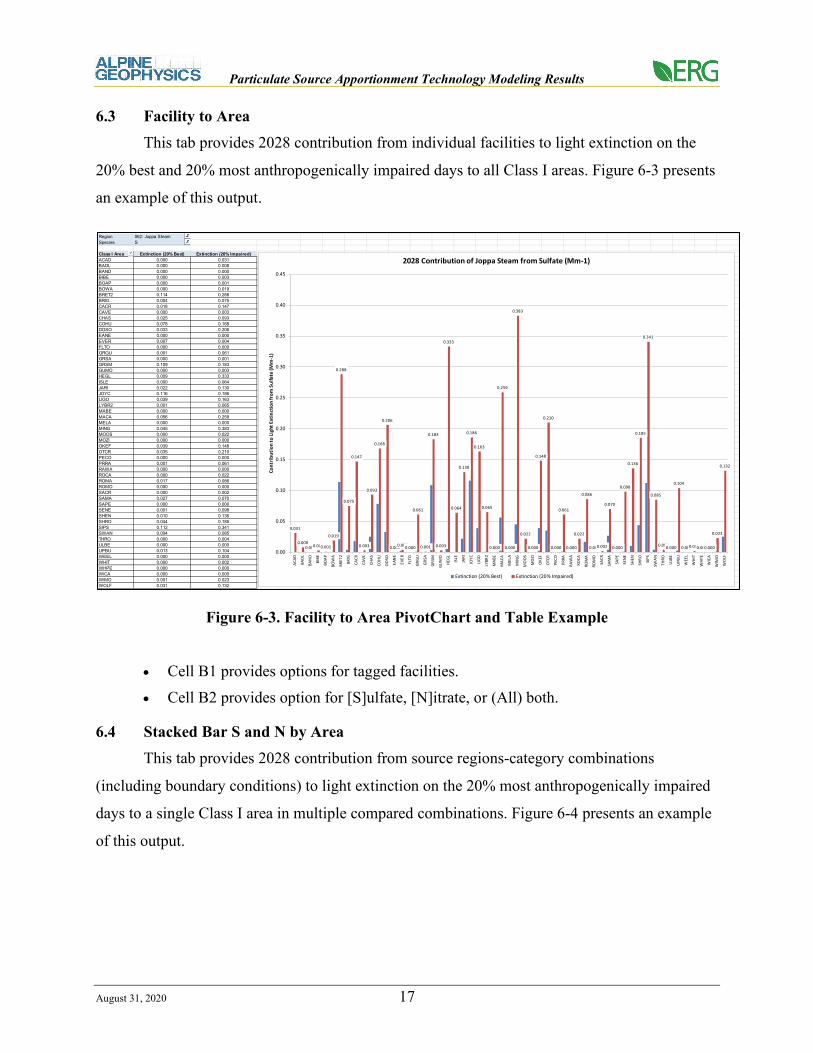
6.3 Facility to Area This tab provides 2028 contribution from individual facilities to light extinction on the
20% best and 20% most anthropogenically impaired days to all Class I areas. Figure 6-3 presents
an example of this output.
Figure 6-3. Facility to Area PivotChart and Table Example
• Cell B1 provides options for tagged facilities. • Cell B2 provides option for [S]ulfate, [N]itrate, or (All) both.
6.4 Stacked Bar S and N by Area This tab provides 2028 contribution from source regions-category combinations
(including boundary conditions) to light extinction on the 20% most anthropogenically impaired
days to a single Class I area in multiple compared combinations. Figure 6-4 presents an example
of this output.
Region 062: Joppa Steam Joppa SteamSpecies S Sulfate
Class I Area Extinction (20% Best) Extinction (20% Impaired)ACAD 0.000 0.031 Contribution of EGU Point Sources to Linville Gorge Wilderness, NC from NitrateBADL 0.000 0.008 2028 Contribution of Joppa Steam from Sulfate (Mm-1)BAND 0.000 0.000 Contribution to Light Extinction from Sulfate (Mm-1)BIBE 0.000 0.003BOAP 0.000 0.001BOWA 0.000 0.019BRET2 0.114 0.288BRIG 0.004 0.075CACR 0.018 0.147CAVE 0.000 0.003CHAS 0.025 0.093COHU 0.078 0.168DOSO 0.033 0.206EANE 0.000 0.000EVER 0.007 0.004FLTO 0.000 0.000GRGU 0.001 0.061GRSA 0.000 0.001GRSM 0.109 0.183GUMO 0.000 0.003HEGL 0.009 0.333ISLE 0.000 0.064JARI 0.022 0.130JOYC 0.116 0.186LIGO 0.039 0.163LYBR2 0.001 0.065MABE 0.000 0.000MACA 0.056 0.259MELA 0.000 0.000MING 0.045 0.383MOOS 0.000 0.022MOZI 0.000 0.000OKEF 0.039 0.148OTCR 0.035 0.210PECO 0.000 0.000PRRA 0.001 0.061RAWA 0.000 0.000ROCA 0.000 0.022ROMA 0.017 0.086ROMO 0.000 0.000SACR 0.000 0.002SAMA 0.027 0.070SAPE 0.000 0.000SENE 0.001 0.098SHEN 0.010 0.136SHRO 0.044 0.185SIPS 0.112 0.341SWAN 0.004 0.085THRO 0.000 0.004ULBE 0.000 0.000UPBU 0.013 0.104WEEL 0.000 0.000WHIT 0.000 0.002WHPE 0.000 0.000WICA 0.000 0.000WIMO 0.001 0.023WOLF 0.031 0.132
0.031
0.0080.0000.0030.001
0.019
0.288
0.075
0.147
0.003
0.093
0.168
0.206
0.0000.0040.000
0.061
0.001
0.183
0.003
0.333
0.064
0.130
0.186
0.163
0.065
0.000
0.259
0.000
0.383
0.022
0.000
0.148
0.210
0.000
0.061
0.000
0.022
0.086
0.0000.002
0.070
0.000
0.098
0.136
0.185
0.341
0.085
0.0040.000
0.104
0.0000.0020.0000.000
0.023
0.132
0.00
0.05
0.10
0.15
0.20
0.25
0.30
0.35
0.40
0.45
ACAD
BADL
BAN
D
BIBE
BOAP
BOW
A
BRET
2
BRIG
CACR
CAVE
CHAS
COHU
DOSO
EAN
E
EVER
FLTO
GRGU
GRSA
GRSM
GUM
O
HEGL ISLE
JARI
JOYC
LIGO
LYBR
2
MAB
E
MAC
A
MEL
A
MIN
G
MO
OS
MO
ZI
OKE
F
OTC
R
PECO
PRRA
RAW
A
ROCA
ROM
A
ROM
O
SACR
SAM
A
SAPE
SENE
SHEN
SHRO SIPS
SWAN
THRO
ULB
E
UPB
U
WEE
L
WHI
T
WHP
E
WIC
A
WIM
O
WO
LF
Cont
ribut
ion
to Li
ght E
xtin
ctio
n fr
om S
ulfa
te (M
m-1
)
2028 Contribution of Joppa Steam from Sulfate (Mm-1)
Extinction (20% Best) Extinction (20% Impaired)

Particulate Source Apportionment Technology Modeling Results
August 31, 2020 18
Figure 6-4. Stacked Bar S and N by Area PivotChart and Table Example
• Cell B1 provides options for Class I areas to which combinations contribute.

Particulate Source Apportionment Technology Modeling Results
August 31, 2020 19
6.5 Region Sector to Area This tab provides 2028 contribution from source regions to light extinction on the 20%
most anthropogenically impaired days to all Class I areas. Figure 6-5 presents an example of this
output.
Figure 6-5. Region Sector to Area PivotChart Example
• Cell B1 provides option for category. [ALL] being all anthro and natural emissions from region; [NEG] representing all non-EGU point source contribution, and [EGU] representing all EGU point source contribution.
• Cell B2 provides option for [S]ulfate, [N]itrate, or (All) both.
6.6 Boundary to Area This tab provides 2028 contribution from boundary condition direction to light extinction
on the 20% most anthropogenically impaired days to all Class I areas. Figure 6-6 presents an
example of this output.
Sector ALL All Anthro + Natural Sources 2028 Contribution of All Anthro + Natural Sources from Sulfate on 20% Most Impaired Days (Mm-1)Species S Sulfate
Light Extinction (Mm-1) RegionClass I Area Alabama Florida Georgia Kentucky Mississippi North Carolina South Carolina Tennessee Virginia West Virginia CENRAP LADCO MANE-VU All Other RegionsACAD 0.032 0.024 0.025 0.15 0.005 0.122 0.04 0.028 0.088 0.087 0.64 1.671 2.144 1.86BADL 0.003 0.001 0 0.019 0.001 0 0 0.004 0 0 4.655 1.09 0.005 2.091BAND 0.002 0 0 0 0 0 0 0 0 0 0.676 0.02 0 0.863BIBE 0.035 0.006 0.003 0.009 0.012 0.001 0.002 0.003 0.001 0.001 2.609 0.095 0.003 4.956BOAP 0.007 0.002 0.001 0.002 0.002 0.001 0.001 0.001 0.001 0.001 0.733 0.01 0.001 0.942BOWA 0.034 0.002 0.006 0.091 0.011 0.003 0.005 0.012 0.005 0.019 5.409 2.508 0.182 1.333BRET2 2.242 0.813 0.214 0.801 0.818 0.058 0.075 0.253 0.02 0.056 9.775 6.226 0.146 1.662BRIG 0.024 0.008 0.03 0.441 0.01 0.286 0.076 0.076 0.295 0.313 1.779 7.325 7.244 2.58CACR 0.253 0.036 0.06 0.338 0.086 0.024 0.038 0.089 0.015 0.024 16.573 3.689 0.078 1.189CAVE 0.067 0.011 0.007 0.013 0.025 0.002 0.003 0.006 0.001 0.001 3.131 0.127 0.003 5.004CHAS 1.238 3.922 1.192 0.3 0.225 0.229 0.439 0.155 0.074 0.069 3.929 2.256 0.338 1.654COHU 0.898 0.212 0.827 1.106 0.089 0.438 0.534 0.933 0.226 0.291 2.72 9.153 1.381 2.108DOSO 0.133 0.012 0.074 1.482 0.055 0.147 0.019 0.297 0.282 2.519 2.94 16.031 3.716 1.793EANE 0 0 0 0 0 0 0 0 0 0 0.048 0.001 0 0.216EVER 0.05 0.966 0.039 0.022 0.011 0.024 0.043 0.009 0.008 0.007 0.646 0.204 0.037 0.948FLTO 0 0 0 0 0 0 0 0 0 0 0.048 0.001 0 0.216GRGU 0.039 0.009 0.014 0.269 0.011 0.068 0.019 0.062 0.073 0.173 1.568 4.038 2.604 2.731GRSA 0.003 0.001 0.001 0.001 0.001 0.001 0.001 0.001 0.001 0 0.397 0.007 0.001 0.606GRSM 1.128 0.062 0.405 1.06 0.14 0.538 0.425 1.627 0.256 0.373 3.996 8.339 1.467 1.596GUMO 0.067 0.011 0.007 0.013 0.025 0.002 0.003 0.006 0.001 0.001 3.131 0.127 0.003 5.004HEGL 0.137 0.011 0.047 0.636 0.032 0.023 0.034 0.101 0.014 0.012 14.172 7.541 0.11 1.999ISLE 0.019 0 0.002 0.201 0.01 0.012 0.002 0.033 0.012 0.03 4.167 5.282 0.356 1.816JARI 0.162 0.03 0.104 0.813 0.042 0.61 0.108 0.216 0.832 1.277 2.519 10.619 3.148 2.018JOYC 1.33 0.069 0.474 1.042 0.163 0.511 0.45 1.082 0.269 0.34 4.312 7.892 1.379 1.603LIGO 0.736 0.052 0.394 0.9 0.14 1.177 0.464 1.15 0.346 0.288 3.825 7.248 2.162 1.544LYBR2 0.179 0.029 0.058 0.289 0.044 0.16 0.086 0.075 0.153 0.217 1.689 5.037 5.702 2.563MABE 0 0 0 0 0 0 0 0 0 0 0.048 0.001 0 0.216MACA 0.269 0.008 0.061 2.804 0.135 0.013 0.019 0.407 0.014 0.206 5.572 20.031 0.843 3.294MELA 0 0 0 0 0 0 0 0 0 0 0.915 0.421 0.009 5.324MING 0.334 0.048 0.136 1.665 0.132 0.042 0.041 0.22 0.02 0.028 10.132 12.871 0.276 2.588MOOS 0.014 0.014 0.012 0.098 0.002 0.057 0.018 0.015 0.048 0.078 0.57 1.394 2.016 1.486MOZI 0 0 0 0 0 0 0 0 0 0 0.044 0 0 0.4OKEF 1.38 2.664 1.702 0.676 0.145 0.714 1.025 0.319 0.306 0.294 3.096 4.898 1.588 2.175OTCR 0.142 0.015 0.078 1.554 0.059 0.166 0.021 0.322 0.305 2.383 2.997 16.014 3.147 1.846PECO 0.002 0.001 0 0.001 0.001 0 0 0 0 0 0.542 0.011 0 0.571PRRA 0.039 0.009 0.014 0.269 0.011 0.068 0.019 0.062 0.073 0.173 1.568 4.038 2.604 2.731RAWA 0 0 0 0 0 0 0 0 0 0 0.044 0 0 0.4ROCA 0.014 0.014 0.012 0.098 0.002 0.057 0.018 0.015 0.048 0.078 0.57 1.394 2.016 1.486ROMA 0.653 0.593 1.586 0.573 0.075 0.795 3.286 0.312 0.336 0.304 2.338 4.671 2.808 1.704ROMO 0.001 0 0 0 0 0 0 0 0 0 0.337 0.001 0 0.775SACR 0.023 0.007 0.003 0.006 0.009 0.001 0.001 0.002 0 0 3.667 0.085 0.002 5.039SAMA 2.691 2.676 1.151 0.307 0.405 0.141 0.146 0.176 0.041 0.052 6.055 2.999 0.696 2.79SAPE 0.001 0 0 0 0 0 0 0 0 0 0.29 0.006 0 0.437SENE 0.038 0.002 0.015 0.302 0.015 0.028 0.012 0.047 0.028 0.099 3.054 8.776 0.932 1.827SHEN 0.128 0.02 0.075 0.848 0.035 0.319 0.053 0.187 0.424 1.219 2.068 11.275 5.873 1.838SHRO 0.895 0.083 0.479 1.009 0.162 1.322 0.505 0.678 0.234 0.209 4.259 6.816 1.404 1.595SIPS 1.711 0.206 0.153 1.367 0.129 0.109 0.106 0.57 0.081 0.274 4.653 12.219 0.757 1.612SWAN 0.165 0.219 0.298 0.426 0.021 1.591 0.442 0.198 0.749 0.468 0.968 5.315 4.436 1.734THRO 0 0 0 0.004 0 0 0 0 0 0 1.249 0.405 0.007 4.576ULBE 0 0 0 0 0 0 0 0 0 0 0.401 0.356 0 1.559UPBU 0.279 0.042 0.275 0.216 0.131 0.033 0.049 0.08 0.017 0.016 13.392 3.297 0.109 1.781WEEL 0 0 0 0 0 0 0 0 0 0 0.048 0.001 0 0.216WHIT 0.032 0.006 0.008 0.006 0.007 0.004 0.004 0.003 0.001 0.001 1.788 0.078 0.008 2.438WHPE 0.002 0.001 0 0.001 0.001 0 0 0 0 0 0.542 0.011 0 0.571WICA 0 0 0 0.001 0 0 0 0 0 0 2.179 0.305 0 2.253WIMO 0.133 0.014 0.024 0.073 0.03 0.007 0.005 0.02 0.003 0.002 8.442 1.31 0.015 3.119WOLF 1.154 1.66 2.159 0.615 0.131 0.747 1.149 0.323 0.319 0.325 3.047 4.707 1.668 2.598
0.0
5.0
10.0
15.0
20.0
25.0
30.0
35.0
40.0
Cont
ribut
ion
to Li
ght E
xtin
ctio
n (M
m-1
)
2028 Contribution of All Anthro + Natural Sources from Sulfate on 20% Most Impaired Days (Mm-1)
All Other Regions
MANE-VU
LADCO
CENRAP
West Virginia
Virginia
Tennessee
South Carolina
North Carolina
Mississippi
Kentucky
Georgia
Florida
Alabama

Particulate Source Apportionment Technology Modeling Results
August 31, 2020 20
Figure 6-6. Boundary to Area PivotChart Example
• Cell B1 provides option for [S]ulfate, [N]itrate, or (All) both.
7.0 PSAT DAY-TO-DAY ANALYSIS To further inform the Stakeholders, day-by-day modeled PSAT source apportionment
results were prepared for each of the SESARM tagged scenarios relative to Class I areas
presented in Tables 3-1 through 3-4. The full results are in Attachment B, as a Excel Workbook
titled “ATTACHMENT_B_DAY_BY_DAY_GROUP_10_90.xlsx”.
Results presented are in light extinction (bext) with units of inverse megameters (Mm-1)
for the 20% clearest days (Group 10) and the 20% most anthropogenically impaired days (Group
90). It should be noted that as the modeled extinction presented is the difference between the
PSAT tag run and the base case run and does not utilize RRF calculations for visibility, these
results cannot be directly correlated to the base case visibility at any Class I areas. These data are
to be used to demonstrate relative contribution across days, not necessarily relative contribution
to the overall visibility impairment metrics.
Figure 7-1 presents the Group 10 (20% clearest days) results for Wolf Island in Georgia.

Particulate Source Apportionment Technology Modeling Results
August 31, 2020 21
Figure 7-1. 2028 Modeled Light Extinction Impairment at Wolf Island on 20% Clearest Days
In this example, the stacked bar charts represent the relative contributions of tagged
sources of interest, and their respective contributions to the light extinction values for each of the
20% clearest days.
Figure 7-2 presents the Group 90 (20% most anthropogenically impaired) results for
Wolf Island in Georgia.

Particulate Source Apportionment Technology Modeling Results
August 31, 2020 22
Figure 7-2. 2028 Modeled Light Extinction Impairment at Wolf Island on 20% Most Impaired Days
Similar to Figure 7-1, the stacked bar charts represent the relative contributions of tagged
sources of interest, and their respective contributions to the light extinction values for each of the
20% most impaired days.

Particulate Source Apportionment Technology Modeling Results
August 31, 2020
Attachment A – PSAT Tagging Results
(ATTACHMENT_A_PSAT_TAG_RESULTS.xlsm)

Particulate Source Apportionment Technology Modeling Results
August 31, 2020
Attachment B – Day-By-Day Results
(ATTACHMENT_B_DAY_BY_DAY_GROUP_10_90.xls)