partitioning of food resources among three sympatric
TRANSCRIPT

HAL Id: hal-02362231https://hal.archives-ouvertes.fr/hal-02362231
Submitted on 13 Nov 2019
HAL is a multi-disciplinary open accessarchive for the deposit and dissemination of sci-entific research documents, whether they are pub-lished or not. The documents may come fromteaching and research institutions in France orabroad, or from public or private research centers.
L’archive ouverte pluridisciplinaire HAL, estdestinée au dépôt et à la diffusion de documentsscientifiques de niveau recherche, publiés ou non,émanant des établissements d’enseignement et derecherche français ou étrangers, des laboratoirespublics ou privés.
Partitioning of food resources among three sympatricscorpionfish (Scorpaeniformes) in coastal waters of the
northern Yellow SeaZhongxin Wu, Xiumei Zhang, Charlotte Dromard, James Tweedley, Neil
Loneragan
To cite this version:Zhongxin Wu, Xiumei Zhang, Charlotte Dromard, James Tweedley, Neil Loneragan. Partitioning offood resources among three sympatric scorpionfish (Scorpaeniformes) in coastal waters of the northernYellow Sea. Hydrobiologia, Springer, 2019, 826 (1), pp.331-351. �10.1007/s10750-018-3747-0�. �hal-02362231�

1
Partitioning of food resources among three co-occurring scorpionfish 1
(Scorpaeniformes) in coastal waters of the northern Yellow Sea 2
3
Zhongxin Wu1, 2, 3, Xiumei Zhang1, 4*, Charlotte R. Dromard5, James R. Tweedley3, Neil 4
R. Loneragan3, 6 5
6 1 The Key Laboratory of Mariculture, Ministry of Education, Ocean University of China, Qingdao, 266003, 7
PR China. 8
2Center for Marine Ranching Engineering Science Research of Liaoning, Dalian Ocean University, Dalian, 9
116023, PR China. 10
3Centre for Fish and Fisheries Research, School of Veterinary and Life Sciences, Murdoch University, 11
South Street, Murdoch, Western Australia 6150, Australia. 12
4Laboratory for Marine Fisheries Science and Food Production Processes, Qingdao National Laboratory 13
for Marine Science and Technology, Qingdao 266072, PR China. 14
5UMR BOREA, CNRS 7208 – MNHN – UPMC – UCBN – IRD 207, Laboratoire d’Excellence « CORAIL », 15
DYNECAR, Université des Antilles, 97157 Pointe-à-Pitre, Guadeloupe. 16
6Asia Research Centre, School of Business and Governance, Murdoch University, South Street, Murdoch, 17
Western Australia 6150, Australia. 18
19
* Corresponding author: [email protected] 20
21

2
ABSTRACT 22
The partitioning of food resources among three abundant co-occurring reef-associated 23
scorpionfish, Hexagrammos agrammus, Hexagrammos otakii and Sebastes schlegelii, 24
was determined on an artificial reef zone in nearshore and offshore coastal waters of 25
northern China, using stomach content and stable isotope analyses (δ13C and δ15N). 26
The three species consumed similar prey items, mainly a variety of crustaceans, 27
teleosts, polychaetes and macroalgae, but the proportions of the items differed among 28
species. The dietary composition of all three scorpionfish differed significantly in 29
nearshore waters, but not between H. otakii and S. schlegelii in offshore waters where 30
both species fed predominantly on carideans, penaeids and brachyurans. The δ13C 31
values varied significantly among the three scorpionfish in nearshore waters, 32
suggesting that they partition food resources. No significant differences in isotopic 33
signatures were detected between H. otakii and S. schlegelii in offshore waters. 34
Bayesian mixing models further confirmed that all fish were carnivorous and that the 35
main food sources were assimilated in different proportions. In the nearshore waters, 36
resource partitioning occurs among the three scorpionfish, reducing the potential for 37
competition and the feeding ecology implies that they have dietary plasticity, which 38
facilitates local food web stability and their coexistence. 39
40
Keywords: artificial reef, competition, Hexagrammos, Sebastes, stable isotope 41
analyses, stomach contents analyses. 42
43

3
INTRODUCTION 44
The coexistence of similar fish species in the same habitat is often facilitated by the 45
partitioning of resources in different dimensions such as food, habitat and time (Pianka, 46
1973; Schoener, 1974; Ross, 1986). Of these, food partitioning is regarded as the most 47
important among temperate, and possibly also tropical marine reef fish assemblages, 48
as it reduces the potential for competition among the species within a fish assemblage 49
(Helfman, 1978; Schoener, 1983; Ross, 1986; Linke et al., 2001; Lek et al., 2011). 50
Understanding the trophic relationship or food partitioning mechanism among fishes, 51
provides insights into the interactions between species and the ability to predict 52
responses to environmental change and anthropogenic perturbations that are likely to 53
results in changes to marine food webs. 54
Artificial reefs are being used increasingly to provide habitat and enhance 55
fishery resources around the world (Clark & Edwards, 1999; Santos & Monteiro, 2007; 56
Cresson et al., 2014a), particularly in the coastal seas of China. For example, in the 57
Shandong Peninsula (northern China), ~10 million m3 of artificial reefs of various types, 58
covering 15,000 ha, had been deployed at 170 sites by 2013 (Wu et al., 2016). These 59
reefs were deployed to restore the degraded coastal environment and provide habitat 60
for the aquaculture-based enhancement of cultured juveniles of the economically 61
important sea cucumber Apostichopus japonicas and abalone Haliotis discus hannai 62
(Zhang et al., 2009). The complex and multi-cavity designed artificial reef structures 63
deployed in different marine ecosystems also provide spatial heterogeneity for reef-64
associated fish, including recreationally targeted species such as the Spottybelly 65
Greenling Hexagrammos agrammus, Fat Greenling Hexagrammos otakii and Korean 66
Rockfish Sebastes schlegelii, and thus attract and aggregate individuals of these 67
species (García-Charton et al., 2004). These three species of Scorpaeniformes 68
dominate the demersal fish community and contributed more than 80% of the wet 69
weight of the annual catch composition in long-trap net surveys in the area (Wu et al., 70
2012). Due to their abundance in coastal algal beds, and natural and artificial reefs, 71

4
these three scorpionfish are particularly important for recreational and commercial 72
fisheries in northern China, Korea and Japan (e.g., Masuda et al., 1984; Yoon, 2002; Lei, 73
2005). 74
The large-scale deployment of artificial reefs in Lidao (Fig. 1) has been assumed 75
to alleviate habitat as a constraining factor to fishery production. Instead, inadequate 76
food resources could intensify inter- and intra-specific competition and become the 77
limiting factor. Although the diets of the three species have been described previously 78
in a number of regions (Kwak et al., 2005; Seo & Hong, 2007; Tong & Guo, 2009; Zhang 79
et al., 2014; Ji et al., 2015), they have not been studied where the species occur 80
sympatrically to enable comparisons of the diet simultaneously. 81
Analysis of stomach content is widely used in dietary studies to provide a 82
“snapshot” of the recent diet of an individual, but does not reflect the sources of 83
carbon and nitrogen assimilated by a species. Such analyses also under-represent soft-84
bodied animals, which can be digested rapidly, and over-represent prey with hard 85
parts (Fry, 1988; Hobson et al., 1995; Cresson et al., 2014b). Some of these biases can 86
be overcome by using stable isotope analysis (SIA) to complement the stomach 87
content analyses as SIA provides an indication of the primary source of carbon (δ13C) 88
and their trophic level in the food web (δ15N). Stable isotope signatures integrate 89
dietary information over a longer-term period, i.e. several months for muscle tissue 90
(Peterson & Fry, 1987; Lorrain et al., 2002; Guelinckx et al., 2007) and thus provide an 91
indication of trophic flows and position in the food web over longer time scales than 92
stomach content analyses. The recent development of mixing models for stable 93
isotope data within a Bayesian framework e.g. Stable Isotope Analysis in R (SIAR), 94
allows the relative percentage contribution of potential food sources to the consumers 95
diet to be estimated quantitatively (Parnell et al., 2010). This provides a powerful tool 96
for understanding food source partitioning among these fish. 97
In the current study, the diets of three scorpionfishes, i.e. H. agrammus, 98
H. otakii and S. schlegelii were investigated using stomach content analyses, coupled 99

5
with stable isotope analyses of δ13C and δ15N, to investigate the food resource 100
partitioning among the three species, and also identify the trophic flows of C and N in 101
this system. Samples were collected at nearshore (~10 m deep and <100 m from shore) 102
and offshore sites (20-30 m deep and ~2 km from shore) in the coastal waters of the 103
Lidao artificial reef zone, in the Yellow Sea (northern China), to understand the pattern 104
differences of food partitioning between the two types of habitat. 105
106
MATERIAL AND METHODS 107
STUDY SITE 108
This study was carried out at two locations in the coastal zone of Rongcheng Bay 109
(37°13′N, 122°36′E) Yellow Sea, Shandong Peninsula, PR China (Fig. 1). The nearshore 110
site was located in the subtidal zone of the rocky shore and characterized by natural 111
rocky reef and scattered gravel, with a mean water depth of 9-11 m. The offshore site 112
is situated in deeper waters (20-30 m) about 2 km from the coast, in an area zoned for 113
floating kelp (Laminaria japonica) and scallop (Chlamys farreri) culture where intensive 114
culture is practised (Wu et al., 2016). Kelp cultivation covers an area of 5,000 ha and 115
yielded a harvest of 1,200 t wet weight km-2. The sediments of these waters are 116
characterised by their low profile and presence of a soft muddy layer, 5-15 cm deep 117
on the surface of the substratum (Tu et al., 2007). Between 2006 and 2008, more than 118
7.5 million stone reefs, with a volume of 1 million m3, 13,015 concrete reefs (650,000 119
m3) and 60 derelict vessels (4,300 m3) were deployed in the nearshore and offshore 120
waters to construct the artificial reef zone, consisting of 12 artificial reef groups (Wu 121
et al., 2016). The artificial reefs deployed at the offshore site, however, have 122
submerged some distance into the soft substratum and so do not provide the same 123
extent of habitat as similar structures in the nearshore waters (Wu, unpublished data). 124
125
COLLECTION OF BIOTA 126
Individuals of the three species of scorpionfish, i.e. H. agrammus, H. otakii and S. 127

6
schlegelii, and samples of a range of their potential food sources as well as primary 128
producers were collected in July 2013 (summer). At this time, mean water 129
temperatures and salinities were 21.5°C and 31.5, respectively. Scorpionfish were 130
collected using fish traps deployed on the benthos for about 24 h. After the traps were 131
retrieved, fish were placed in labelled plastic bags on ice, transported to the laboratory 132
and frozen (-20°C) prior to dissection. Each fish was measured (standard length in mm) 133
and weighed (wet weight in g). Approximately 2 g of dorsal white muscle was collected 134
from each fish and frozen (-20 °C) for stable isotope analyses and its stomach was 135
dissected, labelled and frozen for diet analysis. 136
In nearshore waters, food items (including the amphipods; Ampeliscidae sp., 137
Amphithoe japonica, Caprella sp., Corophium chinensis, Gammarus sp., Melita 138
palmate and Monoculodes sp., isopods; Cymodoce japonica and Synidotea 139
laevidorsalis, polychaetes; Nereididae and polychaete spp., carideans & penaeids; 140
Latreutes planirostris and Leptochela gracilis) were collected from the stomachs of the 141
three species of scorpionfish. The teleost Enedrias fangi and Brachyuran Charybdis 142
japonica were caught using fishing traps. Two species of macroalgae, Gracilaria 143
lemaeiformis and Sargassum thunbergii, and two seagrass species, Phyllospadixi 144
watensis and Zostera marina, were collected by SCUBA diving. All samples of plant 145
tissue were washed with deionized water and kept frozen until analysis. 146
In offshore waters, samples of teleosts; Enedrias fangi, Brachyurans; Charybdis 147
japonica and Carcinoplax vestita, Stomatopods; Oratosquilla oratoria, carideans & 148
penaeids; Trachypenaeus curvirostris, Palaemon gravieri, Alpheus distinguendus and 149
Alpheus japonicas, were collected from fish traps. Five macroalgal species 150
(Gracilaria lemaeiformis, Undaria pinnatifida, Grateloupia turuturu, Ulva pertusa and 151
Enteromorpha intestinalis) were collected by hand from the kelp culture facility. 152
153
STOMACH CONTENT ANALYSES 154
A total of 158 and 23 individuals of the three scorpionfishes were collected from 155

7
nearshore and offshore waters, respectively (Appendix). Prey items were identified to 156
the lowest taxonomic level possible and quantified by calculating the frequency of 157
occurrence (%F), numerical percentage (%N), and the wet weight percentage (%W) of 158
prey, using the following equations: 159
%F = Ai/Nⅹ100 160
%N = Ni/Ntotalⅹ100 161
%W = Wi/Wtotalⅹ100 162
Where Ai is the number of teleosts with prey items i in the stomach, Ni is the 163
number of prey items i in the stomach, Ntotal is the total number of items in the 164
stomach (excluding individuals with empty stomachs) and Wi is the wet weight of the 165
prey item i. Individual fragments of macroalgae and seagrass were counted to estimate 166
Ni. Note that carideans and penaeids were not separated and are treated as one 167
dietary category carideans & penaeids. 168
169
Preliminary multivariate analyses of dietary composition 170
The replicate %W data for all of the identifiable prey items, were standardised, 171
square-root transformed and used to construct a Bray-Curtis resemblance matrix. This 172
matrix was used in a preliminary analysis to determine the major sources of diet: data 173
were subjected to a 3-way crossed ANOSIM (Analysis of Similarities; Clarke and Green, 174
1988) to determine whether the diet (%W) differed among Species (3 levels; 175
H. agrammus, H. otakii and S. schlegelii), Length class (2 levels; < 150 mm TL and > 150 176
mm TL) and Site (2 levels; nearshore and offshore). The relative magnitudes of the 177
overall factors (subsuming both main and interaction effects) were assessed via the 178
universally scaled ANOSIM �̅� statistic which ranges from ~0, when the average 179
similarity among and within groups (factors) do not differ, to 1, when all samples within 180
each group are more similar to each other than to any of the samples from other 181
groups (Clarke et al., 2014a). Three-way crossed ANOSIM demonstrated that 182
significant differences were detected among Species (�̅� = 0.300; P = 0.1%) and Sites 183

8
(�̅� = 0.263; P = 0.1%), however, there was no evidence to support a Length class 184
difference (�̅� = 0.046; P = 20.4%). As a result, Length class was removed as a factor 185
from subsequent analyses. 186
As the stomachs of individual fish may contain only a small number of the 14 187
dietary categories, two samples of the same species, collected at the same time, may 188
differ markedly in their dietary composition. This variability can mask subtle, but ‘true’, 189
trends in diet and thus the stomachs of the samples for each species at each site were 190
randomly sorted into groups of 2 to 4, depending on the total number of fish in the 191
samples (Lek et al., 2011). The percentage composition of the different dietary 192
categories based on weight, for each group of replicates (i.e. 2-4 fish from the same 193
species at the same site), were averaged. The resultant data were then square-root 194
transformed to down-weight the contributions of dietary categories with consistently 195
high values and avoid any tendency for those dietary components to be excessively 196
dominant. This averaging approach overcomes any potential bias created by pooled 197
dietary data obtained from markedly unequal numbers of individual guts, i.e. a ‘species’ 198
accumulation effect (Lek et al., 2011). While, this approach did result in a slightly 199
unequal number of replicates across the species and sites, such unbalanced statistical 200
designs are able to be analysed effectively using contemporary multivariate 201
techniques such as PERMANOVA and ANOSIM (Anderson et al., 2008; Clarke & Gorley, 202
2015). 203
204
Intraspecific differences in dietary composition 205
One-way ANOSIM tests were employed to determine whether the dietary composition 206
of H. otakii and S. schlegelii differed among these sites. It was not possible to do this 207
for H. agrammus as only a single fish was caught in the offshore waters and its stomach 208
was empty. Separate Bray-Curtis resemblance matrices were constructed for each 209
species from the averaged replicates and subjected to ANOSIM. Non-metric 210
multidimensional scaling (nMDS) ordination plots were used to visually demonstrate 211

9
the differences and similarities between factors. In those cases where ANOSIM 212
detected a significant difference, Similarity Percentages analysis (SIMPER; Clarke & 213
Gorley, 2015) and shade plots (Clarke et al., 2014b) were employed to identify those 214
dietary categories that typified and distinguished the dietary composition of each a 215
priori group (SIMPER) and those dietary categories that contributed the greatest 216
proportion by weight to the difference (shade plot). 217
218
Interspecific differences in dietary composition 219
Separate one-way ANOSIM tests were employed to determine whether the 220
dietary composition differed significantly (i) among H. agrammus, H. otakii and 221
S. schlegelii in the nearshore waters and (ii) between H. otakii and S. schlegelii in the 222
offshore waters. As with the above intraspecific analyses, nMDS ordinations, SIMPER 223
and shade plots and were also employed to visualise and determine the cause of any 224
interspecific differences in dietary composition. 225
226
STABLE ISOTOPE ANALYSES 227
All samples collected were stored at -20°C in the laboratory, freeze-dried at -80°C for 228
48 h and then ground to fine, homogeneous powder with a glass mortar and pestle. 229
Fish muscle tissues were defatted in a solution of chloroform and methanol (volume 230
ratio = 2:1). To remove any inorganic carbonates of samples, 1M HCl was added slowly 231
to the sample until it stopped producing CO2. Samples were then centrifuged five times 232
at 3,000 rpm for 10 min, and the supernatant was then tested with pH paper before 233
removal. When the pH of the supernatant was close to that of deionized water, the 234
sample was freeze-dried and stored at -80°C, otherwise, samples were rinsed with 235
deionized water until they reached the pH of deionized water (Jacob et al., 2005). 236
Samples were analysed for δ13C and δ15N at the Qingdao Institute of Marine 237
Geology, using a Flash EA 1112 Elemental analyser coupled with a Thermo Finnigan 238
MAT 253 stable isotope ratio mass Spectrometers (EA-IRMS), via a Thermo Finnigan 239

10
Conflo III interface. The stable isotope ratios are expressed in delta (δ) unit notation as 240
deviations from the international standards (Vienna Pee Dee Belemnite for carbon and 241
atmospheric nitrogen for nitrogen) according to the following formula: 242
δ13C or δ15N ‰=[(Rsample/Rstandard)-1]*1000, where R = 13C/12C or 15N/14N. 243
Shapiro-Wilk tests showed that the stable isotope data were not normally 244
distributed. Consequently, non-parametric Kruskal-Wallis tests were used to test 245
whether the isotopic signatures (δ13C and δ15N) differed significantly among the three 246
scorpionfish species and the potential food sources. 247
248
Stable isotope mixing model 249
Bayesian stable isotope mixing models SIAR v4.0 (Stable Isotope Analysis in R) were 250
run in R (Parnell et al., 2010) to evaluate the relative contribution of potential food 251
sources to the diet of the three scorpionfish species in nearshore waters. Mixing 252
models consider stable isotopic values (δ13C and δ15N) of consumers, multiple 253
potential food sources, and discrimination factors with uncertainty of these values 254
within the model (Parnell et al., 2010). A total enrichment fractionation (TEF) of 1.3‰ 255
was selected for 13C, based on the results of a study by Cai et al. (1999) in Laoshan Bay, 256
which is adjacent to the Lidao Bay and contains similar nearshore rocky reefs. The TEF 257
chosen for 15N of 3.4‰ was selected from Minagawa and Wada (1984). Credibility 258
intervals (CI) of 0.95, 0.75 and 0.25 were computed and displayed on figures (Parnell 259
et al., 2010; Lebreton et al., 2012). 260
261
RESULTS 262
DIETARY COMPOSITION 263
All except one of the fish collected from offshore waters and 54% of those from the 264
nearshore areas had identifiable items in their stomachs (Appendix). The diets of the 265
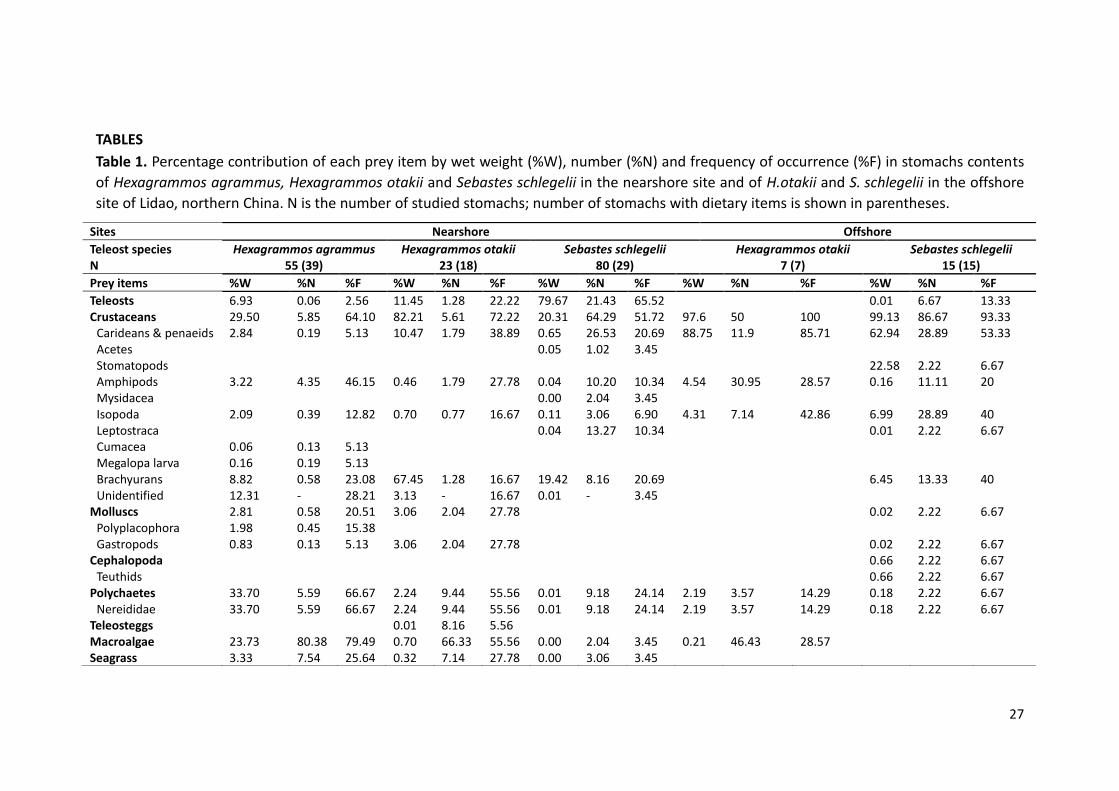
three scorpionfish were characterized by teleosts, crustaceans, molluscs, cephalopods, 266
polychaetes, teleost eggs, macroalgae and seagrass (Table 1). The quantitative diet 267

11
indices of %W, %N and %F all show that teleosts, crustaceans, polychaetes and 268
macroalgae were the dominant prey items in nearshore waters. Hexagrammos 269
agrammus and H. otakii fed on a more diverse range of prey than S. schlegelii. 270
Hexagrammos agrammus preyed principally on polychaetes, representing 33.7% of 271
diet by weight (%W) and 66.7% by frequency of occurrence (%F, Table 1). Crustaceans 272
and macroalgae were also important in the diet of H. agrammus, accounting for 29.5% 273
and 23.73% of the total prey items by weight, respectively. However, macroalgae 274
presented a higher %N (80.4%) and %F (79.4%) than crustaceans (5.85% and 64.1%, 275
respectively), due to the method of quantifying macroalgae, which was done by 276
counting the number of digested macroalgae segments. In the nearshore waters, 277
Hexagrammos otakii preyed more on crustaceans, as demonstrated by the %W (82.2%) 278
and %F of 72.2%. Brachyurans were the dominant crustaceans in the stomach contents 279
(%W = 67.45%), followed by carideans & penaeids (%W = 10.5%). Although macroalgae 280
and polychaetes were present in the stomachs of H. otaki, the %W and %F values were 281
much lower than those for H. agrammus. Teleosts, comprised the majority of the diet 282
of S. schlegelii, accounting for 79.7%, 21.4% and 65.5% for %W, %N and %F, 283
respectively, and brachyurans (F% = 20.7%). 284
The number of fish caught in offshore waters (23) was lower than in nearshore 285
waters (158) and only one H. agrammas was caught in the offshore and this individual 286
did not have items in the stomach (Appendix). In offshore waters, H. otakii and 287
S. schlegelii consumed mainly crustaceans, especially Carideans & Penaeids (88.8% 288
and 62.9% by %W, respectively), while S. schlegelii also consumed significant weights 289
of stomatopods (22.4%) and brachyurans (13.7%). The stomachs of H. otakii contained 290
some macroalgal material, which came from the cultivated kelp. 291
292
MULTIVARIATE ANALYSES OF DIET 293
Intraspecific differences in dietary composition 294
ANOSIM showed that the dietary composition of H. otakii differed significantly 295

12
between nearshore and offshore waters (P= 4.6%; R = 0.369), with samples from fish 296
in offshore waters lying to the right on the nMDS plot, and typically well separated 297
from fish in nearshore waters (Fig. 2a). Carideans & penaeids were identified by 298
SIMPER as typifying the diet of fish from offshore waters, whereas H. otakii in 299
nearshore waters consumed a more varied diet, comprising polychaetes, macroalgae, 300
brachyurans and teleosts, in addition to carideans & penaeids (Fig. 3a). 301
ANOSIM detected a significant and very strong difference between the dietary 302
composition of S. schlegelii in the nearshore and offshore waters (P= 0.1%; R = 0.935), 303
as evidenced by their complete separation on the nMDS plot (Fig. 2b). SIMPER analysis 304
indicated that teleosts typified the diet of S. schlegelii in nearshore waters, while 305
carideans & penaeids and brachyurans were found in consistently larger volumes in 306
samples from offshore waters. This is also shown on the shade plot (Fig. 3b), which 307
shows that polychaetes, made a substantial contribution to the prey consumed in 308
nearshore waters, together with brachyurans and carideans & penaeids, albeit to a 309
lesser extent than in deeper waters. 310
311
Interspecific differences in dietary composition 312
ANOSIM showed that the overall dietary composition of the three scorpionfish in 313
nearshore waters differed significantly (P = 0.1%; R = 0.579) and that each pairwise 314
comparison was also significant (P = 0.1%). The greatest difference in diet in nearshore 315
waters was between H. agrammus and S. schlegelii (R = 0.921), followed by H. otakii 316
and S. schlegelii (R = 0.447) and lastly between the two Hexagrammus species 317
(R = 0.347). These trends are illustrated on the nMDS plot where the samples 318
representing H. agrammus and S. schlegelii form a broad group that do not overlap, 319
whereas the samples for H. otakii are interspersed to some extent with samples from 320
the other two species (Fig. 4a). 321
The pattern of dietary composition among the three species exhibits a clear trend 322
along the diagonal of the shade plot with macroalgae, polychaetes and amphipods 323

13
making consistently larger contributions to the stomach contents of H. agrammus 324
(Fig. 5a). Although both macroalgae and polychaetes were consumed by H. otakii, 325
their %Ws were lower and that of carideans & penaeids and, in some cases, teleosts, 326
brachyurans and gastropods were higher than those of the other species. The diet of 327
S. schlegelii in the nearshore was the most distinct of the three species, comprising 328
mainly teleosts, with smaller contributions of brachyurans and carideans & penaeids 329
(Fig. 5a). 330
Although ANOSIM detected a significant difference in the dietary composition 331
of H. otakii and S. schlegelii in the offshore waters (P = 0.1%), the R value for this 332
difference was small (Global R = 0.238). Two of the five samples of S. schlegelii on the 333
nMDS plot lie with the group of samples representing H. otakii (Fig. 4b). Carideans & 334
penaeids dominated the diets of both species in the offshore waters, albeit to a greater 335
extent in H. otakii (Fig. 5b). 336
337
STABLE ISOTOPES ANALYSES 338
In nearshore waters, the δ13C and δ15N values of the three scorpionfish, and those of 339
their potential prey, except amphipods and isopods, differed significantly (Kruskal-340
Wallis tests; both df = 2; p = <0.001). Thus, both of these crustacean taxa were 341
combined, as one potential group of prey in the subsequent SIAR analysis. The mean 342
δ13C ratios (± 1 SD) of primary benthic producers in the nearshore waters varied from 343
-21.3 ± 0.6‰ for the red alga Gracilaria lemaeiformis to -12.3 ± 1.1‰ for seagrass 344
(Fig. 6a). The mean δ15N values ranged from 6.6 ± 0.5 ‰ for the brown alga Sargassum 345
thunbergii to 15.3 ± 0.3 ‰ for H. otakii. The stable isotope signatures of brachyurans, 346
polychaetes and carideans & penaeids were very similar and difficult to distinguish on 347
the bi-plot (Fig. 6a). 348
In offshore waters, the stable isotope signatures of H. otakii and S. schlegelii 349
did not differ significantly (df = 2; p = > 0.05, see also Table 2). However, the main 350
potential food taxa exhibited significant difference in their δ13C and δ15N ratios 351

14
(Kruskal-Wallis test, df = 9; p < 0.001). Mean δ13C ratios varied from -21.1 ± 0.6 ‰ for 352
the macroalgae G. lemaeiformis to -15.8 ± 0.4 ‰ for the teleost Enedrias fangi. The 353
mean δ15N ratios ranged from the minimum value of 8.0 ± 0.5‰ for macroalgae to 354
14.4 ± 0.1‰ for S. schlegelii (Fig. 6b). 355
356
Interspecific comparison of stable isotopes ratios 357
The stable isotope ratios of species found in both nearshore and offshore waters were 358
compared to test for spatial differences. These species included: teleosts (H. otakii, 359
S. schlegelii and E. fangi), brachyuran (C. japonica), carideans & penaeids 360
(L. planirostris and L. gracilis [nearshore] and T. curvirostris, A. distinguendus, 361
P. gravieri and A. japonicus [offshore]) and macroalgae (S. thunbergii [nearshore] and 362
G. lemaeiformis, U. pinnatifida, G. turuturu, U. pertusa and E. intestinalis [offshore]; 363
Table 2). Hexagrammus otakii and S. schlegellii had greater δ13C and δ15N values in 364
nearshore than offshore waters. However, the δ15N of the macroalgae, brachyuran C. 365
japonica and carideans & penaeids, were enriched in offshore waters. The stable 366
isotopic signatures of the teleost E. fangi did not differ significantly between nearshore 367
and offshore waters (Table 2). 368
369
Results from mixing models 370
The Bayesian stable isotope mixing models estimated that teleosts, carideans & 371
penaeids, brachyurans and polychaetes were the principal contributors to the stable 372
isotopic ratios of the three scorpionfishes in nearshore waters (Fig. 7). Carideans & 373
penaeids were the predominant prey of H. agrammus, accounting for an estimated 374
40.6% of their diet. Other important items were brachyurans (14.9%), polychaetes 375
(12.1%) and macroalgae (11.8%). Teleosts (22.9%), carideans & penaeids (23.0%), 376
brachyurans (22.0%) and polychaetes (17.5%) were also estimated to be important for 377
H. otakii. Carideans & penaeids were also identified as the most important potential 378
contributor to the C and N assimilated by Sebastes schlegelii (31.1%) followed by 379

15
brachyurans (19.6%), polychaetes and teleosts (14.8%; Fig. 7). Generally, crustaceans 380
(including carideans & penaeids and brachyurans) were estimated to be the major prey 381
for the three species of scorpionfish, contributing over 50% to the isotopic ratios for 382
each species. 383
384
DISCUSSION 385
This study investigated the potential partitioning of food resources of three species of 386
scorpionfishes in the Lidao coastal zone where extensive artificial reefs are deployed 387
and mariculture of kelp and scallops is practised in the deeper, offshore waters. The 388
combination of stomach content and stable isotopes analyses indicated the three 389
species of scorpionfish, i.e. Hexagammos agrammus, H. otakii and Sebastes schlegelii, 390
partitioned their food resources in the nearshore waters but that this was not evident 391
for H. otakii and S. schlegelii in the offshore. Thus, although all each species were 392
predominantly carnivorous, feeding on differing amounts of crustaceans (brachyurans 393
and carideans & penaeids), polychaetes, teleosts, they also fed on microalgae, albeit 394
to a lesser extent. 395
Multivariate analysis of the percentage contribution by weight of the various 396
prey categories in stomachs confirmed that they were partitioning the food resources 397
among the three species in the nearshore waters. Hexagrammos agrammus and 398
H. otakii preyed on a more diverse range of prey than S. schlegelii, which specialised 399
on telesosts in the nearshore. The first of these species fed on relatively low trophic 400
level food items like polychaetes, amphipods, polyplacophorans and macroalgae. 401
These results parallel those of previous studies on the diet of H. agrammus (Kwak et 402
al., 2005; Wang et al., 2012; Ji et al., 2015), confirming the significance of reef 403
associated benthos in its diet and that it is a benthic omnivore. In spite of the 404
occurrence of macroalgae and polychaetes in the diet of H. otakii, this species 405
consumed a much higher proportion of crustaceans (predominantly brachyurans; 406
almost 70% of diet by weight) and teleosts than H. agrammus. Similar observations 407

16
were reported in Gouqi Island (Wang et al., 2012), in the nearshore marine waters of 408
Qingdao, China (Ye, 2012), Northern Primorye, Russia (Balanov et al., 2001; Kolpakov 409
et al., 2005) and on the Jangbong tidal flat, Incheon, Korea (Seo & Hong, 2007). These 410
findings across broad geographic regions and those from the current study all confirm 411
that H.otakii is a zoobenthivore, with preference for crustacean prey. 412
The diets of the two Hexagrammos species differed in the nearshore waters 413
with H. otakii primarily preying on crustaceans and fish, while H. agrammus fed on 414
smaller-sized benthic prey such as polychaetes, macroalgae, amphipods and 415
polyplacophorans. These dietary differences reflect their differences in microhabitat 416
use that lead to differences in prey availability (Kwak et al., 2005). For example, 417
H. agrammus lives among algae growing on rock, while the co-existing H. otakii is 418
widely distributed on, or under rocks, and over sandy substratum between rocks 419
(Kanamoto, 1979). 420
The diet of Sebastes schlegelii in the nearshore contrasted with that of the two 421
species of Hexagrammos and was characterized by a higher order carnivorous diet, 422
consuming greater quantities of teleosts and large crustaceans (brachyurans and 423
carideans & penaeids). These findings are consistent with those for S. schlegelii by 424
Zhang et al. (2014) in the Bohai Sea and Seo and Hong (2007) in the Jangbong tidal flat, 425
Incheon, Korea. Despite Hexagrammos otakii and S. schlegelii feeding on similar prey, 426
the latter species consumed greater proportions of fish. Sebastes schlegelii was 427
identified as a potential keystone species in the system in an Ecopath food web model 428
of the Lidao eocsystem, indicating it had a greater impact on trophic flows in the 429
system than predicted based on its biomass alone, probably because of its 430
consumption of higher order trophic groups (Wu et al., 2016). 431
The differences of carbon isotopic ratios among the three scorpionfish in the 432
nearshore waters indicate, like the stomach content analyses, trophic niche 433
segregation among the species, which facilitates reduced competition for food 434
resources (Mablouké et al., 2013). In the nearshore waters, the δ15N values also 435

17
implied differences in trophic position of the three teleosts: with Hexagrammos 436
agrammus having a lower mean δ15N value (14.5 ‰) than H. otakii (15.3 ‰) and 437
S. schlegelii (15.0 ‰), indicating that the latter two species occupied a slightly higher 438
trophic level than H. agrammus. Stomach contents possibly explained the cause of 439
isotopic discrepancy existing between these fishes, with H. agrammus feeding 440
primarily on polychaetes and macroalgae, which tend to have lower δ15N values. In 441
contrast, H. otakii and S. schlegelii consumed mainly crustaceans and small benthic 442
fish, which had higher δ15N values. The order for trophic levels indicated by the δ15N 443
values from the current study are consistent with the estimated mean tropic levels for 444
these species documented in FishBase, which assigns a mean trophic level (± 1 SE) of 445
3.3 ± 0.5 to H. agrammus, 3.8 ± 0.3 to H. otakii and 3.7 ± 0.6 to S. schlegelii (Froese & 446
Pauly, 2014). 447
The results produced by the mixing model in SIAR complemented those of 448
stomach content analyses, with the macroalgae estimated to make a greater 449
contribution to the diet of H. agrammus than the other two species. This result is 450
consistent with the amount of macroalgae found in the stomach contents of 451
H. agrammus (23.7 % by wet weight). Although seagrass, which is enriched in 13C 452
compared to macroalgae, was also found in the stomach contents, the stable isotope 453
ratios of the fish indicated that little seagrass is being assimilated by fish. Thus, it is 454
possible that fish did not eat seagrass intentionally or that seagrass were ingested as 455
a by-product of feeding and only a small component assimilated in the tissue. Mixing 456
models results also estimated a greater contribution of crustaceans (brachyurans) and 457
teleosts to the diets of H. otakii and S. schlegelii than H. agrammus. 458
In contrast, the importance of some dietary components differed between the 459
two methods used in this study. For example, SIAR estimated that carideans & 460
penaeids were the most important prey items assimilated by H. agrammus (40.6%) in 461
nearshore waters. However, stomach contents, indicated that this species consumed 462
principally polychaetes and macroalgae. The discrepancies between stomach contents 463

18
and stable isotope analyses are due to differences in “time scales” of the data: 464
stomach contents give dietary information on “the last meal” at a more or less 465
instantaneous point in time, while stable isotope signatures result from feeding and 466
assimilation of nutrients over two to three months, i.e. not only what was ingested 467
immediately prior to capture, but also what was incorporated in the tissues after 468
ingestion and assimilation (MacNeil et al., 2006). 469
From the more limited data available for the offshore water, the dietary 470
compositions of H. otakii and S. schlegelii were more similar than in nearshore waters, 471
with both species consuming primarily carideans & penaeids, followed by brachyurans 472
and stomatopods. This is consistent with the high abundance of carideans & penaeids, 473
brachyurans and stomatopods in the benthic faunal community of the offshore (Wu 474
et al., 2012). These results from the nearshore and offshore waters confirm that H. 475
otakii and S. schlegelii are opportunistic predators. Their similarity in stomach contents 476
is consistent with the similar δ15N signatures for H. otakii and S. schlegelii in offshore 477
waters and is probably due to the relatively homogeneous environment in offshore 478
waters (i.e. low profile, soft sediments) and consequently lower numbers and diversity 479
of niches and available prey. The large production of kelp in offshore waters and its 480
dominance as a primary producer over other potential food sources, is also likely to be 481
an important factor as this simplifies the food web compared with nearshore waters. 482
An Ecosim model for the study area predicted that kelp cultivation favours benthic, 483
rather than water column production, thus the kelp culture actually supports the 484
benthic trophic flows to benthos, including the scorpionfish (Wu et al. 2016). 485
486
SPATIAL VARIATION IN STABLE ISOTOPIC RATIOS 487
The isotopic signatures of selected taxa differed significantly between the nearshore 488
and offshore waters. The δ13C signatures of fish (H. otakii and S. schlegelii), 489
brachyurans and macroalgae in nearshore waters were enriched compared with the 490
offshore waters. This gradient pattern is consistent with the results of Newsome et al 491

19
(2007). The offshore isotopic ratios of C are more depleted than those along the coast 492
indicating a greater uptake of plankton carbon in the food web than benthic sources. 493
The mean nitrogen ratios of the teleosts were 0.4 to 1.2 ‰ higher in the nearshore 494
site than the offshore, but not for macroalgae, carideans & penaeids and the 495
brachyuran Charybdis japonica, which were higher offshore. Enriched nitrogen 496
signatures in food webs may indicate greater anthropogenic inputs of nitrogen to the 497
nearshore than offshore (Costanzo et al., 2001; Lepoint et al., 2004; Michener & Lajtha, 498
2008; Dromard et al., 2013) and the uptake of nutrients by kelp in the mariculture area 499
of the offshore waters. During the early period of kelp growth (~November each year), 500
large quantities of synthetic fertilizers (i.e. Urea; δ15N= 1 to 2.6‰; Heaton, 1986) are 501
released gradually into waters to stimulate kelp growth. This practice changes the 502
concentration of dissolved inorganic nitrogen in the surround water. As a consequence, 503
enriched 15N might be assimilated into the tissue of macroalgae and phytoplankton 504
and further transferred through the food web. 505
The δ15N values for the fish in the current study were higher than those for the 506
same species in Japan (Hoshika et al., 2006), South Korea (Kang et al., 2008) and Russia 507
(Kiyashko et al., 2011), as well as Gouqi Island, in China (Table 3), particularly for 508
H. agrammus and H. otakii. For these two species, the values in the Lidao reef system 509
were ~3 ‰ higher than those recorded from the other regions. This suggests that 510
anthropogenic coastal activities have increased the δ15N values of the water and as a 511
consequence increased the 15N levels throughout the nearshore food web, as has been 512
found in other regions (Costanzo et al., 2001; Lin & Fong, 2008; Letourneur et al., 2013). 513
Carideans & penaeids and brachyurans from the offshore waters presented 514
higher δ15N values than the values for these taxa in the nearshore waters, probably 515
because of the higher δ15N of the algal detritus in the sediments, which is then 516
consumed by the zoobenthos. Indeed, the brachyuran C. japonica and carideans & 517
penaeids are known to be omnivorous in soft mud environment and to take sediment 518
organic matter as food source (Quan et al., 2010). 519

20
The more enriched carbon stable isotopic signatures of scorpionfish from 520
nearshore waters may be a result of the trophic flow through a relatively long and 521
complex food chain compared with those in offshore waters. The food web of the two 522
waters depends on a variety of carbon sources with a range of trophic pathways. In the 523
more complex nearshore environment, a number of primary producers may contribute 524
to the diets of primary consumers (Alfaro et al., 2006; Franca et al., 2011), while in the 525
offshore waters, kelp cultivation dominates the benthic primary production. 526
527
CONCLUSION 528
The present study has provided evidence of the partitioning of food resources among 529
three co-occurring scorpionfish around the artificial reef in the nearshore waters of 530
Rongcheng Bay of the northern Yellow Sea, which would reduce the potential 531
competition for resources. These carnivorous fishes predate on a similar range of prey, 532
including crustaceans, teleosts, polychaetes and macroalgae. The dietary composition 533
of these three scorpionfish in nearshore waters differs, implying that they partition 534
their resources to reduce competition. In the offshore water, the dietary data from 535
fewer individuals indicate that H. otakii and S. schlegelii had relatively narrow prey 536
options, mainly predating on carideans & penaeids and brachyurans living in the 537
muddy substrate. In the offshore, our results suggested no major differences in diet 538
between these two species which may be due to the abundance of kelp in the offshore 539
and a simplified food web. 540
541
ACKNOWLEDGEMENTS 542
The authors are grateful to the support of research grant provided by funds from the 543
national program on key basic research project (973 Program) (2015CB453302) and 544
the public science and technology research funds projects of ocean of China 545

21
(201405010). We also thank Xiaoqi Zeng, Ying Xue and Dongyan Han for the generous 546
and invaluable guidance in the identification of taxa in the stomach contents. We 547
gratefully appreciate the advice and technique assistance provided by Xingliang He and 548
Lilei Chen from Qingdao Institute of Marine Geology. Members from the lab of marine 549
stock enhancement and conservation, Ocean University of China, are thanked for their 550
help during the fieldwork. The China Scholarship Council provided financial support 551
for ZW to study at Murdoch University to develop this paper. 552
553
REFERENCES 554
Alfaro, A.C., F. Thomas, L. Sergent & M. Duxbury, 2006. Identification of trophic 555
interactions within an estuarine food web (northern New Zealand) using fatty 556
acid biomarkers and stable isotopes. Estuarine, Coastal and Shelf Science 70: 557
271-286. 558
Anderson, M.J., R.N. Gorley & K.R. Clarke, 2008. PERMANOVA+ for PRIMER: guide to 559
software and statistical methods. PRIMER-E, Plymouth, UK. 560
Balanov, A.A., A.I. Markevich, D.V. Antonenko & K.D. Crow, 2001. The first occurrence 561
of hybrids of Hexagrammos otakii x H. octogrammus and description of H. otakii 562
(Hexagrammidae) from Peter the Great Bay (the Sea of Japan). Journal of 563
Ichthyology 41: 728-738. 564
Cai, D., F. Meng, Y. Han & S. Gao, 1999. Studies on 13C/12C ratios as a tracer for food 565
web in a marine ecosystem-the trophic relations in pelagic food webs in Laoshan 566
Bay. Oceanologia Et Limnologia Sinica 30: 671-678. 567
Clark, S. & A. Edwards, 1999. An evaluation of artificial reef structures as tools for 568
marine habitat rehabilitation in the Maldives. Aquatic Conservation 9: 5-21. 569
Clarke, K.R. & R.H.Green, 1988. Statistical design and analysis for a 'biological effects' 570
study. Marine Ecology Progress Series 46: 213-226. 571
Clarke, K.R., R.N.Gorley, P.J.Somerfield & R.M.Warwick, 2014a. Change in Marine 572
Communities: an Approach to Statistical Analysis and Interpretation, 3 ed. 573

22
PRIMER-E Ltd, Plymouth, UK. 574
Clarke, K.R., J.R. Tweedley & F.J. Valesini, 2014b. Simple shade plots aid better long-575
term choices of data pre-treatment in multivariate assemblage studies. Journal 576
of the Marine Biological Association of the United Kingdom 94: 1-16. 577
Clarke, K.R. & R.N.Gorley, 2015. PRIMER v7: User Manual/Tutorial. PRIMER-E, 578
Plymouth. 579
Costanzo, S.D., M.J. O’Donohue, W.C. Dennison, N.R.Loneragan & M.Thomas, 2001. A 580
New Approach for Detecting and Mapping Sewage Impacts. Marine Pollution 581
Bulletin 42: 149-156. 582
Cresson, P., S.Ruitton & M. Harmelin-Vivien, 2014a. Artificial reefs do increase 583
secondary biomass production: mechanisms evidenced by stable isotopes. 584
Marine Ecology Progress Series 509: 15-26. 585
Cresson, P., S. Ruitton, M. Ourgaud & M. Harmelin-Vivien, 2014b. Contrasting 586
perception of fish trophic level from stomach content and stable isotope 587
analyses: a Mediterranean artificial reef experience. Journal of Experimental 588
Marine Biology and Ecology 452: 54-62. 589
Dromard, C.R., Y. Bouchon-Navaro, S. Cordonnier, M.F. Fontaine, M. Verlaque, 590
M.Harmelin-Vivien & C. Bouchon, 2013. Resource use of two damselfishes, 591
Stegastes planifrons and Stegastes adustus, on Guadeloupean reefs (Lesser 592
Antilles): Inference from stomach content and stable isotope analysis. Journal of 593
Experimental Marine Biology and Ecology 440: 116-125. 594
Franca, S., R.P. Vasconcelos, S. Tanner, C. Maguas, M.J. Costa & H.N. Cabral, 2011. 595
Assessing food web dynamics and relative importance of organic matter sources 596
for fish species in two Portuguese estuaries: a stable isotope approach. Marine 597
Environmental Research 72: 204-215. 598
Froese, R. & D. Pauly, 2014. Fishbase. World Wide Web electronic publication, 599
version(08/2014). www.fishbase.org. 600
Fry, B., 1988. Food web structure on Georges Bank from stable C, N, and S isotopic 601
compositions. Limnology & Oceanography 33: 1182-1190. 602
García-Charton, J.A., Á. Pérez-Ruzafa, P. Sánchez-Jerez, J.T. Bayle-Sempere, O. Reñones 603
& D. Moreno, 2004. Multi-scale spatial heterogeneity, habitat structure, and the 604
effect of marine reserves on Western Mediterranean rocky reef fish assemblages. 605
Marine Biology 144: 161-182. 606

23
Guelinckx, J., J. Maes, P. Van Den Driessche, B. Geysen, F. Dehairs & F. Ollevier, 2007. 607
Changes in δ13C and δ15N in different tissues of juvenile sand goby 608
Pomatoschistus minutus: a laboratory diet-switch experiment. Marine Ecology 609
Progress Series 341: 205-215. 610
Helfman, G., 1978. Patterns of community structure in fishes: summary and overview. 611
Environmental Biology of Fishes 3: 129-148. 612
Hobson, K.A., W.G. Ambrose & P.E. Renaud, 1995. Sources of primary production, 613
benthic-pelagic coupling, and trophic relationships within the Northeast Water 614
Polynya: Insights from δ13Cand δ15N analysis. Marine Ecology Progress Series 128: 615
1-10. 616
Hoshika, A., M.J. Sarker, S. Ishida, Y. Mishima & N. Takai, 2006. Food web analysis of an 617
eelgrass (Zostera marina L.) meadow and neighbouring sites in Mitsukuchi Bay 618
(Seto Inland Sea, Japan) using carbon and nitrogen stable isotope ratios. Aquatic 619
Botany 85: 191-197. 620
Jacob, U., K. Mintenbeck, T. Brey, R. Knust & K. Beyer, 2005. Stable isotope food web 621
studies: a case for standardized sample treatment. Marine Ecology Progress 622
Series 287: 251-253. 623
Ji, D., X. Bian, N. Song & T. Gao, 2015. Feeding ecology of Hexagrammos agrammus in 624
Lidao Rongcheng, China. Journal of Fishery Sciences of China(in Chinese) 22: 88-625
98. 626
Jiang, R., S. Zhang, K. Wang, X. Zhou & J. Zhao, 2014. Stable isotope analysis of the 627
offshore food web of Gouqi Island. Chinese Journal of Ecology(in Chinese) 33: 628
930-938. 629
Kanamoto, Z., 1979. On the ecology of Hexagrammid fish V: Food items of Agrammus 630
agrammus (Temminck et Schlegel) and Hexagrammos otakii Jordan et Starks 631
sampled from different habitats around a small reef. Japanese Journal of 632
Ecology(in Chinese) 29: 265-271. 633
Kang, C.K., E.J. Choy, Y. Son, J.Y. Lee, J.K. Kim, Y. Kim & K. S.Lee, 2008. Food web 634
structure of a restored macroalgal bed in the eastern Korean peninsula 635
determined by C and N stable isotope analyses. Marine Biology 153: 1181-1198. 636
Kiyashko, S.I., T.A. Velivetskaya & A.V. Ignatiev, 2011. Sulfur, carbon, and nitrogen stable 637
isotope ratios in soft tissues and trophic relationships of fish from the near-shore 638
waters of the peter the great bay in the Sea of Japan. Russian Journal of Marine 639
Biology 37: 297-302. 640

24
Kolpakov, N., E. Barabanshchikov & Y.D. Valuev, 2005. First Findings of the Fat Greenling 641
Hexagrammos otakii (Hexagrammidae) in Waters off Northern Primorye. Journal 642
of Ichthyology 45: 682-684. 643
Kwak, S., G. Baeck & D. Klumpp, 2005. Comparative feeding ecology of two sympatric 644
greenling species, Hexagrammos otakii and Hexagrammos agrammus in eelgrass 645
Zostera marina beds. Environmental Biology of Fishes 74: 129-140. 646
Lebreton, B., P. Richard, R. Galois, G. Radenac, A. Brahmia, G. Colli, M. Grouazel, C. 647
André, G. Guillou & G.F. Blanchard, 2012. Food sources used by sediment 648
meiofauna in an intertidal Zostera noltii seagrass bed: a seasonal stable isotope 649
study. MarineBiology 159: 1537-1550. 650
Lei, J., 2005. Marine fish culture theory and techniques. China Agriculture Press, Beijing. 651
Lek, E., D.V. Fairclough, M.E. Platell, K.R. Clarke, J.R. Tweedley & I.C.Potter, 2011. To 652
what extent are the dietary compositions of three abundant, co-occurring labrid 653
species different and related to latitude, habitat, body size and season? Journal 654
of Fish Biology 78: 1913-1943. 655
Lepoint, G., P. Dauby & S. Gobert, 2004. Applications of C and N stable isotopes to 656
ecological and environmental studies in seagrass ecosystems. Marine Pollution 657
Bulletin 49: 887-891. 658
Letourneur, Y., T. Lison de Loma, P. Richard, M.L. Harmelin-Vivien, P. Cresson, D. Banaru, 659
M.F. Fontaine, T. Gref & S.Planes, 2013. Identifying carbon sources and trophic 660
position of coral reef fishes using diet and stable isotope (δ15N and δ13C) analyses 661
in two contrasted bays in Moorea, French Polynesia. Coral Reefs 32: 1091-1102. 662
Lin, D.T. & P. Fong, 2008. Macroalgal bioindicators (growth, tissue N, δ15N) detect 663
nutrient enrichment from shrimp farm effluent entering Opunohu Bay, Moorea, 664
French Polynesia. Marine Pollution Bulletin 56: 245-249. 665
Linke, T., M.Platell & I. Potter, 2001. Factors influencing the partitioning of food 666
resources among six fish species in a large embayment with juxtaposing bare 667
sand and seagrass habitats. Journal of Experimental Marine Biology and Ecology 668
266: 193–217. 669
Lorrain, A., Y.M. Paulet, L. Chauvaud, N. Savoye, A. Donval & C. Saout, 2002. Differential 670
δ13C and δ15N signatures among scallop tissues: implications for ecology and 671
physiology. Journal of Experimental Marine Biology and Ecology 275: 47-61. 672
MacNeil, M.A., K.G.Drouillard & A.T. Fisk, 2006. Variable uptake and elimination of 673

25
stable nitrogen isotopes between tissues in fish. Canadian Journal of Fisheries 674
and Aquatic Sciences 63: 345-353. 675
Masuda, H., K. Amaoka, C. Arago, T. Ueno & T. Yoshino, 1984. The Fishes of the 676
Japanese Archipelago. Tokai University Press, Tokyo. 677
Michener, R. & K. Lajtha, 2008. Stable isotopes in ecology and environmental science. 678
Blackwell Publishing, Oxford, UK. 679
Minagawa, M.& E. Wada, 1984. Stepwise enrichment of 15N along food chains: further 680
evidence and the relation between δ15N and animal age. Geochimica et 681
Cosmochimica Acta 48: 1135-1140. 682
Newsome, S.D., C.M. del, Rio, S. Bearhop & D.L.Phillips, 2007. A niche for isotopic 683
ecology. Frontiers in Ecology and the Environment 5: 429–436. 684
Parnell, A.C., R. Inger, S. Bearhop & A.L. Jackson, 2010. Source partitioning using stable 685
isotopes: coping with too much variation. Plos One 5: e9672. 686
Peterson, B.J.& B. Fry, 1987. Stable isotopes in ecosystem studies. Annual review of 687
ecology and systematics 18: 293-320. 688
Pianka, E.R., 1973. The structure of lizard communities. Annual review of ecology and 689
systematics 4: 53-74. 690
Quan, W., L. Shi & Y. Chen, 2010. Stable isotopes in aquatic food web of an artificial 691
lagoon in the Hangzhou Bay, China. Chinese Journal of Oceanology and 692
Limnology 28: 489-497. 693
Ross, S.T., 1986. Resource partitioning in fish assemblages: a review of field studies. 694
Copeia, 1986: 352-388. 695
Santos, M.N. & C.C.Monteiro, 2007. A fourteen-year overview of the fish assemblages 696
and yield of the two oldest Algarve artificial reefs (southern Portugal). 697
Hydrobiologia 580: 225-231. 698
Schoener, T.W., 1974. Resource partitioning in ecological communities. Science 185: 699
27-39. 700
Schoener, T.W., 1983. Field experiments on interspecific competition. American 701
Naturalist 122: 240-285. 702
Seo, I.S. & J.S. Hong, 2007. Comparative Feeding Ecology of Sympatric Greenling 703

26
Hexagrammos otakii and Schlegel's Black Rockfish Sebastes schlegeli in the 704
Jnngbong Tidal Flat, Incheon, Korea. Korean Journal of Fisheries and Aquatic 705
Sciences(in Korean) 40: 84-94. 706
Tong, Y. & X. Guo, 2009. Feeding competition between two rockfish Sebastes schlegeli 707
and Hexagrammos otakii. Journal of Fishery Sciences of China(in Chinese) 16, 708
541-549. 709
Tu, Z., X. Zhang, P. Zhang & T. Gao, 2007. Artificial fish reef near Lidao Island in 710
Rongcheng—early assessment on resource and environment in sea area for 711
artificial fish reef. Marine Fisheries Information 22: 1-7. 712
Wang, K., S. Zhang, Z. Wang, J. Zhao, M. Xu & J. Xu, 2012. Dietary composition and food 713
competition of six main fish species in rocky reef habitat off Gouqi Island Chinese 714
Journal of Applied Ecology(in Chinese) 23: 536-544. 715
Wu, Z., L. Zhang, X. Zhang, P. Zhang & W. Li, 2012. Nekton community structure and its 716
relationship with the main enviornmental variables in Lidao artificial reef zones 717
of Rongcheng. Acta Ecologica Sinica(in Chinese) 32: 6737-6746. 718
Wu, Z., X. Zhang, H.M.Lozano & N.R. Loneragan, 2016. Trophic flows, kelp culture and 719
fisheries in the marine ecosystem of an artificial reef zone in the Yellow Sea. 720
Estuarine, Coastal and Shelf Science S 182: 86-97. 721
Yoon, C.H. 2002. Fishes of Korea with Pictorial Key and Systematic List. Academy 722
Publishing Company. Seoul. 723
Zhang, B., Z. Li & X. Jin, 2014. Food composition and prey selectivity of Sebastes 724
schlegeli. Journal of Fishery Sciences of China(in Chinese) 21: 134-141. 725
Zhang, X., X. Wang, Z. Tu, P. Zhang, Y. Wang, T. Wang & X. Wang, 2009. Current status 726
and prospect of fisheries resource enhancement in Shandong Province. China 727
Fisheries Economics(in Chinese) 2: 51-58. 728
729
730
27
TABLES
Table 1. Percentage contribution of each prey item by wet weight (%W), number (%N) and frequency of occurrence (%F) in stomachs contents
of Hexagrammos agrammus, Hexagrammos otakii and Sebastes schlegelii in the nearshore site and of H.otakii and S. schlegelii in the offshore
site of Lidao, northern China. N is the number of studied stomachs; number of stomachs with dietary items is shown in parentheses.
Sites Nearshore Offshore
Teleost species Hexagrammos agrammus Hexagrammos otakii Sebastes schlegelii Hexagrammos otakii Sebastes schlegelii N 55 (39) 23 (18) 80 (29) 7 (7) 15 (15)
Prey items %W %N %F %W %N %F %W %N %F %W %N %F %W %N %F
Teleosts 6.93 0.06 2.56 11.45 1.28 22.22 79.67 21.43 65.52 0.01 6.67 13.33 Crustaceans 29.50 5.85 64.10 82.21 5.61 72.22 20.31 64.29 51.72 97.6 50 100 99.13 86.67 93.33
Carideans & penaeids 2.84 0.19 5.13 10.47 1.79 38.89 0.65 26.53 20.69 88.75 11.9 85.71 62.94 28.89 53.33 Acetes 0.05 1.02 3.45 Stomatopods 22.58 2.22 6.67 Amphipods 3.22 4.35 46.15 0.46 1.79 27.78 0.04 10.20 10.34 4.54 30.95 28.57 0.16 11.11 20 Mysidacea 0.00 2.04 3.45 Isopoda 2.09 0.39 12.82 0.70 0.77 16.67 0.11 3.06 6.90 4.31 7.14 42.86 6.99 28.89 40 Leptostraca 0.04 13.27 10.34 0.01 2.22 6.67 Cumacea 0.06 0.13 5.13 Megalopa larva 0.16 0.19 5.13 Brachyurans 8.82 0.58 23.08 67.45 1.28 16.67 19.42 8.16 20.69 6.45 13.33 40 Unidentified 12.31 - 28.21 3.13 - 16.67 0.01 - 3.45
Molluscs 2.81 0.58 20.51 3.06 2.04 27.78 0.02 2.22 6.67 Polyplacophora 1.98 0.45 15.38 Gastropods 0.83 0.13 5.13 3.06 2.04 27.78 0.02 2.22 6.67
Cephalopoda 0.66 2.22 6.67 Teuthids 0.66 2.22 6.67
Polychaetes 33.70 5.59 66.67 2.24 9.44 55.56 0.01 9.18 24.14 2.19 3.57 14.29 0.18 2.22 6.67 Nereididae 33.70 5.59 66.67 2.24 9.44 55.56 0.01 9.18 24.14 2.19 3.57 14.29 0.18 2.22 6.67
Teleosteggs 0.01 8.16 5.56 Macroalgae 23.73 80.38 79.49 0.70 66.33 55.56 0.00 2.04 3.45 0.21 46.43 28.57 Seagrass 3.33 7.54 25.64 0.32 7.14 27.78 0.00 3.06 3.45

28
Table 2. Mean stable isotope values for δ13C and δ15N (± 1 SE) for the three species of scorpionfish, their potential prey and primary producers. Significance values (P) of Kruskal-Wallis tests between nearshore (N) and offshore (O) values are shown for each group. P values < 0.05 are in bold. Macroalgae comparisons were conducted between Sargassum thunbergii (nearshore) and all macroalgae (offshore). Numbers in brackets indicate the number of individuals used for the tests.
Species Isotope Mean value (± 1 SE) P
Nearshore Offshore
Teleosts
Hexagrammos agrammus δ13C -17.03 ± 0.58 (14) -16.38 (1) 0.280
δ15N 14.47 ± 0.50 (14) 14.18 (1) 0.510
Hexagrammos otakii δ13C -15.99 ± 0.49 (11) -16.64 ± 0.16 (8) < 0.001
δ15N 15.31 ± 0.30 (11) 14.11 ± 0.49 (8) < 0.001
Sebastes schlegelii δ13C -16.71 ± 0.54 (9) -18.03 ± 0.16 (2) 0.006
δ15N 14.98 ± 0.59 (9) 14.44 ± 0.07 (2) 0.006
Enedrias fangi δ13C -16.38 ± 1.14 (2) -15.82 ± 0.92 (6) 0.510
δ15N 13.96 ± 0.59 (2) 13.90 ± 0.40 (6) 0.740
Invertebrates
Charybdis japonica δ13C -17.17 ± 0.94 (8) -18.31 ± 0.58 (9) 0.009
δ15N 13.18 ± 0.37 (8) 13.69 ± 0.28 (9) 0.006
Carideans & penaeids δ13C -18.81 ± 0.01 (2) -18.20 ± 0.34 (29) 0.030
δ15N 12.05 ± 0.23 (2) 13.13 ± 0.71 (29) 0.030
Primary producers
Macroalgae δ13C -18.33 ± 0.72 (5) -18.99 ± 1.50 (22) 0.007
δ15N 6.56 ± 0.47 (5) 8.22 ± 0.54 (22) 0.006

29
Table 3. Comparison of mean δ15N (± SE) for the three species of scorpionfish from the present study with those from other studies in the East China Sea, Japan, Korea and Russia. Values are ranked from highest to lowest δ15N value. — = no length range specified.
Species and Length(mm) Rank δ15N Habitat type Location References
Hexagrammos agrammus 88-186 1 14.47 ± 0.50 Rocky reef Yellow Sea This study — 2 14.2 Mud substrate Yellow Sea This study — 3 11.6 ± 0.6 Natural macroalgae bed East coast of Korea Kang et al,2008 — 4 10.8 ± 0.2 Barren ground East coast of Korea Kang et al,2008 — 5 10.8 ± 0.4 Restored macroalgae bed East coast of Korea Kang et al,2008
— 6 8.4±1.0 Natural macroalgae bed Gouqi Island, East China Sea Jiang,2015
Hexagrammos otakii 97-196 1 15.3 ± 0.30 Rocky reef Yellow Sea This study 135-169 2 14.1 ± 0.49 Mud substrate Yellow Sea This study — 3 11.6 ± 0.4 Restored macroalgae bed East coast of Korea Kang et al,2008 — 4 11.3 ± 0.9 Natural macroalgae bed East coast of Korea Kang et al,2008 — 5 10.6 ± 0.4 Barren ground East coast of Korea Kang et al,2008
— 6 7.5±0.4 Natural macroalgae bed Gouqi Island, East China Sea Jiang,2014
Sebastes schlegelii
63-174 1 15.0 ± 0.59 Rocky reef Yellow Sea This study
138–178 2 14.5±0.4 Seagrass bed Mitsukuchi Bay, Seto Inland Sea Akira Hoshika et al,2007
102-166 3 14.4 ± 0.07 Mud substrate Yellow Sea This study
135–146 4 13.4±0.4 Seagrass bed Mitsukuchi Bay, Seto Inland Sea Akira Hoshika et al,2006
— 5 12.6 ± 0.3 Unknown Peter the Great Bay, Sea of Japan Kiyashko,2011
— 6 12.3 ± 0.7 Natural macroalgae bed East coast of Korea Kang et al,2008
— 7 11.5 ± 0.1 Barren ground East coast of Korea Kang et al,2008
— 8 11.3 ± 0.6 Restored macroalgae bed East coast of Korea Kang et al,2008

30
FIGURES
Fig. 1. Map showing the location of (a) Shandong Peninsula in China and (b) the nearshore and offshore sampling sites in Rongcheng Bay, in the Yellow Sea.

31
Fig. 2. nMDS ordination plots, derived from Bray-Curtis resemblances matrices constructed from percentage volumetric contributions by wet weight (%W) of each prey category to the stomach contents of (a) Hexagrammos otakii and (b) Sebastes schlegelii caught in nearshore () and offshore waters () of Lidao, northern China.

32
Fig. 3.Shade plots, showing, by depth of shading, the mean percentage volumetric contributions by wet weight (%W) of each prey category to the stomach contents of (a)Hexagrammos otakii and (b) Sebastes schlegelii caught in nearshore () and offshore waters () of Lidao, northern China.

33
Fig. 4.nMDS ordination plots, derived from Bray-Curtis resemblances matrices constructed from percentage contributions by wet weight (%W) of each prey category to the stomach contents of Hexagrammos agrammus() Hexagrammos otakii () and Sebastes schlegelii() caught in (a)nearshore and (b) offshore waters of Lidao, northern China.

34
Fig. 5.Shade plots, showing, by depth of shading, the mean percentage contributions by wet weight (%W) of each prey category to the stomach contents of Hexagrammos agrammus () Hexagrammos otakii () and Sebastes schlegelii () caught in (a) nearshore and (b) offshore waters of Lidao, northern China.

35
Fig. 6. Bi-plot showing the mean δ13C and δ15N values (± 1 SD) of the three Hexagrammos agrammos, H. otakii and Sebastes schlegelii and their potential food sources collected in the (a) nearshore and (b) offshore waters of Lidao, northern China. Potential food sources were: Brachyurans(Charybdis japonica), Carideans & penaeids (Latreutes planirostris and Leptochela gracilis), polychaetes (Nereididae and Polychaete spp.), amphipods (Ampeliscidae sp., Amphithoe japonica, Caprella sp., Corophium chinensi, Gammarus sp., Melita palmate and Monoculodes sp.), isopods (Cymodoce japonica and Synidotea laevidorsalis), seagrass (Phyllospadix iwatensis and Zostera marina) and macroalgae (Undaria pinnatifida, Grateloupia turuturu, Ulva pertusa and Enteromorpha stinalis).

36
Fig. 7. Mean contribution of potential food sources (%) to the diet of Hexagrammos otakii, H. agrammus and Sebastes schlegelii, calculated with Bayesian mixing models in SIAR (with a credibility interval of 50%, 75% and 95%, respectively) at the nearshore site. Sgrass = seagrass, Malgae = macroalgae, Amphi&Iso = amphipods & isopods, Polych = polychaetes, Cari&Pena = carideans & penaeids and Brach = brachyurans.

37
Appendix. Total number of stomachs examined (N), mean standard length (mm) and mean wet weight (g) of the three scorpionfish species collected in the nearshore and offshore waters of Lidao, northern China. The number of stomachs with dietary items, and range of lengths and weights are in parentheses.
Species Site N Length (mm) Wet weight (g)
Hexagrammos agrammus Nearshore 55 (39) 133 (88-178) 56 (14-135)
Offshore 1 (0) 186 159
Hexagrammos otakii Nearshore 23 (18) 129 (97-196) 47 (17-159)
Offshore 7 (7) 155 (135-169) 81 (52-109)
Sebastes schlegelii Nearshore 80 (29) 131(63-174) 69 (6.5-162)
Offshore 15 (15) 132 (102-166) 79 (34-146)
Total Nearshore 158 (86)
Offshore 23 (22)